The CNS connectome of a tadpole larva of Ciona intestinalis (L.) highlights sidedness in the brain of a chordate sibling
- Dalhousie University, Canada
Figures
Figure 1 with 1 supplement
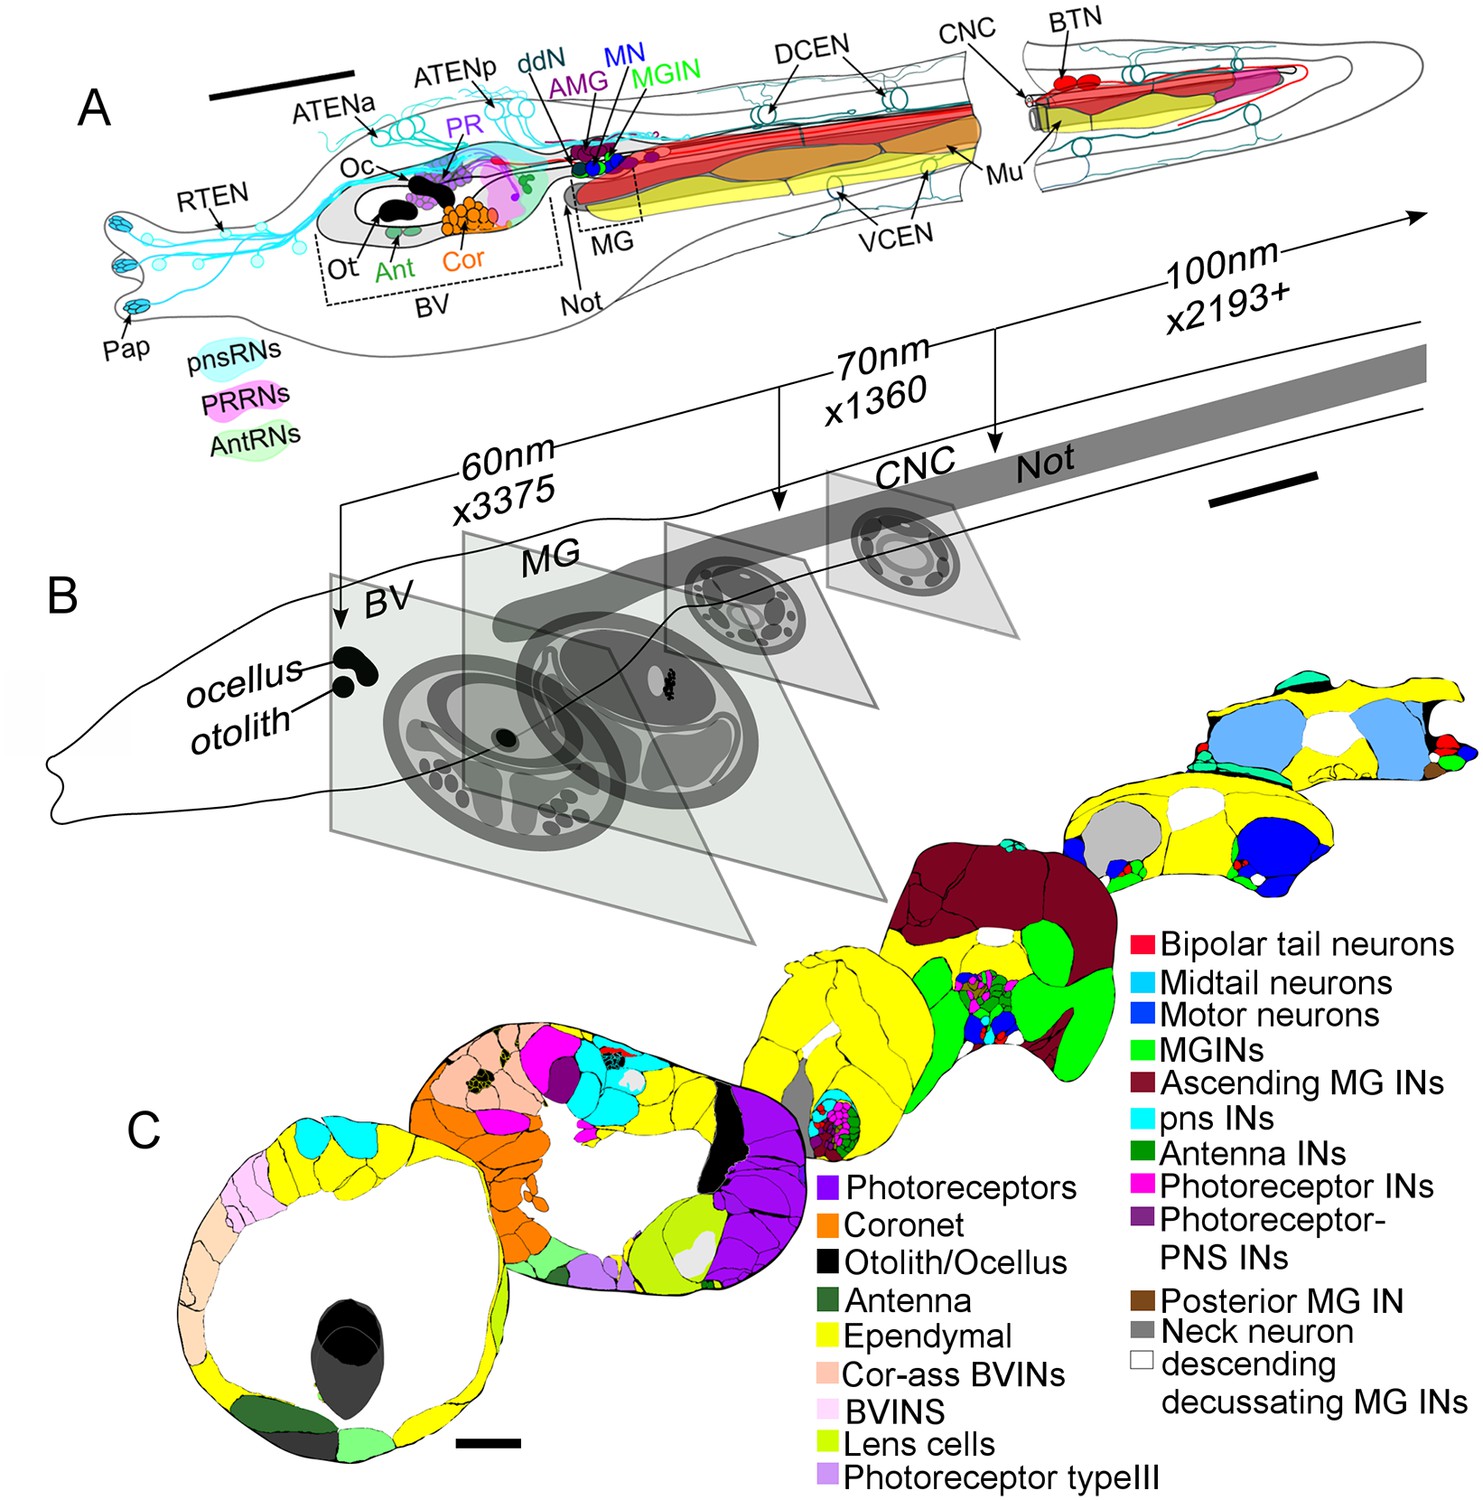
Ultrathin section series of Ciona intestinalis larva, its CNS and notochord.
(A) Diagram of whole larva with colour-coded cell types indicated by arrows. Types of relay neurons (RNs) are shown as colour-coded territories in the brain vesicle. Muscle cells align in dorsal (red), medial (orange), and ventral (yellow) tiers. (B) Larva from left side, illustrating major landmarks and indicating the number of sections of each thickness (60–100 nm) along the A-P axis. Diagrammatic profiles of representative sections at different levels along the A-P axis of the larva, shown to the same magnification. (C) Profile traces from Reconstruct of representative sections at six levels of the CNS. Nuclei are shown as small squares. Coloured cell types are shown in the key (Figure 1—source data 1). For labelled cell outlines of the sections see enlarged views in Figure 1—figure supplement 1. Abbreviations: Pap: papilla neuron: RTEN: rostral trunk epidermal neurons; ATENa: anterior apical trunk epidermal neurons; ATENp: posterior apical trunk epidermal neurons; Oc: ocellus; Ot: otolith; Ant: antenna neuron; Cor: coronet cell; PR: photoreceptor; ddN: descending decussating neuron; AMG/Ascending MG IN: ascending motor ganglion interneuron: MGIN: motor ganglion interneuron; MN: motor neuron; DCEN: dorsal caudal epidermal neuron; VCEN: ventral caudal epidermal neuron; BTN: bipolar tail neuron; Mu: muscle; pnsRNs: PNS relay neurons; PRRNs: photoreceptor relay neurons; AntRNs: antenna relay neurons; BV: brain vesicle; MG: motor ganglion; CNC: caudal nerve cord; Not: notochord; IN: interneuron; BVINs: brain vesicle interneurons. For descriptions and abbreviations of cell types also see key in Figure 1—source data 1 Scale bars in all panels: 10 µm.
-
Figure 1—source data 1
Cell types: key to their characteristics and abbreviations used.
Includes colour key, defining features, subtypes, the numbers of neurons of each type, and a list of neurons of each type. Cells in bold correspond to bolded characteristics or subtypes.
- https://doi.org/10.7554/eLife.16962.005
Figure 1—figure supplement 1
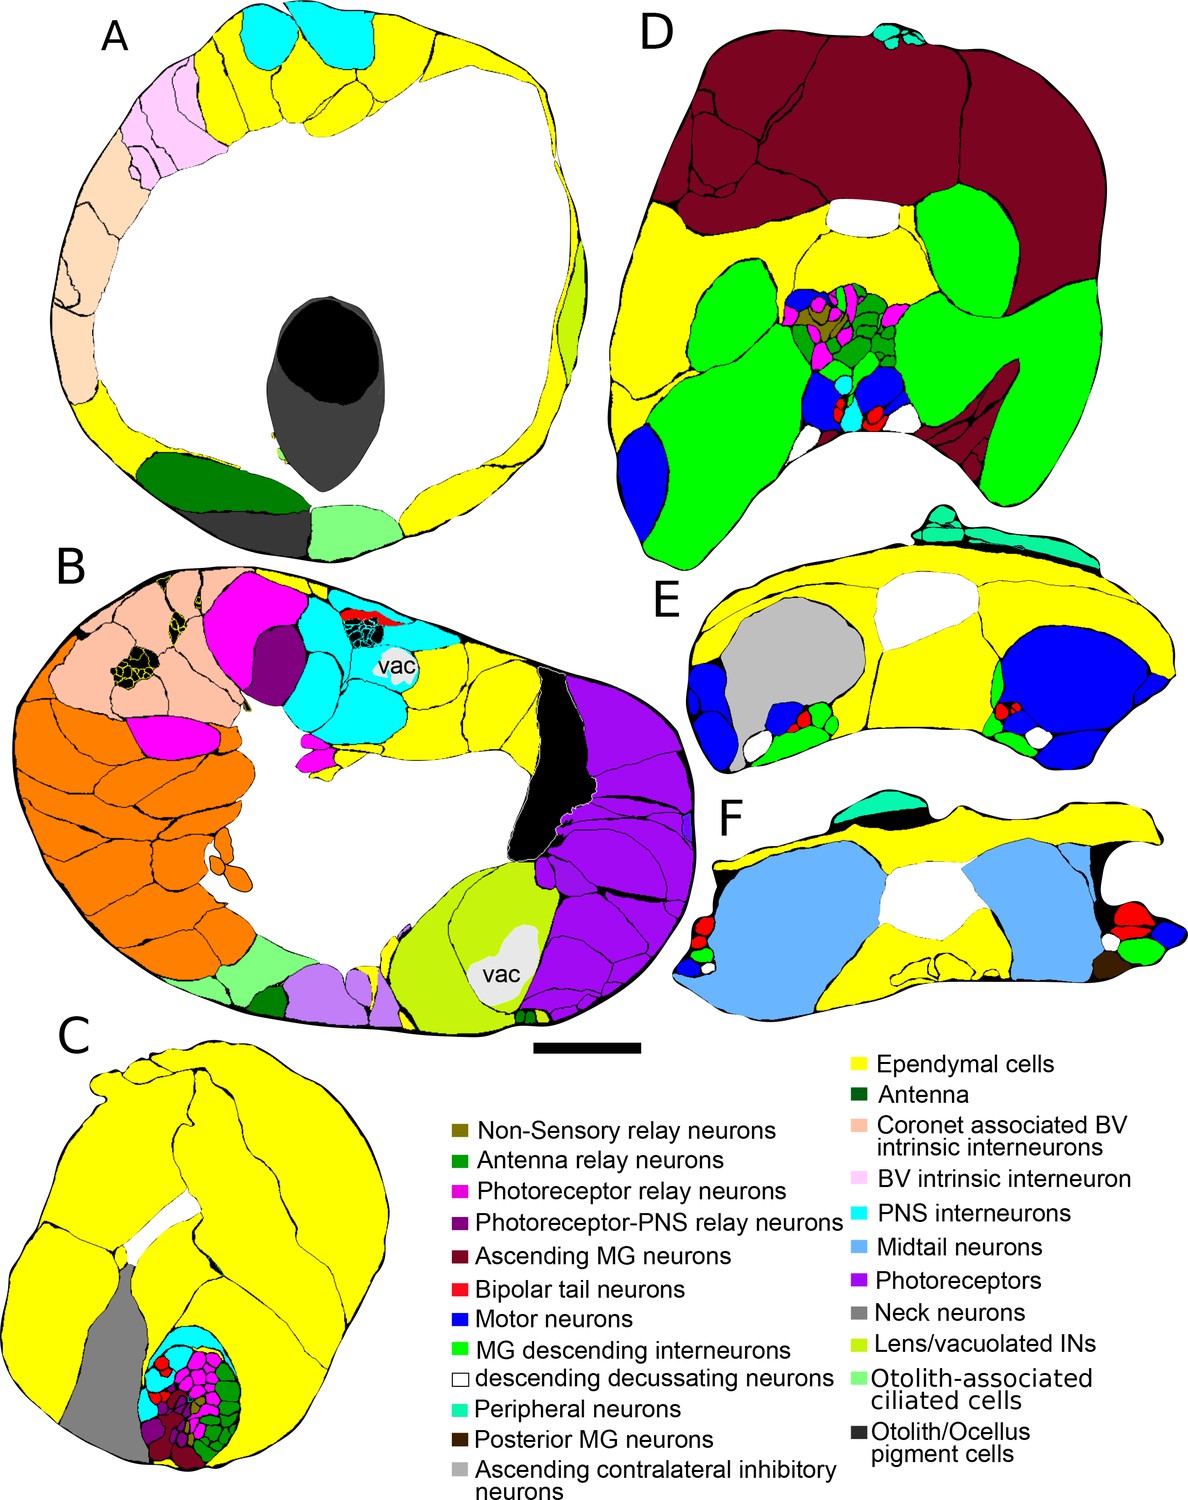
Enlarged representative sections with labeled profiles from Figure 1B.
Sections presented for anterior brain vesicle (A), neck (B), anterior motor ganglion (C), posterior motor ganglion (D), and the caudal nerve cord (E), with profiles colour-coded by cell type (key) and neural canal in white. Brain vesicle interneuron axons (panel B) are filled in black. Dorsal is to the top.
Figure 2
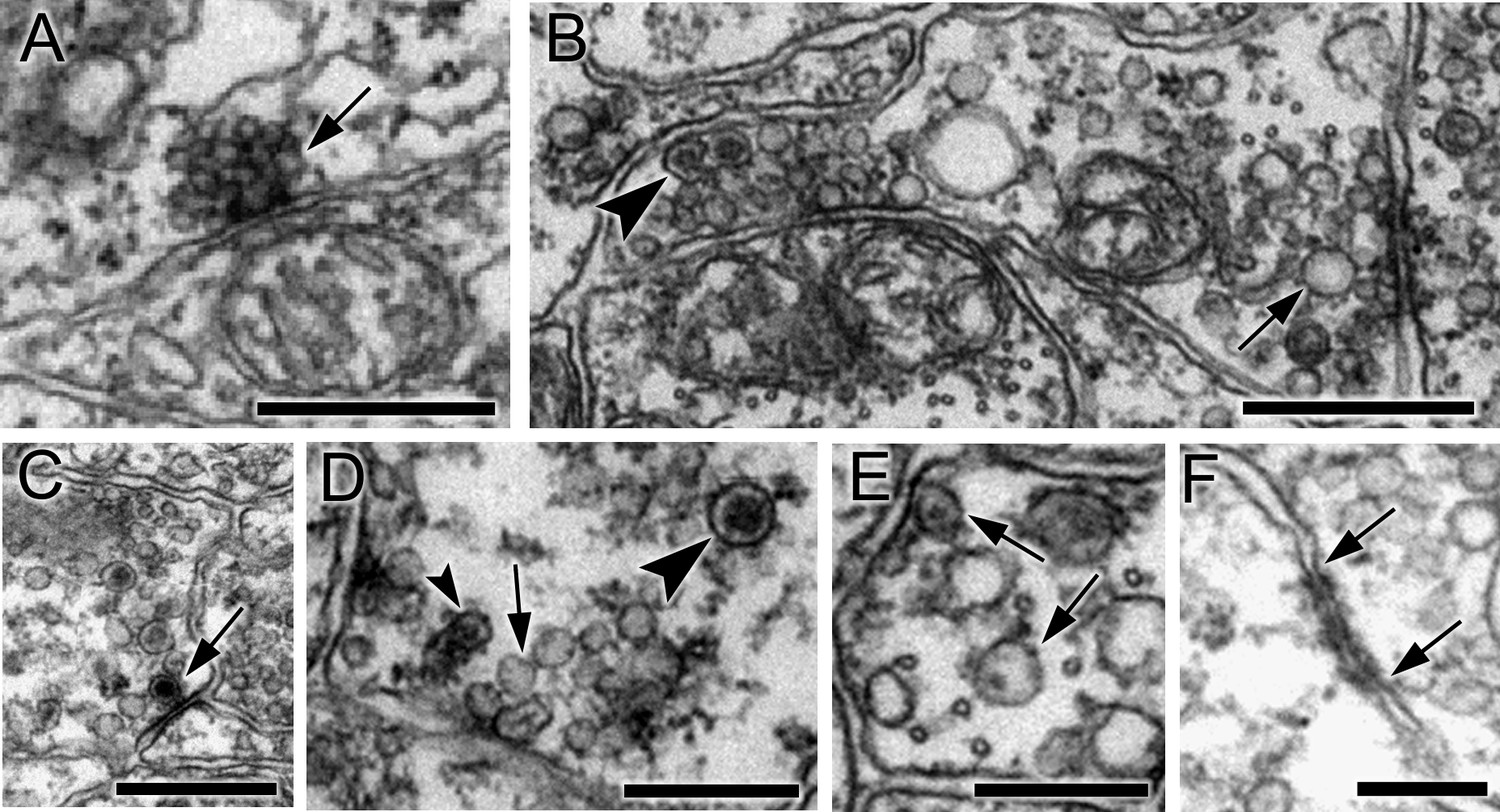
Synapses contain presynaptic vesicles of various sizes and types.
(A) Tightly packed cumulus of small (30–40 nm) vesicles at a single presynaptic site (arrow). (B) Mixed populations of small (30–50 nm) and large (70–110 nm) electron-lucent vesicles (arrow) as well as dense-core vesicles of medium size (arrowhead). (C) Large (100–110 nm) vesicles with dark cores (arrowheads). (D) Synapses containing electron-lucent vesicles (30–60 nm; arrow) as well as small (60 nm; small arrowhead) and medium (80 nm; large arrowhead) dense-core vesicles. See Figure 2—source data 1 for a list of those neurons with synapses having mixed vesicle populations. (E) Medium dense-core vesicles with small cores (arrows). (F) Membrane apposition (between arrows) interpreted as a gap junction, with membrane densities on both sides. Scale bars: 500 nm (A,B,C and E); 200 nm (D and F).
-
Figure 2—source data 1
Neurons with synapses having mixed electron-lucent and dense-core vesicle populations (mixed), or exclusively dense-core vesicle (dcv) populations, with numbers (No.) of synapses of each type, and totals of both dcv and mixed vesicle synapses.
- https://doi.org/10.7554/eLife.16962.008
Figure 3 with 2 supplements
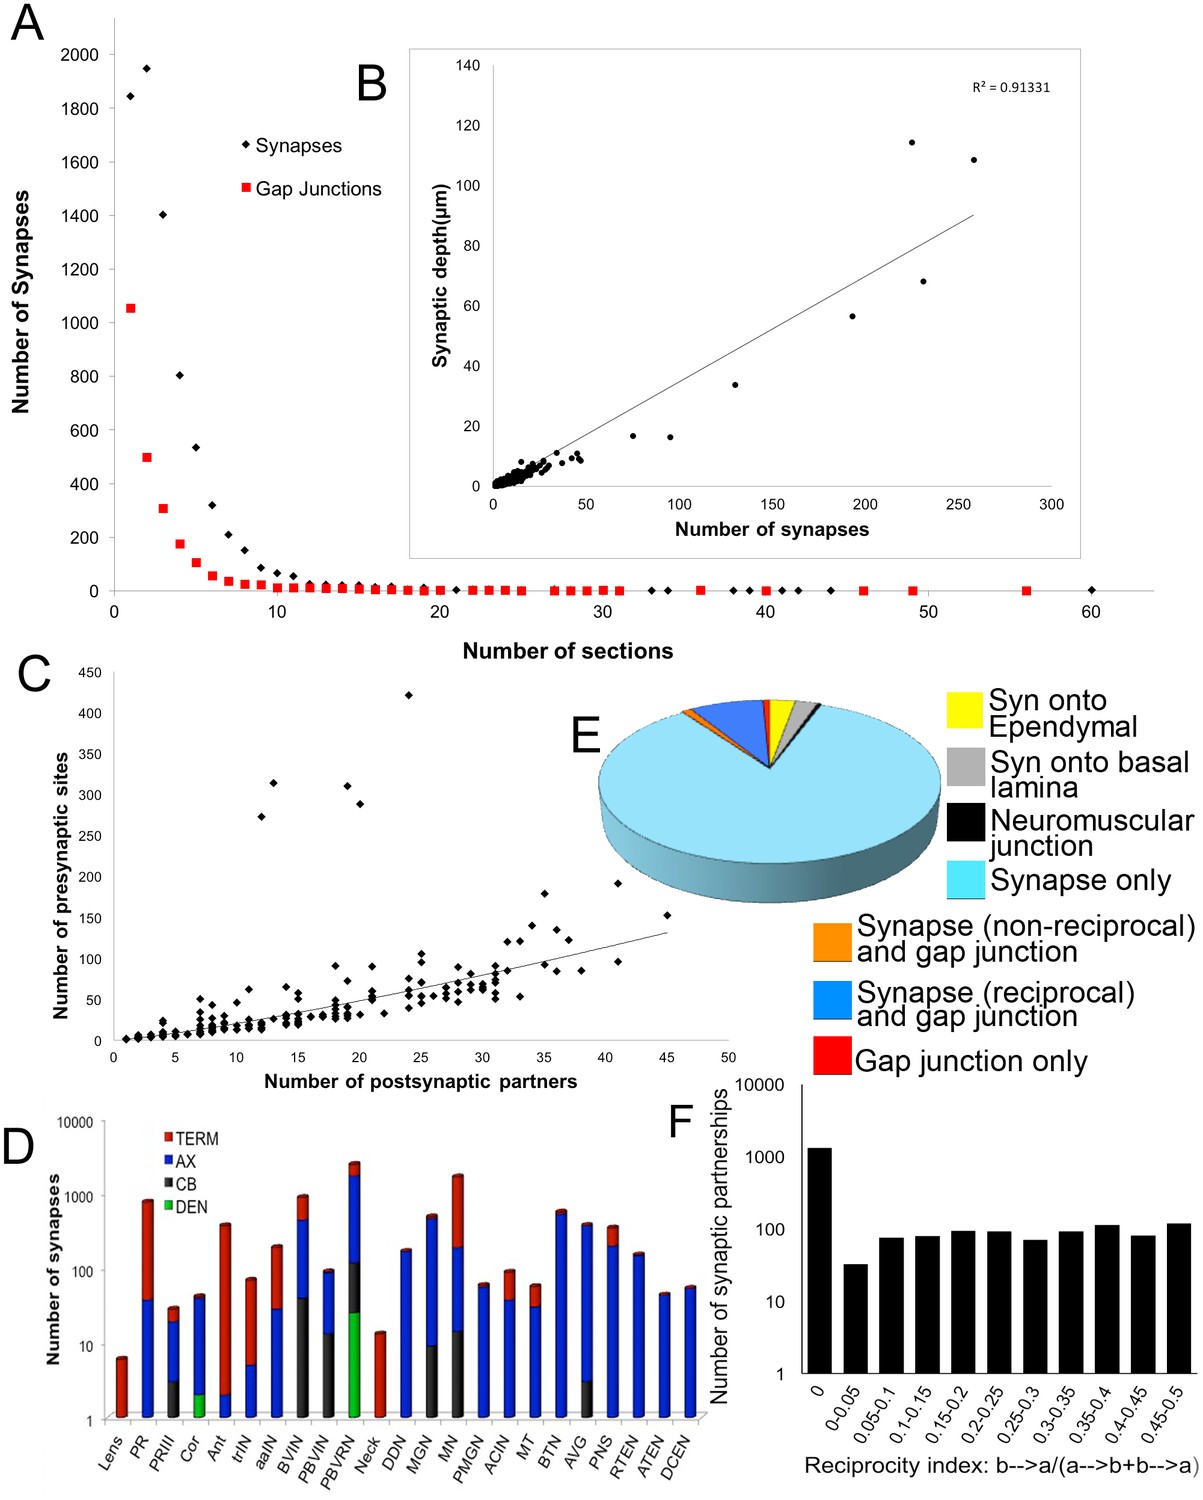
Synapse numbers (presynaptic sites) and sizes for all neurons (for complete list see Figure 3—source data 1).
(A) Most synaptic contacts extend over <10 60 nm sections. Those occupying >10 sections are neuromuscular junctions, inputs from relay neurons to MG neurons, and synapses from antenna cells. The frequency curve for chemical synapses reveals more large contacts than for gap junctions. (B) Plotted for all neurons, the total depth of presynaptic contact co-varies linearly with the total number of synapses (R2 = 0.91). Removing single-profile synapses eliminates 18% of all synaptic partnerships, and removing all 2-profile synapses would have eliminated a total of 35% of all synaptic partnerships. (C) The number of presynaptic sites co-varies with the number of postsynaptic partners according to a power function (R2 = 0.81). The number of synaptic partners is also referred to as the network statistic ‘degree’, and is mapped to the synaptic network (Figure 3—figure supplement 2). Five neurons lie well above the curve, having low degrees, with many synapses and few postsynaptic partners. These are: Antenna neuron 1 (Ant1) with many synapses onto seven relay neurons, and the two pairs of anterior-most motor neurons (MN1 and MN2) with many synapses onto muscle. (D) Cumulative distribution of the log number of presynaptic sites over the surfaces of neurons of major cell classes. TERM: terminal; AX: axon; CB: cell body; DEN: dendrite. Most synapses are located over axons and terminals (see Figure 3—figure supplement 1 for (D) averages per neuron and (E) postsynaptic site distribution). (E) Proportions of synapses and gap junctions in the connectome formed for particular partnerships. (F) Reciprocity of connections in the network given as the proportion of neuron partners that are reciprocally connected and the extent of their reciprocity (calculated as the cumulative depth of contacts in one direction divided by the sum of the depth of all contacts between the neuron pair). The total proportion of reciprocal synaptic connections between neuron pairs is 0.39.
-
Figure 3—source data 1
Summary of all neurons in the larval CNS of Ciona intestinalis.
Neurons listed by ID, with cell type, morphological features, location, presence or absence of cilia, and number of each neuron’s pre- and postsynaptic sites or putative gap junctions (>0.06 µm). Ependymal cells excluded. The final column shows left lateral views of individual neuron reconstructions (whole cells, or terminals for photoreceptors) as small thumbnails with scale bars: 1 µm (thick bars: coronet cells, lens cells, photoreceptor terminals and PR-III cells, vacINs); 10 µm (thin bars: all other cells).
- https://doi.org/10.7554/eLife.16962.010
Figure 3—figure supplement 1
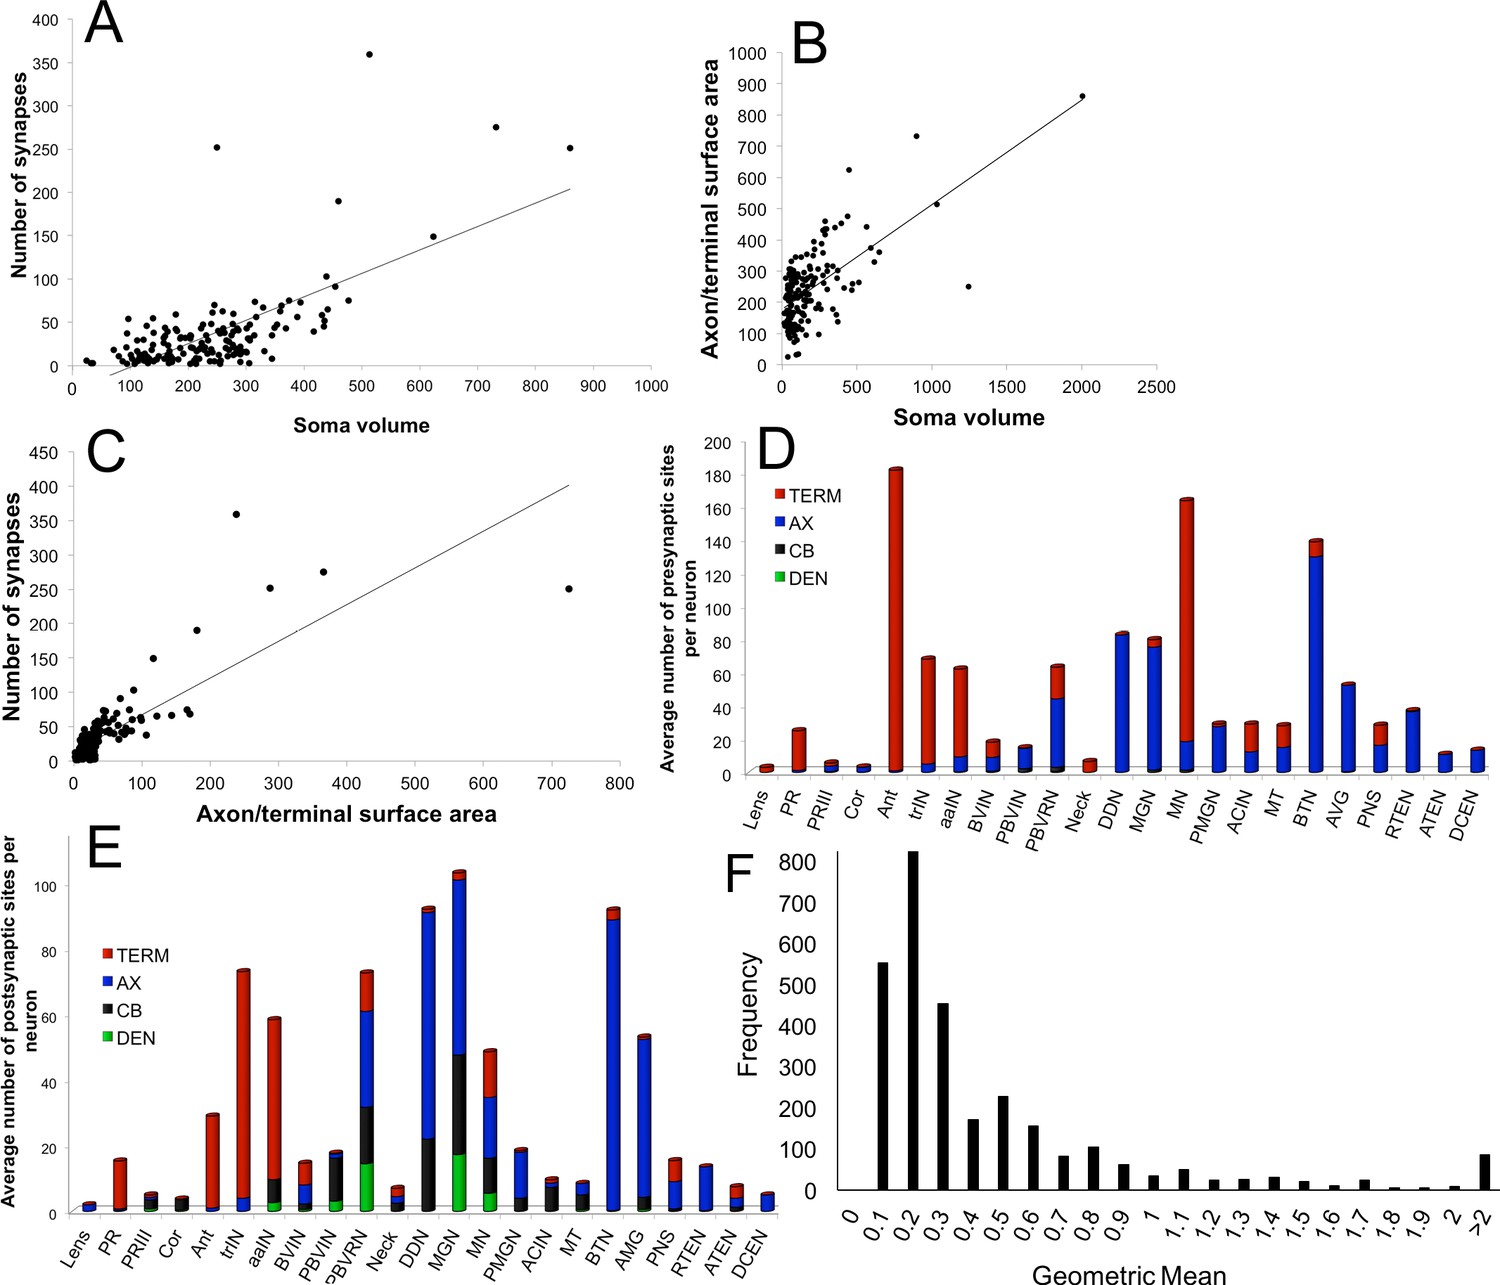
Relationships between the morphology and synaptic output of larval CNS neurons.
(A) Number of synapses is not correlated with soma volume (μm3) (r2 = 0.4). (B) Soma volume does not correlate with the combined surface area of its axon and terminal regions (μm2) (r2 = 0.4). (C) Axon and terminal surface area is linearly related to the number of presynaptic sites, but the correlation is not strong (r2 = 0.7). (D, E) Distribution of synaptic sites for major neuron types presented as an average number of synapses per neuron per region of the cell for presynaptic sites (D) and postsynaptic sites (E). (F) Frequency distribution of the geometric means of cumulative synaptic depth in each direction for all neuron pairs. Values >2 follow the tailed distribution up to a maximum geometric mean of 17.
Figure 3—figure supplement 2
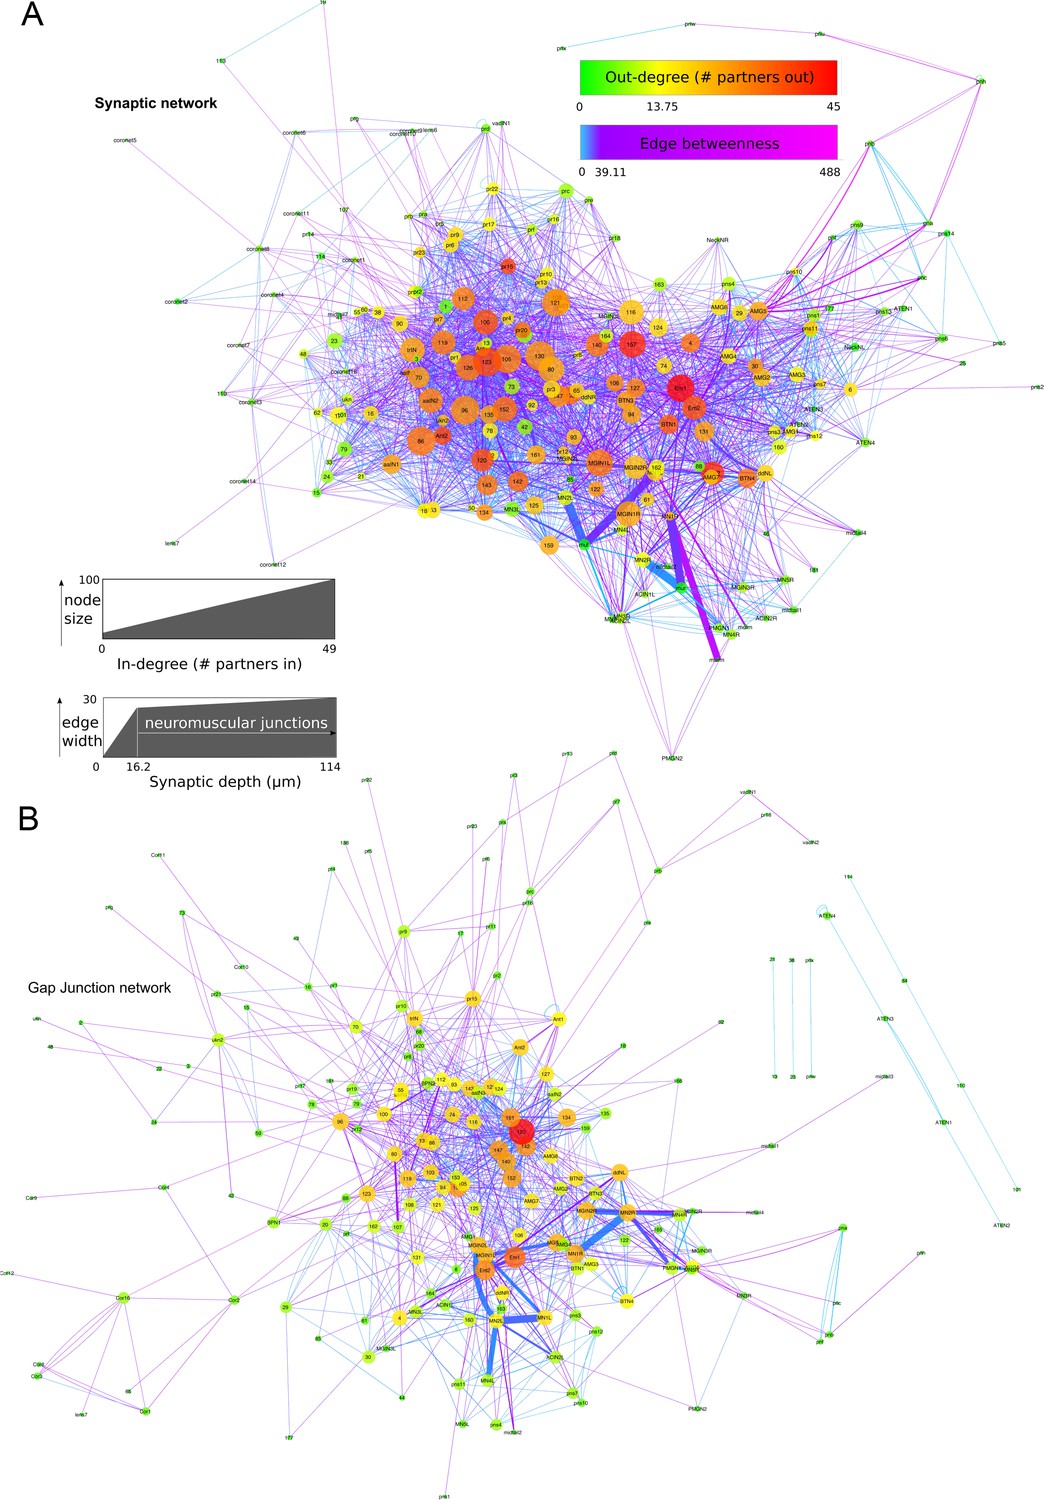
Network graphs with network statistics visualized as attributes.
Edge-weighted spring embedded layout applied to both graphs, using EdgeBetweeness. (A) Network of chemical synapses. In-degree (number of presynaptic partners) mapped to node size, Out-degree (number of postsynaptic partners) mapped to node colour, Edge betweenness (number of shortest paths that go through an edge) mapped to edge colour, and cumulative synaptic depth mapped to edge width. (B) Network of putative gap junctions. Degree (number of partners, undirected) mapped to node size and node colour, Edge betweenness mapped to edge colour, and cumulative contact depth mapped to edge width. Scale for In-degree and Out-degree is equivalent to undirected Degree values for the gap junction network.
Figure 4

Unpolarized, reciprocal, and serial synapses.
(A) Unpolarized mixed synapse between cell 115 and cell 23 with dense-core (arrowhead) and electron-lucent (arrow) vesicles on both sides of the synaptic cleft. (B) Single section with synapse from cell 102 to cell 120 (black arrow) and a reciprocal partner synapse from cell 120 to cell 102 (red arrow). Arrowhead: membrane apposition marking a putative gap junction. (C) Serial dyad synapse (black arrow) from single neuron onto two postsynaptic targets (157 and 74), one of which is presynaptic in the same section (red arrow) at a dyad synapse onto two neurites (AMG1 and AMG2). (D) Serial monad synapse (black arrow) onto a single postsynaptic target (126) that is presynaptic at an adjacent synapse (red arrow) to a single postsynaptic target (116). Scale bars: 1 µm. (E) Series of four 60 nm sections through a single synapse. The pre- and postsynaptic cell are labelled in the top image. A clear cumulus of presynaptic vesicles is visible all images, and a clear postsynaptic density in the penultimate image (arrowhead). Scale bar: 500 nm.
-
Figure 4—source data 1
Comparison of synaptic complements using different parameters and exclusion criteria.
Exclusions include synapses onto the basal lamina (bm), synapses onto ependymal cells (Ep), neuromuscular junctions (Mu), synapses onto no apparent postsynaptic neuron (space), and synapses observed in fewer than two sections (>1 section). For values excluding neuromuscular junctions the neuromuscular junction values and percentages are given.
- https://doi.org/10.7554/eLife.16962.014
Figure 5

Sensory neurons and associated cells have sided distributions.
Reconstructed coronet cells (Cor) with their bulbous protrusions (BP, one with a black arrow) and -- in their correct relative position -- six layers of photoreceptor neurons, excluding their terminals, together with otolith (Ot) and ocellar (Oc) pigment cells. Reconstructions shown from a dorsal (A), or frontal (B) view. (C) Reconstruction of visual system components (including photoreceptor tract (trIN) and vacuolated sensory (vacIN) interneurons, shown from the right side, anterior to the right. (D) Sensory neurons (spheroids) and their modified cilia reconstructed within the outline of the CNS from left lateral, dorsal, and frontal views. Cells coloured as in panels A-C, PR-I outer segments in yellow, Pr-II outer segments in teal, coronet bulbous protrusions in green.
Figure 6
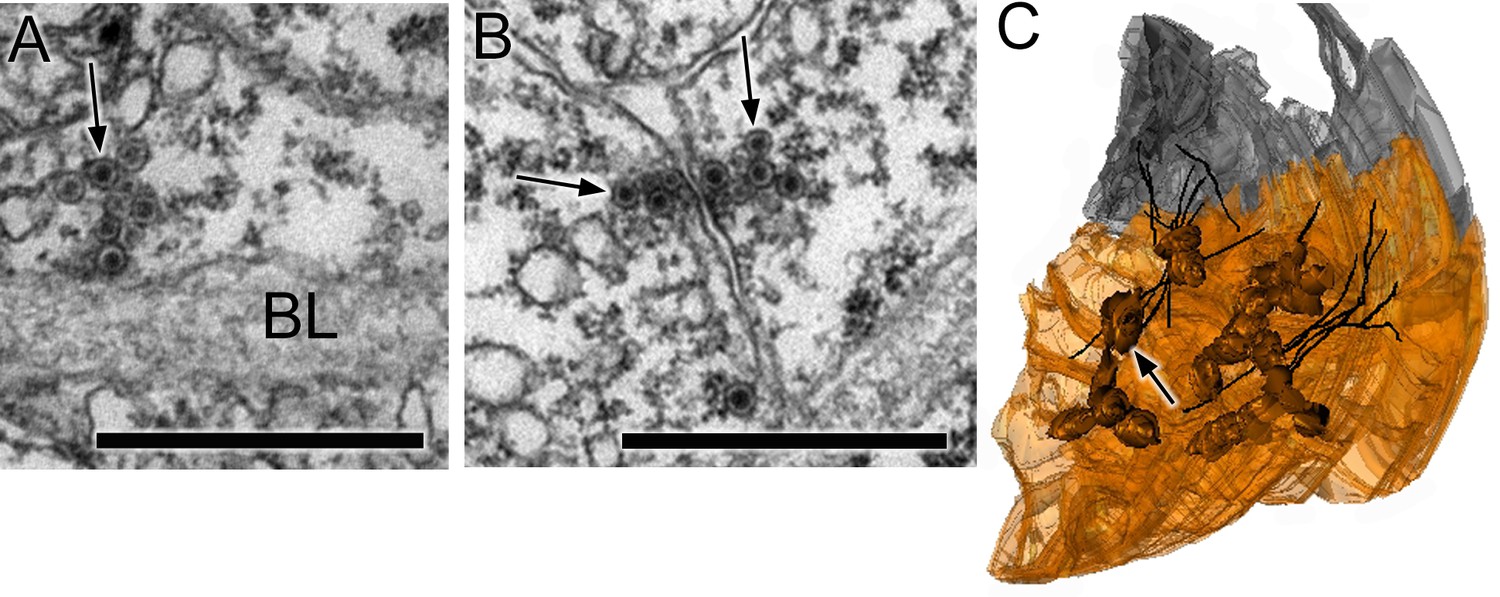
Synapses of coronet cells.
(A) Synapse, containing exclusively dense-core vesicles (arrow), from a coronet cell onto the basal lamina (BL). (B) Unpolarized synapse between two coronet cells, with dense-core vesicles (arrows) on both sides of a synaptic cleft. (C) Reconstruction of coronet cells each with a bulbous protrusion (arrow) alongside coronet-cell associated somata (grey) of ciliated neurons, with cilia reconstructed in black. Scale bars: 1 µm (in A and B).
Figure 7 with 1 supplement
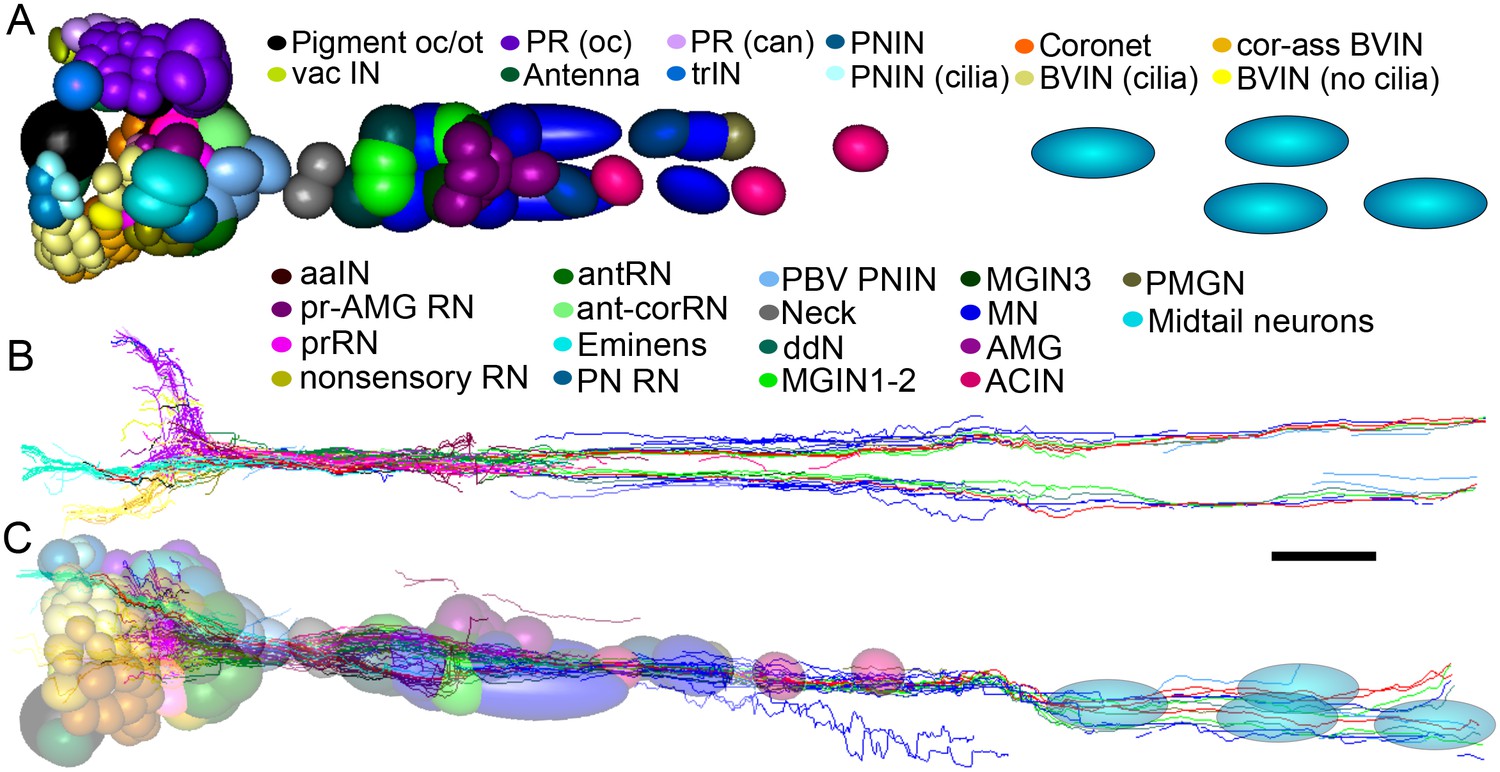
Representation and relative sizes of cell bodies and their positions along the neuraxis, with corresponding axon tracts.
(A) Cell bodies of CNS neurons, dorsal view. Colours denote cell types (key). (B) Corresponding axon tracts, shown as skeleton reconstruction, dorsal view, colours as in (A) (for a network graph of synaptic connectome formed by corresponding neurons sorted by connectivity see Figure 7—figure supplement 1). (C) Cell bodies of CNS neurons and axon tracts, corresponding to (A) and (B), left lateral view. Pigment oc/ot: ocellus and otolith pigment cells; PR (oc): type I photoreceptor; PR (can): type II photoreceptor; PNIN: peripheral interneuron; PNIN (cilia) peripheral interneuron with cilium; vac IN: vacuolated photoreceptor-associated interneuron; Antenna: antenna cell; Coronet: coronet cell; aaIN: anaxonal arborizing interneuron; BVlN (cilia): ciliated brain vesicle interneuron: pr-AMG RN: photoreceptor-AMG relay neuron; trIN: photoreceptor tract interneuron; cor-ass BVIN: ciliated coronet associated brain vesicle interneuron; prRN: photoreceptor relay neuron; BVIN (no cilia): brain vesicle interneuron lacking cilium; non-sensory relay neuron (RN); antRN: antenna relay neuron; ant-corRN: antenna-coronet relay neuron: Eminens: eminens neuron: PNRN: peripheral relay neuron: PBV PNIN: posterior brain vesicle peripheral interneuron; MGINs 1–2: motor ganglion paired interneurons 1 and 2; MGINs 3: motor ganglion paired interneurons 3; ddN: descending decussating neuron pair: AMG: ascending motor ganglion neuron; MN: motor neuron: ACIN: ascending contralateral inhibitory neuron; PMGN: posterior motor ganglion neuron; Midtail neurons: short descending neurons of the caudal nerve cord. Scale bar 10 µm.
Figure 7—figure supplement 1
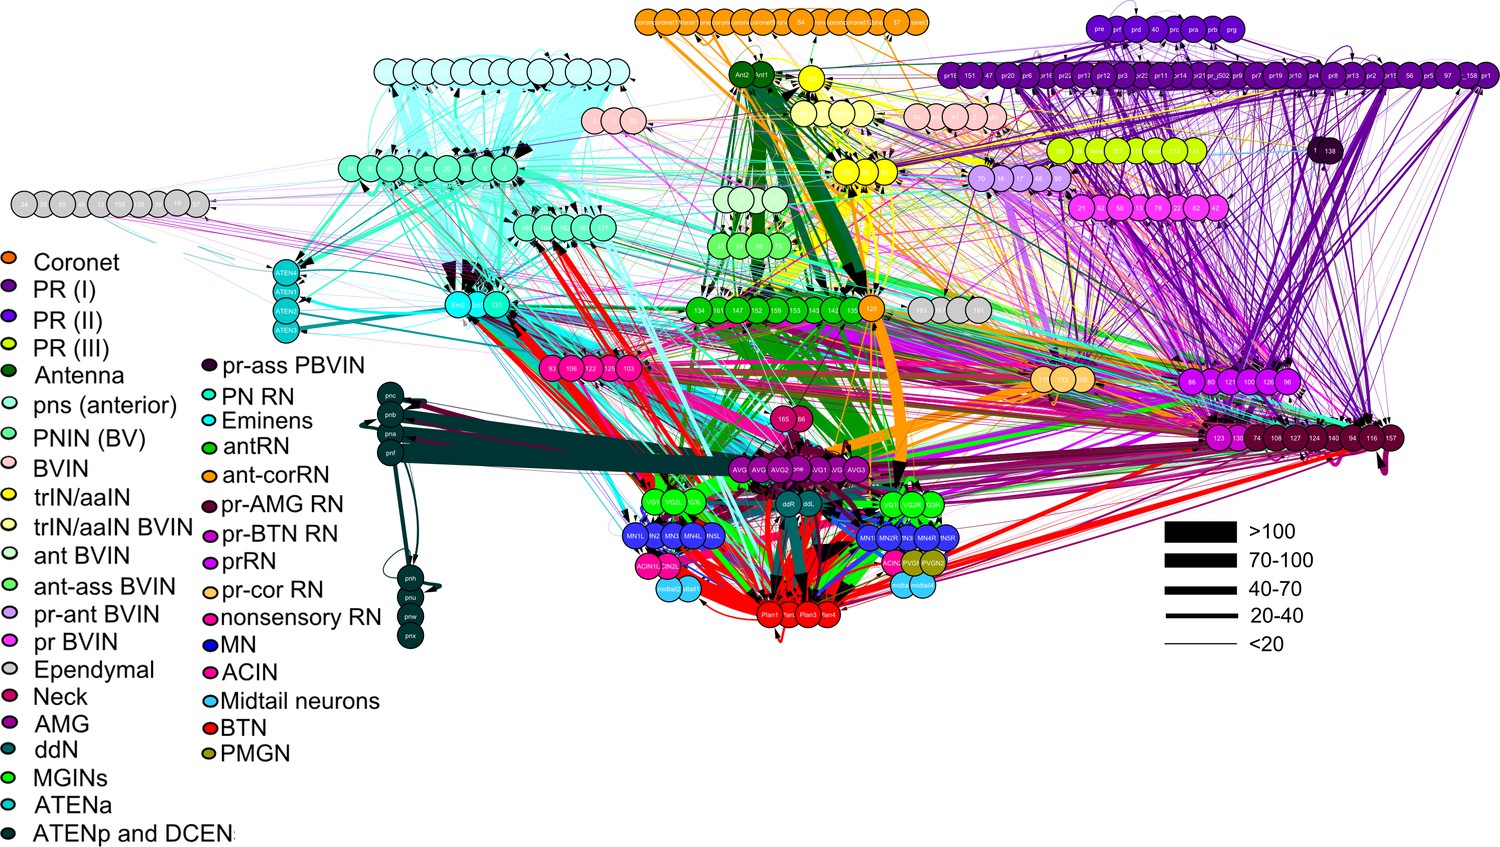
Total network of synaptic pathways within the larval CNS of Ciona intestinalis.
Network graph of all connections within the larval nervous system generated in Cytoscape. Line width indicates synaptic strength (key, right) and arrows indicate direction of synaptic connection. Cells colour-coded by connectivity class (key).
Figure 8
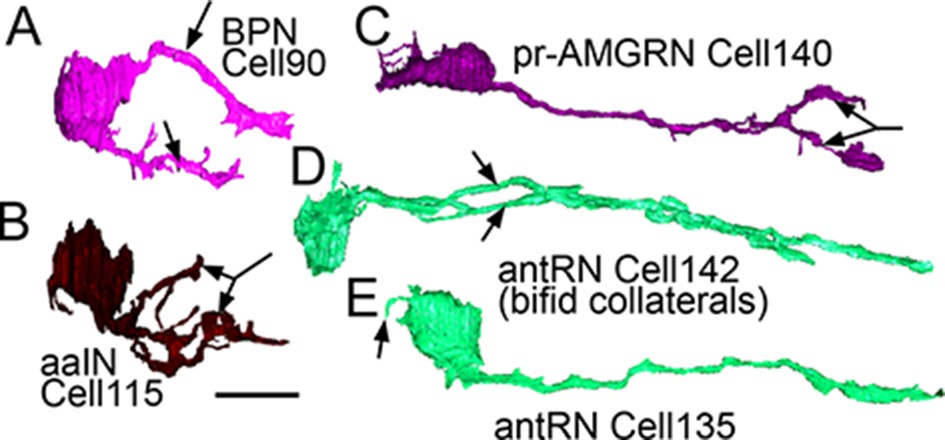
Right-side interneurons reconstructed from the brain vesicle, left lateral views, anterior to the left.
(A) Intrinsic bipolar interneuron with two axons (arrows). (B) Anaxonal arborizing interneuron with large branched terminal (arrow). (C) Photoreceptor-ascending motor ganglion (pr-AMGRN) relay neuron with forked terminal (arrow). (D) Antenna relay neuron with bifid axon (arrows). (E) Antenna relay neuron with single axon, terminal and soma dendrite (arrow). Scale bar 10 µm.
Figure 9 with 1 supplement
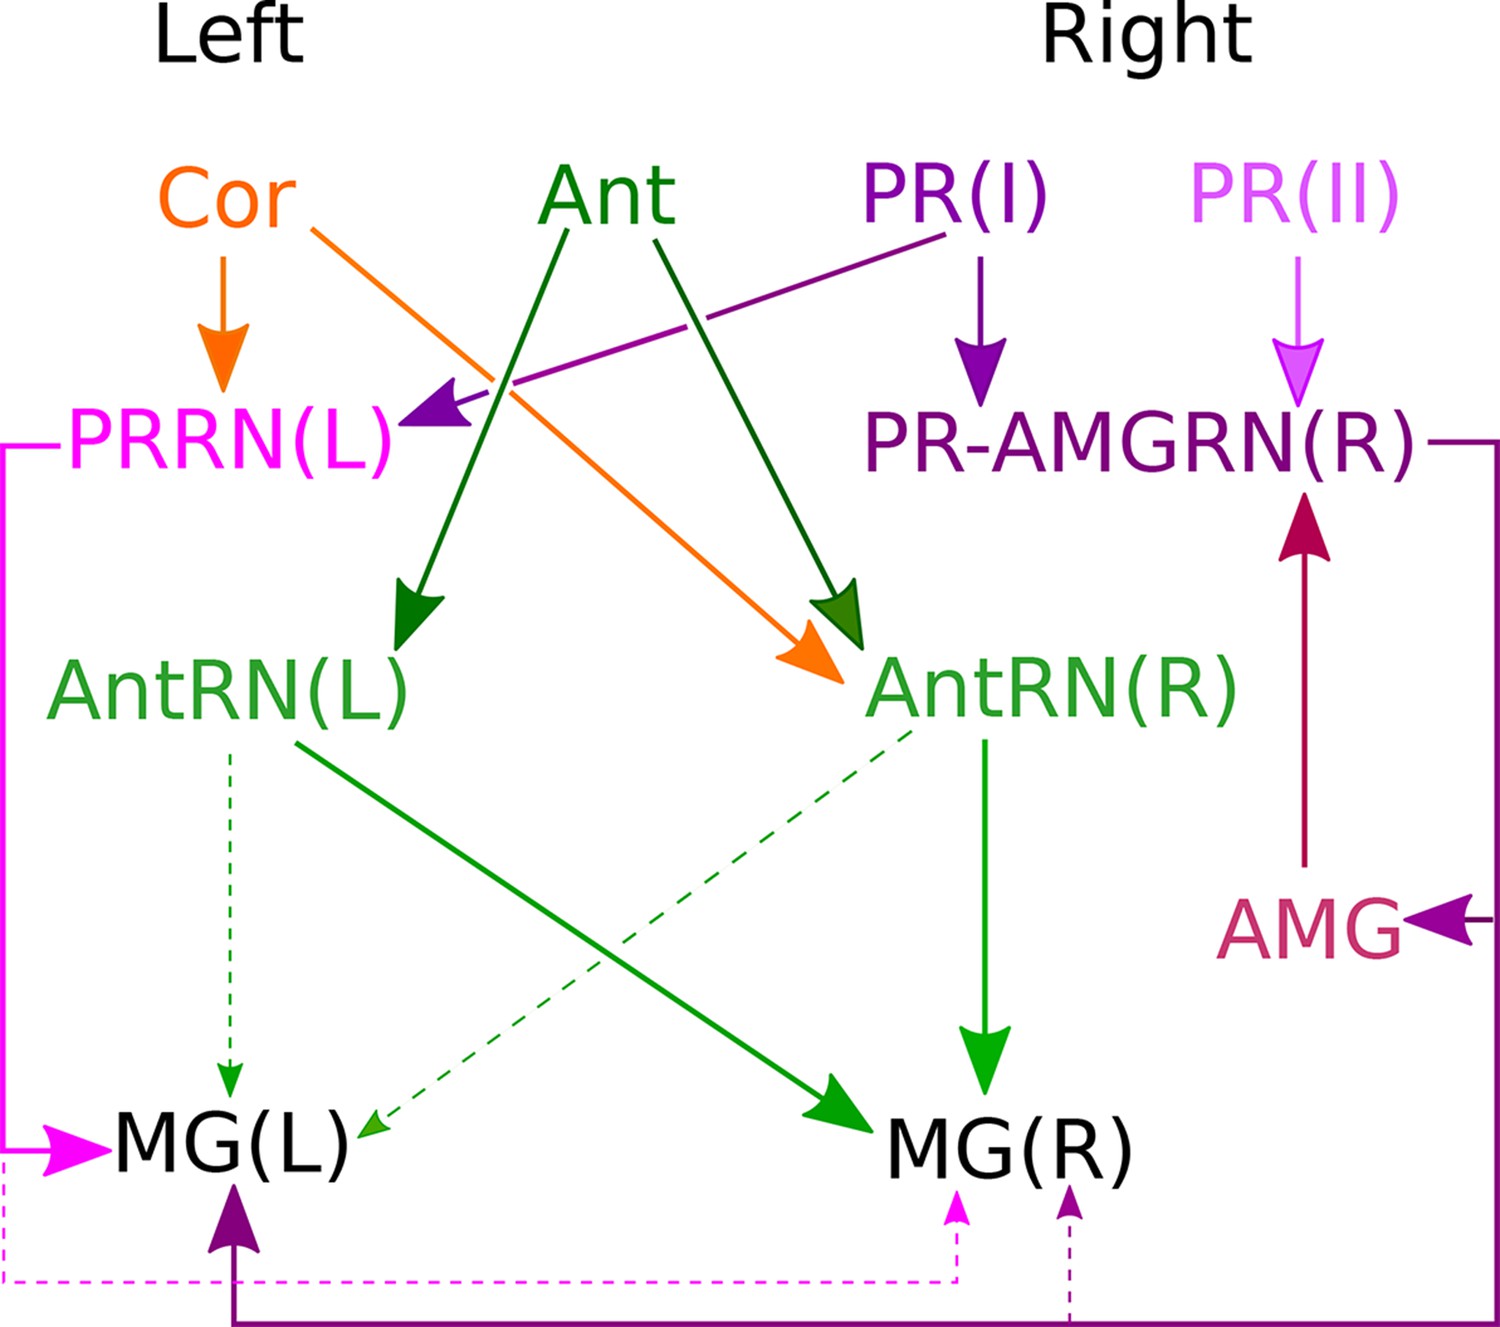
Asymmetrical sensory input to the two sides of the motor ganglion MG(L) and MG(R) via relay neurons.
Sensory input arises from coronet cells (Cor); antenna cells Ant1 and Ant2 (combined as Ant); and photoreceptors (PR) of two types: ocelli (oc: PR I) and neural canal (can: PR II). Signals are relayed through respective interneuron classes: photoreceptor relay neurons on the left, PRRN(L); photoreceptor-ascending motor ganglion (PR-AMGRN(R)) relay neurons on the right (Figure 8c); and antenna relay neurons (AntRN) of the left and right sides. PR-AMG relay neurons of the right side receive input from ascending motor ganglion neurons that is reciprocated. Pathways with weak connections are shown with dashed lines. Details of pathway strength appear in Figure 9—figure supplement 1
Figure 9—figure supplement 1
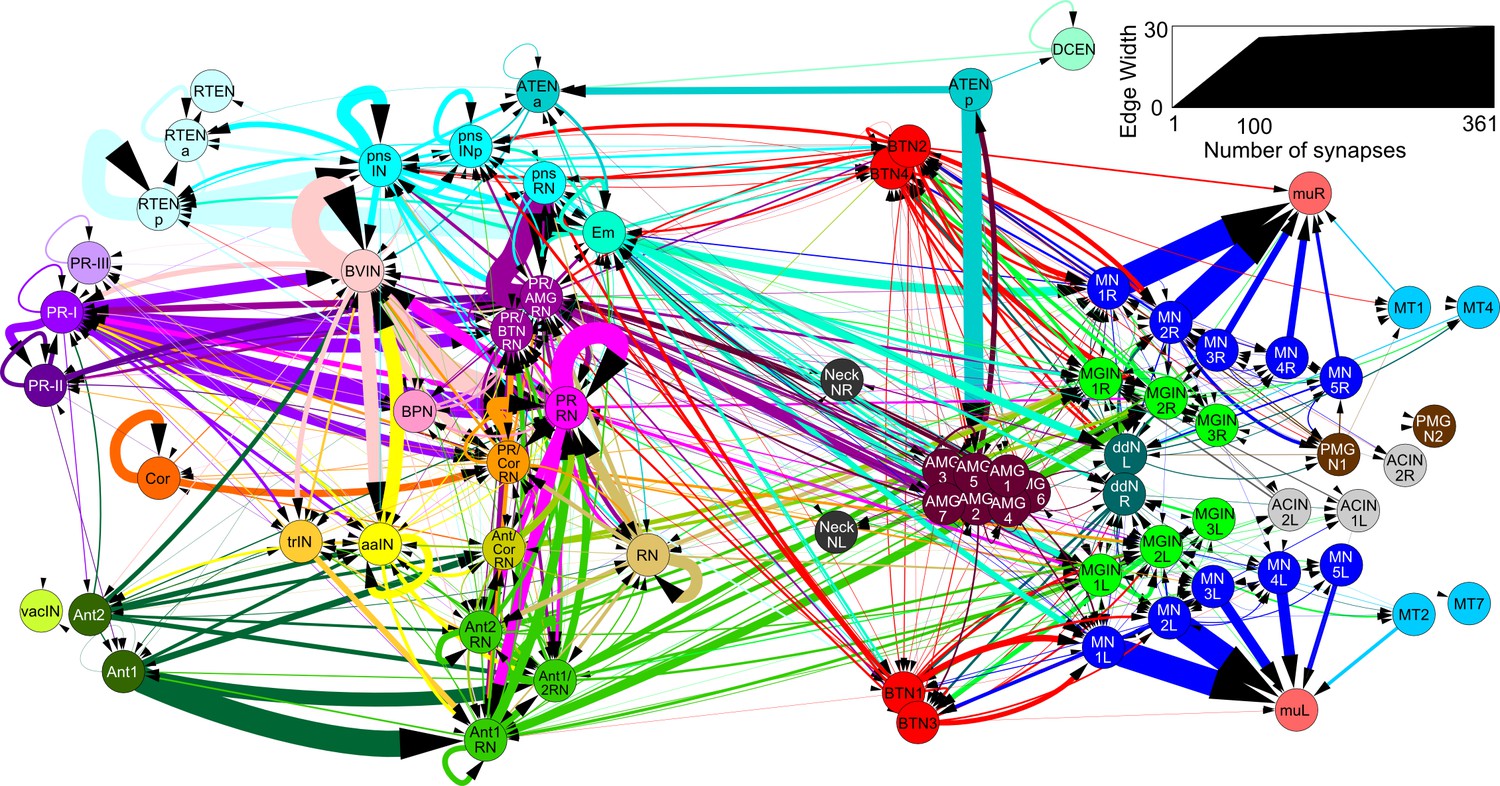
Total network of synaptic pathways within the larval CNS of Ciona intestinalis.
Network graph of all connections between cells of the larval nervous system grouped by cell type (cf, Figure 7—figure supplement 1). Line width indicates the total synaptic number (key, right) and arrows indicate direction of synaptic connection. Cells colour-coded by connectivity class (key: Figure 1—source data 1).
Figure 10 with 2 supplements
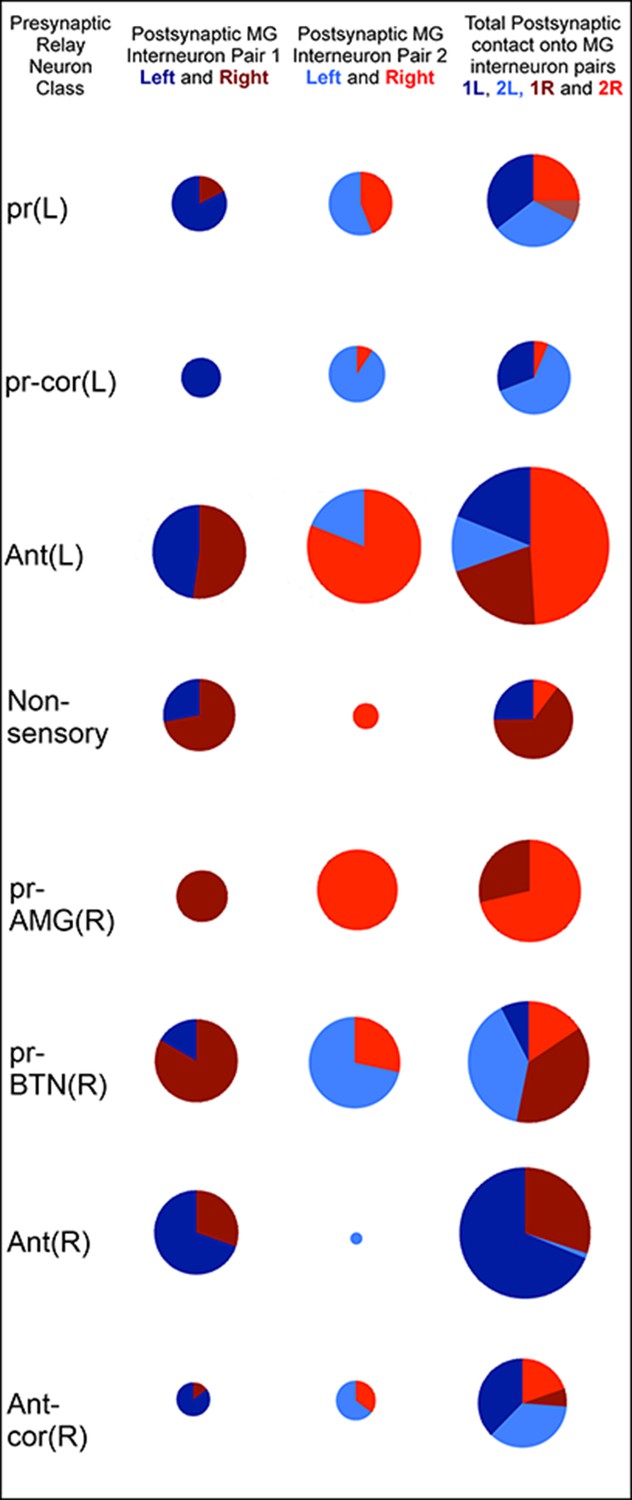
Classes of relay neurons (presynaptic) in the CNS of Ciona and the inputs these provide to cells on the left and right sides of the motor ganglion (for details of relay inputs see Figure 10—figure supplement 1 and for antenna pathway see Figure 10—figure supplement 2).
For relay neuron class names see the key in Figure 1—source data 1). Each circle represents the input synapses to the first (column 1), second (column 2) or both (column 3) paired MG interneurons. Inputs to the left (blue) or right (red) partners are shown as an angular subtense of a circle the area of which represents the overall synaptic strength. Most sensory inputs are predominantly one-sided, some entirely so. Total synaptic input varies widely (see Figure 10—source data 1 for actual values and proportions).
-
Figure 10—source data 1
Relay neuron inputs to the left and right motor ganglion.
Values refer to the total number of synapses and their proportions of the whole population.
- https://doi.org/10.7554/eLife.16962.029
Figure 10—figure supplement 1
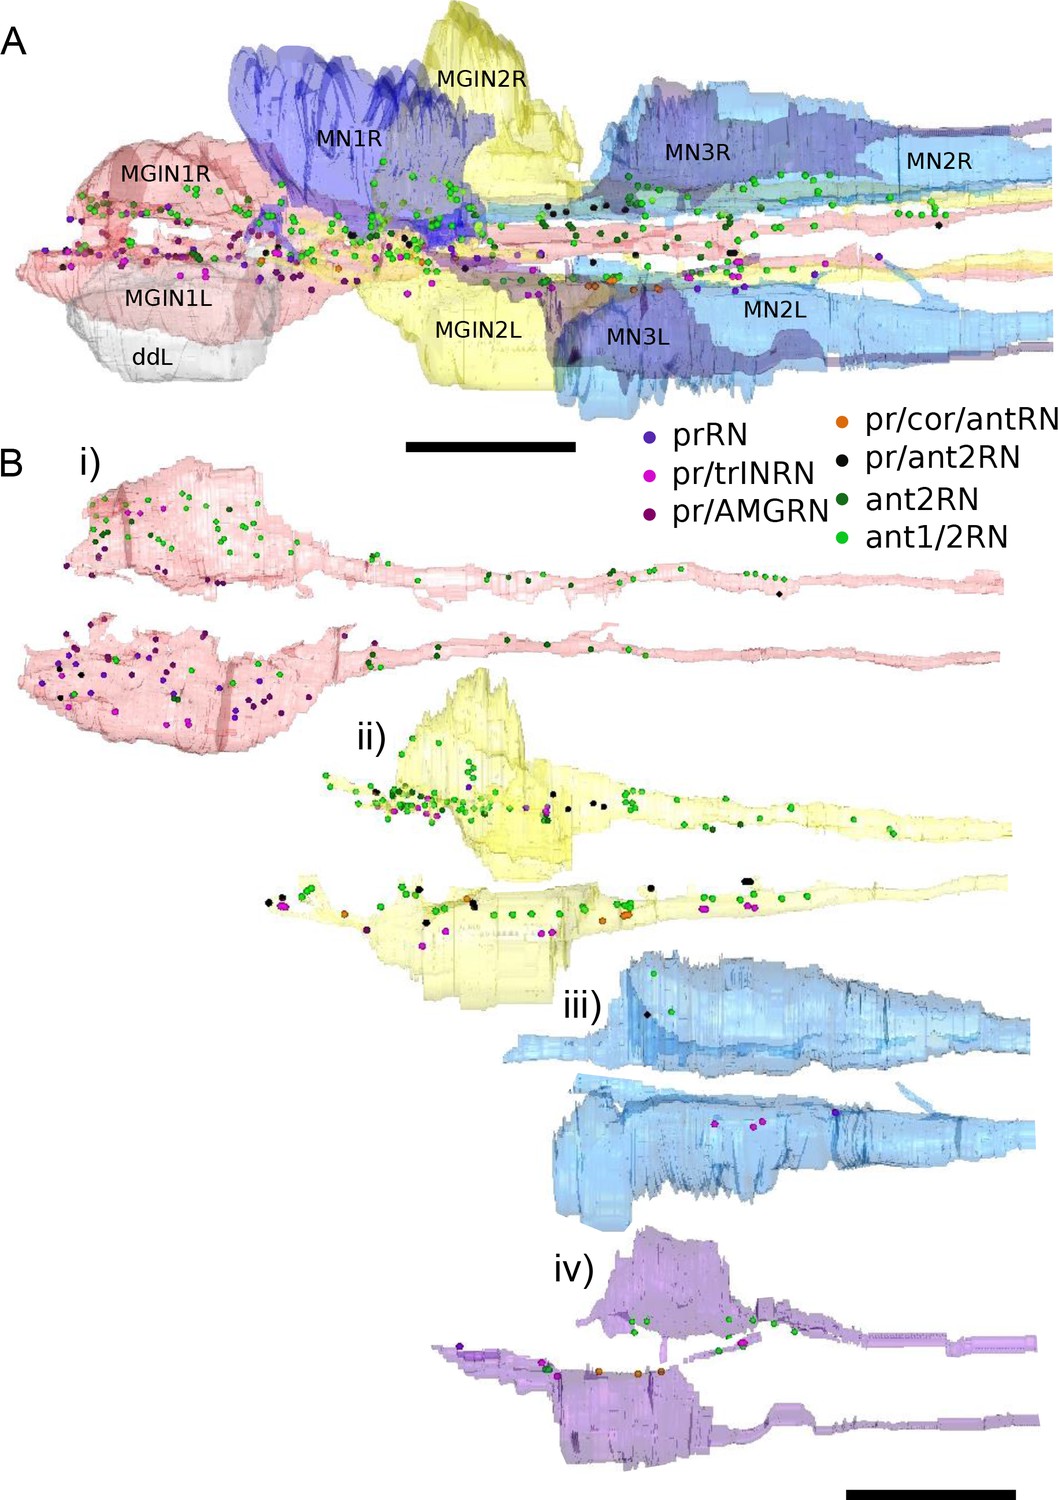
Reconstructions of motor ganglion neurons populated with photoreceptor and antenna relay neuron synaptic input sites, colour-coded by relay neuron type (key).
Synaptic sites are marked by 4 nm spheres regardless of their actual size. prRN: photoreceptor relay neuron; pr/trINRN: relay neurons with input from photoreceptors and photoreceptor tract interneuron; pr/AMGRN: relay neurons with inputs from photoreceptor and peripheral pathway; pr/cor/antRN: relay neuron with inputs from photoreceptor, coronet cells, and antenna 2 neuron; pr/ant2RN: relay neurons with inputs from photoreceptors and antenna 2 neuron; ant2RN: relay neurons with inputs from antenna 2 neuron; ant1/2RN: relay neurons with input from both antenna neurons. Anterior to the left. (A) Dorsal view of all target neurons in the MG. (B) Target motor ganglion neuron pairs in (A) populated with postsynaptic sites received from relay neurons. Each neuron is rotated to show synaptic sites along its inside edge. Scale bars: 10 µm.
Figure 10—figure supplement 2
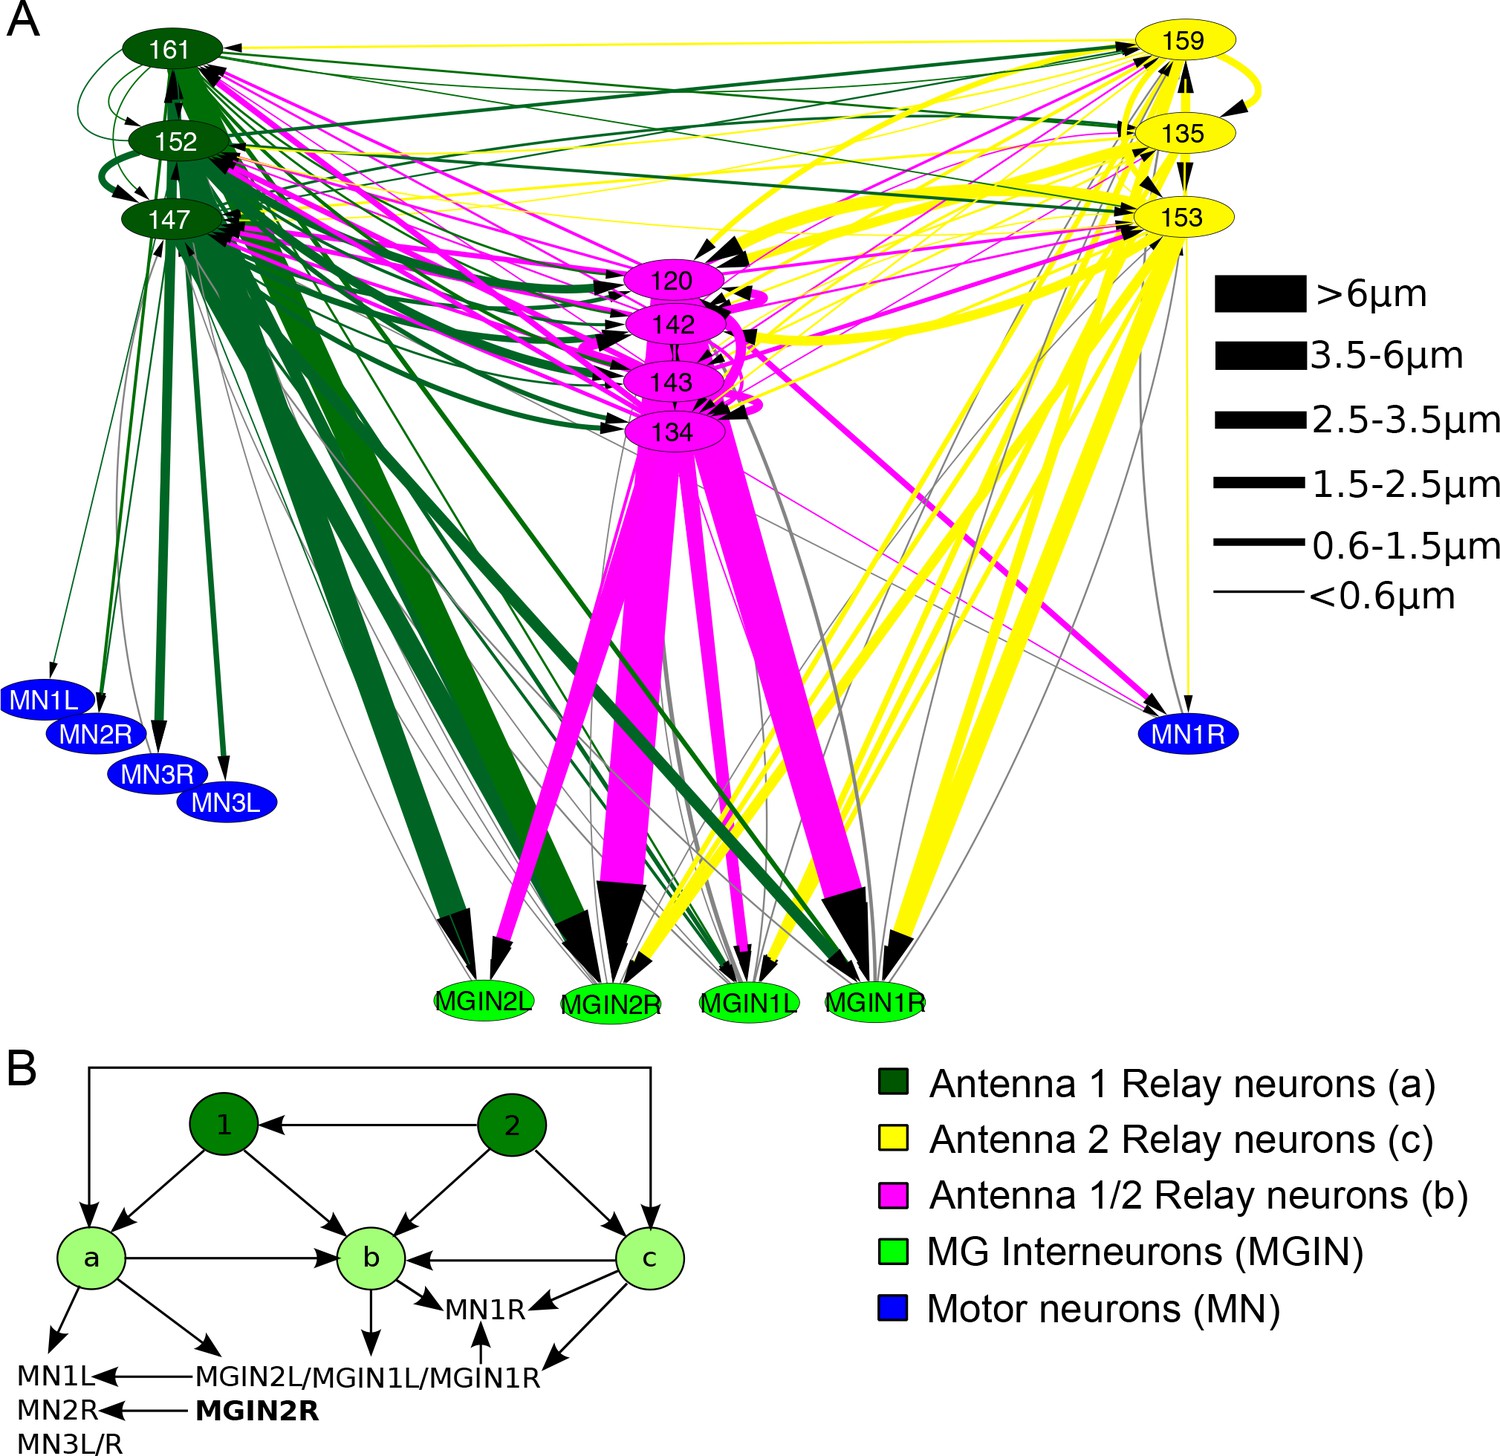
Antenna cell relay neuron input to the motor ganglion.
(A) Network of antenna cell relay neuron synaptic connections to components of the motor ganglion. Cells are colour-coded, and synapse strength is denoted by line thicknesses (key, right) and varies over a >50 fold range in cumulative synaptic depth. (B) Summarizing (A): Antenna cells (1 and 2) provide input to three classes of relay neurons (a, b and c) represented in Figure (A) that provide input in turn to left- and right-side motor ganglion cells. Both antenna cell 1 and 2 networks form feedforward triplet motifs onto relay neuron classes (a to c) which themselves form symmetrical feedforward motifs.
Figure 11
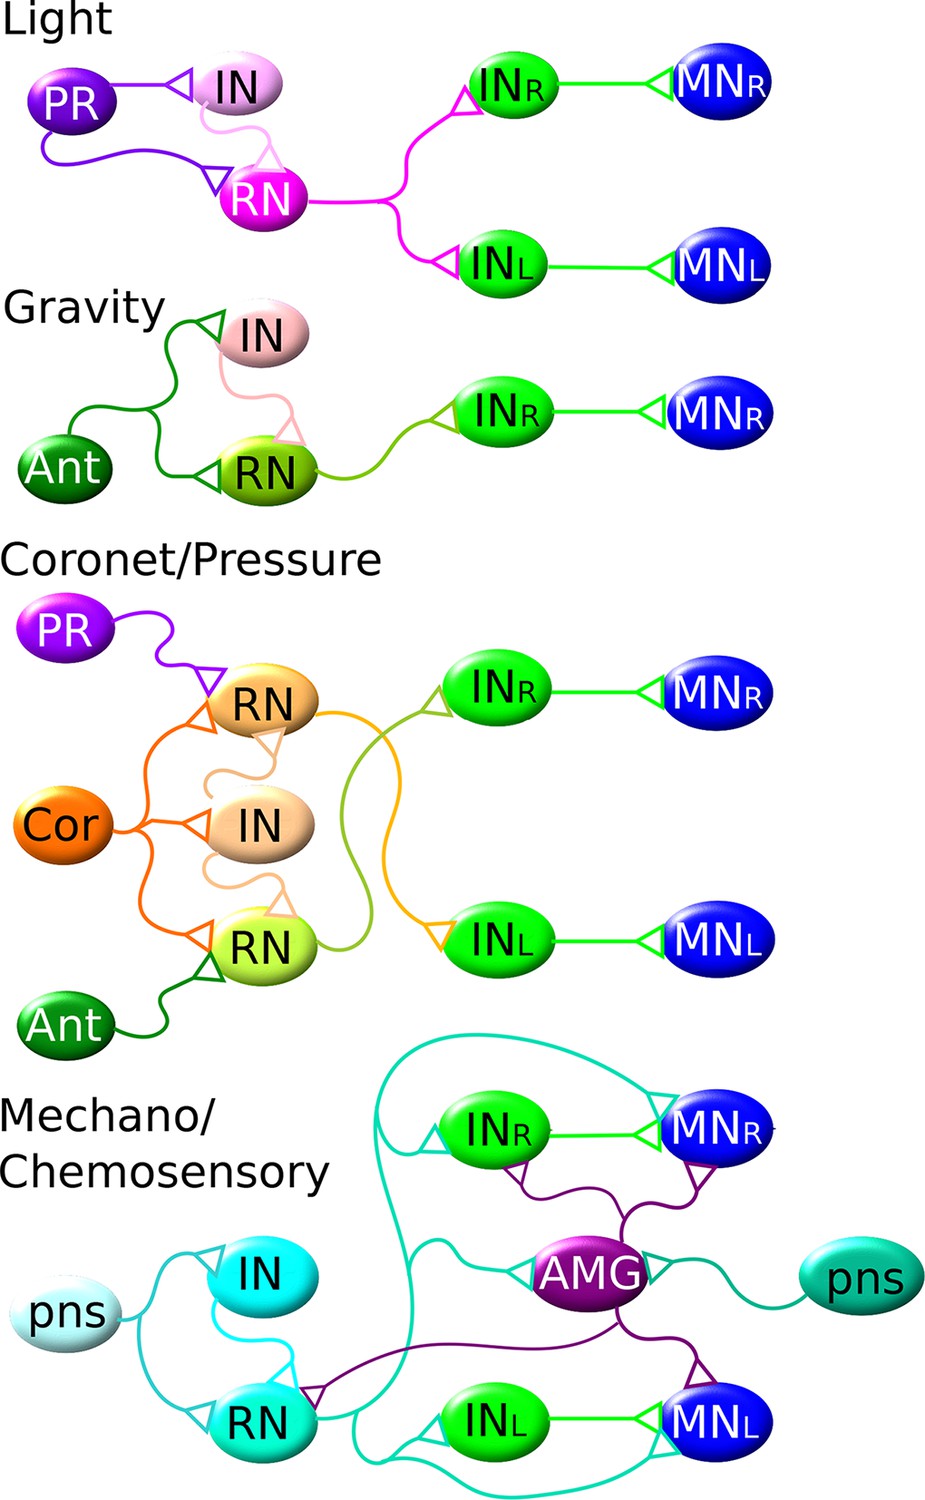
The shortest CNS pathways between sensory neurons and motor neurons for different sensory modalities are three-synapse arcs.
Four modalities are indicated, from top to bottom: light, gravity, coronet cells (possibly hydrostatic pressure) and PNS mechano/chemosensory. Members of the same cell types are assigned the same colour. Each pathway originates in the particular class of sensory neuron (photoreceptor: PR; antenna neuron: Ant; coronet cell, Cor; and PNS sensory neuron, pns) connecting via relay neurons (RN) and interneurons (IN) of the brain vesicle, to interneurons (IN) of the motor ganglion, to motor neurons (MNs). AMG: addition relay neurons of the motor ganglion receive input from the PNS. These pathways are all interconnected, overlapping networks for all sensory modalities thus underlying the complex reality of the actual behavioral network (Figure 9—figure supplement 1).
Figure 12
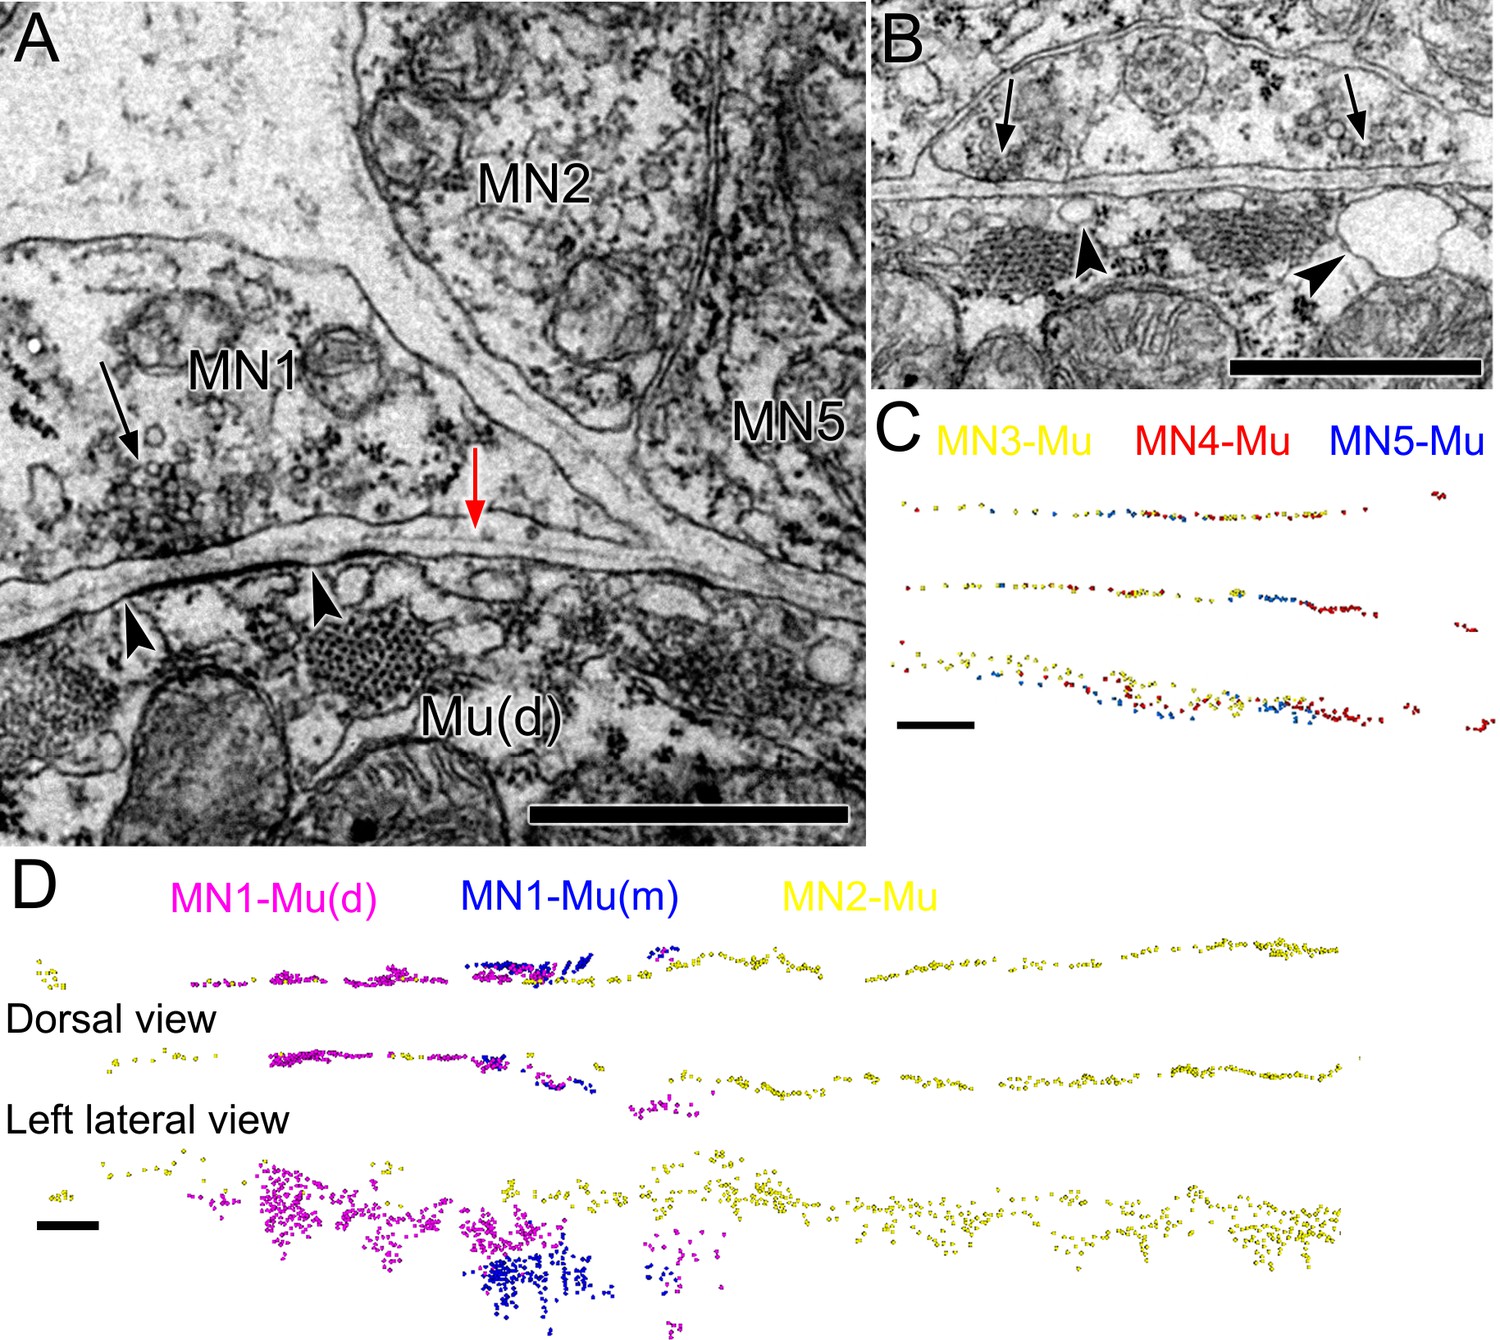
Ciona intestinalis larval motor neuron terminals and neuromuscular junctions.
(A) Neuromuscular junction (arrow) of MN1, with a postsynaptic specialization on the muscle (arrowheads). A basal lamina (red arrow) extends in the cleft between neuron and muscle. (B) Two adjacent neuromuscular synapses (arrows) with postsynaptic cisternae (arrowheads), but lacking postsynaptic membrane densities. (C,D) Enlarged views of anterior tail with reconstructed puncta representing colour-coded neuromuscular junctions of each motor neuron pair. (D) Top: Dorsal view. Bottom: Left lateral view. Scale bars: 1 µm (A, B); 10 µm (C, D).
Figure 13
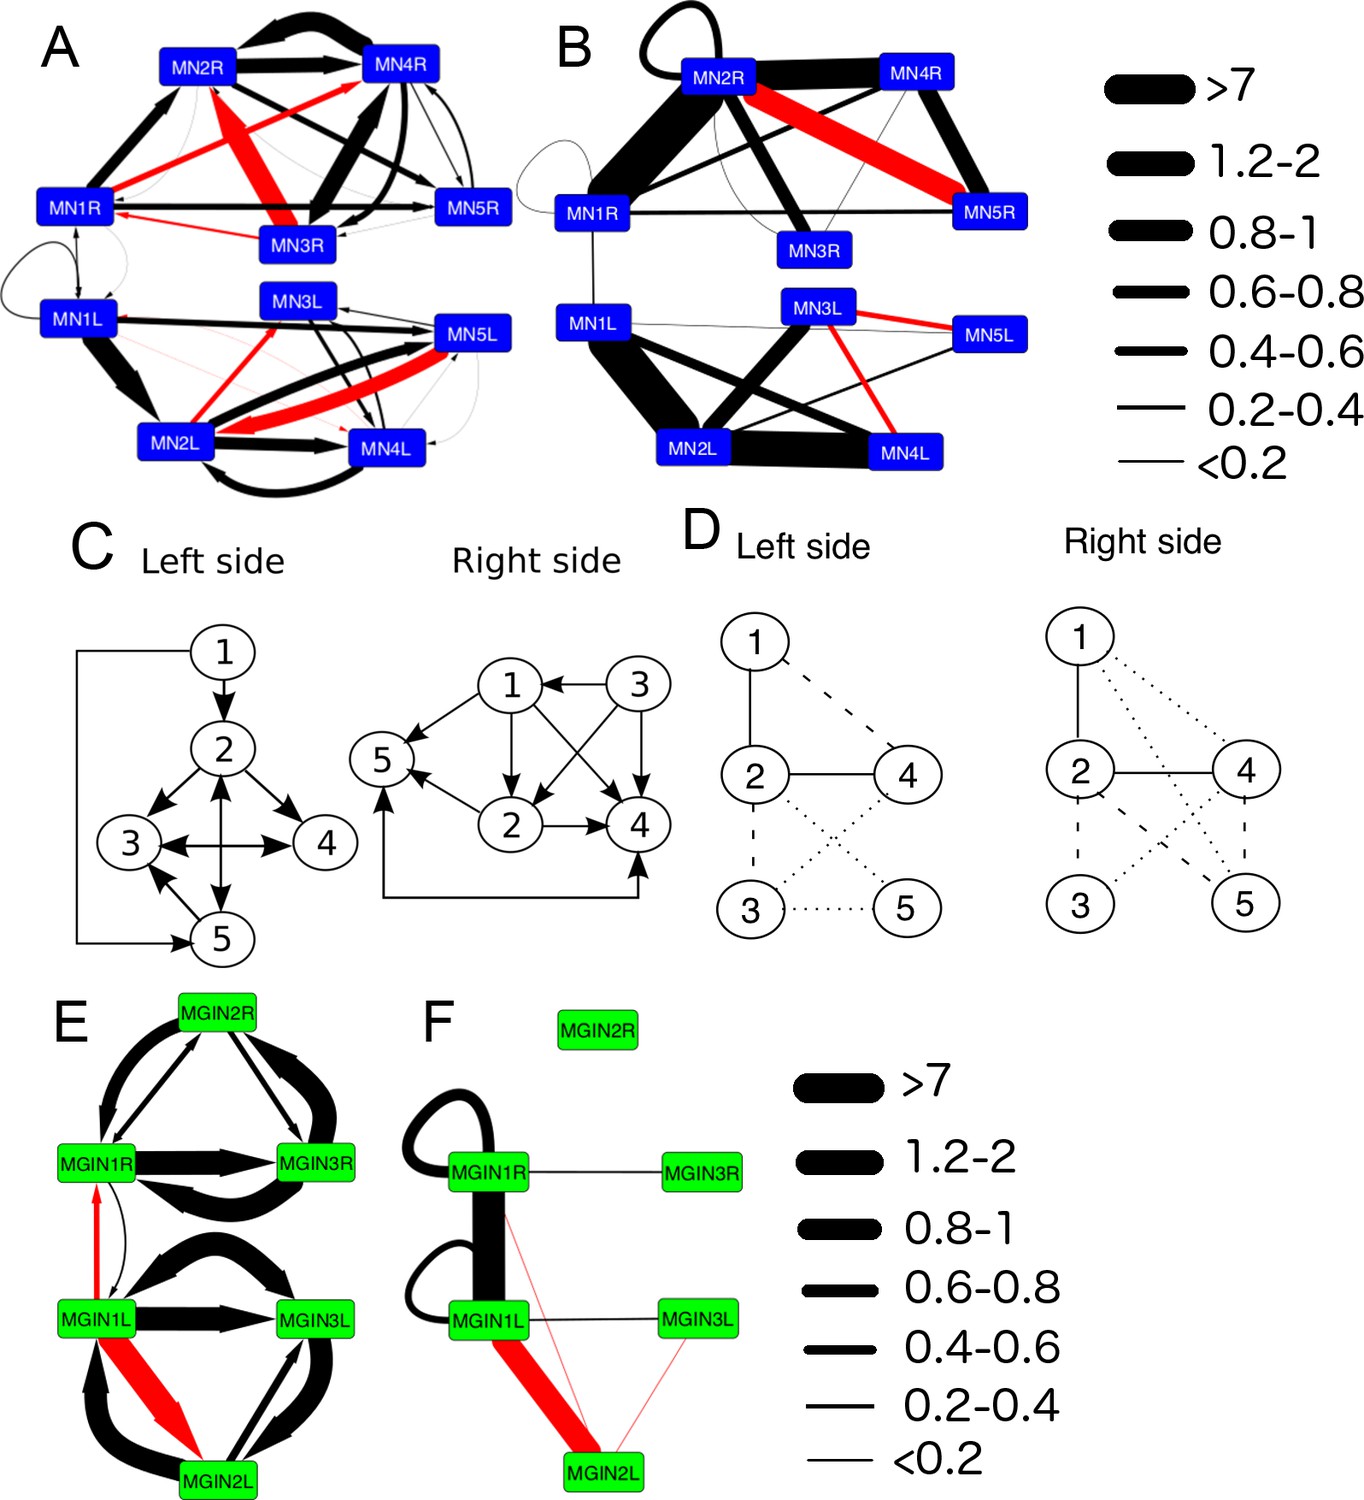
The networks of motor neurons MN1-MN5 and descending ipsilateral neurons (MG1-MG3) of the left and right side of the motor ganglion (MG).
(A) Synaptic network of motor neurons 1–5 on the left (MN1-5L) and right (MN1-5R) sides. (B) Network of putative gap junctions between motor neurons of the MG. (C) Summary diagrams of motor neuron synaptic networks of left and right sides. (D) Summary diagrams of putative gap junction network of motor neurons of the left and right sides. Dotted lines represent tentative connections, dashed lines minimal contacts, and solid line connections with many large contact sites. (E) Synaptic network of descending ipsilateral interneurons (MGINs) of the motor ganglion. (F) Network of putative gap junctions between descending ipsilateral interneurons of the motor ganglion. For a, b, e and f: Arrows illustrate polarity of synapse, line thickness show the cumulative depth of synaptic contact in µm (see Materials and methods). Red lines illustrate synaptic contacts that differ between left and right sides of the MG.
Figure 14

Left-right asymmetries in the overall synaptic pathways of the motor ganglion.
Pathways shown are between motor neurons (MNs), descending ipsilateral interneurons (MGINs) and descending mid-tail neurons. (A) Synaptic network with arrows indicating polarity of synaptic contacts. (B) Summary network of gap junctions for descending motor ganglion neurons illustrated in (A). Blue lines represent gap junction inputs from motor neurons, green represent gap junction inputs from interneurons, and pale blue are gap junction inputs from mid-tail neurons. Pathway strength varies over a wide (>25 times) range and is more left-right symmetrical than the synaptic network in (A). In both (A) and (B) pathways shown by orange lines are left/right asymmetrical, and those in pink are present only on one side (key). Thickness of lines indicates cumulative depth of synaptic contacts (see Materials and methods) (scale).
Figure 15
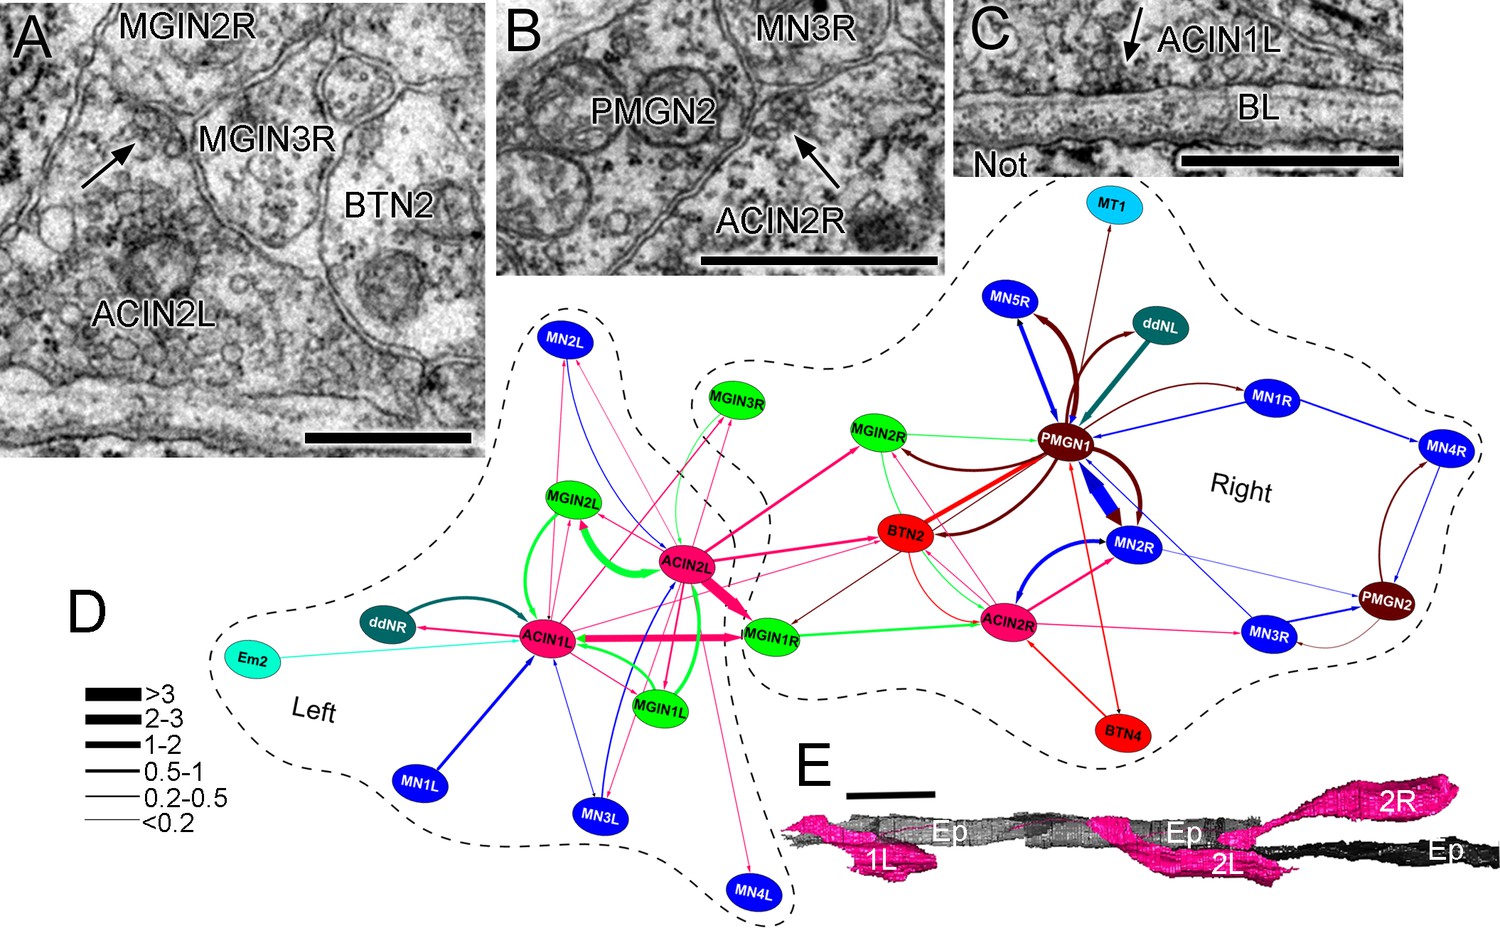
ACIN synapses and network.
(A) Presynaptic site (arrow) from the left ACIN onto contralateral MGIN interneurons at a dyad synapse. BTN2: bipolar tail neuron profile. (B) Dyad synapse (arrow) onto ipsilateral motor neuron MN3R and an unpaired tail interneuron (PMGN2) on the right side. (C) Synapse (arrow) from ACIN1L onto the ventral basal lamina (BL) opposite the notochord. Scale bar (a-c): 1 µm. (D) Network diagram of ACIN pathways. Layout plotted as an edge-weighted spring embedded network (Cytoscape 3.1.0: NRNB.org) based on synapse pathway strengths (see Materials and methods). Right and left neuropiles are each enclosed in a dashed line. Pathway strengths are shown as the line thickness sorted by the cumulative depth of synaptic profiles (key). The right side includes two sided PMGN interneurons and their partners. Note reciprocity of connections for ipsilateral but not contralateral partners. Thus ACINs are presynaptic to contralateral partners but not postsynaptic. Cell types abbreviated as in Figure 1—source data 1 (E) Dorsal view of reconstructed ACINs. Scale bar 10 µm.
Figure 16 with 2 supplements
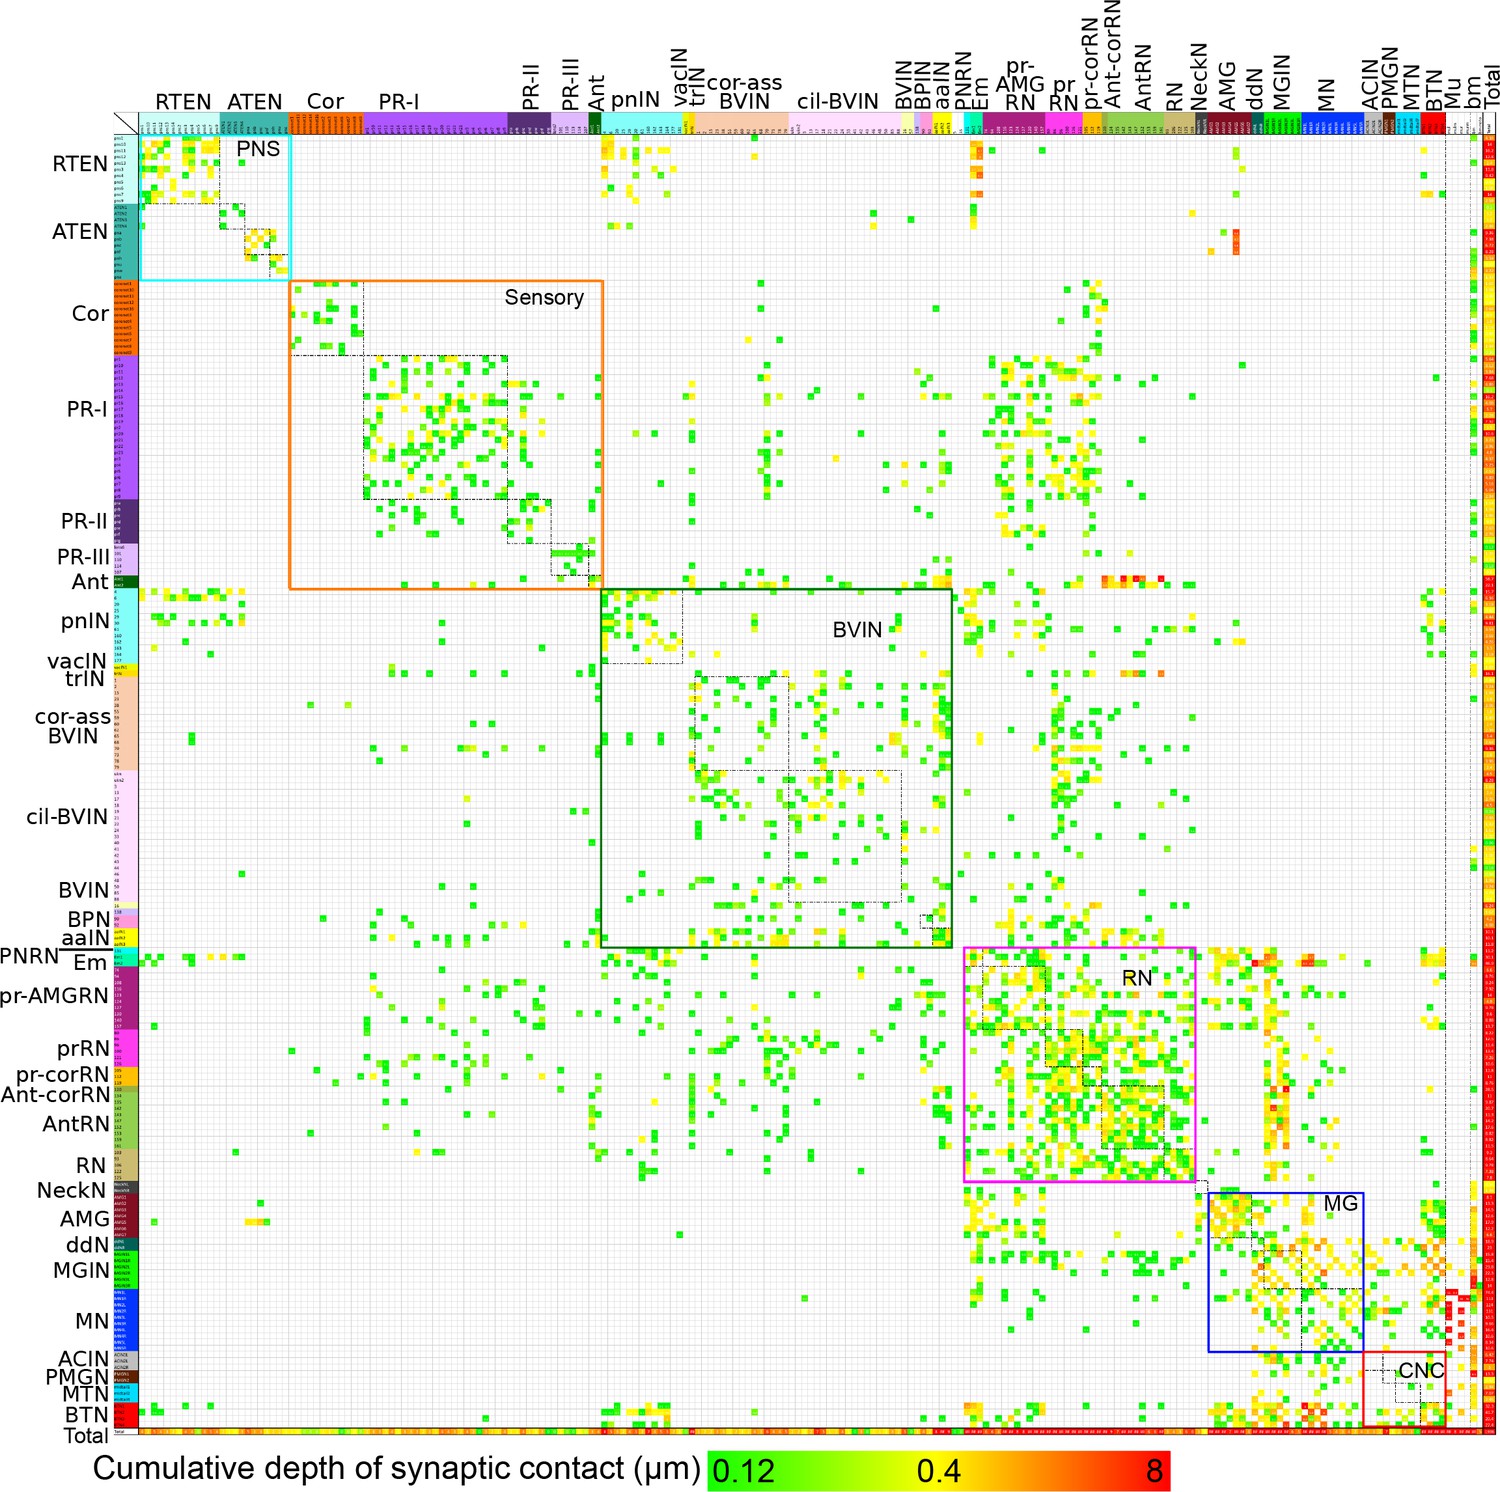
Entire connectivity matrix for the complete brain of a larva of Ciona intestinalis.
Shown for all synapses are the pre- (rows) and post- (columns) synaptic cells, colour-coded by cell type (see Figure 1—source data 1) and arranged in their rostro-caudal sequence along the longitudinal axis (presented in Figure 16—figure supplement 1 is the same matrix with cells sorted into left and right sides). Each intercept is colour-coded for the cumulative depth of presynaptic contacts made by that neuron upon its postsynaptic partner (key, bottom). In the case of dyads or triads, all connections are plotted. Also included are muscle cells, and the basal lamina of the CNS, both of which are exclusively postsynaptic. Other cell types, particularly ependymal cells lacking axons, are excluded. Muscle cells of the dorsal and medial bands are pooled on each side, because these are connected via gap junctions (Bone, 1992). The matrix is bounded by nested boxes between specific cell types. The smaller boxes enclosed by dashed lines indicate the connections between neurons of the same subtype. These are enclosed within boxes bounded by coloured lines, which indicate connections between neurons of the same brain region. Neurons of the brain vesicle are segregated into sensory neurons (orange lines, Sensory), intrinsic interneurons (pink lines, BVIN) and relay neurons (green lines, RN). Remaining boxes are as follows, neurons of the: PNS (PNS); motor ganglion (MG); and tail neurons of the caudal nerve cord (CNC). For matrix file see (Figure 16—source data 1).
-
Figure 16—source data 1
Matrix in Figure 16 1 as excel file.
- https://doi.org/10.7554/eLife.16962.040
-
Figure 16—source data 2
Matrix in Figure 16—figure supplement 2 as excel file.
- https://doi.org/10.7554/eLife.16962.041
Figure 16—figure supplement 1
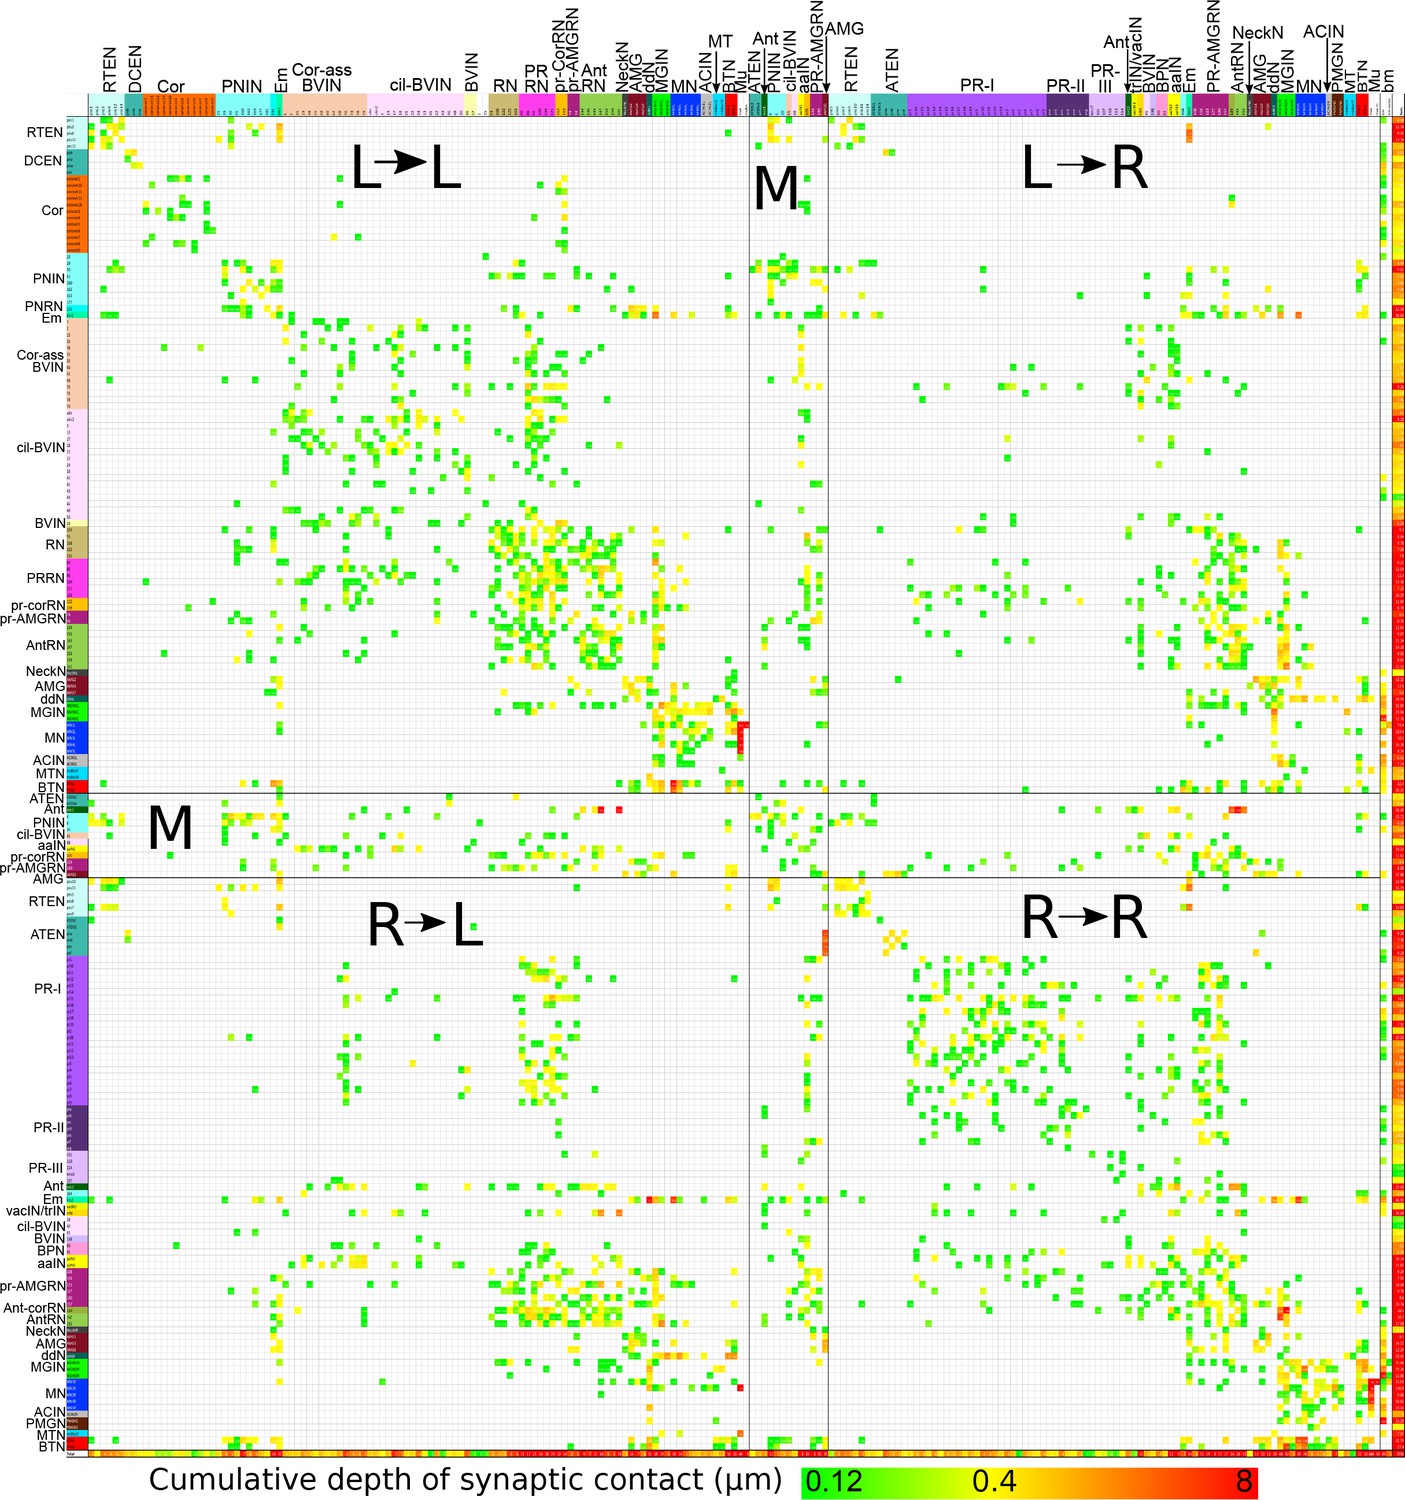
Matrix of connections from Figure 16 sorted by left and right sides.
Cell types and connection strength are both coded by colour as in Figure 16 Rows and columns are sorted starting with cells connecting from left (L) to right (R), left to left, right to left and right to right. Midline (M) cells separate these quadrants. Remaining cell types (notochord and basal lamina, bm) bound the four quadrants. Muscle cells presented on their respective sides and pooled as in Figure 16
Figure 16—figure supplement 2
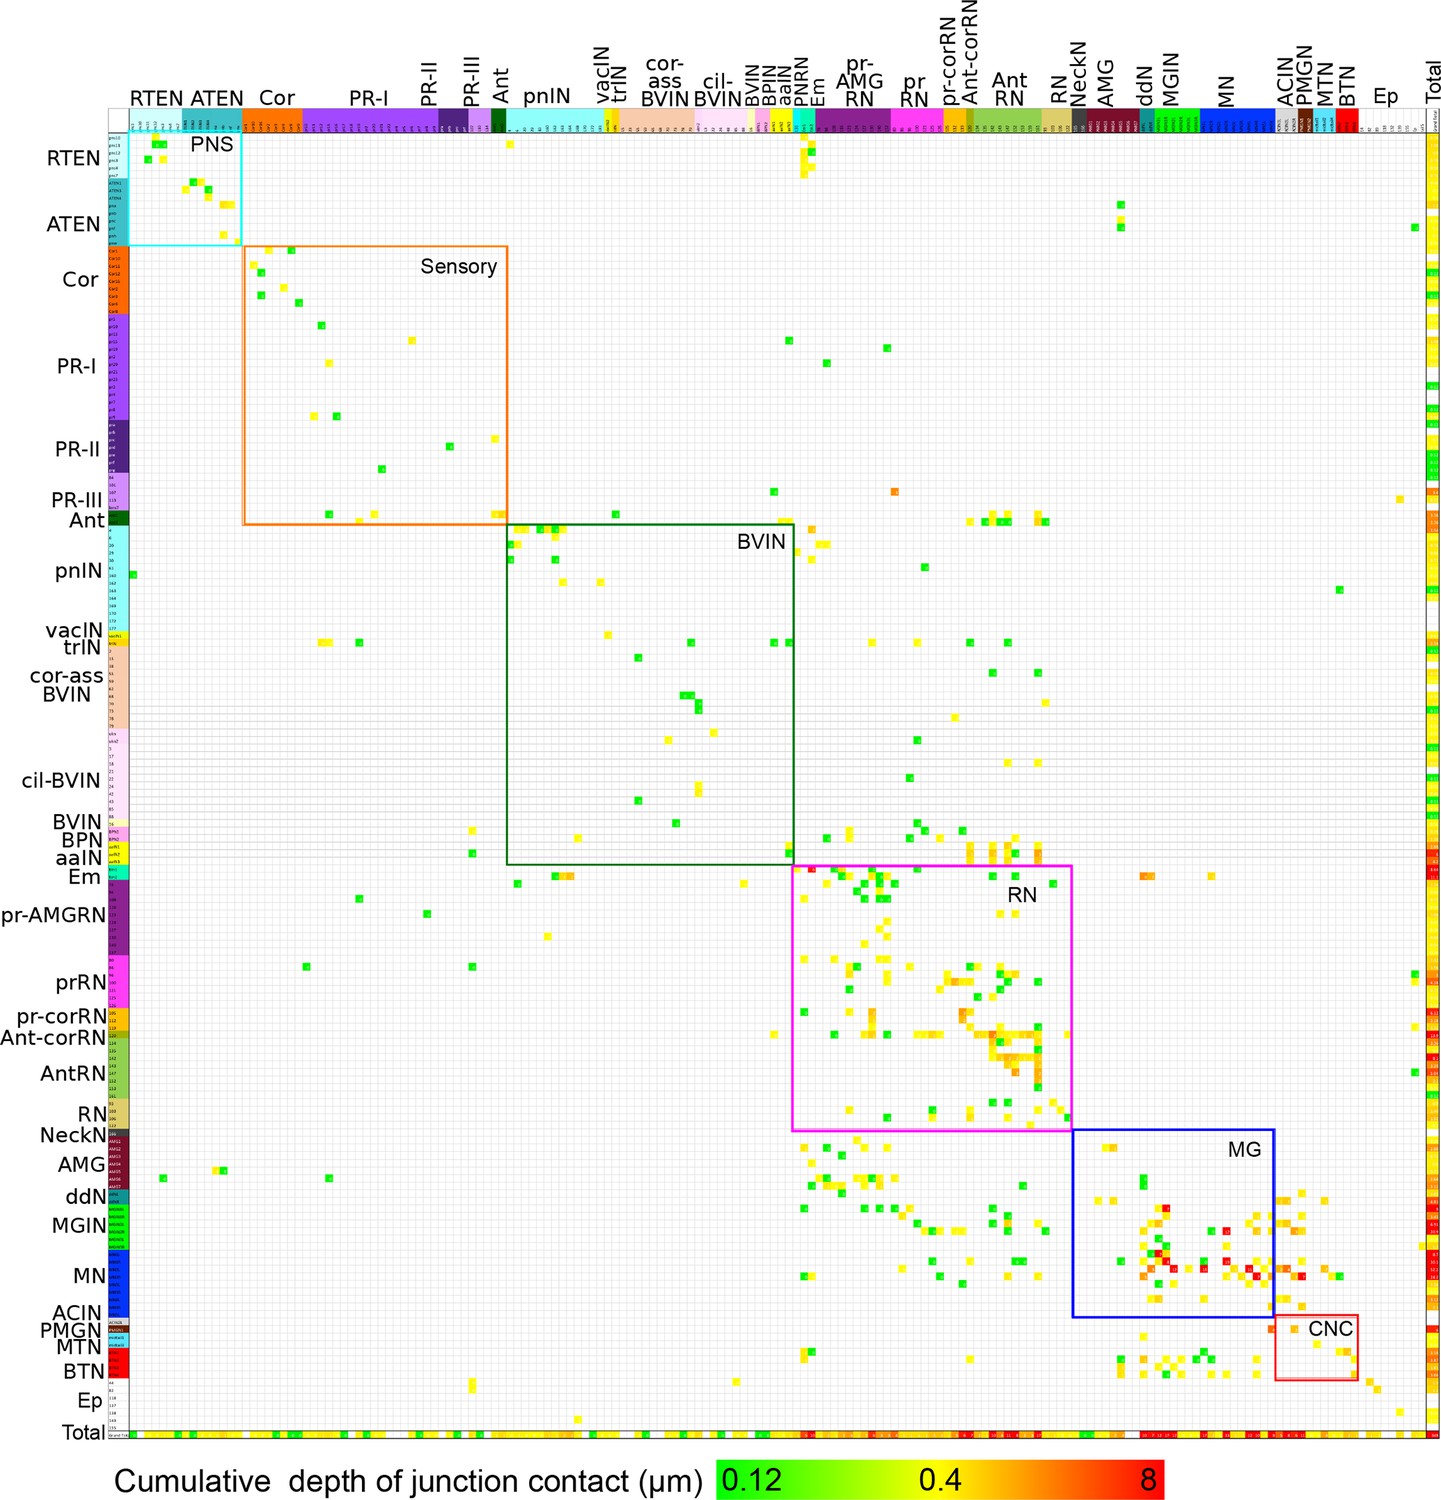
Entire matrix of putative gap junctions for the complete brain of a larva of Ciona intestinalis.
Shown for all neuron partners with a cumulative membrane contact depth of >0.12 µm, colour-coded by cell type and arranged in their rostro-caudal sequence along the longitudinal axis. Each intercept is colour-coded for the cumulative membrane contact depth of contacts made by that neuron upon its partner (key, bottom). The matrix is bounded by nested boxes between specific cell types. The smaller boxes enclosed by dashed lines indicate the connections between neurons of the same subtype. These are enclosed within boxes bounded by coloured lines, which indicate connections between neurons of the same brain region. Neurons of the brain vesicle are segregated into sensory neurons (orange lines, Sensory), intrinsic interneurons (pink lines, BVIN) and relay neurons (green lines, RN). Remaining boxes are as follows, neurons of the: PNS (PNS); motor ganglion (MG); and tail neurons of the caudal nerve cord (CNC). Matrix file provided in Figure 16—source data 2
Videos
Video 1
Symmetrical undulations of the tail in a swimming Ciona larva.
The tail lacks segmentation and in the 2 hr hatchling larva oscillates at 20–30 Hz at the juncture with the rostral trunk (Bone, 1992).
Video 2
Rotation of reconstructed sensory structures.
Reconstructed pigment cells (black) with otolith associated ciliated cells (yellow) and vacuoles observed in a variety of cell types (lime green). Outer segments reconstructed as spheres for group I photoreceptors projecting into the ocellus (darker purple) and group II photoreceptors projecting into the canal (lighter purple) and group III modified outer segments (blue), as well as coronet bulbous protrusions (orange).
Video 3
Rotation of reconstructed sensory neurons.
Reconstruction including transparent cell bodies illustrating pigment cells (black), group I (dark purple), group II (light purple) and group III (blue) photoreceptors with their outer segments reconstructed as spheres, lens cells (white) with their vacuoles reconstructed (bright green); also shown are vacuolated photoreceptor tract interneurons (lime), antenna cells (green), otolith associated ciliated cells (yellow), and coronet bulbous protrusions. Terminals of antenna and photoreceptor neurons are truncated in this view.
Video 4
Reconstruction of spheroids representing the cell body positions of sensory structures.
Pigment, photoreceptor and coronet cells with the bulbous protrusions (green) and photoreceptor outer segments (type I and type II: yellow; and type III: purple).
Video 5
Rotations of reconstructed ACINs decorated with their presynaptic sites.
Reconstructed ACINs with presynaptic sites colour-coded by postsynaptic cell type: basal lamina (black); motor neuron (blue), descending MG interneuron (green), bipolar tail neuron (red), and posterior MG descending neuron (brown)
Video 6
Animated reconstruction of the photoreceptor pathway.
Cell bodies, shown as spheroids, from photoreceptor through relay neurons to the motor ganglion. Cells are colour-coded as in Figure 1—source data 1
Video 7
Unilateral tail flick.
A larva exhibits a unilateral tail flick.
Video 8
Asymmetrical tail flicks.
A larva exhibits repeated tail flicks to the same side of the trunk.
Tables
Table 1
Numbers of synapses and gap junctions.
| Total no. | Total no. sections | Mean no. sections /contact | No. synapses> 1 section | Mean no. sections /contact >1 section | % Unpolarized | % Polyad | % Dcv | |
|---|---|---|---|---|---|---|---|---|
Synapses | 8617 | 30163 | 3.5 | 6618 | 4.3 | 5.2 | 10.7 | 8 |
Gap junctions | 3205 | 5765 | 1.8 | 1206 | 3.1 | ? | 3 | N/A |
-
Percentage (%) refers to the percentage of all synapses that are unpolarized (presynaptic vesicles on either side of the cleft between both neuron partners); polyadic (having >1 postsynaptic neurite); or containing dense-core vesicles (dcv) at the presynaptic site.
Table 2
Network statistics for networks of chemical synapses and putative gap junctions.
Statistic | Synaptic network | Gap junction network | ||
|---|---|---|---|---|
Full network | CNS neurons only | Full network | CNS neurons only (>0.06 μm) | |
Clustering co-efficient | 0.333 | 0.335 | 0.25 | 0.305 |
Connected component | 1 | 1 | 7 | 1 |
Network diameter | 9 | 7 | 8 | 8 |
Radius | 1 | 4 | 1 | 4 |
Shortest paths | 90% [41001] | 95% [29759] | 85% [31536] | 100% [16770] |
Characteristic path length | 2.684 | 2.541 | 3.078 | 2.775 |
Average number of neighbours | 20.169 | 20.689 | 8.674 | 10.369 |
Number of nodes | 213 | 177 | 193 | 130 |
Network density | 0 | 0 | 0.045 | 0.08 |
Network heterogeneity | - | - | 0.935 | 0.76 |
Number of self-loops | 19 | 16 | 13 | 9 |
Multi-edge node pairs | 826 | 699 | 30 | 22 |
Network centralisation | - | - | 0.191 | 0.257 |
-
Network statistics calculated using the Cytoscape Network Analyzer for network of chemical synapses (Synaptic network) and putative gap junctions (Gap Junction network) for both the full network thus including PNS neurons, muscle, ambiguous cells, and synapses onto basal lamina, as well as CNS neurons; and the network for CNS neurons only (CNS neurons). Note that the 'CNS neurons only' network excludes one additional isolated profile of a single branch of one photoreceptor terminal, probably pr10.
Table 3
Numbers of cells in the left, right and centre of the CNS and PNS.
Left | Centre | Right | |
|---|---|---|---|
Lens cells | 3 | ||
Pigment cells | 2 | ||
Total: Pigment and lens cells | 5 | ||
Coronet | 13* | 2 | 1 |
Photoreceptors | 37* | ||
Antenna neurons | 1 | 1 | |
Photoreceptor tract interneurons | 3* | ||
Anterior BV neurons | 29 | 1 | |
BV peripheral interneurons | 4 | 4 | 1 |
Bipolar neurons | 2 | ||
Anaxonal arborizing neurons | 1 | 2 | |
Posterior BV peripheral interneurons | 2 | 1 | 1 |
Photoreceptor relay neurons | 6 | ||
Photoreceptor-peripheral relay neurons | 2 | 2 | 6 |
Photoreceptor-coronet relay neurons | 2 | 1 | |
Antenna-coronet relay neuron | 1 | ||
Antenna relay neurons | 7 | 2 | |
Peripheral relay neurons | 2 | 1 | |
Relay interneurons | 5 | ||
Total: BV neurons | 72 | 14 | 57 |
Neck neurons | 1 | 1 | |
Total: Neck neurons | 1 | 1 | |
Ascending MG peripheral interneurons | 3 | 1 | 3 |
Descending decussating neurons | 1 | 1 | |
MG interneurons | 3 | 3 | |
Motor neurons | 5 | 5 | |
Total: MG neurons | 12 | 1 | 12 |
Ascending contralateral inhibitory neurons (ACINs) | 2 | 1 | |
Posterior MG interneurons | 2 | ||
Mid-tail neurons** | 2 | 2 | |
Total: CNC neurons | 4 | 5 | |
All CNS neurons | 88 | 15 | 75 |
Peripheral nervous system | |||
Bipolar tail neurons | 2 | 2 | |
Peripheral neurons (RTENa) | 6 | 6 | |
anterior ATENs | 2 | 2 | |
posterior ATENs | 4 | ||
DCENs | 4 | ||
Total: PNS neurons | 8 | 6 | 14 |
-
Neurons of the left side of the nervous system outnumber those of the right, which in turn outnumber those of the centre. All CNS neurons include known neurons that lack synapses (*).
-
**Additional mid-tail neurons which lay beyond the analysed region of the EM series are excluded from the totals.
Table 4
Input to left and right dorsal and medial muscle bands from motor neuron pairs at their neuromuscular junctions.
Motor neuron pair | Left muscle band | Right muscle band | Ratios | |||||||
|---|---|---|---|---|---|---|---|---|---|---|
Dorsal | Medial | Dorsal | Medial | Left: Right | ||||||
No. syn | No. sec | No. syn | No. sec | No. syn | No. sec | No. syn | No. sec | No. syn | No. sec | |
MN1 | 192 | 969 | 47 | 145 | 230 | 1181 | 130 | 558 | 40: 60 | 39: 61 |
MN2 | 224 | 1583 | 258 | 1636 | 46: 54 | 49: 51 | ||||
MN3 | 42 | 156 | 28 | 101 | 60: 40 | 61: 39 | ||||
MN4 | 45 | 189 | 30 | 116 | 60: 40 | 62: 38 | ||||
MN5 | 21 | 128 | 15 | 55 | 58: 42 | 70: 30 | ||||
-
Number of synapses (No. syn) and number of synaptic profiles (No. sec) provided for each motor neuron and left:right ratios expressed as percentages of neuromuscular junction input from left and right partners for each motor neuron pair.
Download links
A two-part list of links to download the article, or parts of the article, in various formats.
Downloads (link to download the article as PDF)
Open citations (links to open the citations from this article in various online reference manager services)
Cite this article (links to download the citations from this article in formats compatible with various reference manager tools)
The CNS connectome of a tadpole larva of Ciona intestinalis (L.) highlights sidedness in the brain of a chordate sibling
eLife 5:e16962.
https://doi.org/10.7554/eLife.16962


