Grid-cell representations in mental simulation
- Radboud University, The Netherlands
- Norwegian University of Science and Technology, Norway
- Institute of Cognitive Neuroscience, Ruhr University Bochum, Germany
Figures
Figure 1 with 3 supplements
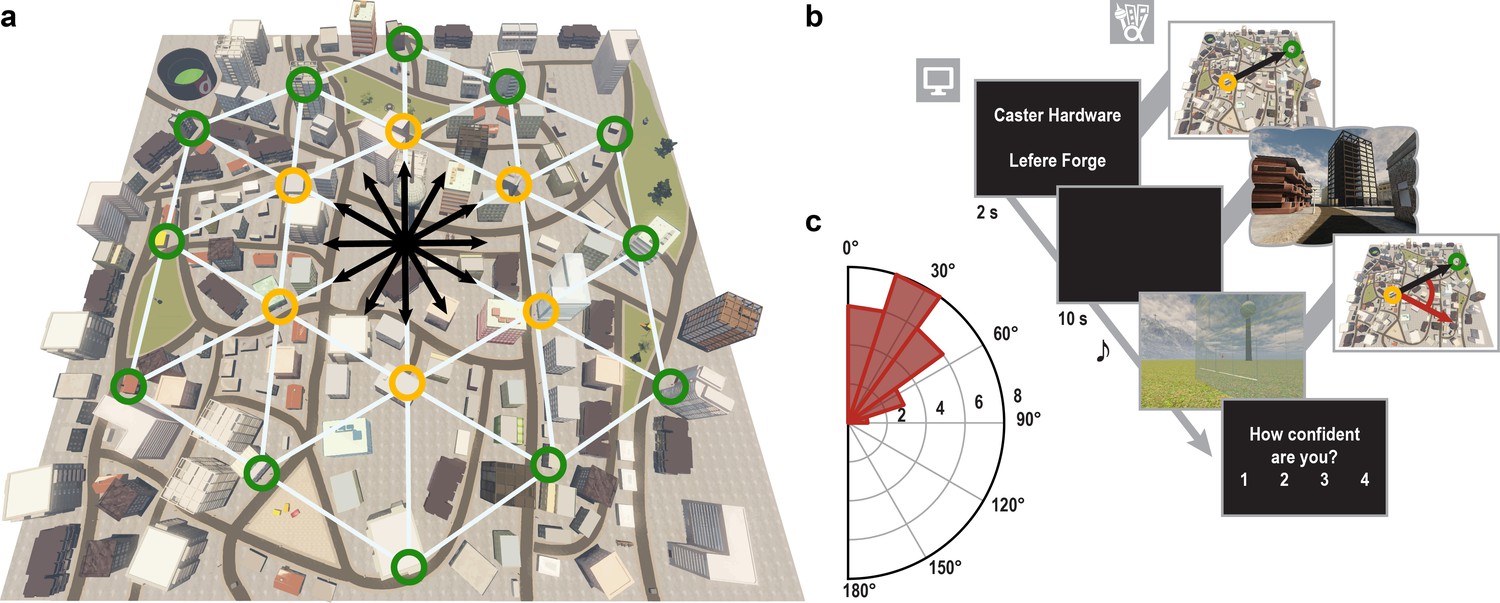
Direction-imagination task.
(a) Twelve evenly spaced directions were sampled using 18 buildings distributed regularly across Donderstown. We sampled each direction (indicated by black arrows) from different start locations (yellow circles), which dissociated the directions from visual features of imagined views (Figure 1—figure supplement 2), and employed a counterbalancing regime ensuring equal sampling of directions and start locations throughout the experiment (see Materials and methods). Buildings marked with a green circle served as target locations only. Importantly, the regular arrangement of building locations did not correspond to the street layout and was not revealed to participants, who experienced Donderstown only from a first-person perspective (see also Figure 1—figure supplement 1d). (b) Trials began with a cue indicating start (top building name) and target (bottom building name) location and thereby defining the relevant direction (black arrow). During an imagination period the screen was black and participants were instructed to imagine the view they would encounter when standing in front of the start building facing the direction of the target building. An auditory signal terminated the imagination period and participants indicated the imagined direction (red arrow) in a sparse VR environment, followed by a confidence judgment. Performance was measured as the absolute angular difference between the correct and the indicated direction (red arc). Note that only the bottom row of images was presented to participants, top row for illustration only. (c) Circular histogram of average absolute angular difference between correct and indicated directions across participants (mean error 33.68° ± 19.09° SD).
-
Figure 1—source data 1
Average absolute angular errors.
- https://doi.org/10.7554/eLife.17089.004
Figure 1—figure supplement 1
Overview of behavioral training.
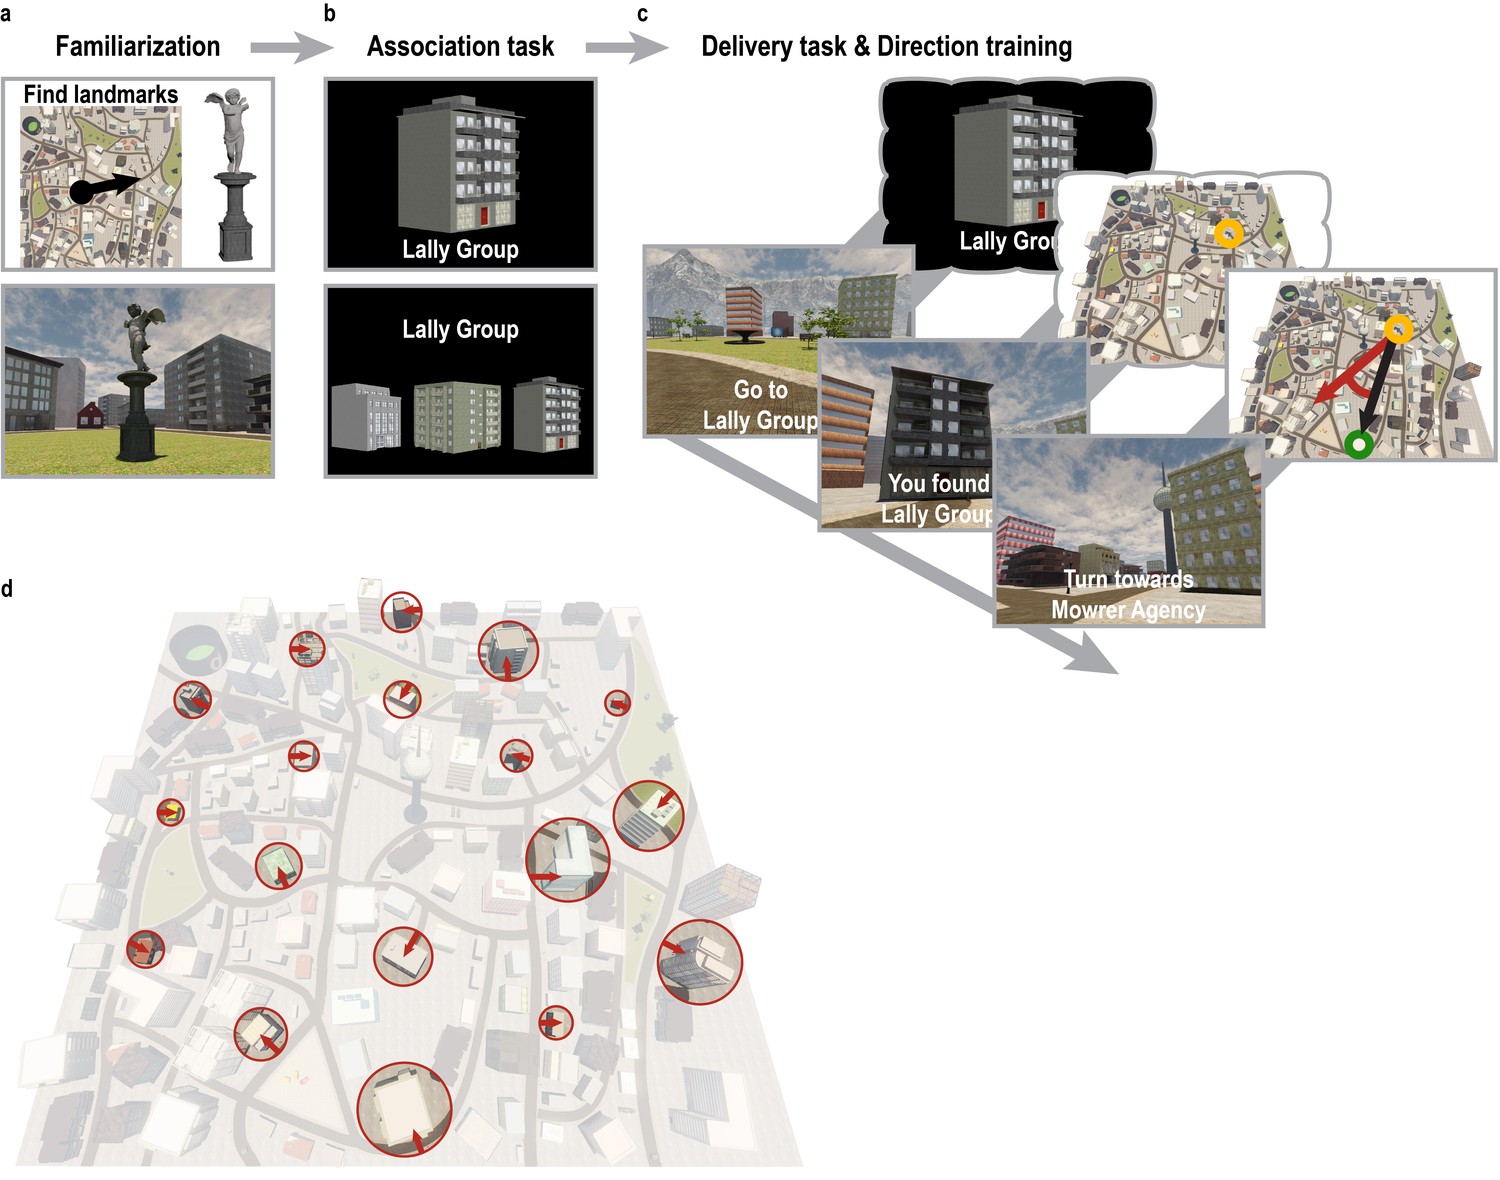
(a) To familiarize themselves with the controls of the computer game and the layout of the city, participants explored Donderstown for 10 min and searched for a set of landmarks irrelevant for the direction imagination task. This exploration phase was omitted in the second training session. The black circle and arrow on the map in the top panel indicate the participants’ position and orientation when first encountering Donderstown. (b) Subsequently, participants learned the names of 18 task-relevant buildings (top) to criterion. Knowledge of the building names was assessed in test blocks during which participants had to select the building belonging to the presented name from a display of three buildings by pressing one of three buttons (bottom). (c) For the remainder of the session, participants were trained on the building locations in Donderstown. Bottom row shows the trial structure as presented to the participants, top row for illustration only. Participants were instructed to navigate to the building whose name was presented on the screen. Once the building was located, participants encoded the position and were then asked to estimate the direction to the following target building. Performance was measured as the number of buildings located during the training session and the absolute angular difference between the estimated direction and the correct direction as defined by the current location and the new target building. (d) Overview of Donderstown highlighting the task-relevant buildings, which largely differed in features salient from the first-person perspective such as size, shape and rotation with respect to the hexagonal building layout (red arrows), which makes an influence of the regular arrangement of their entrances on participants’ cognitive representation of the city unlikely.
Figure 1—figure supplement 2
Sampling of directions in the imagination task.
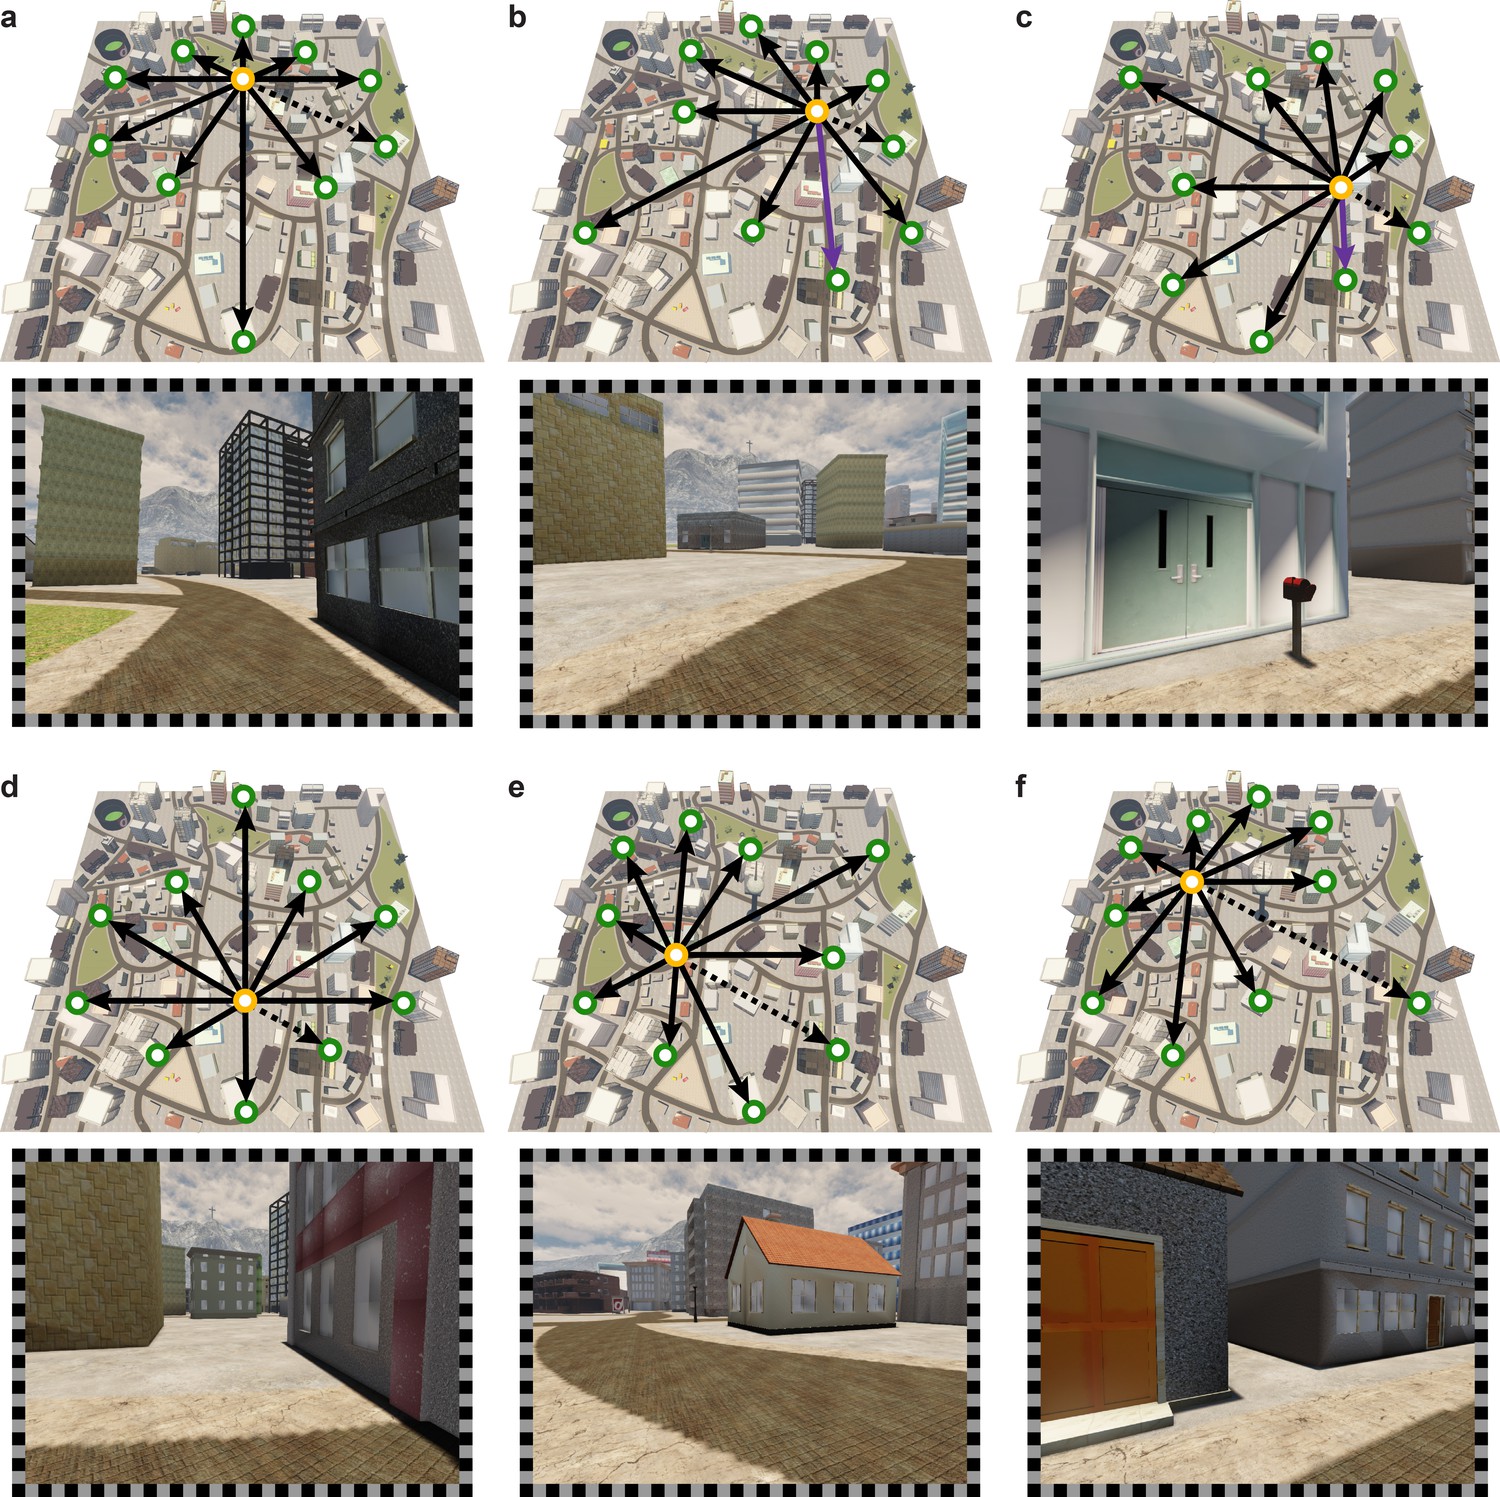
(a–f) From each of the six start locations (yellow circles) ten directions were sampled. Directions (black arrows) were defined based on the angle of the vector connecting the start and the target locations (green circles). Screenshots show view from Donderstown corresponding to direction indicated by dashed arrow. Note that start locations could also be goal locations. The building combinations used in the direction imagination task were carefully counterbalanced so that in a task block of 24 trials each direction was sampled twice, each start building served as a start location four times and each building combination did not occur more than twice throughout the experiment (see Materials and methods). Trials sampling directions using buildings located on the same street (purple in b and c) were subject to an additional control analysis (see Materials and methods).
Figure 1—figure supplement 3
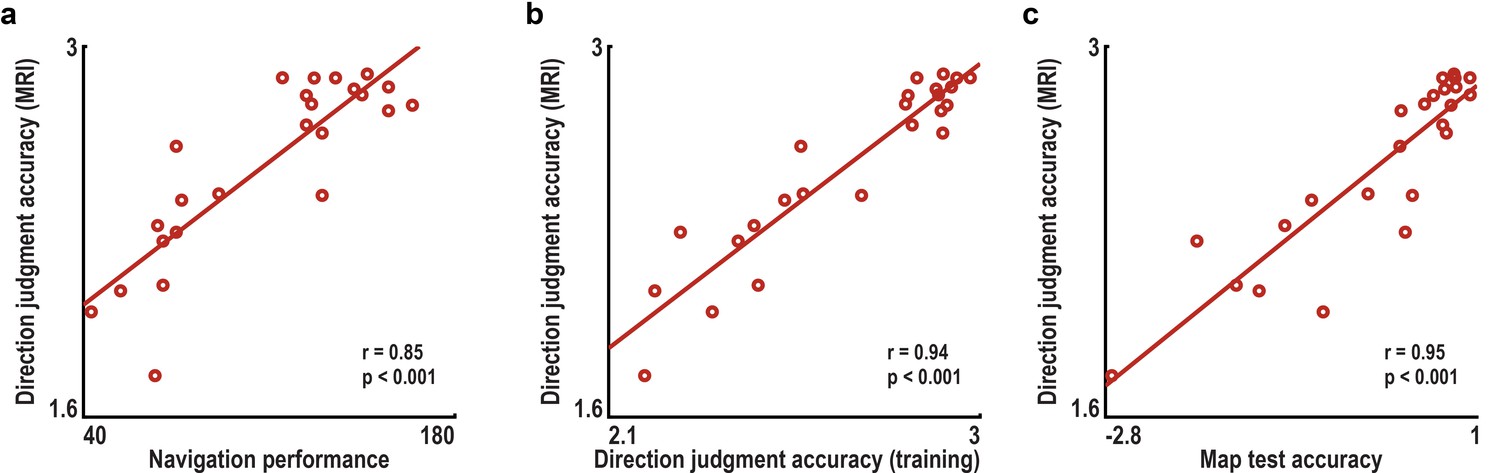
Accuracy of direction judgments during imagination task is related to behavioral performance during training and a post-scan map test.
(a) Across subjects, the accuracy of direction judgments in the direction imagination task (π minus the mean angular difference between the correct and indicated directions in radians) correlated significantly with navigation success indexed by the number of buildings found during training. (b) Accuracy of direction judgments during the training sessions also correlated highly with performance during the imagination task. (c) Additionally, performance during the imagination task was correlated with z-scored accuracy in the post-scan map test. All correlations remained significant when controlling for variability in the time spent navigating the VR city during training using partial correlations (partial correlations coefficients r>0.84, all p<0.001). Correlations were also significant when calculated between the accuracy of direction judgments and training performance measures separately for the two training sessions (all correlations coefficients r>0.80, all p<0.001).
Figure 2 with 2 supplements
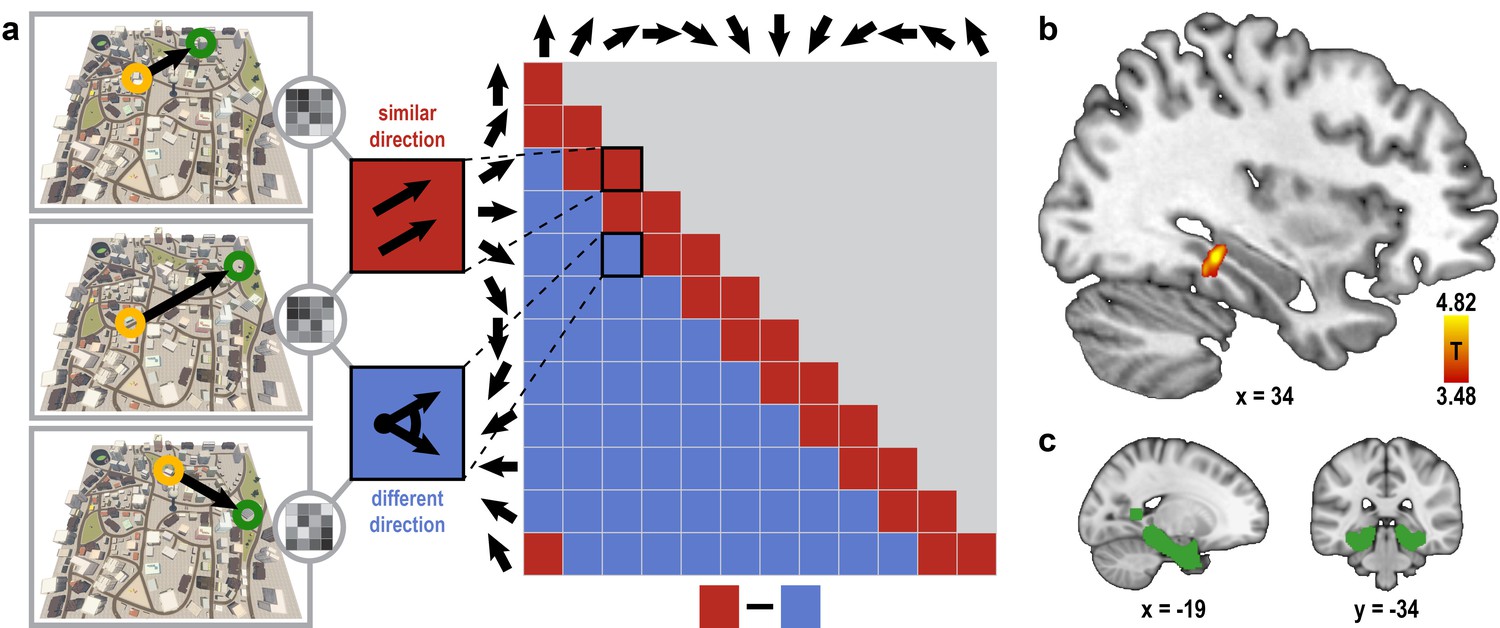
Absolute directional coding in posterior parahippocampal gyrus.
(a) Analysis logic of the one-fold directional analysis for three example trials. High pattern similarity was predicted for pairs of trials sampling similar directions with a maximum angular difference of 30° (red) compared to trials sampling directions 60° or more apart (blue). Note that for illustration purposes the predicted similarity matrix is shown for comparisons across conditions, not single trials. (b) Searchlight results show a significant cluster of voxels in the posterior parahippocampal gyrus (peak voxel MNI coordinates: 34 -34 -10; T23 = 4.82, p = 0.024 corrected for multiple comparisons using small-volume correction) with higher pattern similarity for trials sampling similar directions compared to trials sampling dissimilar directions. Results are shown on the structural MNI template. For display purposes, the statistical map is thresholded at p<0.001 uncorrected. (c) Sagittal and coronal view of the mask used to correct for multiple comparisons (see Materials and methods) displayed on the MNI template brain.
-
Figure 2—source data 1
Searchlight results for absolute directional coding analysis.
- https://doi.org/10.7554/eLife.17089.009
Figure 2—figure supplement 1
Increased pattern similarity for similar directions after excluding trial pairs sampling a direction with the same combination of buildings.
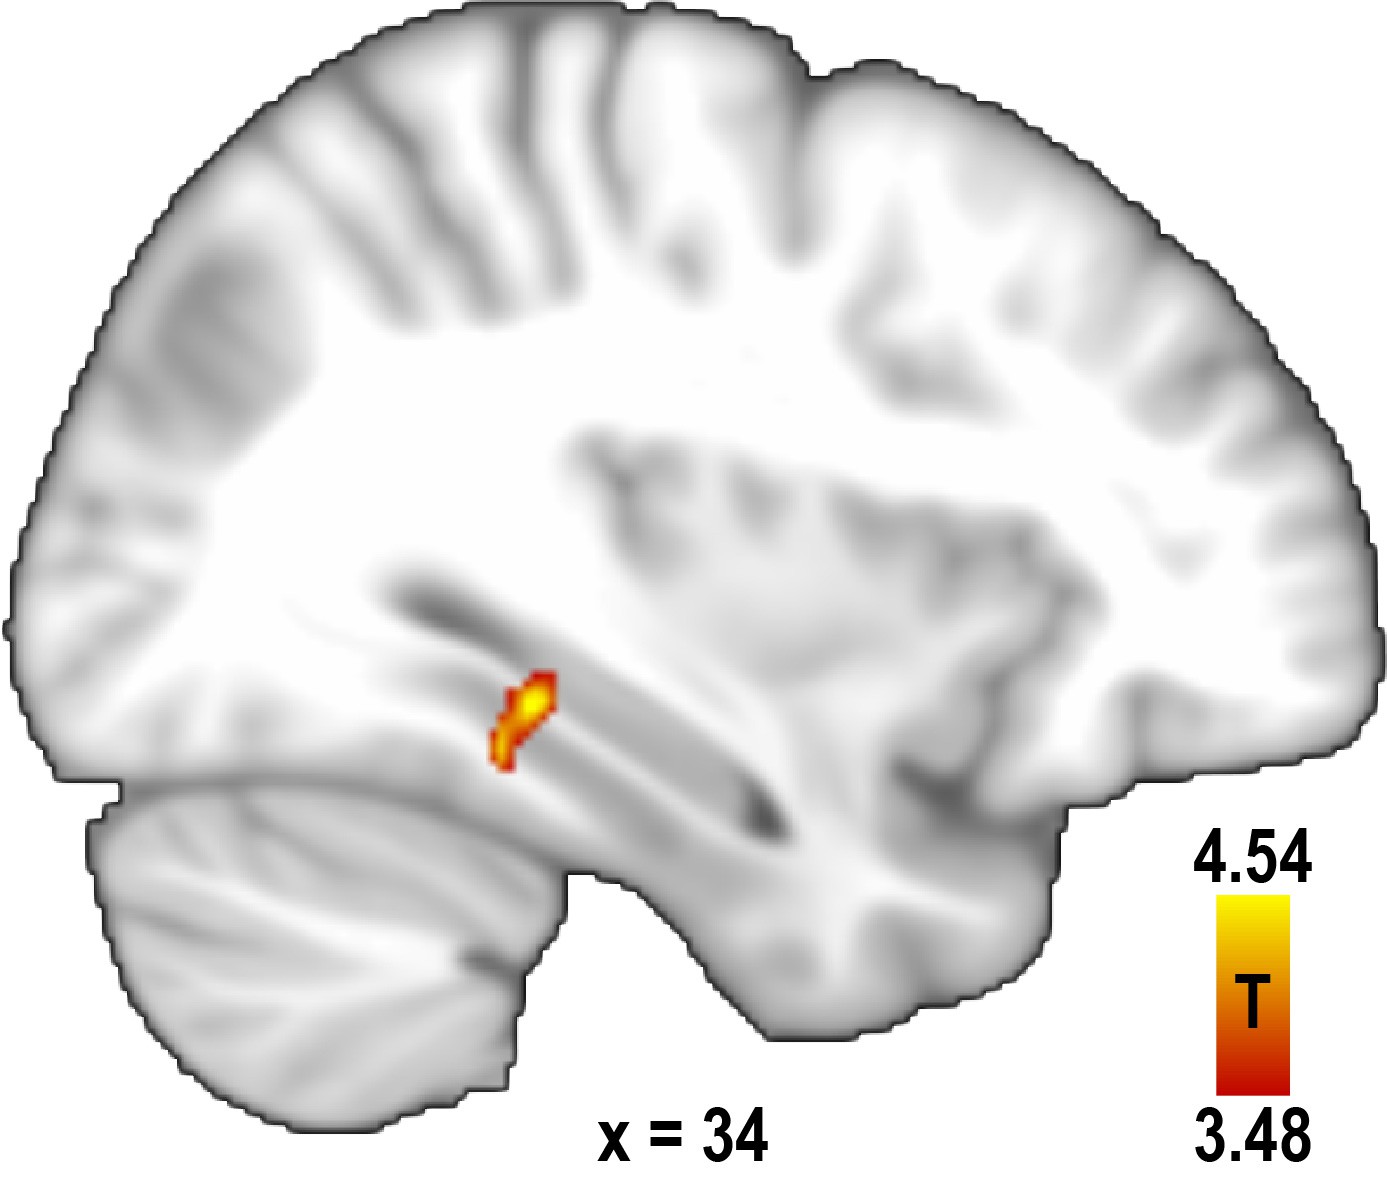
To control for the possibility of increased pattern similarity in the parahippocampal gyrus for similar direction pairs being due to the imagination of identical scenes, we excluded trial pairs from the analysis in which the same combination of start and target building was used. This revealed a significant cluster of voxels (peak voxel MNI coordinates: 34 -36 -10, T23 = 4.54, p = 0.042 corrected for multiple comparisons using small volume correction) very similar to the one observed in the main analysis (see Figure 2b). For display purposes, the statistical map is thresholded at p<0.001 uncorrected.
Figure 2—figure supplement 2

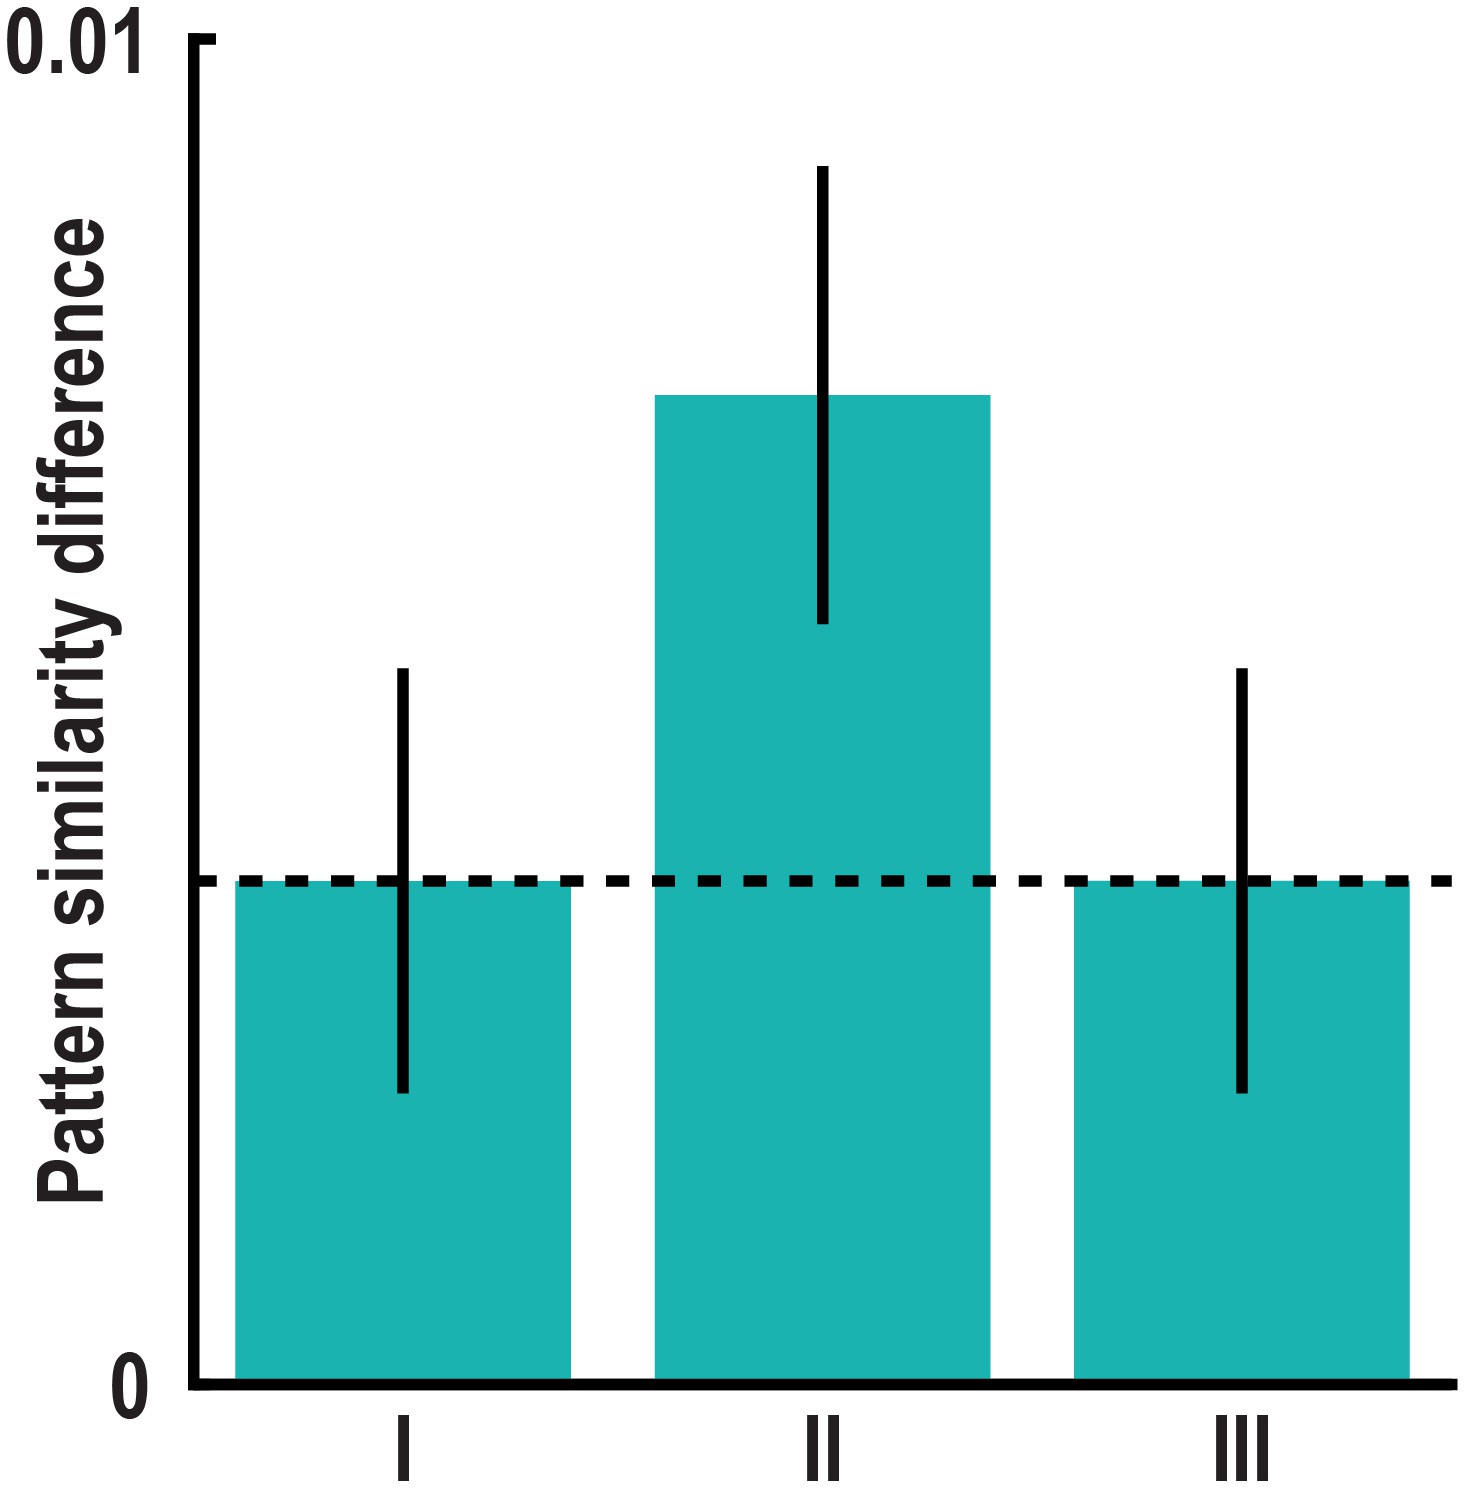
Absolute directional coding during imagination is independent of locations and distances in Donderstown.
(a) Pattern similarity difference between trial pairs sampling similar and dissimilar directions in the peak voxel of the main absolute directional coding analysis (Figure 2) after exclusion of comparisons with trials using the same start (bar I) and the same target location (bar II). Both T23 > 3.00, both p<0.007. (b) We considered the distances between start and target locations in a trial pair by controlling for three distance measures, which differed between pairs of trials sampling similar and dissimilar directions. The distance measures are illustrated based on two example trials. For each trial pair, we calculated (I) the mean length of the vectors connecting start and target location, (II) the difference in length of the two vectors and (III) the mean length of the vectors connecting all four relevant locations of a pair. In separate GLMs we used the distance measures as predictors of pairwise pattern similarity. (c) Mean pattern similarity difference in peak voxel of cluster from main absolute directional coding analysis (Figure 2) between trial pairs sampling similar directions and pairs sampling dissimilar directions computed on the residuals of the GLMs. With this approach we controlled for pattern similarity due to (I) the average distance from start to target location in a trial pair, (II) the difference in distance from start to target location in a trial pair and (III) the average distance between all four buildings in a trial pair (see Materials and methods). All T23 > 3.60, all p<0.001. Bars in a and c show mean pattern similarity difference with error bars reflecting S.E.M., dashed line shows mean pattern similarity difference in peak voxel from main analysis.
Figure 3 with 10 supplements
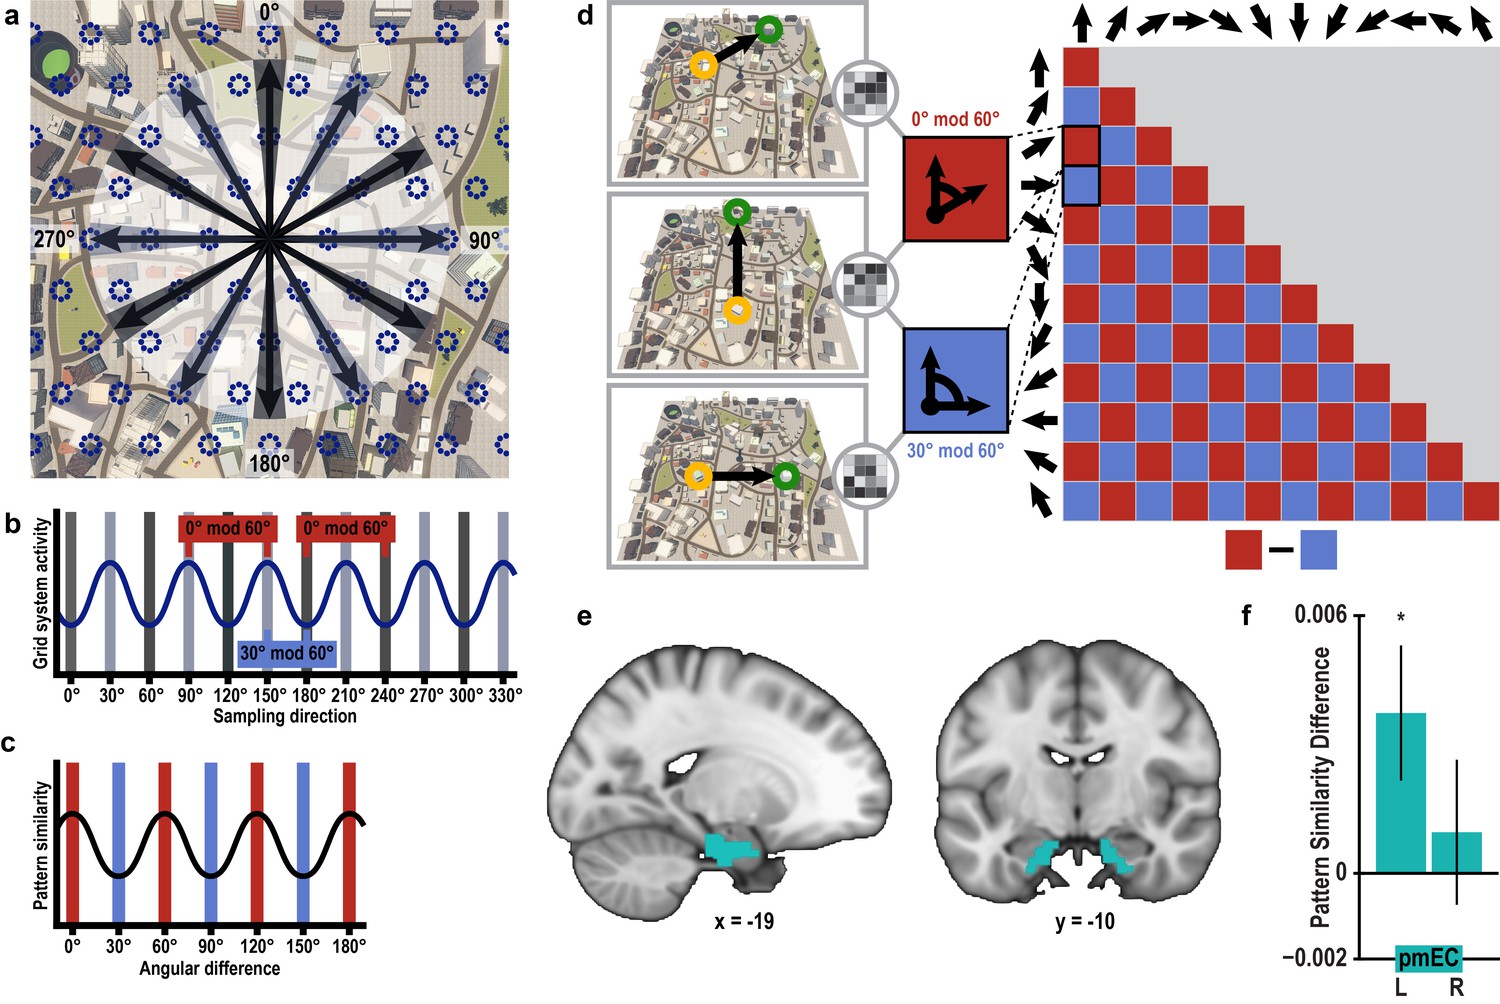
Grid-like representations during imagination.
(a) Six-fold symmetric firing fields of a hypothetical grid cell (dark blue dotted circles) superimposed on an aerial view of Donderstown. Black arrows indicate the twelve sampled directions; light and dark shading highlights directions (multiples of) 60° apart. For illustration purposes, the grid orientation is aligned to the sampled directions; see Figure 3—figure supplement 1 for a different example. (b) The firing rate of the hypothetical response of the grid-cell system as a function of direction, showing a 60° modulation. Shading displays sampling of directions and red and blue markers indicate the two conditions. Note that the oscillatory firing pattern is sampled at the same phase in the 0° modulo 60° condition, but at different phases in the 30° modulo 60° condition. (c) Based on this, we expected a 60° modulation of fMRI pattern similarity values when comparing trial pairs based on the angular difference of their sampled directions. Red and blue shading illustrates the two conditions. (d) Specifically, we predicted higher pattern similarity for trial pairs with a remainder of 0° (0° modulo 60° condition, red) compared to trial pairs with a remainder of 30° (30° modulo 60° condition, blue), when dividing the angular difference of the pair’s sampling directions by 60°. Note that for illustration purposes the predicted similarity matrix is shown for comparisons across conditions, not single trials. (e) ROI mask for posterior medial entorhinal cortex (pmEC) from previous report (Navarro Schröder et al., 2015). (f) Pattern similarity difference (mean and S.E.M.) between the two conditions. The left pmEC exhibited a significant 60° modulation of pattern similarity. No significant differences in pattern similarity were observed in the right pmEC (T23 = 0.57, p = 0.58).
-
Figure 3—source data 1
Pattern similarity difference between 0° modulo 60° and 30° modulo 60° condition in left and right posterior medial entorhinal cortex.
- https://doi.org/10.7554/eLife.17089.013
Figure 3—figure supplement 1

Rationale of 60° modulation analysis.
(a) Six-fold symmetric firing fields of a hypothetical grid cell (dark blue dotted circles) superimposed on a top-down view of Donderstown. Black arrows indicate the twelve sampled directions. Light and dark shading indicates directions (multiples of) 60° apart. (b) The firing rate of the hypothetical grid cell as a function of sampling direction exhibits a 60° modulation. Shading shows sampled directions with red and blue markers illustrating the two conditions. Note that the oscillatory firing pattern is sampled at the same phase in the 0° modulo 60° condition, but at different phases in the 30° modulo 60° condition. (c) Based on this, we expected increased pattern similarity when comparing trial pairs from the 0° modulo 60° condition to trial pairs from the 30° modulo 60° condition. The difference between the conditions is smaller than in Figure 3c due to the different sampling of directions with respect to the grid orientation.
Figure 3—figure supplement 2
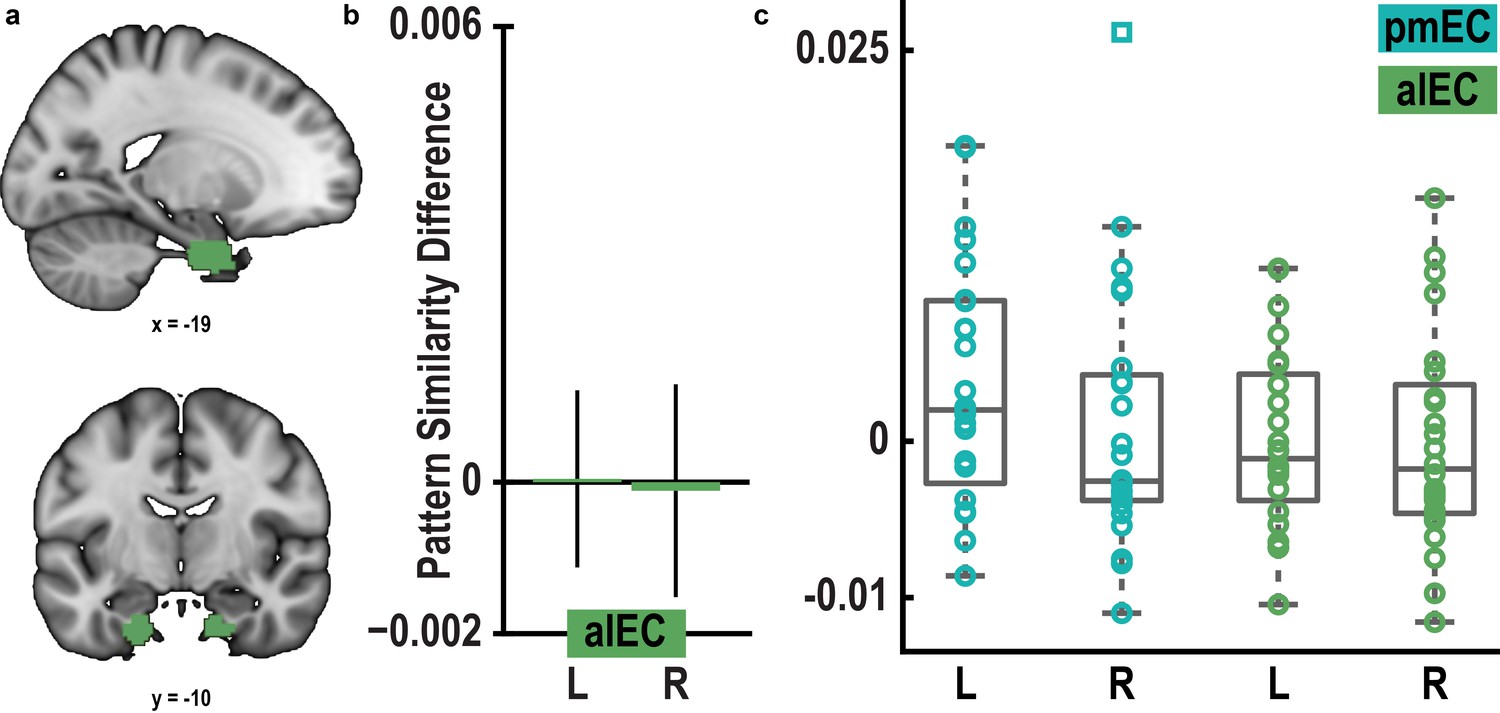
Pattern similarity difference between 0° modulo 60° condition and 30° modulo 60° condition in pmEC and alEC.
(a) ROI mask for anterior lateral entorhinal cortex (alEC) based on our previous report (Navarro Schröder et al., 2015). (b) Pattern similarity did not differ between the 0° modulo 60° and the 30° modulo 60° condition in alEC (T23 = 0.04, p = 0.97 and T23 = − 0.08, p = 0.94 for left and right alEC, respectively). (c) Colored markers show pattern similarity difference for each participant in pmEC and alEC. Boxplots indicate 25th and 75th percentile with the middle line representing median pattern similarity difference across participants. Whiskers extend to most extreme data points not considered outliers. Data points defined as outliers (values more than 1.5 times the interquartile range above the 75th percentile or more than 1.5 times the interquartile range below the 25th percentile) are represented by square markers.
Figure 3—figure supplement 3
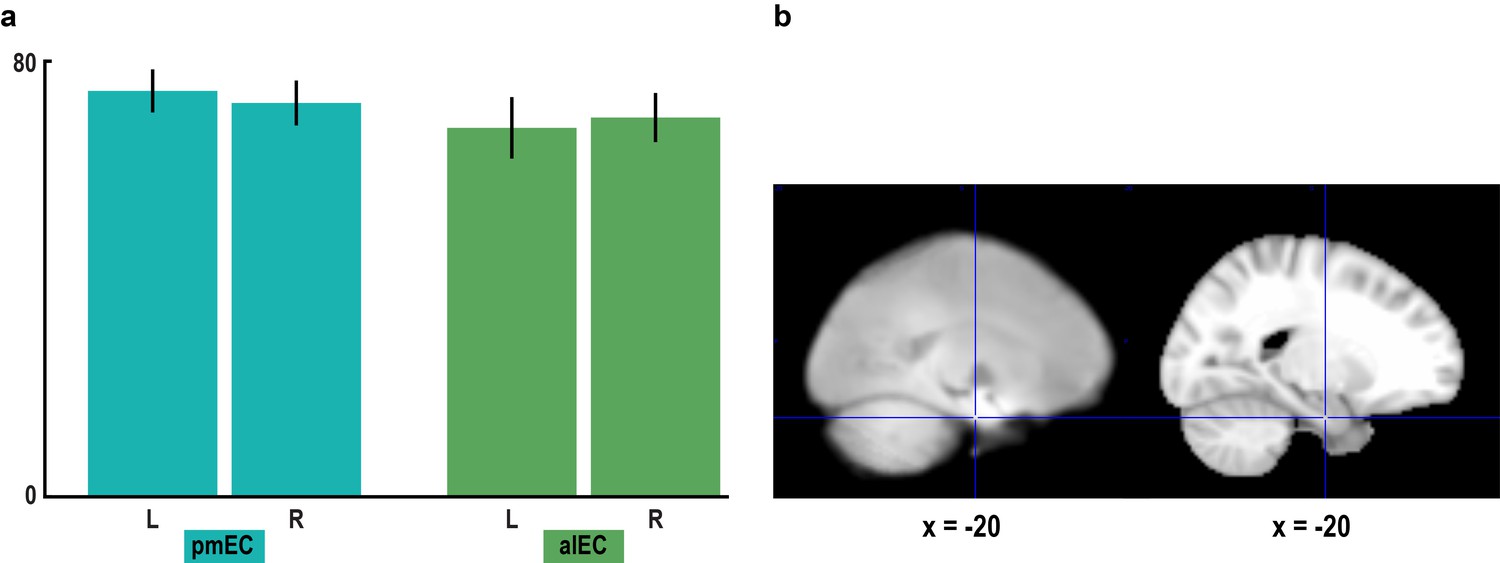
Signal quality in the entorhinal cortex.
(a) To assess signal quality in pmEC and alEC, we computed the temporal signal-to-noise ratio (tSNR, see Materials and methods). A repeated-measures ANOVA revealed neither a main effect of region (F1,23 = 0.60, p = 0.448) or hemisphere (F1,23 = 0.00, p = 0.953) nor an interaction between the factors region and hemisphere (F1,23 = 0.97, p = 0.336). Bars represent mean and S.E.M. (b) Left slice shows the mean functional scan averaged across participants. The mean functional images from the four fMRI runs were averaged for each participant before averaging the resulting mean images across participants. Right slice shows the corresponding section of the MNI template. Note that for some participants the edge of the superior parietal lobe was outside the field of view.
Figure 3—figure supplement 4
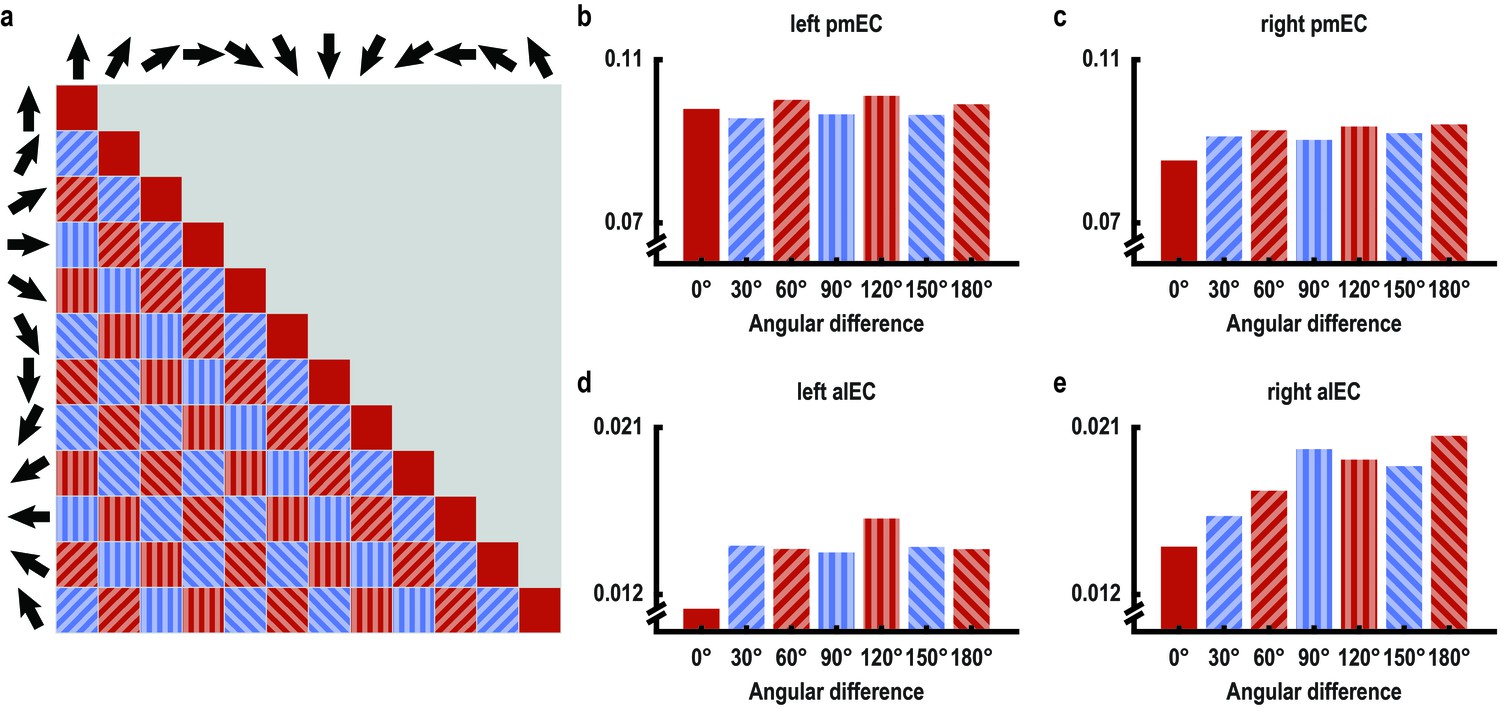
60° periodicity of pattern similarity is consistent across angular differences only in left posterior medial entorhinal cortex.
(a) Pattern similarity was analyzed based on the angular differences of the directions sampled in a trial pair. High pattern similarity was predicted for pairs in the 0° modulo 60° condition (red) in contrast to pairs in the 30° modulo 60° condition (blue). Filled pattern and color indicates angular differences and corresponds to bars in (b–e), which visualize average pattern similarity for all possible angular differences for exploratory purposes in the entorhinal ROIs. Note the consistent 60° periodicity of the pattern similarity profile across angular differences in left pmEC. A statistical test was performed on the within-subject difference between the two conditions and was significant in left pmEC only (T23 = 2.37, p = 0.027, for all other ROIs, p>0.5). Error bars for each angular difference would not reflect the statistical test performed and are therefore omitted.
Figure 3—figure supplement 5
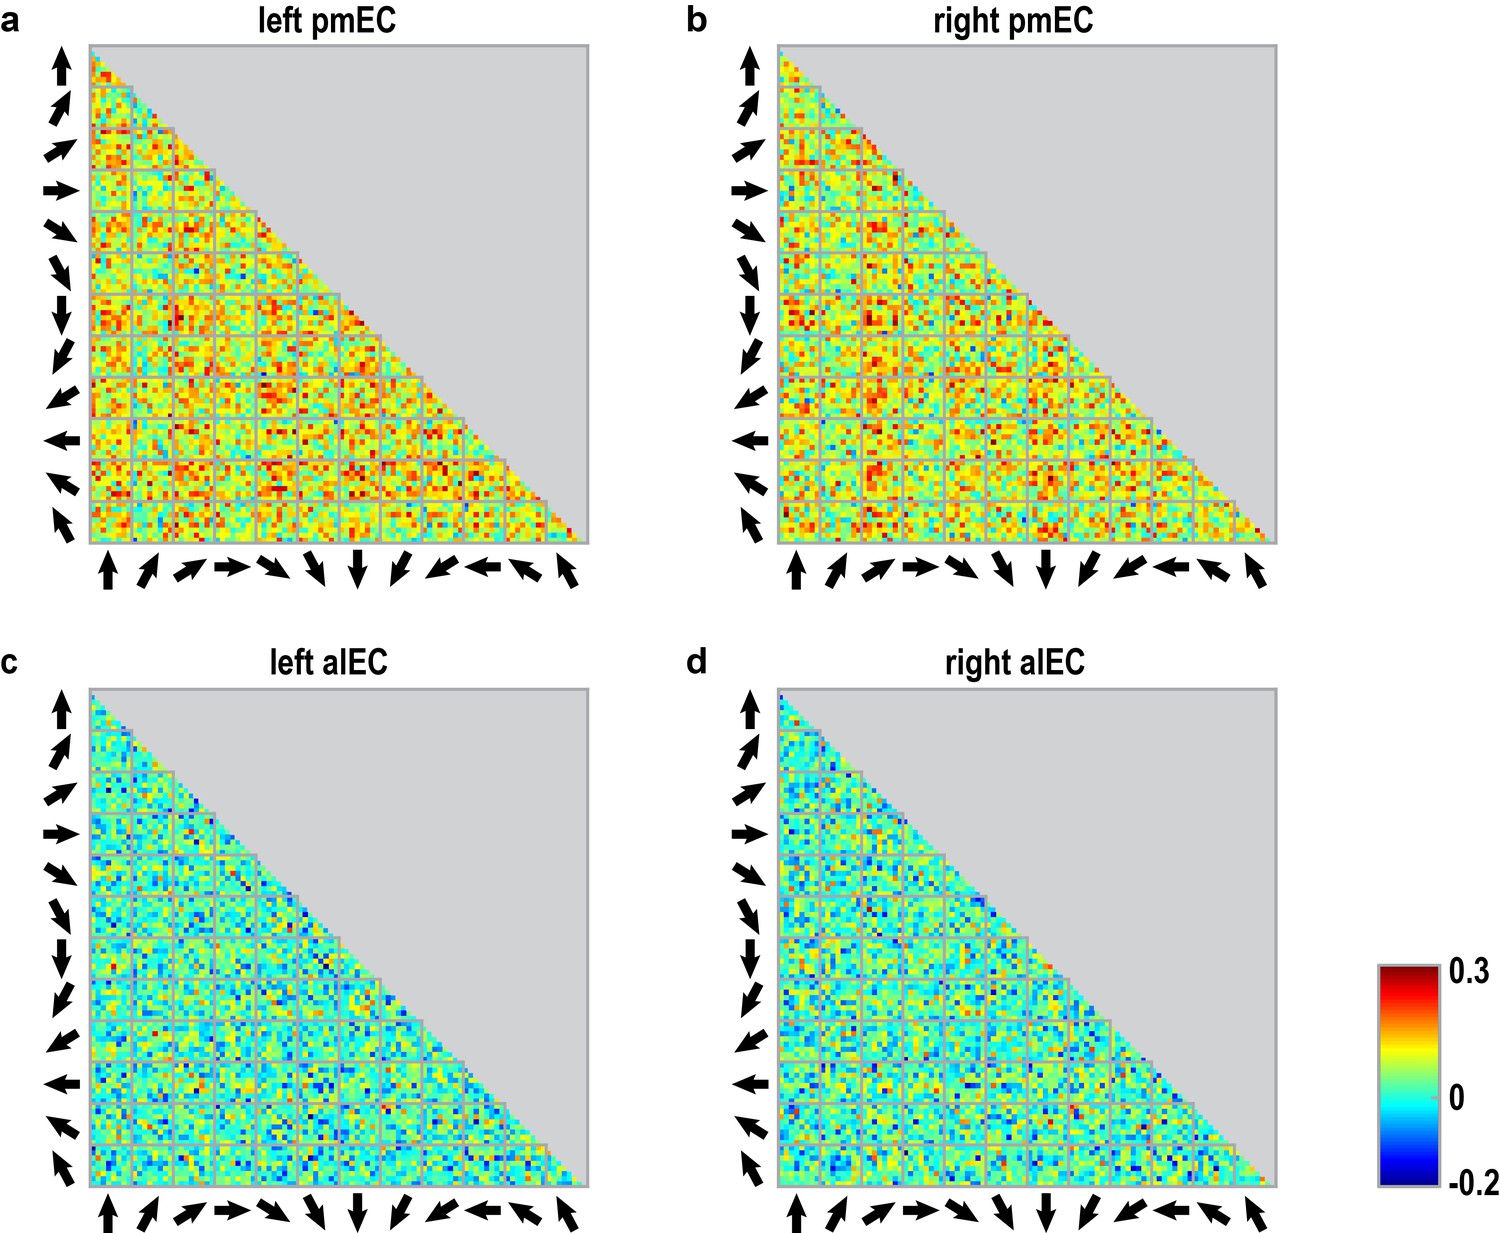
Pattern similarity structure across pair-wise comparisons of trials for entorhinal ROIs.
(a–d) Matrices show the pair-wise correlations between voxel patterns in the subregions of the entorhinal cortex (a: left pmEC; b: right pmEC; c: left alEC; d: right alEC) across all possible trial comparisons averaged across participants. Arrows signal sampled directions in a given pair of trials. Colorbar indicates size of the correlations in panels (a–d).
Figure 3—figure supplement 6
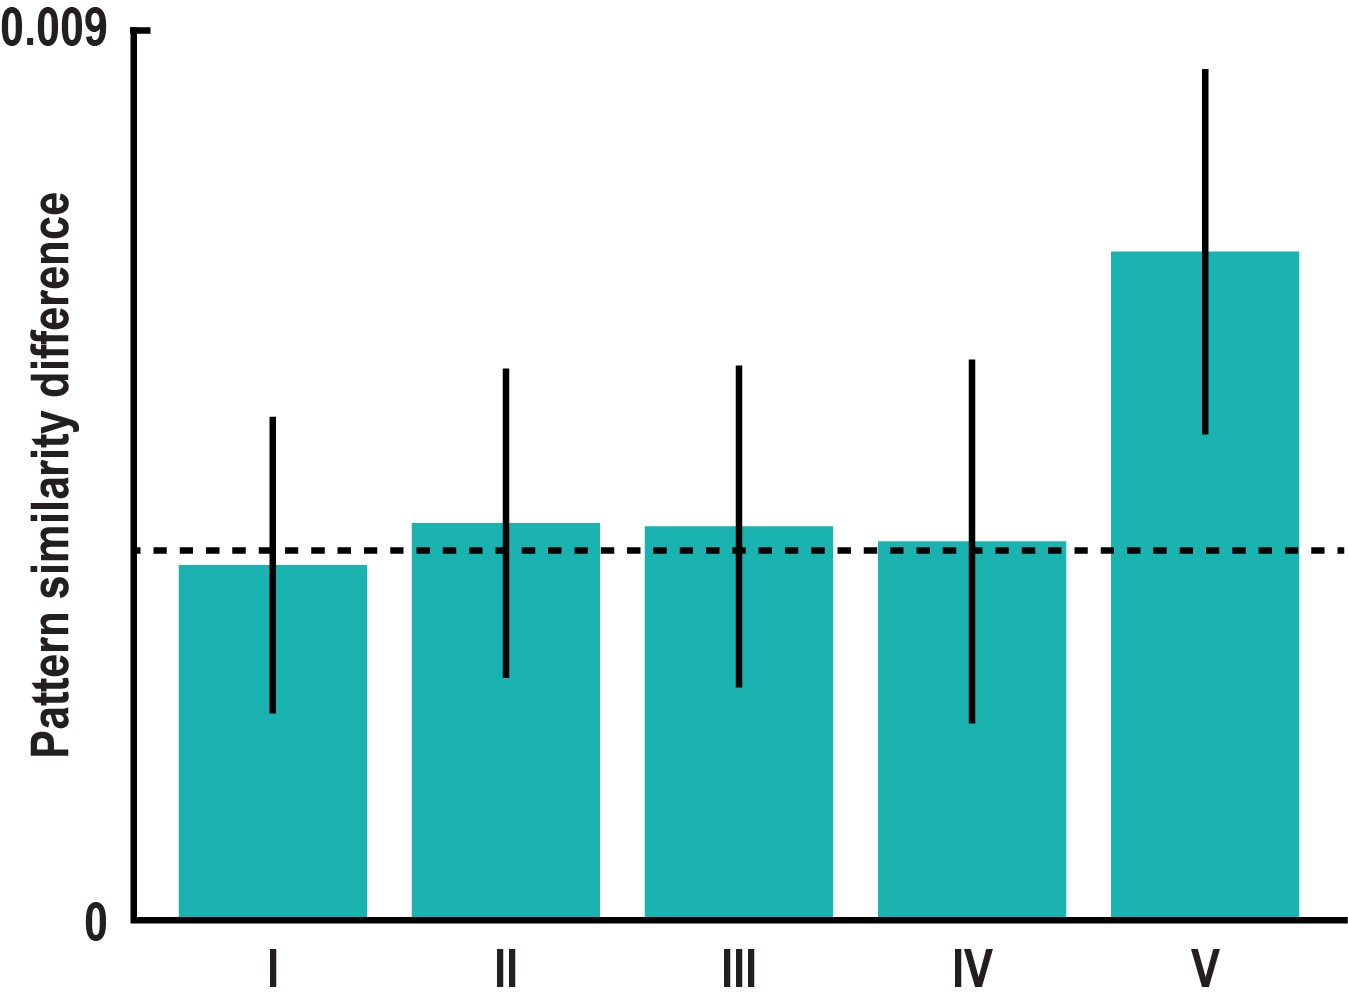
60° modulation of pattern similarity during imagination is not driven by specifics of task design.
(a) Pattern similarity difference between the 0° modulo 60° and the 30° modulo 60° condition remained significant in left pmEC after controlling for specifics of the design. Bars show the mean pattern similarity difference after excluding trial pairs with (I) the same start location (T23 = 2.39, p = 0.025), (II) the same target location (T23 = 2.57, p = 0.017), (III) the same combination of start and target location (T23 = 2.45, p = 0.022), (IV) pairs from the same run (T23 = 2.08, p = 0.049) and (V) pairs with target locations in the inner ring of buildings (T23 = 5.29, p<0.001; see Materials and methods). This excludes potential influences of imagining the same start or same target location, the same combination of start and target location and temporal auto-correlations on the effect. Error bars indicate S.E.M., dashed line shows mean pattern similarity difference in left pmEC from main analysis (Figure 3b).
Figure 3—figure supplement 7
60° modulation of pattern similarity during imagination after controlling for distance measures.
We controlled for the distances between start and target locations in a trial pair using three distance measures, which differed between the 0° modulo 60° and the 30° modulo 60° condition (see Materials and methods). The distance measures are illustrated in Figure 2—figure supplement 2b. In separate GLMs we used the distance measures as predictors of pairwise pattern similarity and computed the mean pattern similarity difference between the 0° modulo 60° and the 30° modulo 60° condition on the residuals of these GLMs. With this approach we controlled for pattern similarity due to (I) the average distance from start to target location in a trial pair, (II) the difference in distance from start to target location in a trial pair and (III) the average distance between all four buildings in a trial pair (see Materials and methods). All T23 > 2.36, all p<0.03, error bars indicate S.E.M., dashed line shows mean pattern similarity difference in left pmEC from main analysis (Figure 3b). The effect also remained significant when using binary (high vs. low) distance predictors (all T23 > 2.44, all p<0.03).
Figure 3—figure supplement 8
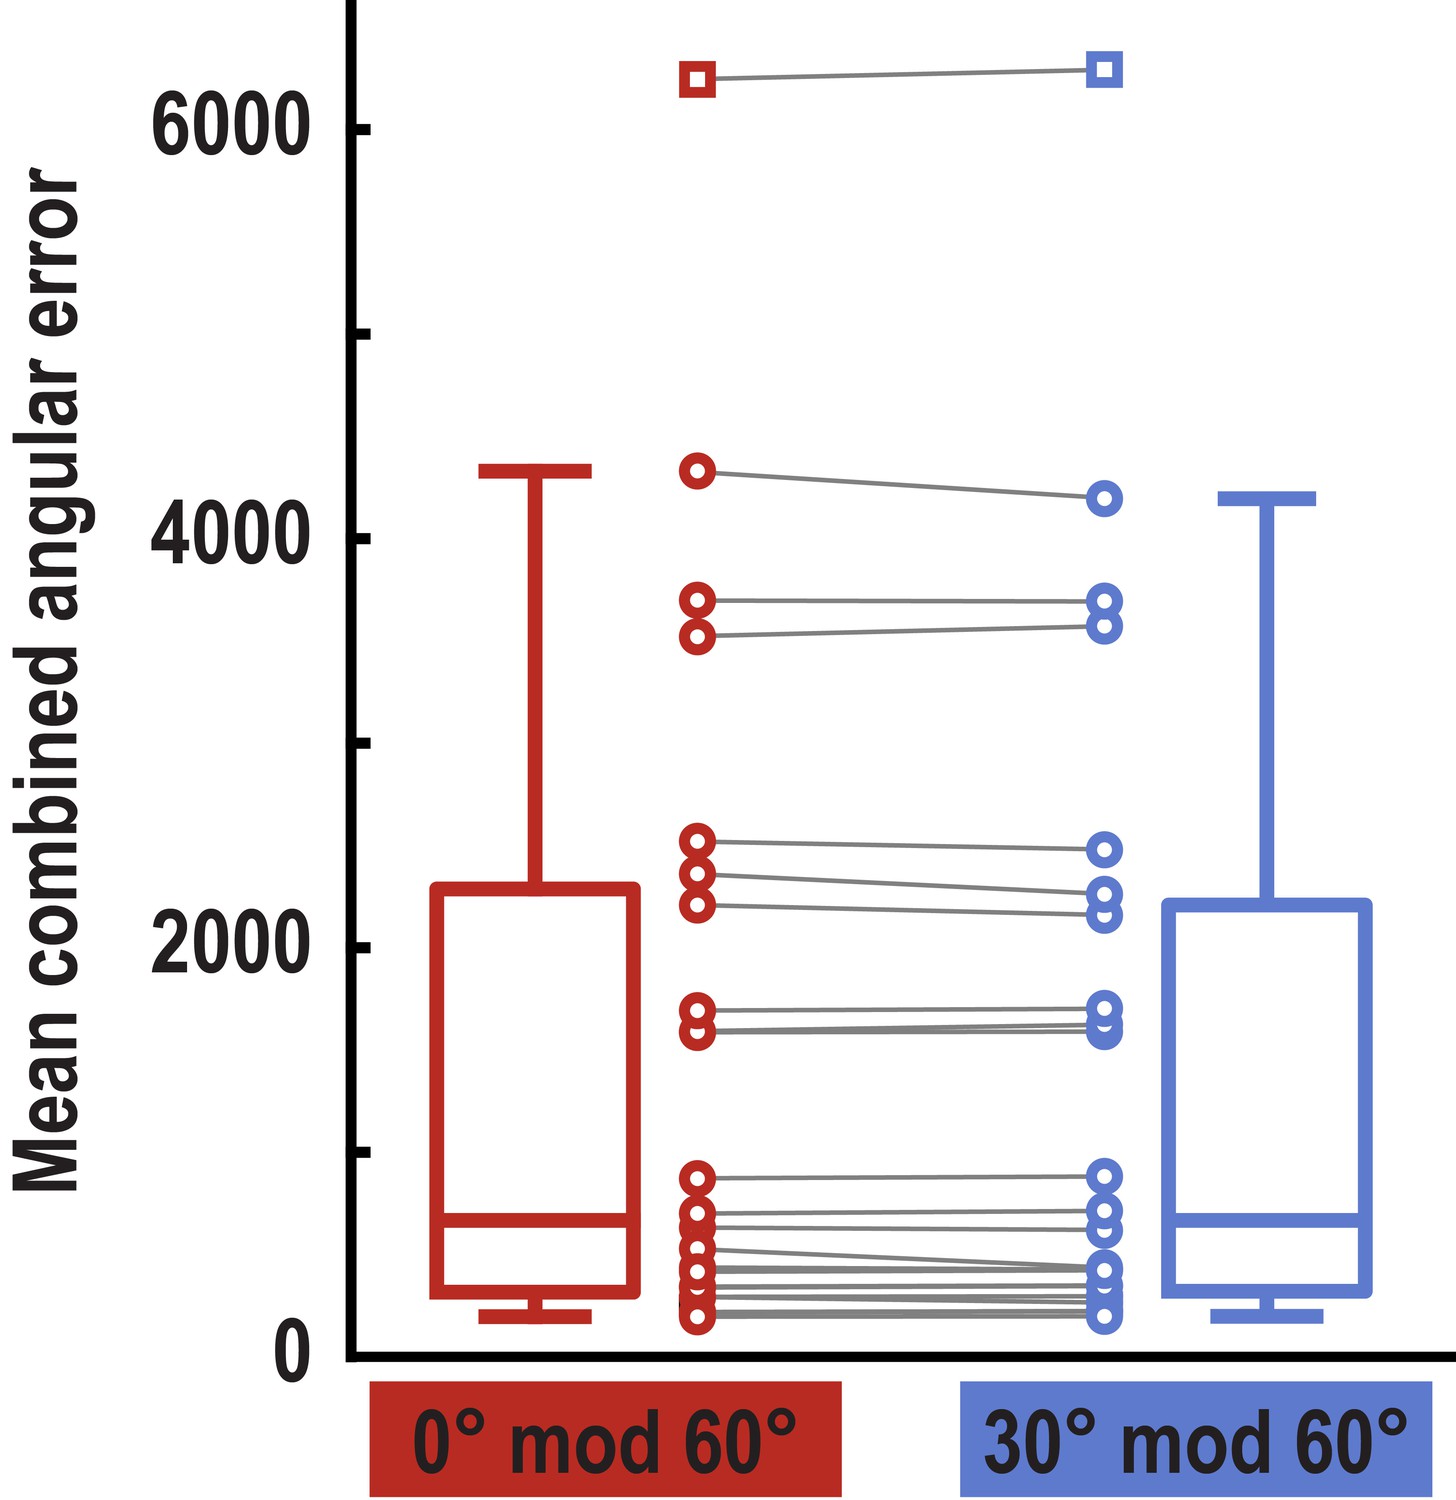
Behavioral performance for trial pairs in the 0° modulo 60° and the 30° modulo 60° condition.
Error values were multiplied for the two trials of each pair and averaged for the two conditions. Boxplots indicate 25th and 75th percentile with the middle line representing median combined error across participants. Whiskers extend to most extreme data points not considered outliers. Data points connected by lines show combined errors for all subjects in the two conditions (no difference between conditions, T23 = 1.24, p = 0.227). Data points defined as outliers (values more than 1.5 times the interquartile range above the 75th percentile or more than 1.5 times the interquartile range below the 25th percentile) are represented by square markers. Note that the participant shown here as an outlier performed above chance and that there were no outliers in our main pattern similarity analysis (see Figure 3—figure supplement 2).
Figure 3—figure supplement 9
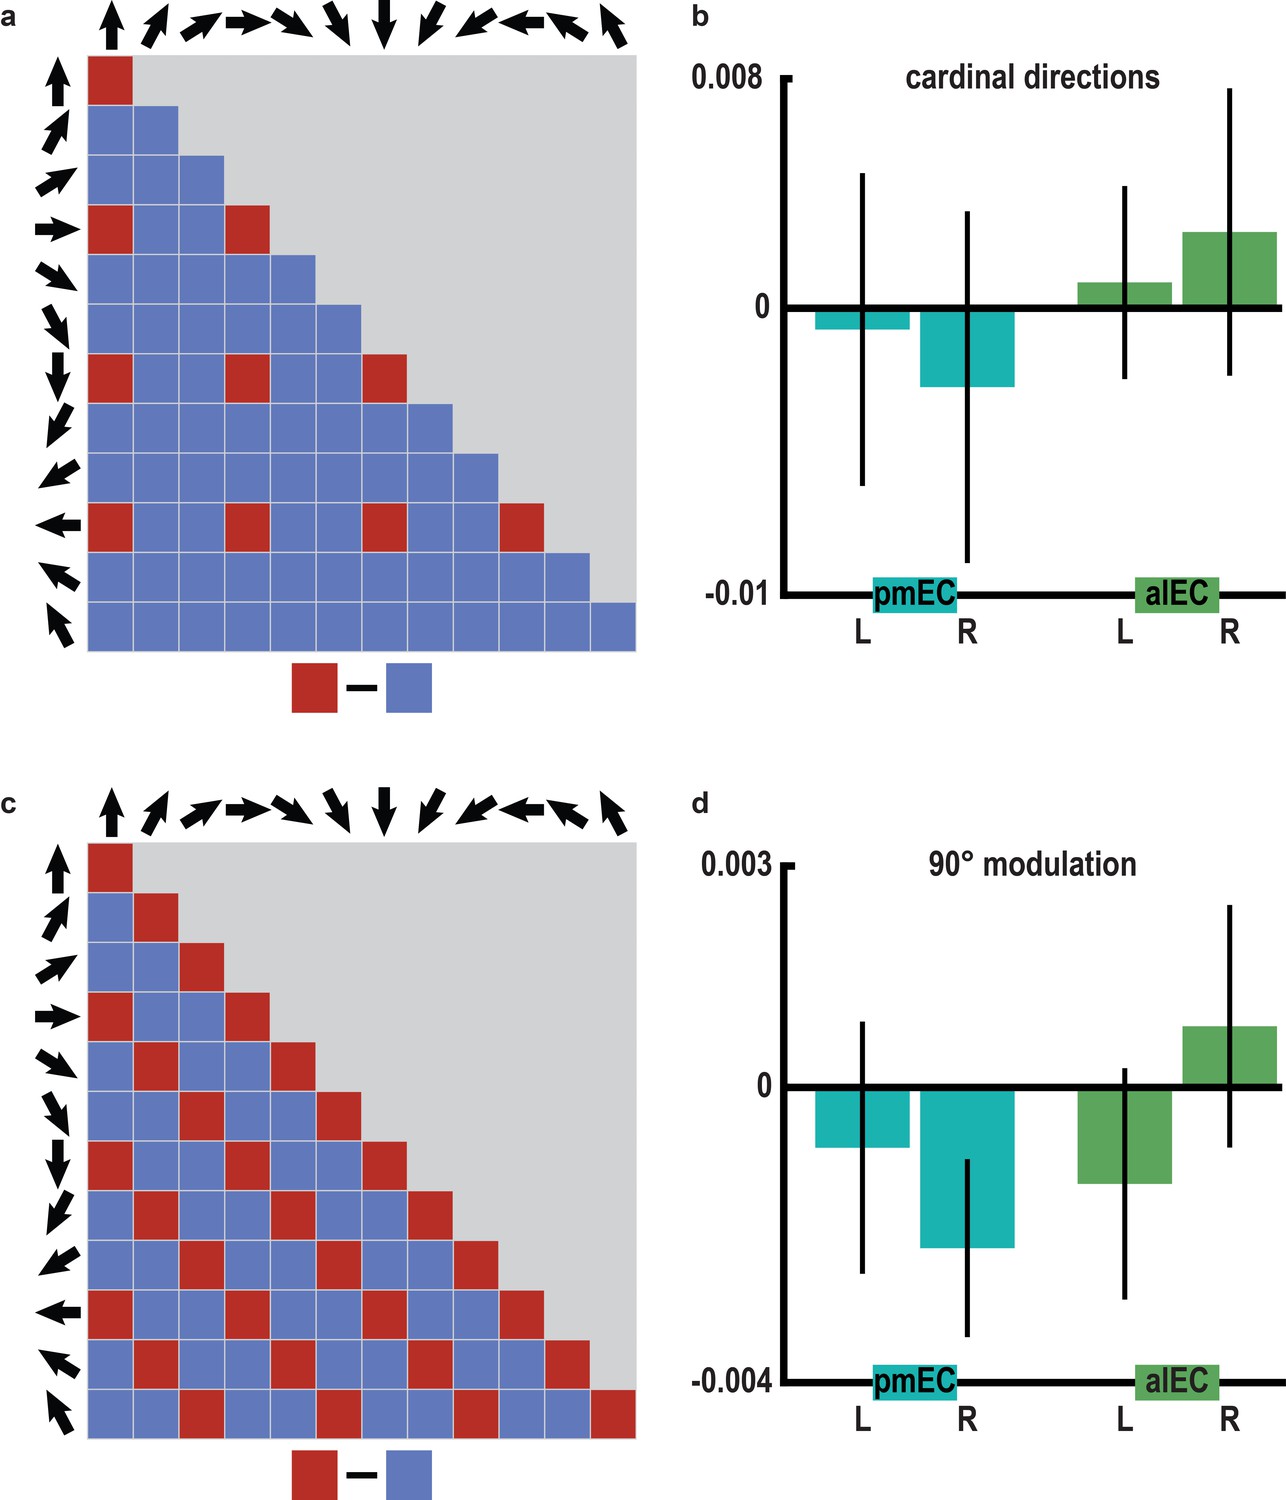
No evidence for representations of cardinal directions or 90° modulation of pattern similarity in the entorhinal cortex.
(a) Structure of pattern similarity values used to test for coding of cardinal directions in the entorhinal cortex. If entorhinal cortex activity would be sensitive to cardinal directions, high pattern similarity would be expected for pairs of trials sampling cardinal directions in comparison with trials sampling other directions. Note that for illustration purposes the tested similarity matrix is shown for comparisons across conditions, not single trials. (b) Pattern similarity did not differ between pairs of trials sampling cardinal directions and pairs of trials sampling other directions in pmEC (differences scores: left: T23 = -0.136, p = 0.893; right: T23 = −0.449, p = 0.658) or alEC (differences scores: left: T23 = 0.266, p = 0.793; right: T23 = 0.530, p = 0.601). (c) To corroborate the specificity of the 60° modulation of pattern similarity in pmEC, we examined a possible, yet biologically implausible four-fold symmetry in entorhinal pattern similarity values. We tested for increased pattern similarity for pairs of trials sampling directions 90° or multiples thereof apart (0° modulo 90° against 30° or 60° modulo 90°), using the same analysis logic as for the main analysis (0° modulo 60° against 30° modulo 60°) but now with a 90° periodicity. (d) Pattern similarity values did not differ between these conditions in pmEC (differences scores: left: T23 = −0.48, p = 0.637; right: T23 = −1.81, p = 0.084) or alEC (differences scores: left: T23 = −0.83, p = 0.413; right: T23 = 0.50, p = 0.618). Bars in (b and d) represent mean and S.E.M.
Figure 3—figure supplement 10
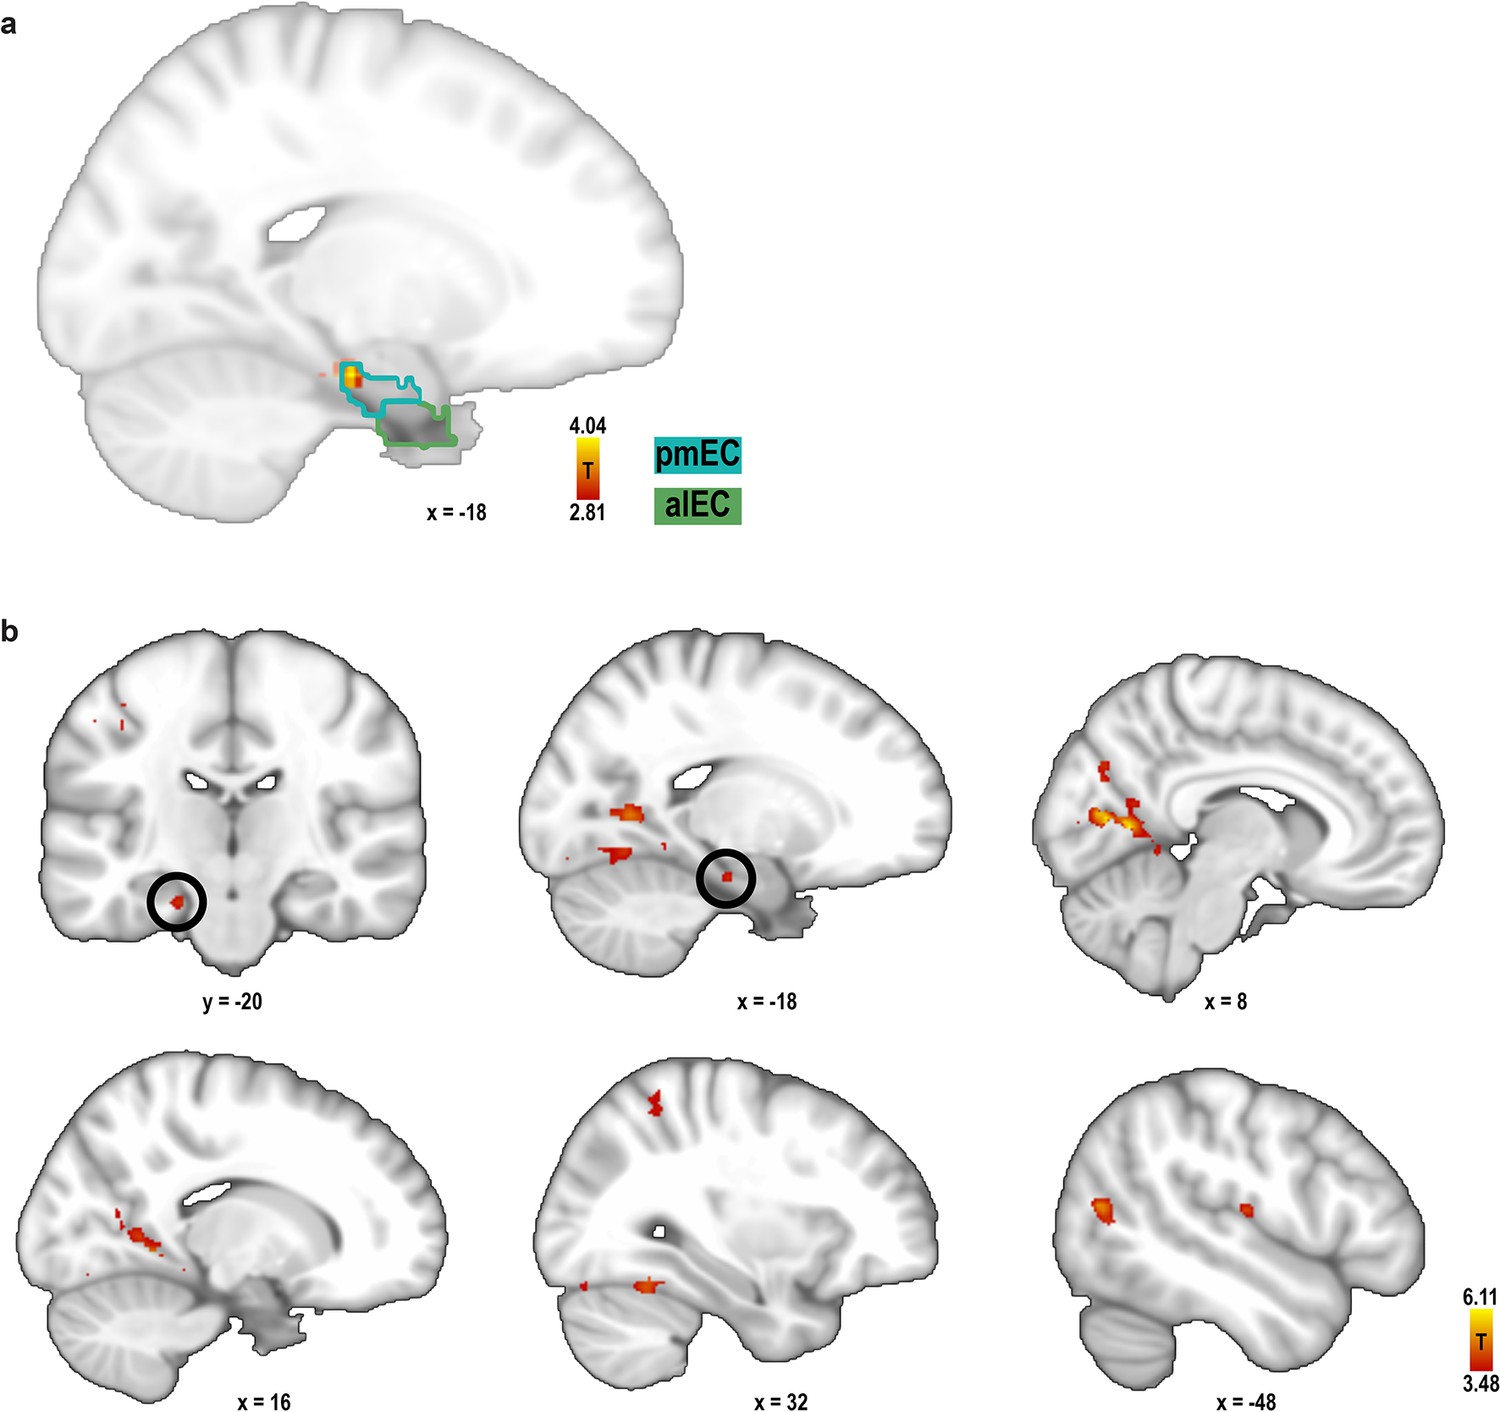
Searchlight analysis for 60° modulation of pattern similarity during imagination.
For each search sphere, the difference in pattern similarity for trial pairs in the 0° modulo 60° condition and the 30° modulo 60° condition was calculated. (a) One entorhinal cluster exhibited increased pattern similarity for the 0° modulo 60° condition (peak MNI coordinates: −18 − 20 −22; T23 = 4.04, p = 0.046, FWE-corrected for multiple comparisons in bilateral pmEC and alEC using small volume correction) and is shown together with the masks of pmEC and alEC, outlined in dark and light green, respectively. This result confirms our finding from the ROI analysis. Statistical map is thresholded at p < 0.005 uncorrected and masked to show entorhinal cortex only. (b) Further exploratory whole-brain searchlight analysis showed greater pattern similarity for the 0° modulo 60° condition in the lingual gyrus (MNI coordinates: 8 −62 6, T23 = 6.11), precuneus (−20 −60 4, T23 = 5.35), cuneal cortex (10 −74 26, T23 = 5.26), lateral occipital cortex (−42 −66 6, T23 = 5.06), occipital pole (−32 −90 10, T23 = 4.93), supplementary motor cortex (0 −14 56, T23 = 4.54), central opercular cortex (−50 −16 12, T23 = 4.46), occipital fusiform gyrus (38 −74 −18, T23 = 4.36), angular gyrus (54 −56 26, T23 = 4.34), superior parietal lobule (30 −52 58, T23 = 4.12) and supramarginal gyrus (−64 −50 22, T23 = 4.09). Slices show the statistical image at 1 mm resolution at a significance threshold of p<0.001. Labels were obtained from the Harvard-Oxford Structural Cortical Structural Atlas available in FSL. For each region peak voxel MNI coordinates and statistics are reported.
Author response image 1

Trials sampling North or South are indicated by arrows.
Originally, we were asked to exclude comparisons of all shown trials, leading to a reduction in statistical power. To rule out an effect of sampling along the North-South axis using buildings located on the same street we excluded comparisons indicated in purple from the analyses.
Author response image 2

Percentage of pairwise comparisons in the two conditions as a function of the number of trials in a pair targeting a building located on the inner ring.
Trial pairs in which both trials targeted a building in the inner ring made up 12.23% of comparisons in the 0° modulo 60° condition and did not exist in the 30° modulo 60° condition.
Author response image 3

Mean proportion of pairwise comparisons in the 0° modulo 60° condition and the 30° modulo 60° condition across participants for different time bins.
The onset asynchrony was defined as the absolute difference in seconds between the onsets of the imagination periods of the trials in a pair. Error bars reflect SEM.
Download links
A two-part list of links to download the article, or parts of the article, in various formats.
Downloads (link to download the article as PDF)
Open citations (links to open the citations from this article in various online reference manager services)
Cite this article (links to download the citations from this article in formats compatible with various reference manager tools)
Grid-cell representations in mental simulation
eLife 5:e17089.
https://doi.org/10.7554/eLife.17089


