Loss of ZBTB20 impairs circadian output and leads to unimodal behavioral rhythms
- Nanjing University, China
- Second Military Medical University, China
- Soochow University, China
- University of Texas Southwestern Medical Center, United States
Figures
Figure 1 with 1 supplement
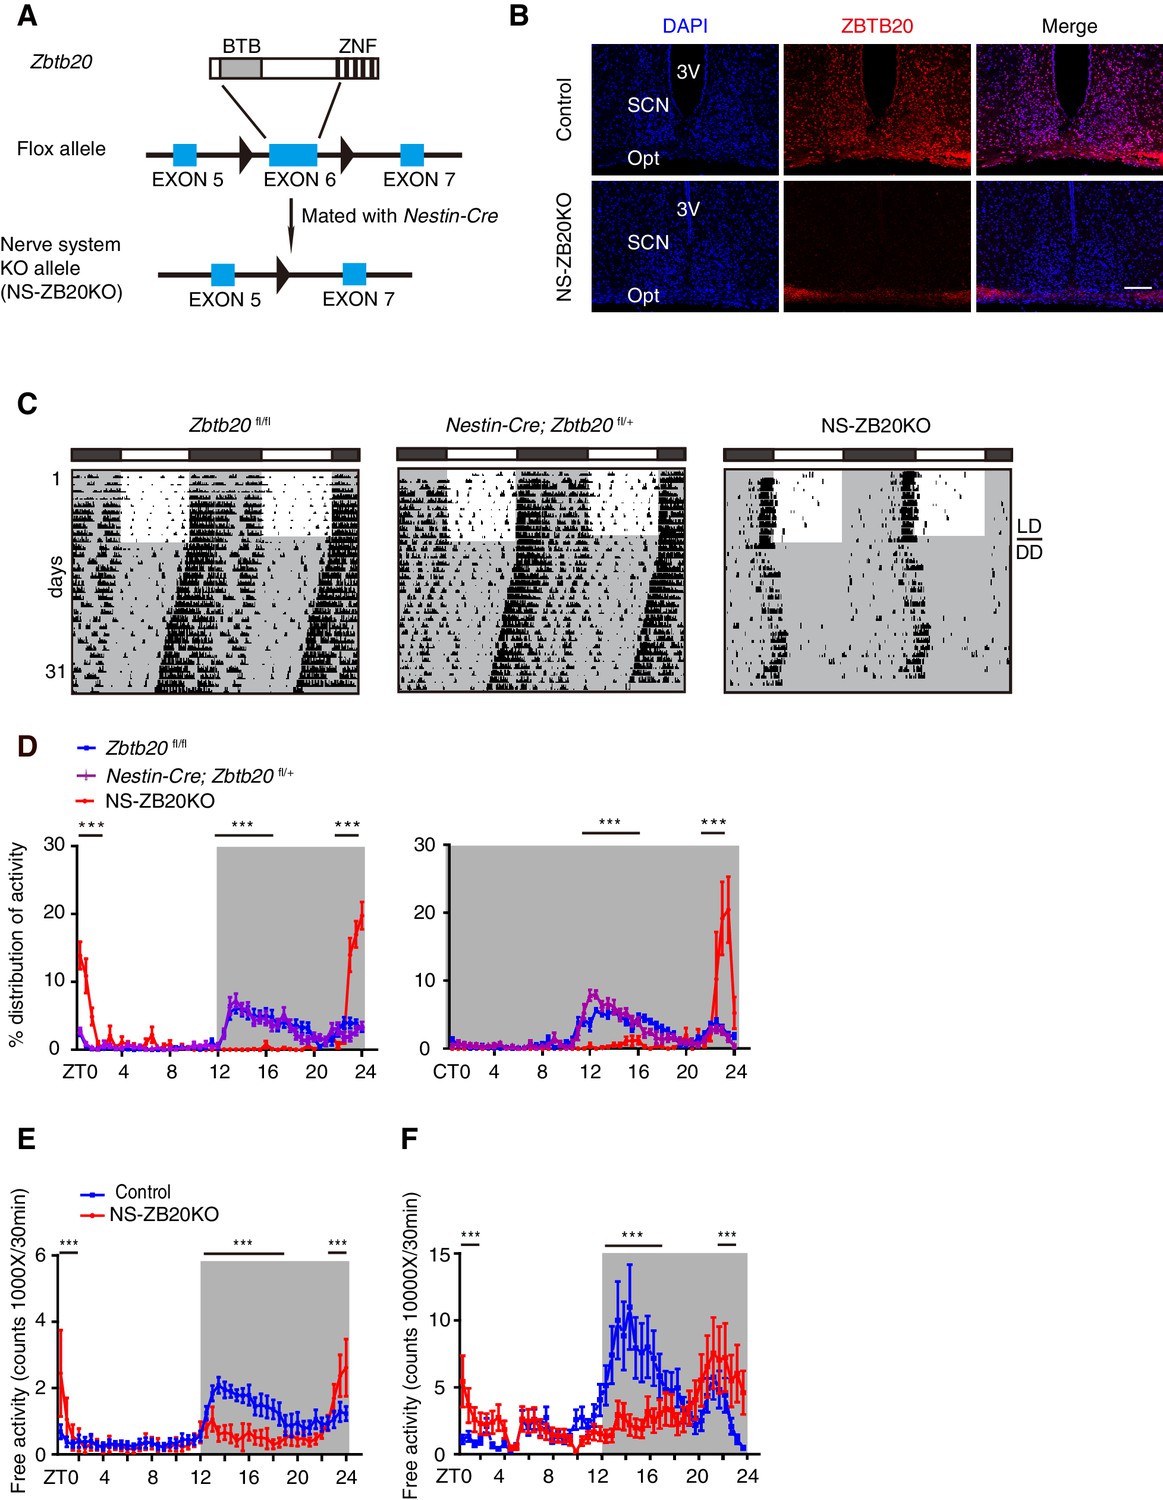
Loss of Zbtb20 alters evening activity and morning activity.
(A) Targeting strategies for Zbtb20. Exon 6 of the Zbtb20 gene was flanked by two loxP sites as indicated, and it was deleted by CRE recombination in the nervous system. (See also Figure 1—figure supplement 1). (B) Immunofluorescence staining for ZBTB20 in SCN from control and NS-ZB20KO mice (slices from at least three mice per group). (Scale bar, 100 µm). (C) Representative actograms of wheel-running activities from control (n = 15), Nestin-Cre; Zbtb20fl/+ (n = 6) and NS-ZB20KO mice (n = 13). The mice were first entrained to an LD cycle for 10 days and then released in DD for approximately 3 weeks. Black shading indicates the time when lights were off, and the white box indicates the time when lights were on. (D) Percentage distributions of wheel-running activity in LD or DD from control (blue, n = 15), Nestin-Cre; Zbtb20fl/+ (purple, n = 6) and NS-ZB20KO (red, n = 13) mice derived from (C). Values for wheel-running activity were accumulated for data on days 3–10 in LD and on days 11–18 in DD, respectively. The results are plotted as the mean ± SEM, ***p<0.001 by one-way ANOVA with multiple comparisons and Tukey’s test. (E,F) Temporal profiles of spontaneous activity recorded by CLAMS (E) and miniature telemetry (F) in LD. The spontaneous activity from 3 consecutive days of the LD cycle was accumulated in bins of 20 min and averaged to produce one 24 hr profile. The number of mice for CLAMS: control n = 12; NS-ZB20KO n = 9; for miniature telemetry: control n = 9; NS-ZB20KO n = 5. Each point represents the mean ± SEM, ***p<0.001 by one-way ANOVA with multiple comparisons and Tukey’s test (also see Figure 1—figure supplement 1).
-
Figure 1—source data 1
Data for temporal profiles of wheel-running activity in control and NS-ZB20KO mice.
- https://doi.org/10.7554/eLife.17171.003
-
Figure 1—source data 2
Data for temporal profiles of spontaneous activity in control and NS-ZB20KO mice.
- https://doi.org/10.7554/eLife.17171.004
Figure 1—figure supplement 1
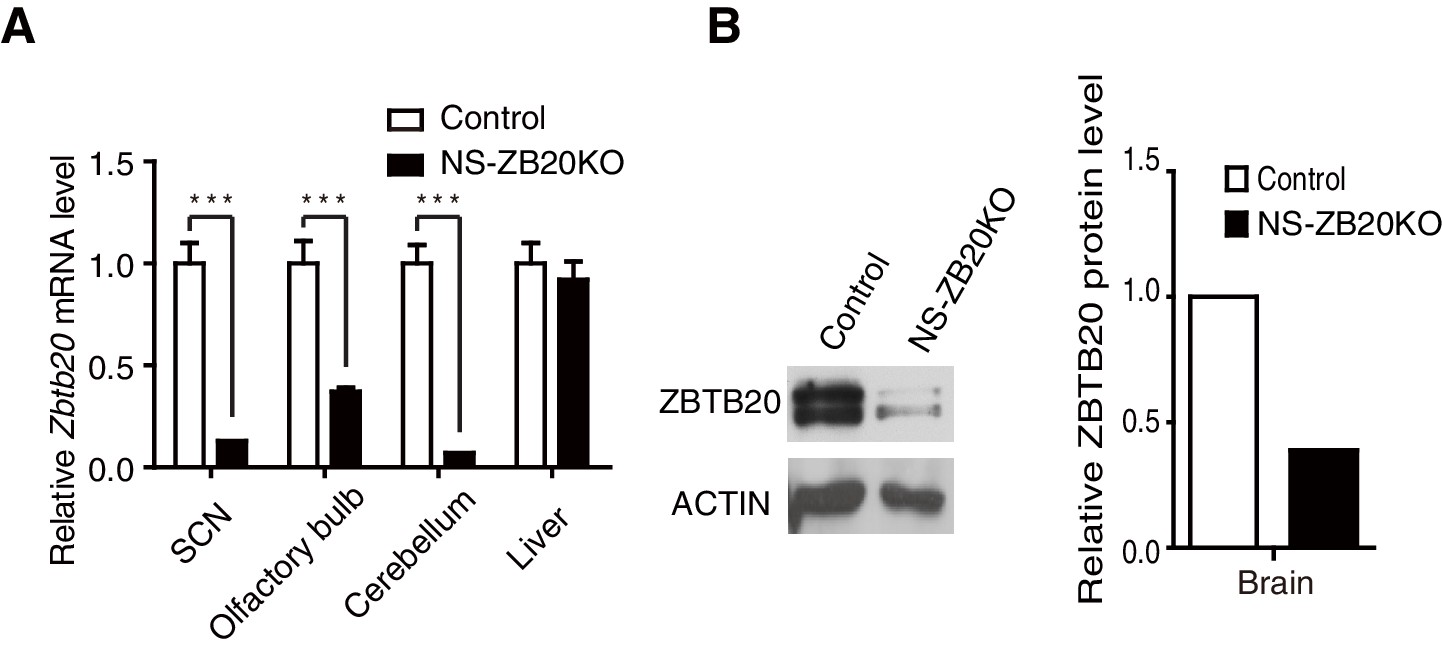
Deletion of Zbtb20 in brains from NS-ZB20KO mice.
(A) Q-PCR analysis for Zbtb20 transcript in SCN, olfactory bulb, cerebellum, and liver tissues. The data are expressed as the mean ± SD. ***p<0.001 by student’s t-test (n = 4 for control and NS-ZB20KO mice). (B) Western blot analysis for ZBTB20 expression in brains from control and NS-ZB20KO mice.
Figure 2

NS-ZB20KO mice show defects in light responsiveness.
(A,B) Representative actograms of wheel-running activity of control (n = 6) and NS-ZB20KO (n = 11) mice subjected to a 6 hr or 4 hr light pulse at CT12 (A) or CT20 (B), including the mean phase shift in activity. Negative numbers are phase delays, and positive numbers are phase advances. Values are expressed as the mean ± SEM. *p=0.0475 by Student’s t-test. (C,D) Representative actograms of wheel-running activity of control (n = 6) and NS-ZB20KO (n = 6) mice subjected to a 6 hr phase advance (C) and delay (D), including average activity offset in the 6 hr phase advance (C) and delays (D). Values are expressed as the mean ± SEM, *p<0.05, **p<0.01 by Student’s t-test. (E–G) Representative actograms of wheel-running activity of control (n = 6) and NS-ZB20KO (n = 6) mice transferred to 18L/6D (E) and 6L/18D (F) from 12L/12D. (G) Average phase relations of activity offset (red line) to different photoperiods. Gray areas show the dark phase. Values are expressed as the mean ± SEM (n = 6 for control mice and NS-ZB20KO mice, **p=0.001174 by Student’s t-test).
Figure 3 with 1 supplement
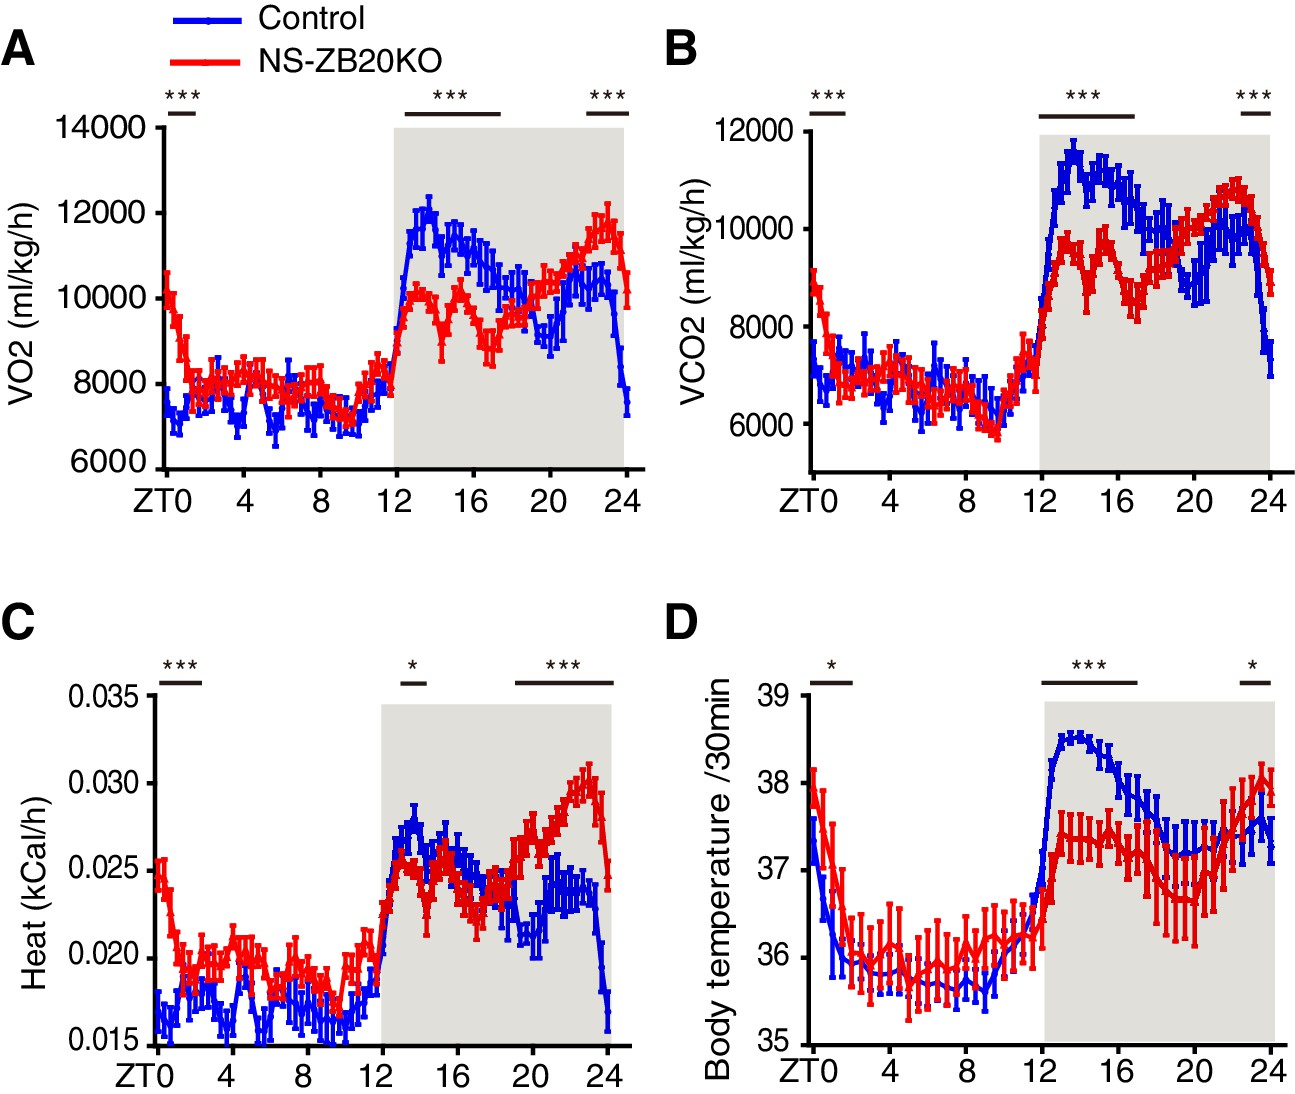
Loss of ZBTB20 alters metabolism and body temperature rhythms.
(A,B) Temporal profiles of the O2 consumption rate (VO2) (A) and CO2 production rate (VCO2) (B) monitored over three consecutive 24 hr cycles for control and NS-ZB20KO mice kept in LD. The result from 3 consecutive days of the LD cycle was accumulated into 20 min bins and averaged to produce one 24 hr profile. (C) Temporal profiles of the whole-body heat production calculated by the volumes of O2 and CO2 consumption in the CLAMS chambers. (A–C) Numbers of mice: for control, n = 12; for NS-ZB20KO, n = 9, *p<0.05, **p<0.01, ***p<0.001 by one-way ANOVA with multiple comparisons and Tukey’s test. (D) Temporal profiles of core body temperature measured for 3 days with subcutaneously implanted miniature telemetry. Number of mice for controls, n = 9, for NS-ZB20KO, n = 5. The data, as the mean ± SEM, are shown as diurnal averages in 20 or 30 min bins, *p<0.05, **p<0.01, ***p<0.001 by one-way ANOVA with multiple comparisons and Tukey’s test (also see Figure 3—figure supplement 1).
-
Figure 3—source data 1
Data for temporal profiles of the O2 consumption rate, CO2 production rate, heat production, and body temperature in control and NS-ZB20KO mice.
- https://doi.org/10.7554/eLife.17171.010
Figure 3—figure supplement 1
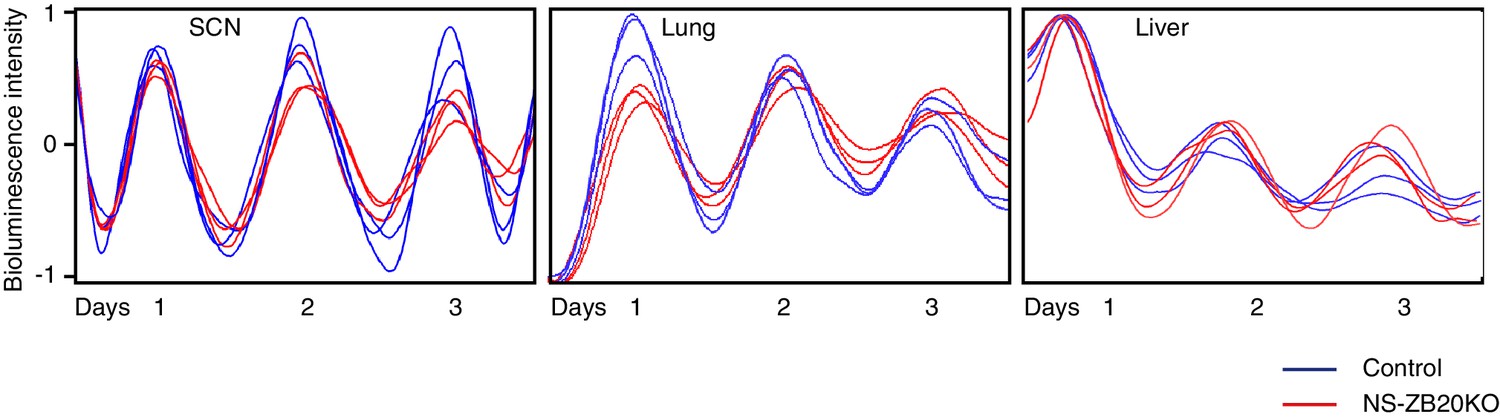
Effect of Zbtb20 depletion by Nestin-Cre on the SCN, lung and liver explants.
The panels showed representative bioluminescence signals from SCN (left), lung (middle) and liver (right) slices of Zbtb20fl/fl; Per2Luc (blue) and NS-ZB20KO; Per2Luc (red) mice (n = 7 for Zbtb20fl/fl; Per2Luc, n = 6 for NS-ZB20KO; Per2Luc).
Figure 4 with 2 supplements
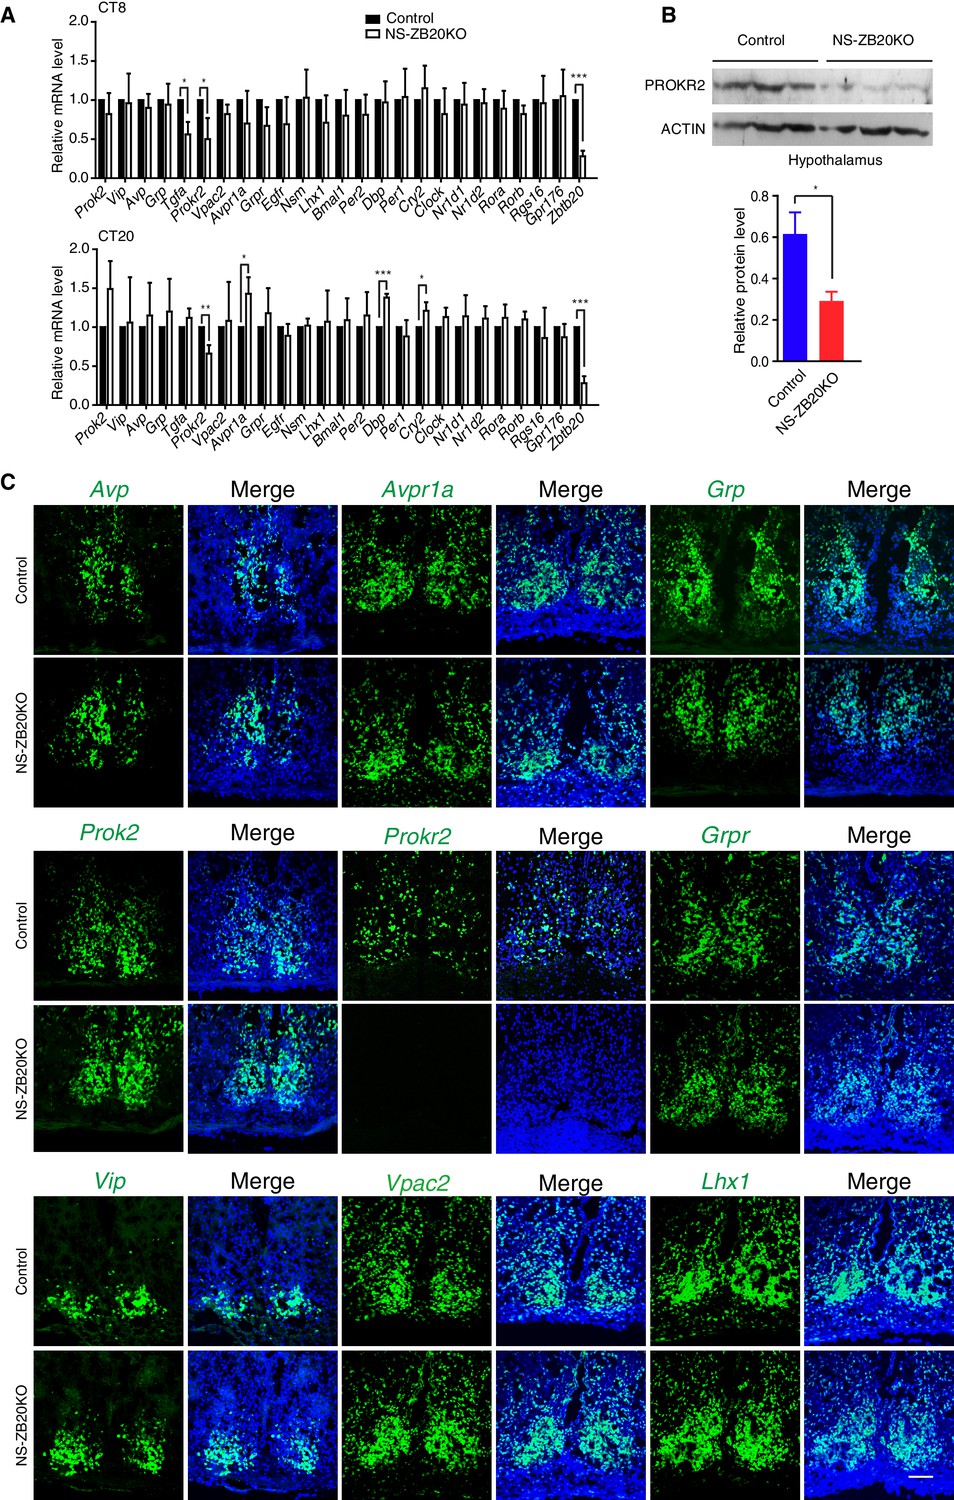
Prokr2 expression decreased in the SCN of NS-ZB20KO mice.
(A) Average transcript levels of key factors and core circadian clock genes in the SCN from control (n = 4) and NS-ZB20KO mice (n = 4). Values are expressed as the mean ± SEM, *p<0.05, **p<0.01, ***p<0.001 by Student’s t-test. (B) Western blot analysis demonstrated that PROKR2 protein level was significantly lower in the hypothalamus of NS-ZB20KO mice (Control mice n = 5; NS-ZB20KO mice n = 5). Values are expressed as the mean ± SEM, *p<0.05 by Student’s t-test. (C) Fluorescence in situ hybridization in the SCN for Vip, Vpac2, Avp, Avpr1a, Prok2, Prokr2, Grp, Grpr, and Lhx1. Slices from at least three mice per group, Scale bar, 100 µm (also see Figure 4—figure supplements 1–2).
-
Figure 4—source data 1
Primer list for Q-PCR.
- https://doi.org/10.7554/eLife.17171.013
-
Figure 4—source data 2
Data for qPCR analysis in control and NS-ZB20KO mice SCN.
- https://doi.org/10.7554/eLife.17171.014
Figure 4—figure supplement 1
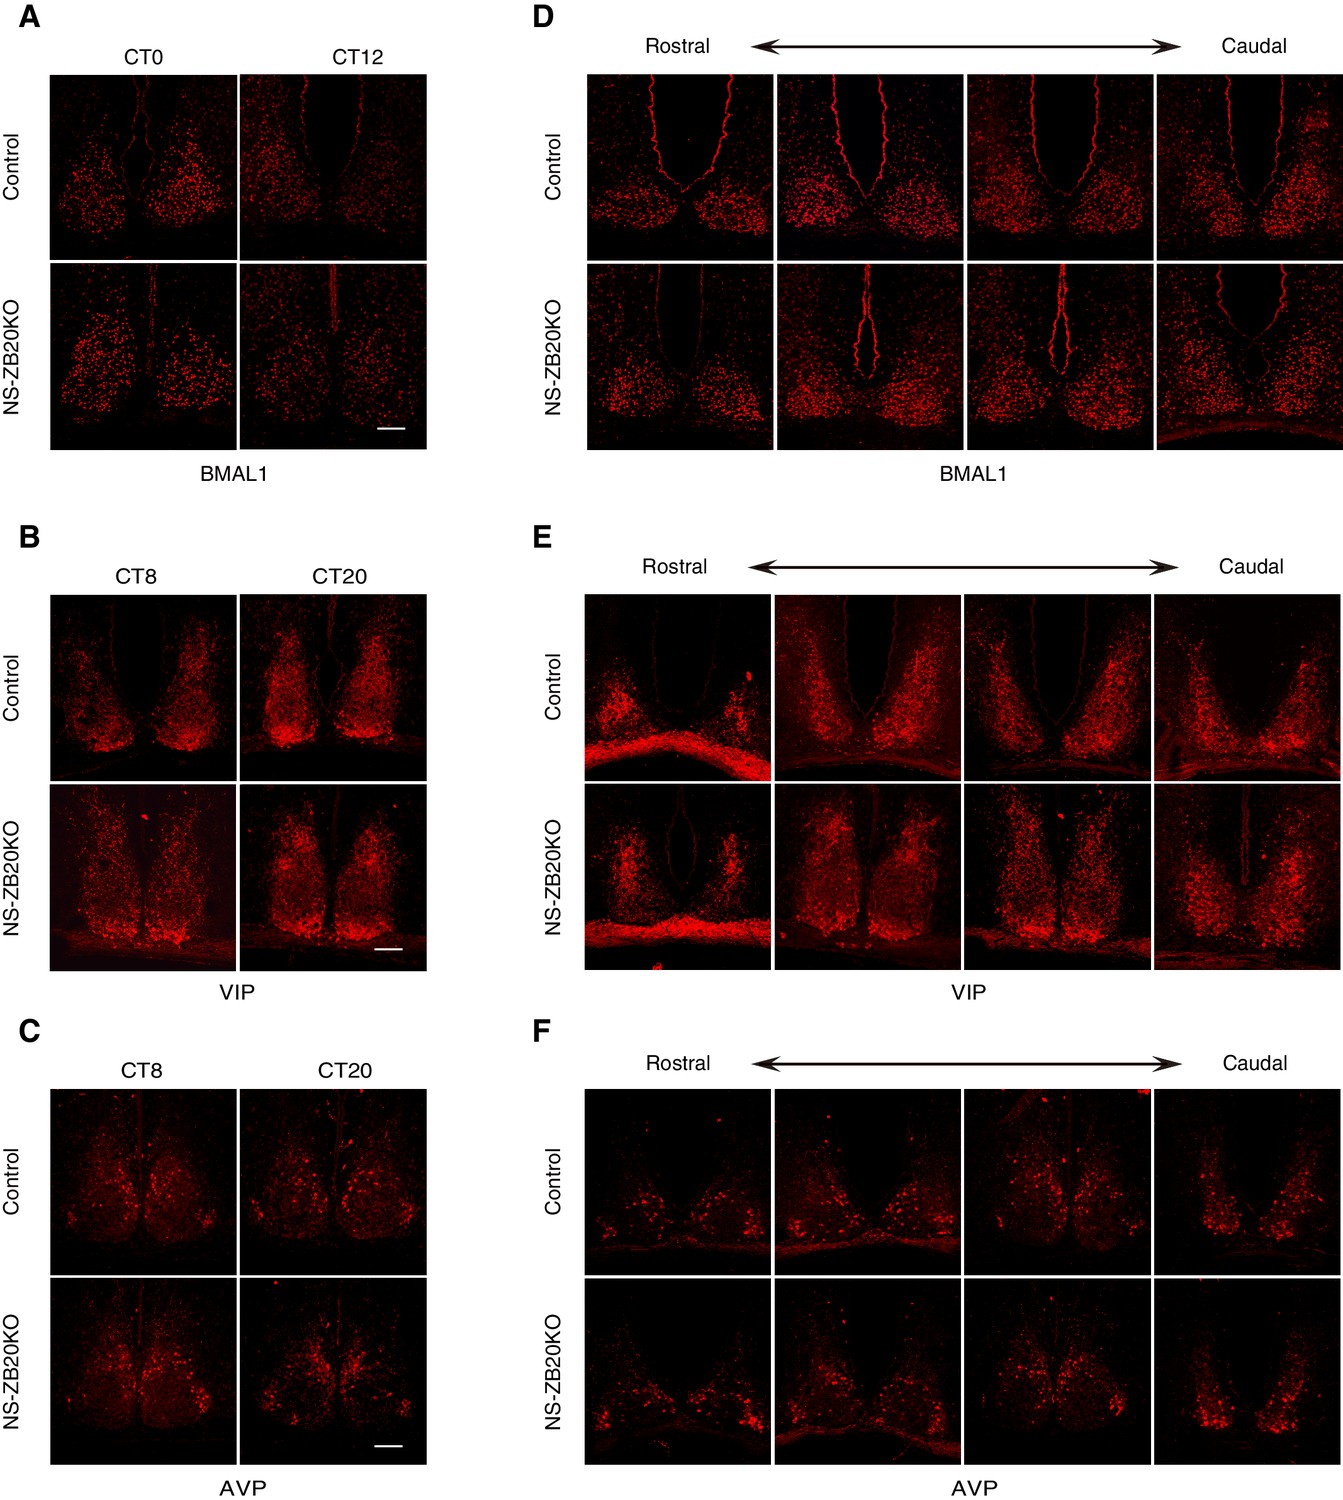
Loss of Zbtb20 does not alter the expression patterns of BMAL1, AVP and VIP protein in SCN.
(A–F) Representative immunofluorescence staining for BMAL1 (A,D), VIP (B,E), and AVP (C,F) protein in control and NS-ZB20KO mice. Mice were kept in LD for at least 7 days and then were transferred to DD conditions. Samples were collected according to the circadian time. Slices were collected from at least three mice/ group, (Scale bar, 100 µm).
Figure 4—figure supplement 2
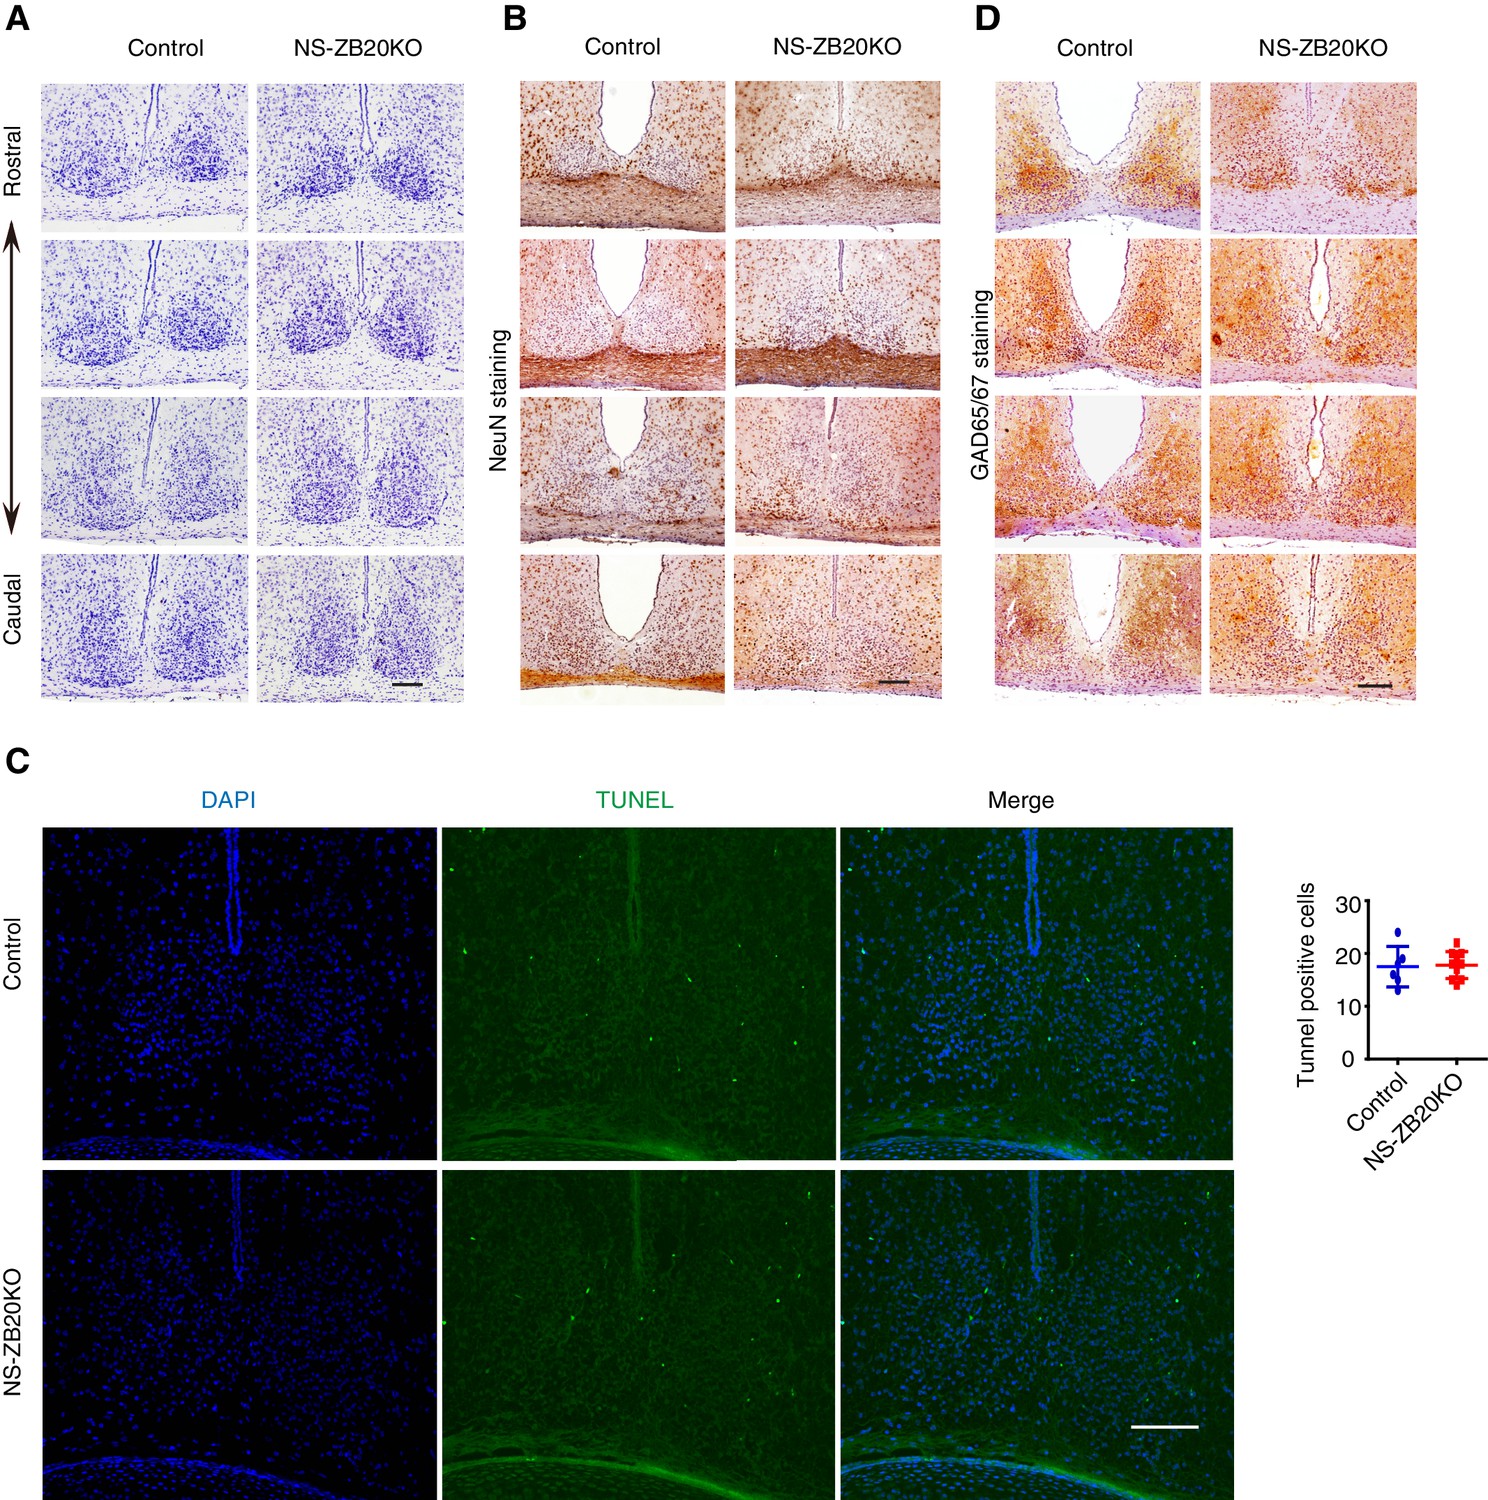
Normal morphogenesis of the SCN in NS-ZB20KO mice.
(A) Nissl staining of the SCN from control and NS-ZB20KO mice. (B,C) Immunohistochemistry staining of the SCN from control or NS-ZB20KO mice for NeuN (B) and GAD65/67 (D). (C) TUNEL assay of the SCN from control or NS-ZB20KO mice at the age of P3 days. The numbers of TUNEL-positive signals were counted (mean ± SD), Scale bar, 100 µm (slices from 4 mice/ group).
Figure 5 with 1 supplement
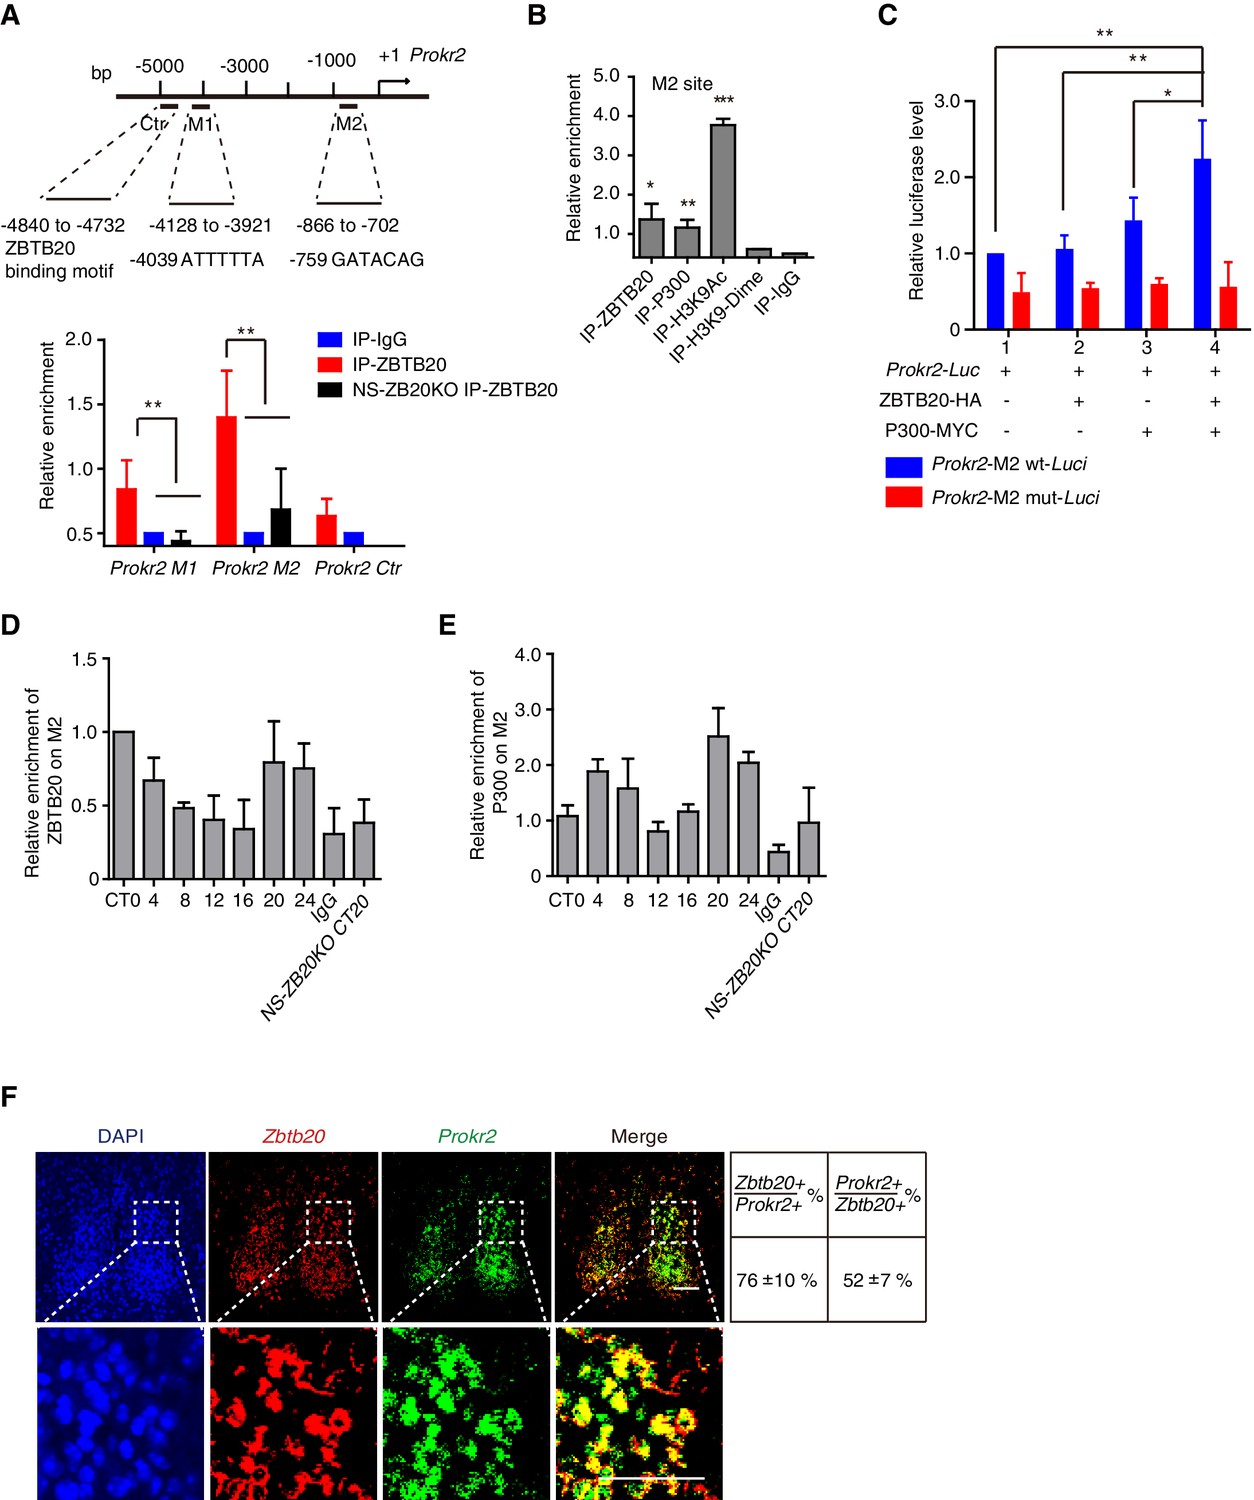
ZBTB20 up-regulates Prokr2 gene transcription.
(A) Bioinformatics analysis showed two potential ZBTB20 binding sites in the Prokr2 promoter region (top), and a ChIP assays showed the enrichment of ZBTB20 on the Prokr2 promoter in hypothalamus (bottom). (B) ChIP analysis for the enrichment of ZBTB20, P300, H3K9Ac, and H3K9 dimers on the M2 site in the hypothalamus. (C) Overexpression of ZBTB20 and P300 enhanced Prokr2 promoter activity in SCN 2.2 cells. (D,E) Daily binding levels of ZBTB20 (D) and P300 (E) on the M2 site were determined using ChIP at CT0, CT4, CT8, CT12, CT16, CT20, and CT24. (A,B,D) Each hypothalamus sample for the CHIP assay was collected from 5 mice, and the experiments were repeated three independent times. (C) The experiment was repeated four independent times. (A–C) Values are expressed as the mean ± SD, *p<0.05, **p<0.01, ***p<0.001 by Student’s t-test. (F) Representative double fluorescence in situ hybridization for Zbtb20 and Prokr2 in mouse SCN. Scale bar, 100 µm, (also see Figure 5—figure supplement 1).
-
Figure 5—source data 1
Primer list for CHIP.
- https://doi.org/10.7554/eLife.17171.018
-
Figure 5—source data 2
Data for CHIP analysis.
- https://doi.org/10.7554/eLife.17171.019
Figure 5—figure supplement 1
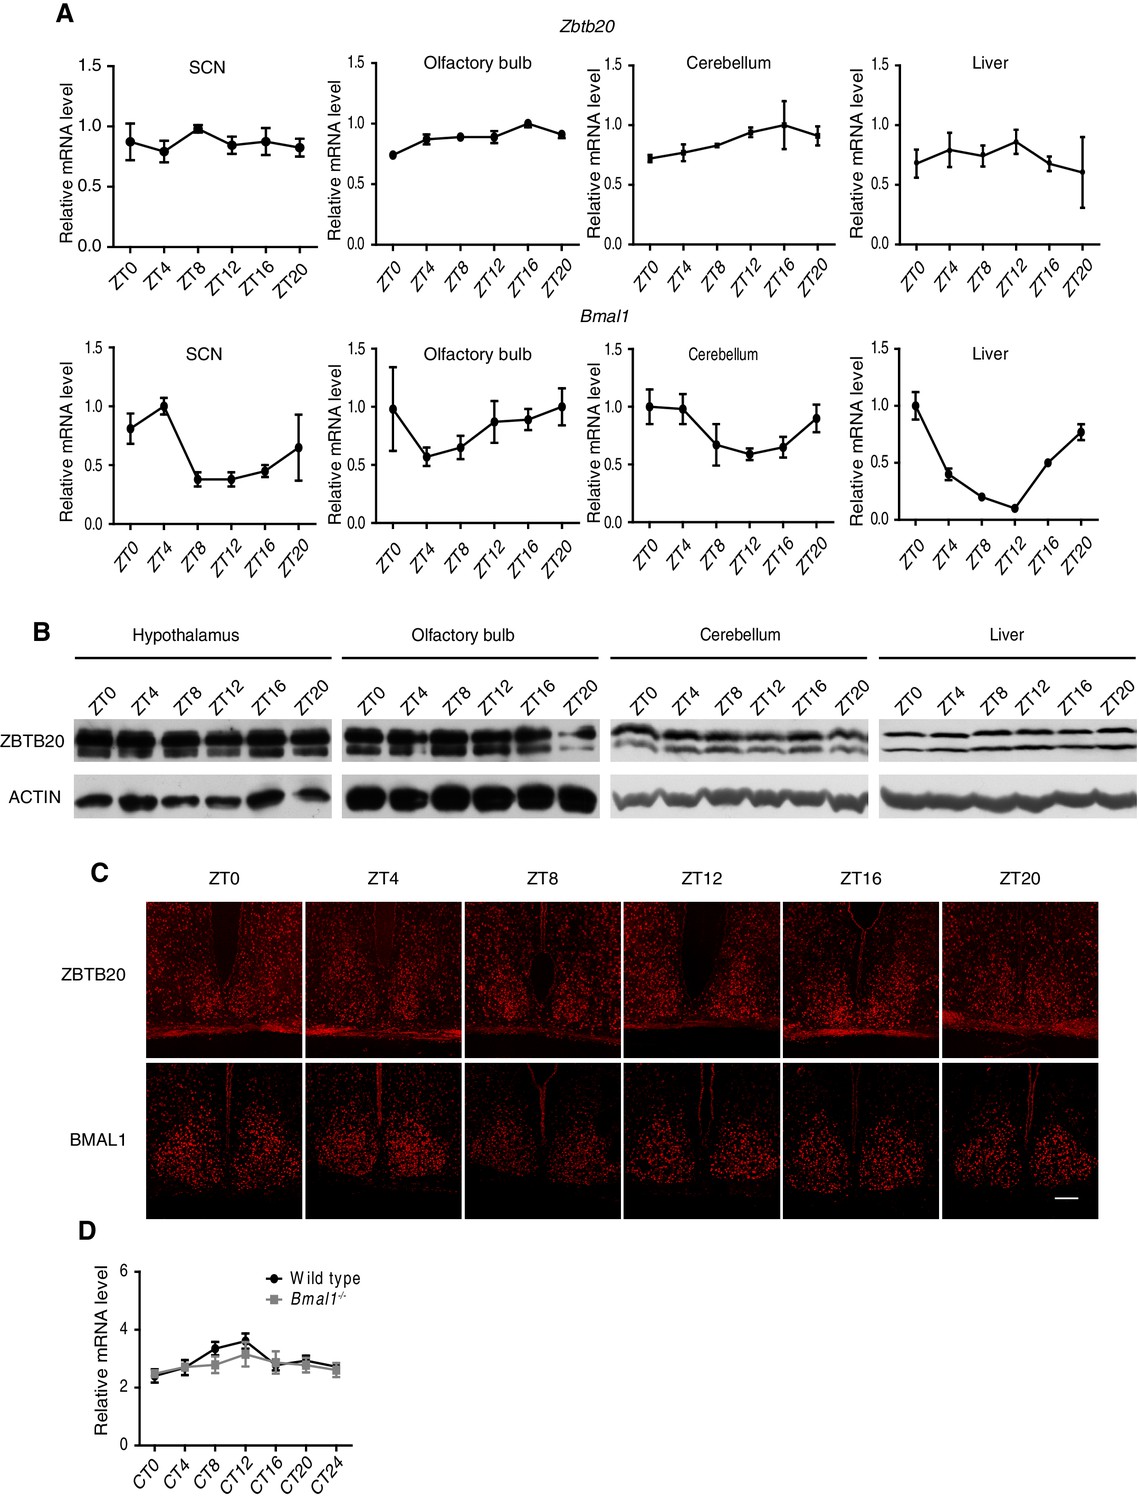
Non- or low-rhythm expression of Zbtb20.
(A) Zbtb20 (upper) and Bmal1 (bottom) gene expressions in SCN, olfactory bulb, cerebellum, and liver were determined by Q-PCR (mean ± SD). (B) Endogenous ZBTB20 expression in hypothalamus, olfactory bulb, cerebellum, and liver was analyzed by western blotting. (C) Endogenous ZBTB20 (upper) and BMAL1 (bottom) expressions in SCN were analyzed by immunofluorescence. Scale bar, 100 µm. (D) Zbtb20 transcript levels in control and Bmal1-knockout mice from liver tissue throughout the day (mean ± SD). (A–D) The experiments were repeated three independent times.
Figure 6 with 1 supplement
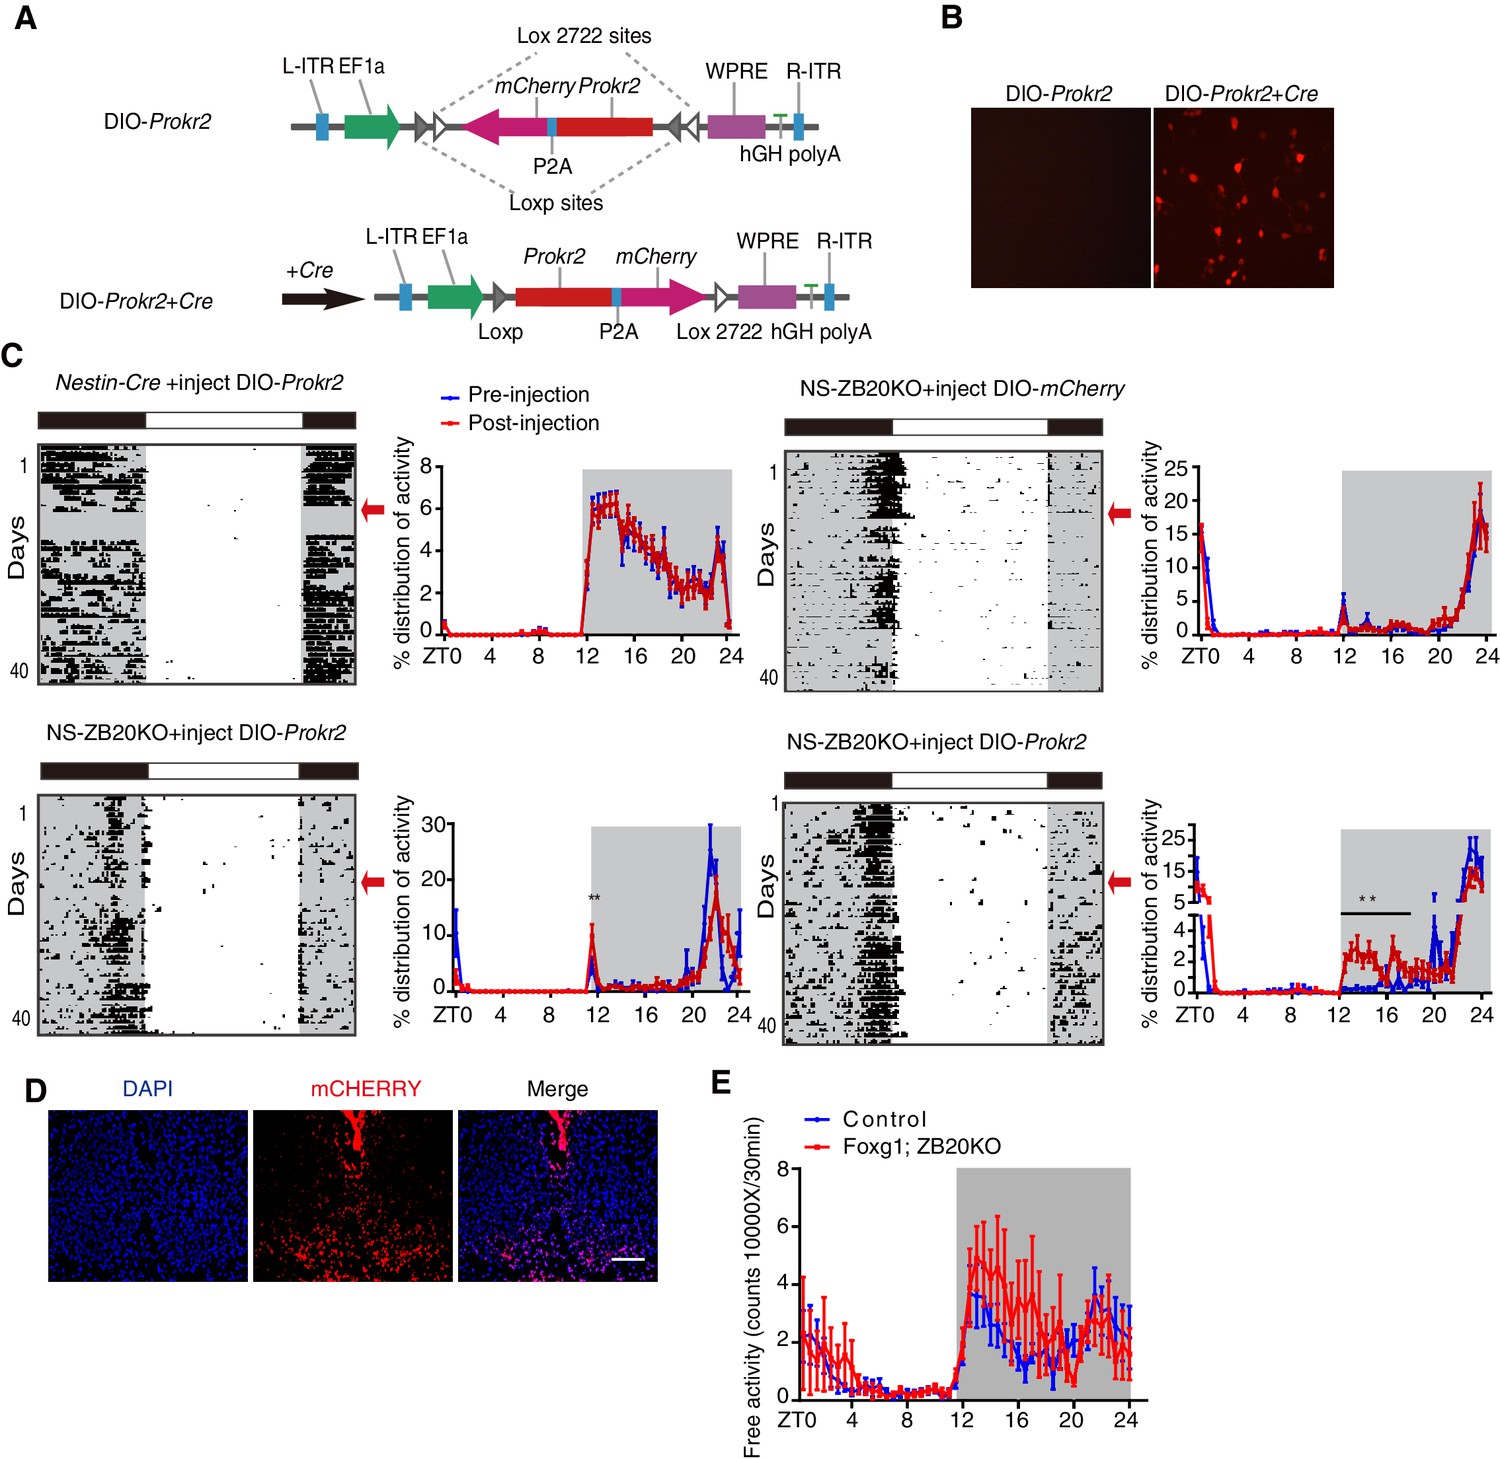
ZBTB20 maintains evening behavioral rhythms partly via PROKR2.
(A) DIO-Prokr2. Prokr2-mCherry ORF was flanked by double loxp. (B) CRE-mediated expression of Prokr2-mCherry in CRE-positive cells. (C) Representative actograms of wheel-running activities from controls that received DIO-Prokr2, and NS-ZB20KO that received DIO-mCherry and DIO-Prokr2. Each mouse was kept in same wheel running cage, and its locomotor activity was recorded before and after recovery from surgery. Arrows indicated the time of AAV injection. Percentage distributions of wheel-running activity were quantified from locomotor assay, before injection (blue, wheel running activity from day 3 to day 10 before injection) and after injection (red, wheel running activity from day 10 to 30 after injection). The results are plotted as the mean ± SEM, **p<0.01 by by one-way ANOVA with multiple comparisons and a Tukey’s test, (n = 10 for control mice received DIO-Prokr2; n = 10 for NS-ZB20KO received DIO-mCherry; n = 10 for NS-ZB20KO received DIO-Prokr2, most of NS-ZB20KO mice were died, and three mice were partly rescued. (D) mCHERRY expression of NS-ZB20KO mice with DIO-Prokr2 virus injection. Scale bar, 100 µm. (E) Temporal profiles of spontaneous activity recorded by CLAMS for control and Foxg1; ZB20KO. The spontaneous activity from 3 consecutive day of the LD cycle was accumulated to 30 min bins and averaged to produce one 24 hr profile. The number of mice for CLAMS: control n = 7; Foxg1; ZB20KO n = 7. Each point represents the mean ± SEM, (also see Figure 6—figure supplement 1).
-
Figure 6—source data 1
Data for temporal profiles of wheel-running activity.
- https://doi.org/10.7554/eLife.17171.022
-
Figure 6—source data 2
Data for temporal profiles of spontaneous activity in control and Foxg1; ZB20KO mice.
- https://doi.org/10.7554/eLife.17171.023
Figure 6—figure supplement 1
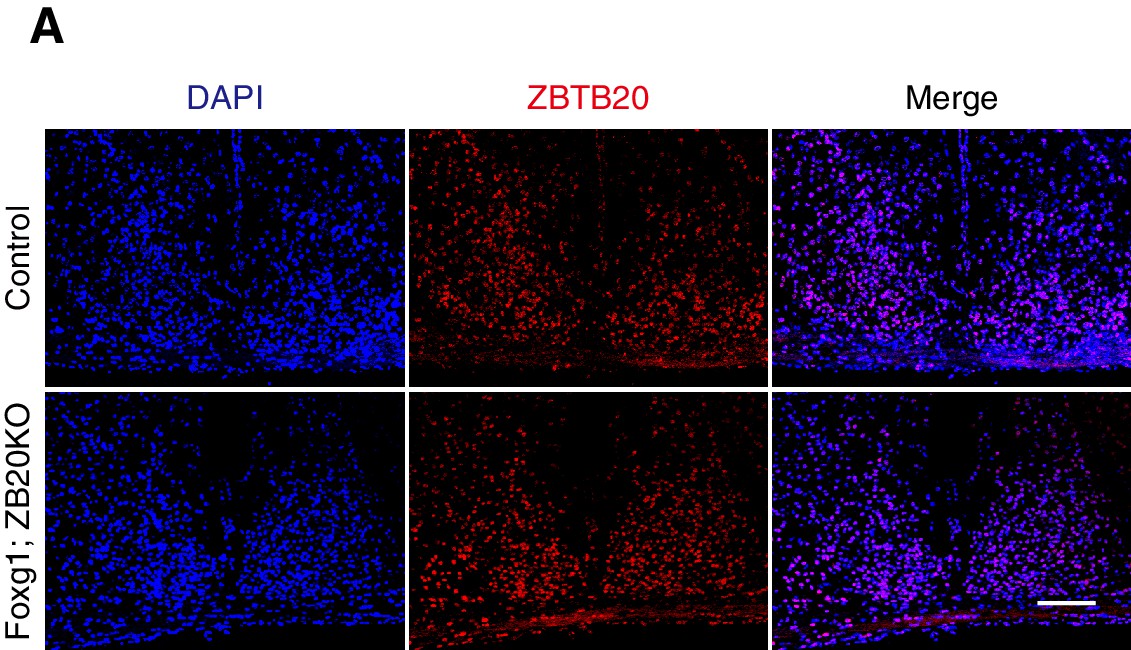
Expression of ZBTB20 in SCN from control and Foxg1; ZB20KO mice.
Immunofluorescence staining of ZBTB20 in the SCN from control (n = 3) and Foxg1; ZB20KO mice (n = 3), (Scale bar, 100 µm).
Figure 7

Genome-wide identification of ZBTB20 target genes.
(A) Diagrams depicting the functional category of differentially regulated transcripts between different genotypes at CT9 (left) and CT11 (right) from control and NS-ZB20KO mice. (B) Hierarchical clustering analysis of transcripts (q value <0.05) showed opposite trends between control (WT) and NS-ZB20KO (KO) mice from time point CT9 to CT11. High levels are shown in red, and low levels are shown in green. (A,B) Each SCN sample for RNA-seq was collected from 3 mice; and each group was repeated two times. (C) Overlapping altered transcripts in NS-ZB20KO mice between the RNA-seq data and the quantitative proteomics data. Each SCN sample for quantitative proteomics was collected from 5 mice, (also see Figure 7—source data 1–4).
-
Figure 7—source data 1
Expressed genes were significantly changed in NS-ZB20KO mice at CT9.
- https://doi.org/10.7554/eLife.17171.026
-
Figure 7—source data 2
Expressed genes were significantly changed in NS-ZB20KO mice at CT11.
- https://doi.org/10.7554/eLife.17171.027
-
Figure 7—source data 3
proteins were upregulated in the NS-ZB20KO mice.
- https://doi.org/10.7554/eLife.17171.028
-
Figure 7—source data 4
proteins were downregulated in the NS-ZB20KO mice.
- https://doi.org/10.7554/eLife.17171.029
Videos
Video 1
Activity of control and NS-ZB20KO mice at ZT13 (early night).
https://doi.org/10.7554/eLife.17171.006
Video 2
Activity of control and NS-ZB20KO mice at ZT23 (early morning).
https://doi.org/10.7554/eLife.17171.007Download links
A two-part list of links to download the article, or parts of the article, in various formats.
Downloads (link to download the article as PDF)
Open citations (links to open the citations from this article in various online reference manager services)
Cite this article (links to download the citations from this article in formats compatible with various reference manager tools)
Loss of ZBTB20 impairs circadian output and leads to unimodal behavioral rhythms
eLife 5:e17171.
https://doi.org/10.7554/eLife.17171


