Translational control of auditory imprinting and structural plasticity by eIF2α
- Albert Einstein College of Medicine, United States
- Baylor College of Medicine, United States
Figures
Figure 1

Behavioral paradigm and the critical period for imprinting.
(a) Schematic sequence of behavioral experiments. Dark-reared chicks were trained in a running wheel and tested the day after for visual and auditory imprinting. (b) During imprinting training, the chickens were presented with audiovisual stimulation. An animated object moved across the screen while a sound was presented every 3 s, coupled with pulsating movements of the object. (c) Auditory imprinting (left) was assessed by comparing the approaching behavior on the wheel to the imprinted sound or a novel sound. This procedure generated robust auditory imprinting when training was performed the day after hatching (gray, n = 13) but was ineffective four days after hatching (black, n = 12) (right). (d) Visual imprinting (left) was assessed independently, by comparing the approaching behavior to the imprinted or a novel image. Similarly to auditory imprinting, visual imprinting was strong in P1 (gray, n = 13) but absent in P4 (black, n = 12) (right). Plots show mean and SEM, * indicates p<0.05 from two-sample t-test.
-
Figure 1—source data 1
Preference indexes of trained chickens during (P1) or after the critical period (P4).
- https://doi.org/10.7554/eLife.17197.004
Figure 2
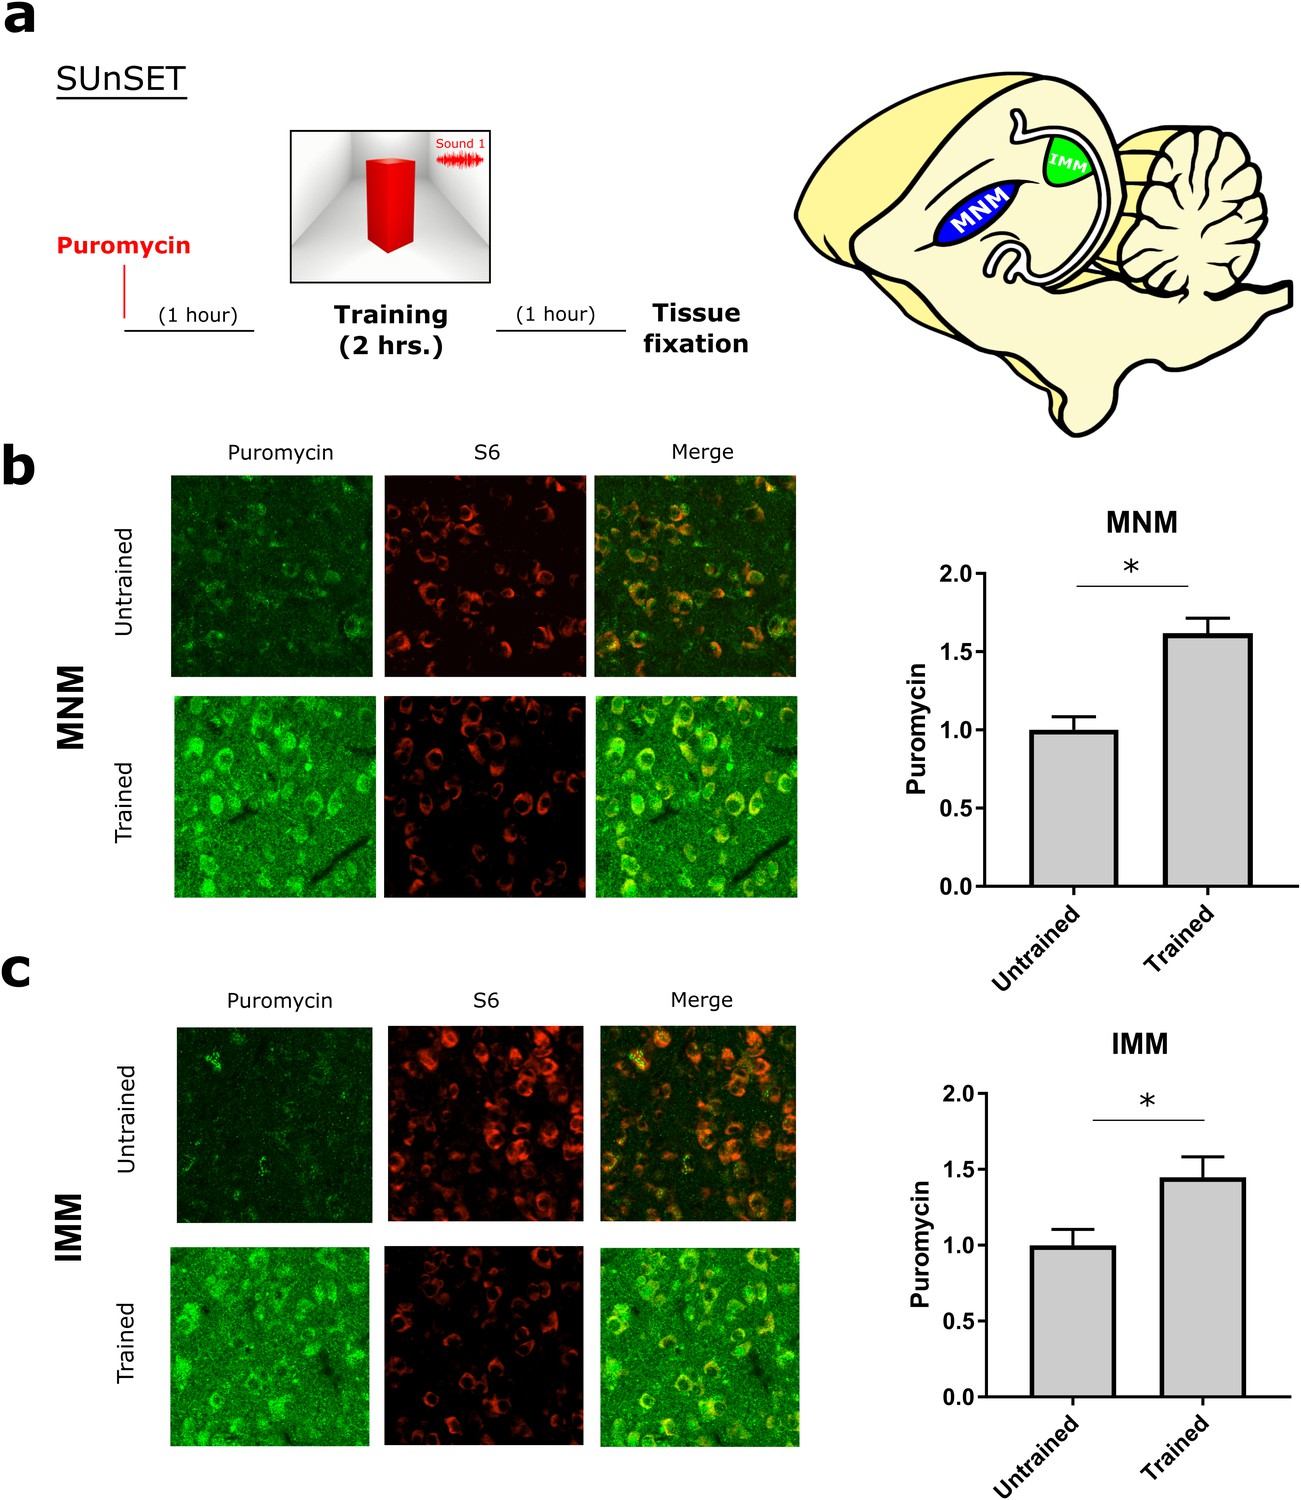
Experience-dependent increase in translation assessed with SUnSET.
(a) Temporally optimized SUnSET protocol to detect changes in translation in vivo (left) induced by the imprinting training. Schematic sagittal view of the chicken forebrain, showing the position of MNM and IMM (right). (b) The auditory imprinting area MNM (left) exhibits increased puromycin incorporation (green) after imprinting training, compared with MNM samples of chickens running on the wheel but not presented with the imprinting object. S6 (red) marker was used to identify cells somas. (c) In IMM (left) translation rates were also increased in trained animals. Sample sizes: MNM untrained (six chickens, 48 images at 10X, zoom 3X); MNM trained (six chickens, 48 images at 10X, zoom 3X); IMM untrained (six chickens, 48 images at 10X, zoom 3X); IMM trained (six chickens, 48 images at 10X, zoom 3X). Bar plots show mean and SEM; * indicates p<0.05 from unpaired Mann-Whitney test.
-
Figure 2—source data 1
SUnSET results from trained and untrained chickens.
Puromycin signal was measured in MNM and IMM.
- https://doi.org/10.7554/eLife.17197.006
Figure 3
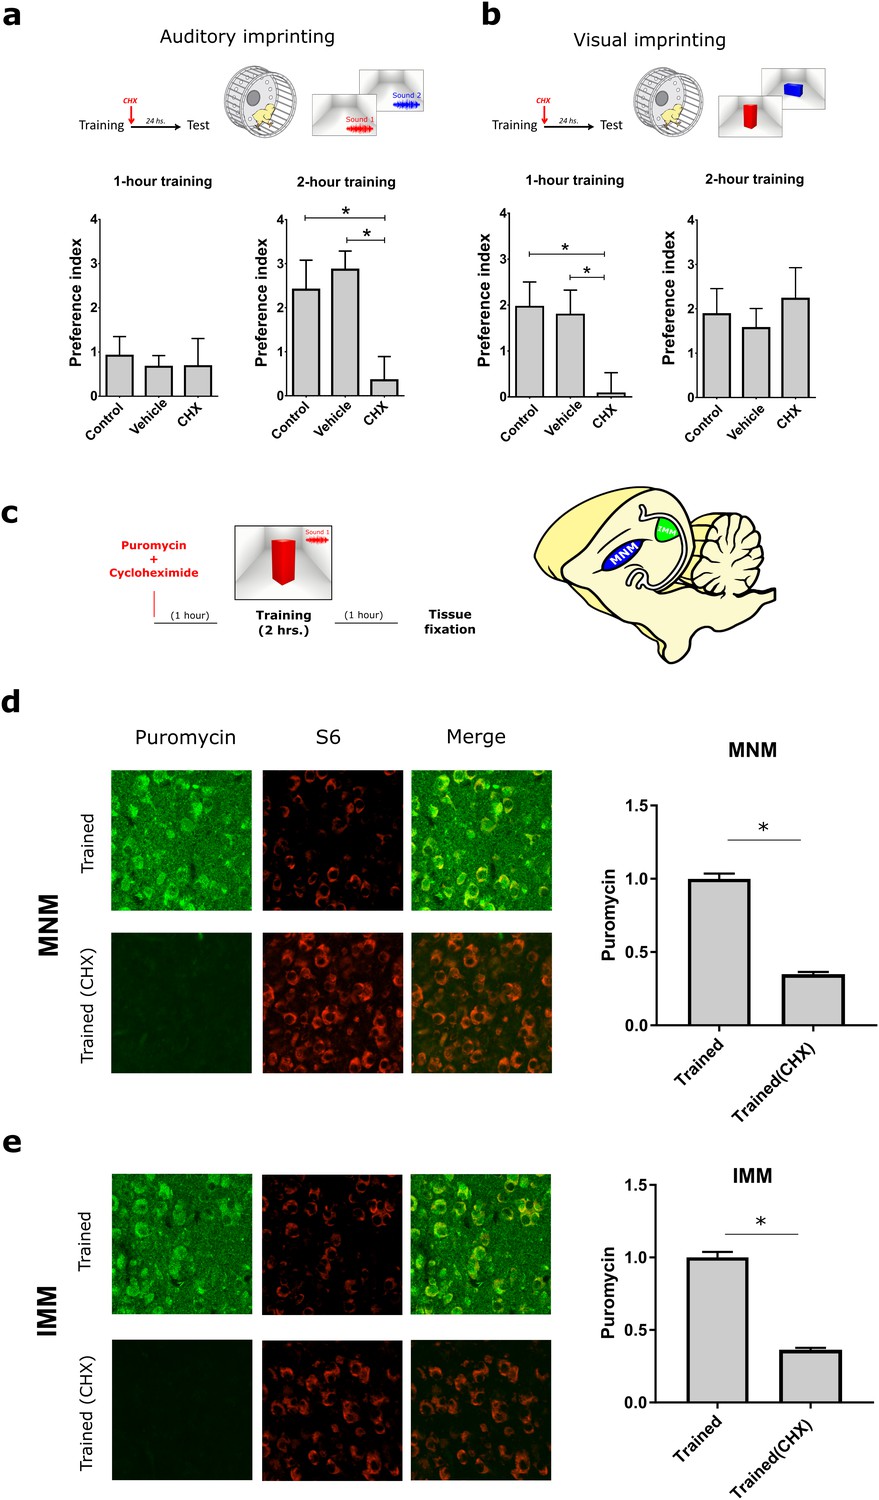
Protein synthesis requirement in auditory and visual imprinting.
(a) The protein-synthesis inhibitor cycloheximide (CHX, n = 12) injected immediately after 1 hr training (left) had no effect on the auditory preference index compared to controls (n = 15) and vehicle-injected (n = 14) groups. In contrast, 2 hr training, which induced stronger preference to the imprinted sound, was blocked by CHX-treatment (n = 11) compared to controls (n = 13) and vehicle-injected group (n = 9). (b) Visual imprinting was already robust after 1 hr training (left) in controls (n = 15) and chickens injected with vehicle (n = 14), and blocked by CHX-administration (n = 12). On the other hand, 2 hr training (right) also induced robust preference to the imprinted visual object in controls (n = 13) and vehicle-injected chickens (n = 9) but was not blocked by CHX administration (n = 12). Plots show mean and SEM, * indicates p<0.05 from two-ways ANOVA test, Bonferroni Post hoc test. (c) SUnSET protocol used to detect experience-dependent translation changes in MNM and IMM in the presence or absence of CHX. (d,e) Puromycin (green) incorporation is decreased in trained animals treated with CHX. S6 (red) was used to identify cell somas. Sample sizes: MNM trained (five chickens, 40 images at 10X, zoom 3X); MNM trained and CHX administration (six chickens, 48 images at 10X, zoom 3X); IMM trained (five chickens, 39 images at 10X, zoom 3X); IMM trained and CHX administration (six chickens, 47 images at 10X, zoom 3X). Bar plots show mean and SEM; * indicates p<0.05 from unpaired Mann-Whitney test.
-
Figure 3—source data 1
Preference indexes and SUnSET results from control chickens and injected with cycloheximide.
- https://doi.org/10.7554/eLife.17197.008
Figure 4 with 2 supplements
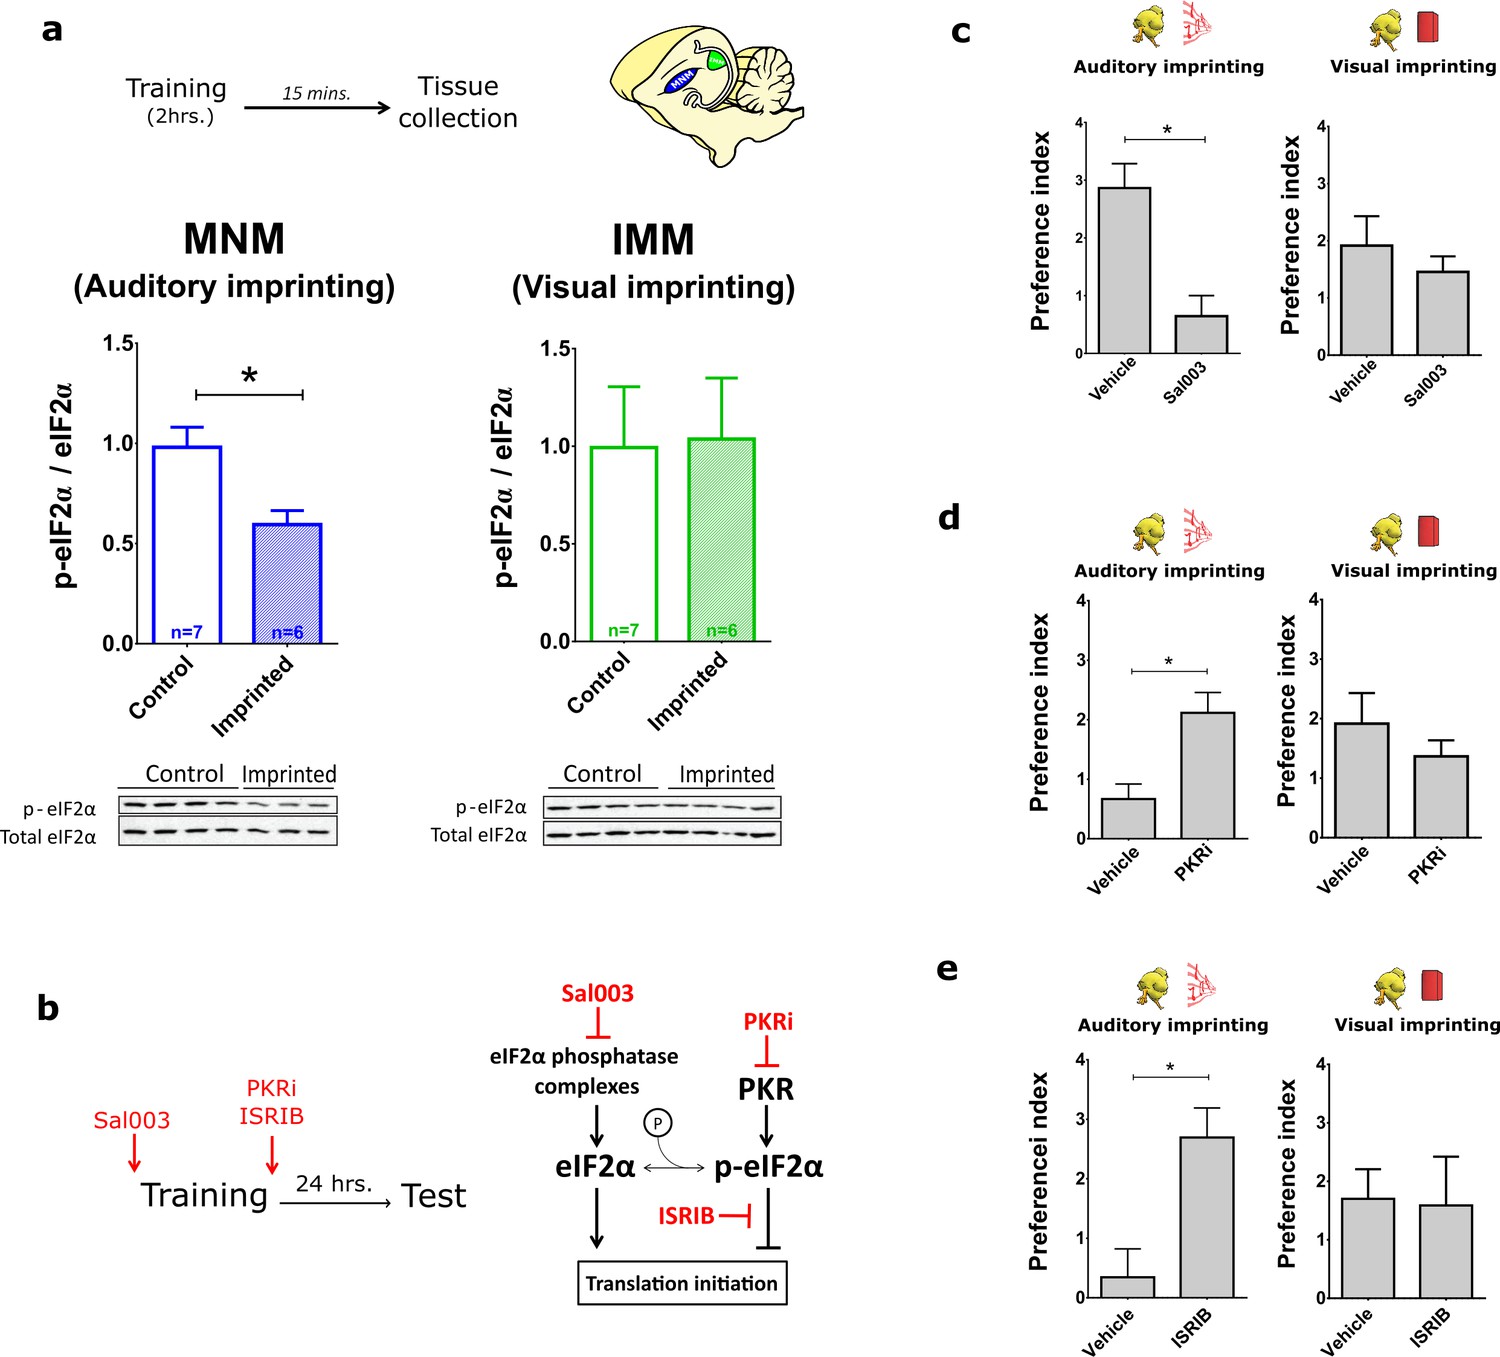
Translational control of auditory imprinting by eIF2α.
(a) After 2 hr imprinting training, IMM and MNM were punched out for western blot analysis. The ratio of phosphorylated eIF2α (p-eIF2α) and non-phosphorylated eIF2α was measured in controls and after training in MNM (left) and IMM (right) brain tissue. Trained chicks (n = 7) exhibited decreased eIF2α phosphorylation compared to the untrained (n = 6) in MNM but not in IMM. Representative western blots are shown below each panel. * indicates p<0.05 from unpaired Mann-Whitney test. (b) Left, drugs injected for targeting the eIF2α pathway. Right, schematic effect of pharmacological manipulations on the eIF2α pathway. (c) Auditory (left) but not visual (right) imprinting is blocked by Sal003 injection (n = 12) compared to controls injected with vehicle (n = 9). (d) Auditory imprinting (left) was enhanced in chickens injected with the PKR inhibitor PKRi (n = 26), compared to controls injected with saline vehicle (n = 14). On the other hand, PKRi (n = 26) had no effect on visual imprinting (right), compared to saline injection (n = 14). (e) Auditory imprinting (left) but not visual imprinting (right) was enhanced by ISRIB administration (n = 11) compared to controls injected with vehicle (n = 13). Bar plots represent mean and SEM, * indicates p<0.05 from unpaired t-test.
-
Figure 4—source data 1
Western blots of p-eIF2α/ total eIF2α ratio and behavioral pharmacology after targeting the eIF2α pathway.
- https://doi.org/10.7554/eLife.17197.010
Figure 4—figure supplement 1
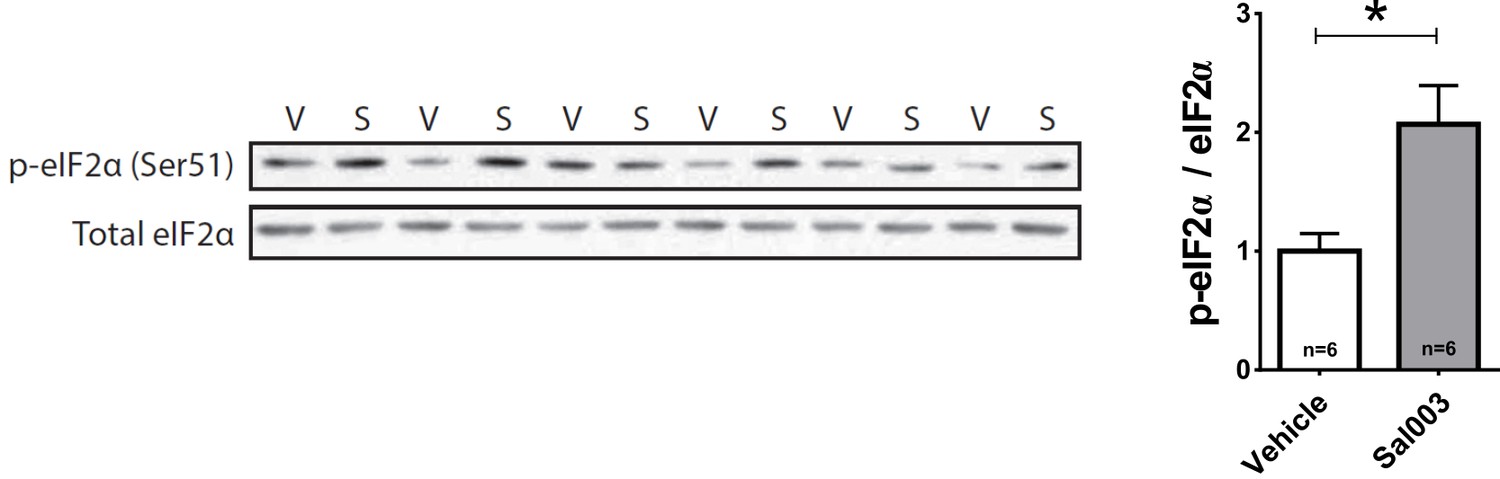
Sal003 increases eIF2α phosphorylation.
Western blots for p-eIF2α and total eIF2α of brain samples obtained from chickens 2 hr after injecting Sal003 (S) or vehicle (V). Sal003 treatment increased eIF2α phosphorylation. * indicates p<0.05 from Mann-Whitney U Test.
Figure 4—figure supplement 2
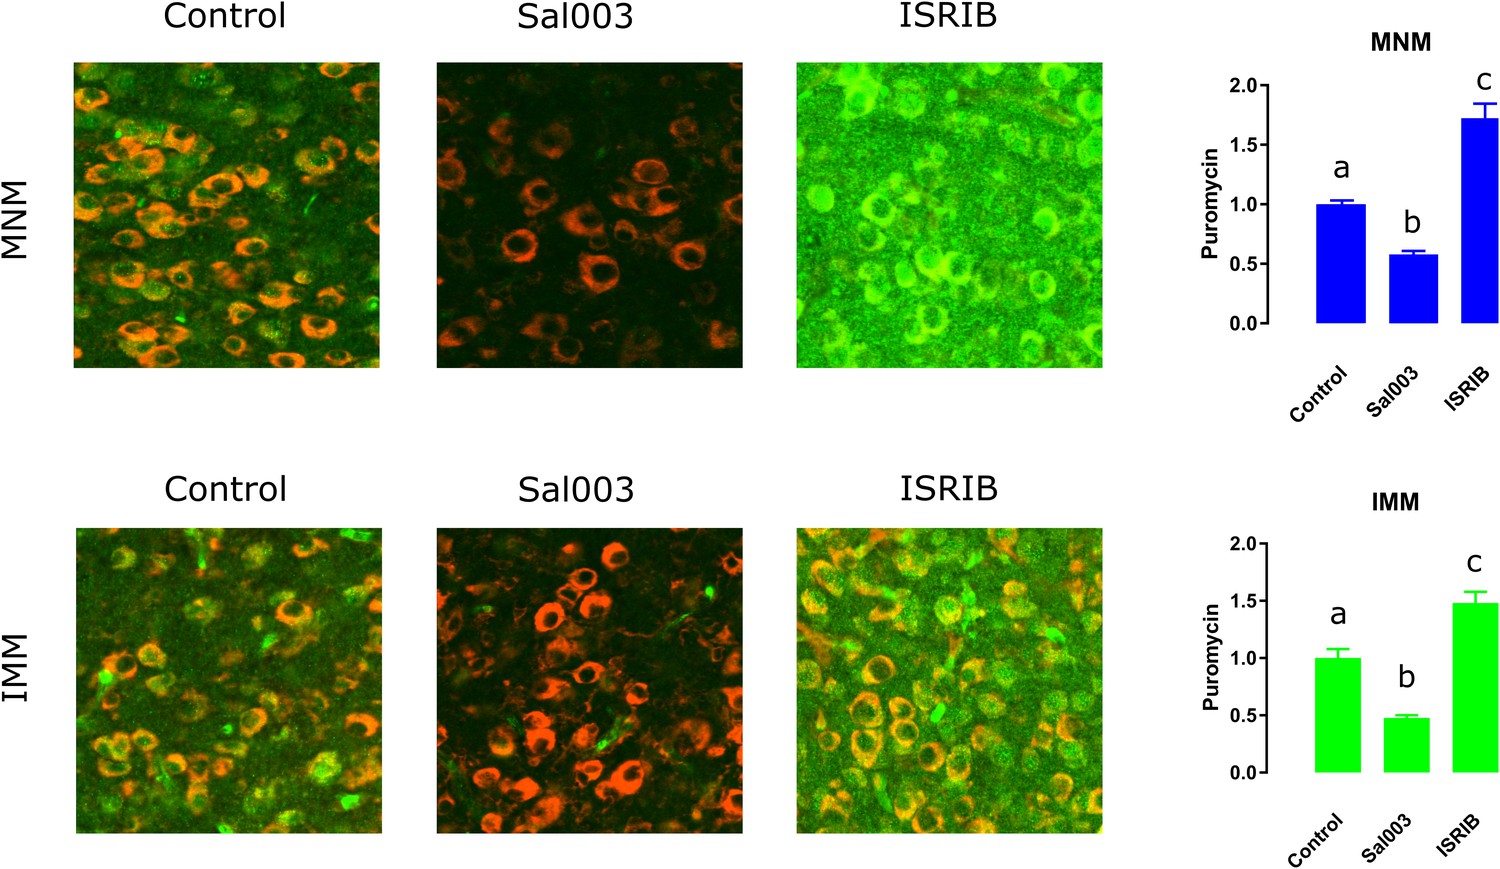
ISRIB and Sal003 injection modulate translation in vivo.
Sal003 and ISRIB can bi-directionally regulate protein synthesis. Both in MNM and IMM Sal003 reduces puromycin (green) incorporation while ISRIB enhances it. S6 (red) was used to localize cell somas. Bar plots show mean and SEM; different letters inside bars indicate statistically significant differences (p<0.05) between groups from Kruskal-Wallis test, Dunn’s multiple comparisons test.
Figure 5

Translational control of experience-dependent structural plasticity.
(a) Example diolistic labeling of a type I IMM neuron (63X), used to analyze the number and the shape of dendritic spines in MNM and IMM after training. (b) Representative confocal images of dendritic segments of IMM cells from untrained animals (63X, zoom 3X). (c) Schematic length (L) and shape criteria used for spine classification. (d) Trained chickens showed an increased number of mushroom spines (red) and a decrease in thin spines (blue) in MNM. The increase in mushroom spines induced by training was blocked by Sal003. Samples size: untrained (four chickens, 12 cells, 45 dendrites); imprinted (five chickens, 15 cells, 50 dendrites); Sal003 (five chickens, 15 cells, 55 dendrites). (e) Trained chickens showed an increase in mushroom spines (red) and a decrease in thin spines (blue) in IMM. In contrast to the changes in MNM, the increase in mushroom spines was not blocked by Sal003. Sample sizes: untrained (four chickens, 11 cells, 35 dendrites); imprinted (four chickens, 10 cells, 33 dendrites); Sal003 (five chickens, 16 cells, 48 dendrites). Total number of spines did not show significant differences across groups in either region. Bar plots show mean and SEM; different letters inside bars indicate statistically significant differences (p<0.05) between groups from Kruskal-Wallis test, Dunn’s multiple comparisons test.
-
Figure 5—source data 1
Dendritic spines numbers in MNM and IMM of untrained, trained and Sal003-treated chickens.
- https://doi.org/10.7554/eLife.17197.014
Figure 6
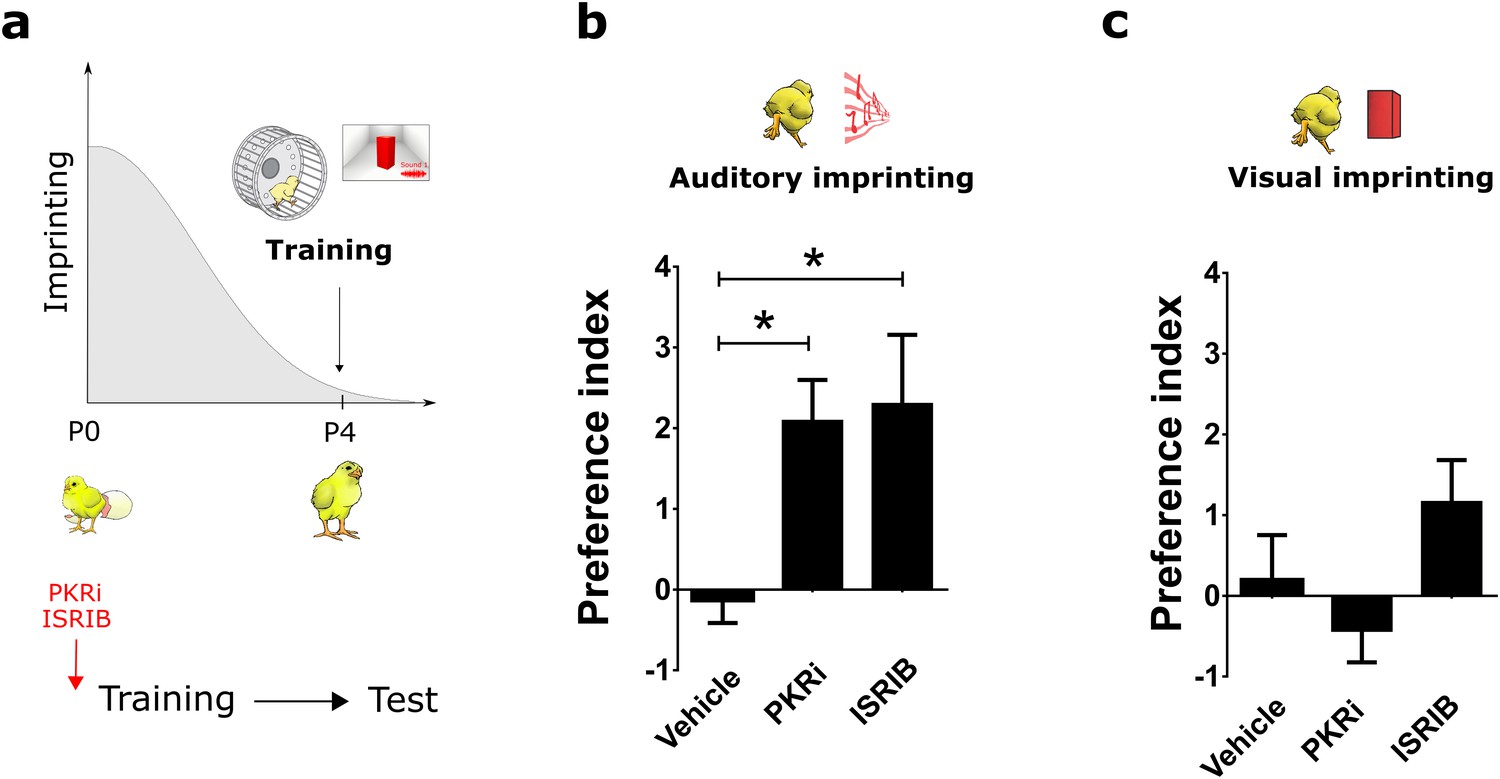
Reopening the critical period for visual and auditory imprinting through eIF2α.
(a) Chickens were trained 4 days after hatching (P4) and tested 24 hr after training. To target translational control by eIF2α, chickens were injected with PKRi or ISRIB. (b) Controls injected with vehicle (n = 12) did not show auditory imprinting at P4 but the critical period in animals treated with PKRi (n = 13) or ISRIB (n = 13) was reopened. (c) Visual imprinting was not restored in chickens injected with PKRi (n = 13) and ISRIB (n = 13) or injected with vehicle (n = 12). * indicates p<0.05 from two-ways ANOVA test, Bonferroni Post hoc test.
-
Figure 6—source data 1
Preference indexes of animals trained in P4 and injected with PKRi, ISRIB or vehicle.
- https://doi.org/10.7554/eLife.17197.016
Author response image 1
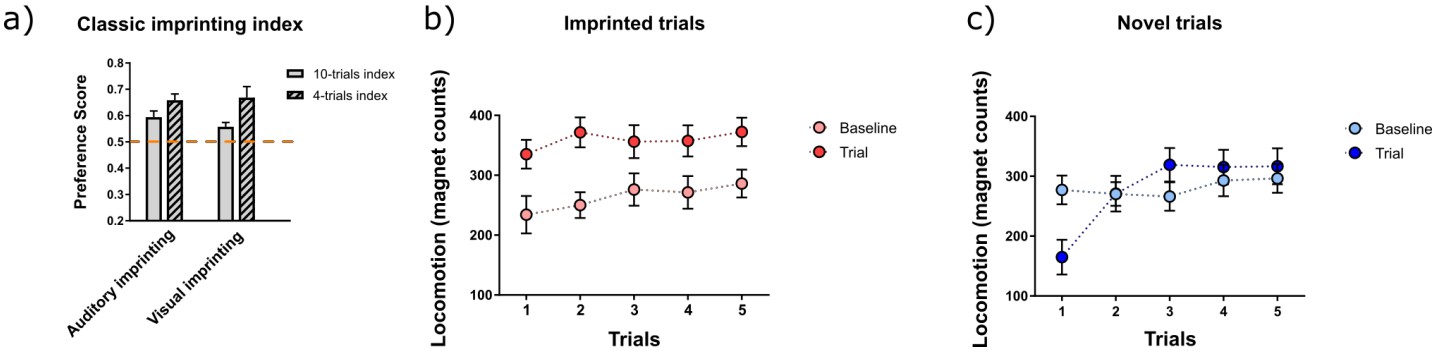
) Classic preference score (PS) for auditory and visual imprinting computed as PS=locomotion during imprinted trials/ total locomotion, in chickens trained for 2 hours (n=13), b) locomotion before and during the presentation of the imprinted stimulus (n=26, in each trial) and c) locomotion before and during the presentation of the novel stimulus (n=26, in each trial)
https://doi.org/10.7554/eLife.17197.020
Author response image 2
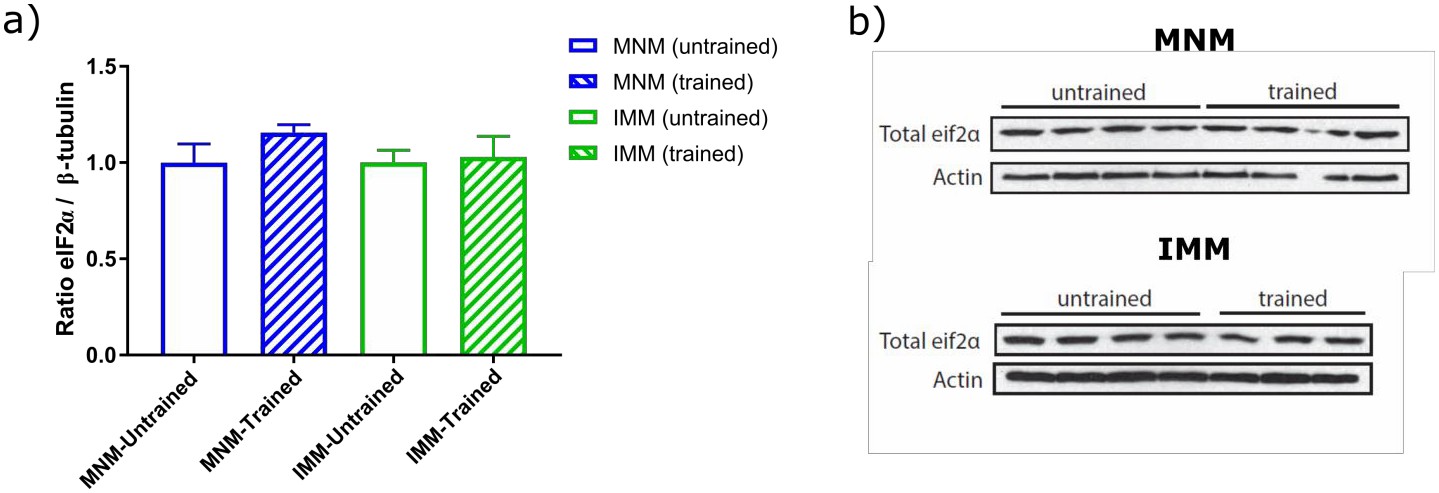
) total eIF2α levels normalized to ß-tubulin levels show no difference across untrained (n=7) and trained (n=6) animals, b) representative images of western blots performed for quantification.
https://doi.org/10.7554/eLife.17197.021
Author response image 3
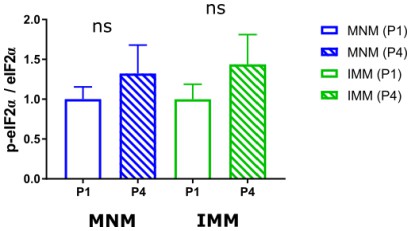
Quantification of p-eIF2α/eIF2α ration between P1 and P4 in MNM (blue, nP1=7, nP4=7) and IMM (green, nP1=7, nP4=7).
No significance was detected in both areas across developmental time points.
Author response image 4
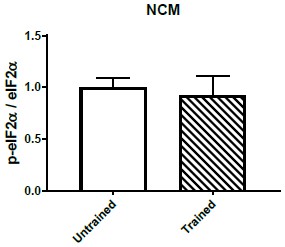
Quantification of p-eIF2α/eIF2α ratio in NCM comparing untrained (n=7) and trained (n=7) chickens.
No significant difference was detected between both areas across treatments.
Videos
Video 1
Stimulus A presented to chickens.
This animation was played on a screen during training. For auditory and visual imprinting tests only the auditory or the visual component was presented.
Video 2
Stimulus B presented to chickens.
This animation was played on a screen during training. For auditory and visual imprinting tests only the auditory or the visual component was presented.
Video 3
Chicken imprinted to stimulus B approaching the screen.
This approach behavior was quantified during the presentation of imprinted or novel stimuli to compute a preference index.
Download links
A two-part list of links to download the article, or parts of the article, in various formats.
Downloads (link to download the article as PDF)
Open citations (links to open the citations from this article in various online reference manager services)
Cite this article (links to download the citations from this article in formats compatible with various reference manager tools)
Translational control of auditory imprinting and structural plasticity by eIF2α
eLife 5:e17197.
https://doi.org/10.7554/eLife.17197


