KChIP2 is a core transcriptional regulator of cardiac excitability
- Case Western Reserve University, United States
- Cleveland Clinic, United States
Figures
Figure 1
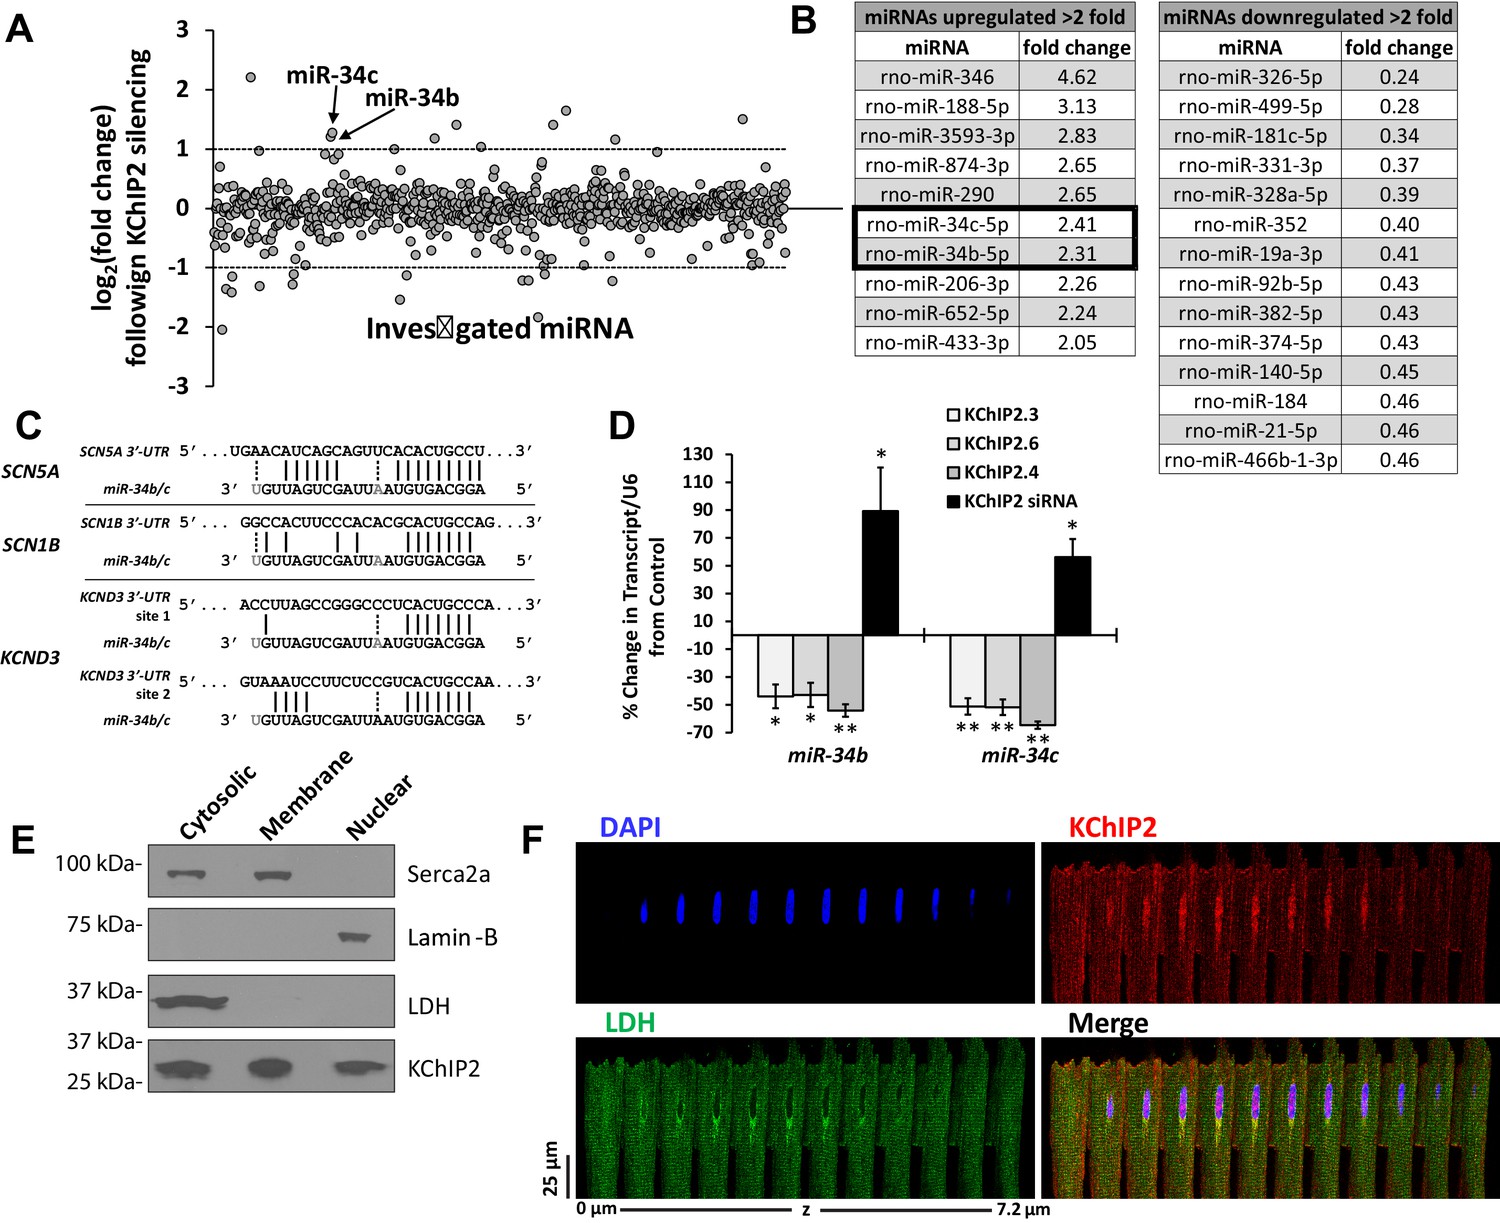
miR-34 regulation linked to changes in KChIP2 expression.
(A) Results of miRNA microarray showing the log2 of the fold changes in miR expression following 72 hr of KChIP2 siRNA treatment. Arrow identifies miR-34b and −34c amongst the panel of altered miRNAs. Analysis of miRNAs for mRNA targets using TargetScan 7.1 was restricted to those above two fold induction (dashed line) (B) Tables showing the list of those miRNAs showing at least a two fold increase or decrease following KChIP2 silencing. (C) Alignment of the 3’-UTR of SCN5A, SCN1B, and KCND3 genes with miRs-34b/c from rat, showing hybridization of the seed region. Grayed letters indicate variation in sequence between miR-34b and −34c. A single site of interaction is indicated for SCN5A and SCN1B while two sites exist for KCND3. (D) Real-time qPCR analysis showing percent change of miR-34b/c expression from control cells in NRVM transfected with KChIP2.3 (n = 5), KChIP2.6 (n = 6), KChIP2.4 (n = 4), or KChIP2 siRNA (n = 4–5). (E) Cytosolic, membrane, and nuclear fractions of native adult rat heart tissue. KChIP2 nuclear localization was assessed by using lactate dehydrogenase (LDH), Serca2a, and Lamin-B as cytoplasmic, membrane, and nuclear markers respectively. (F) Representative z-stack images of adult rat ventricular myocyte. Nuclear stained regions (DAPI, blue) show the absence of cytosolic protein LDH (green), while KChIP2 (red) staining reveals significant colocalization. Data presented as mean ± SEM. *p<0.05; **p<0.01, compared to control.
Figure 2
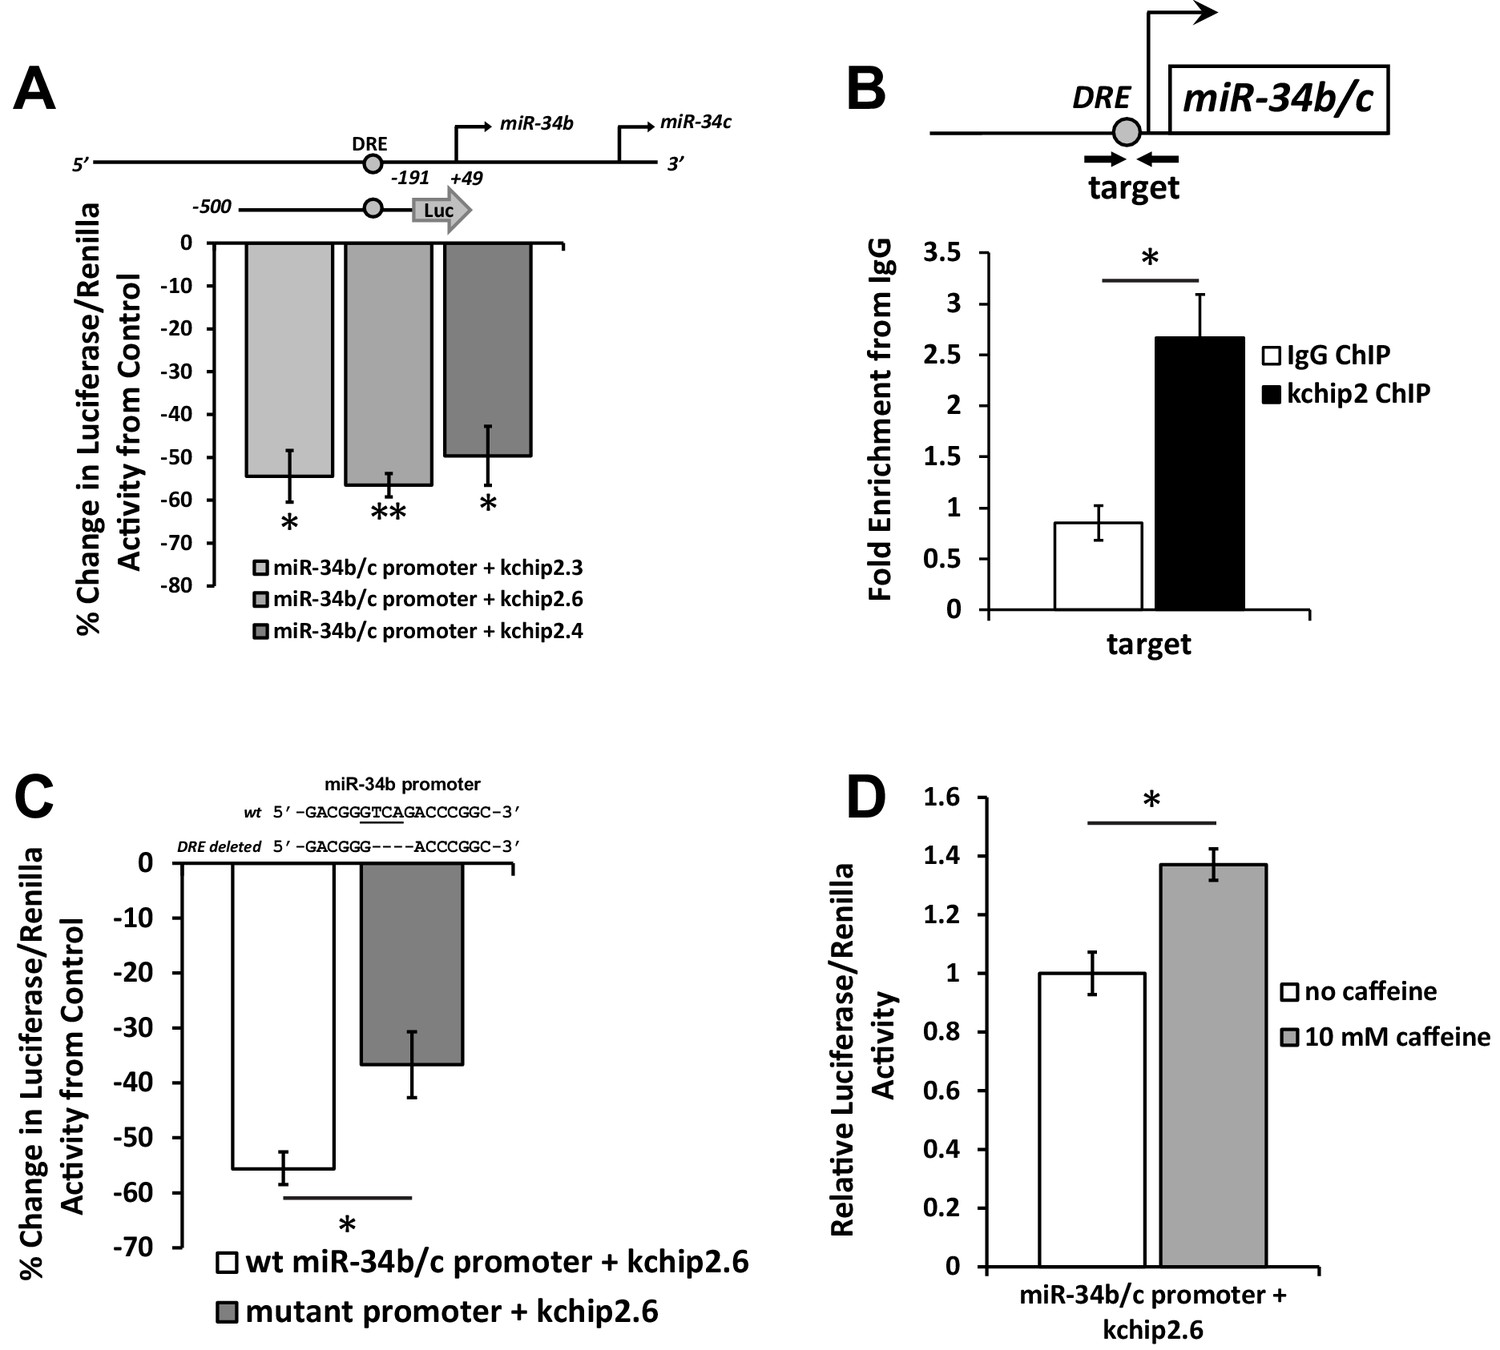
KChIP2 represses miR-34b/c expression by direct interaction with a putative DRE motif in promoter.
(A) A region from −500 to −191 of the miR-34b/c promoter was cloned into the promoterless luciferase construct, pGL4.10. This construct was co-transfected into COS-7 cells in the presence of KChIP2.3 (n = 3), KChIP2.6 (n = 8), or KChIP2.3 (n = 3) and compared to GFP alone. Renillin (pGL4.74) was used as a normalization control. Results are depicted as a % change in activity compared to GFP alone. (B) IgG and KChIP2 ChIP-PCR conducted on native adult rat cardiomyocytes. The target primer site residing within the cloned promoter was evaluated for enrichment following pull down (n = 3), showing significant enrichment of the target region. (C) Luciferase assay conducted in COS-7 cells to evaluate the outcome of deleting the putative DRE site in the miR-34b/c promoter. COS-7 cells were transfected with the same WT reporter construct inserted into the pGL4.10 vector or with the DRE motif deleted, both in the presence of KChIP2.6. Activity was normalized to renillin (pGL4.74). Deletion of a putative KChIP2 interaction site (DRE motif) partially abolished the repressive effect KChIP2.6 had over the miR-34b/c promoter (n = 4) compared to WT (n = 9). (D) COS-7 cells transfected with KChIP2.6 and the pGL4.10 containing the WT miR-34b/c promoter were treated with or without 10 mM caffeine for 6 hr, leading to promoter activation (n = 4). Results were normalized to renillin activity. Data presented as mean ± SEM. *p<0.05; **p<0.01, as indicated or compared to control.
Figure 3 with 1 supplement
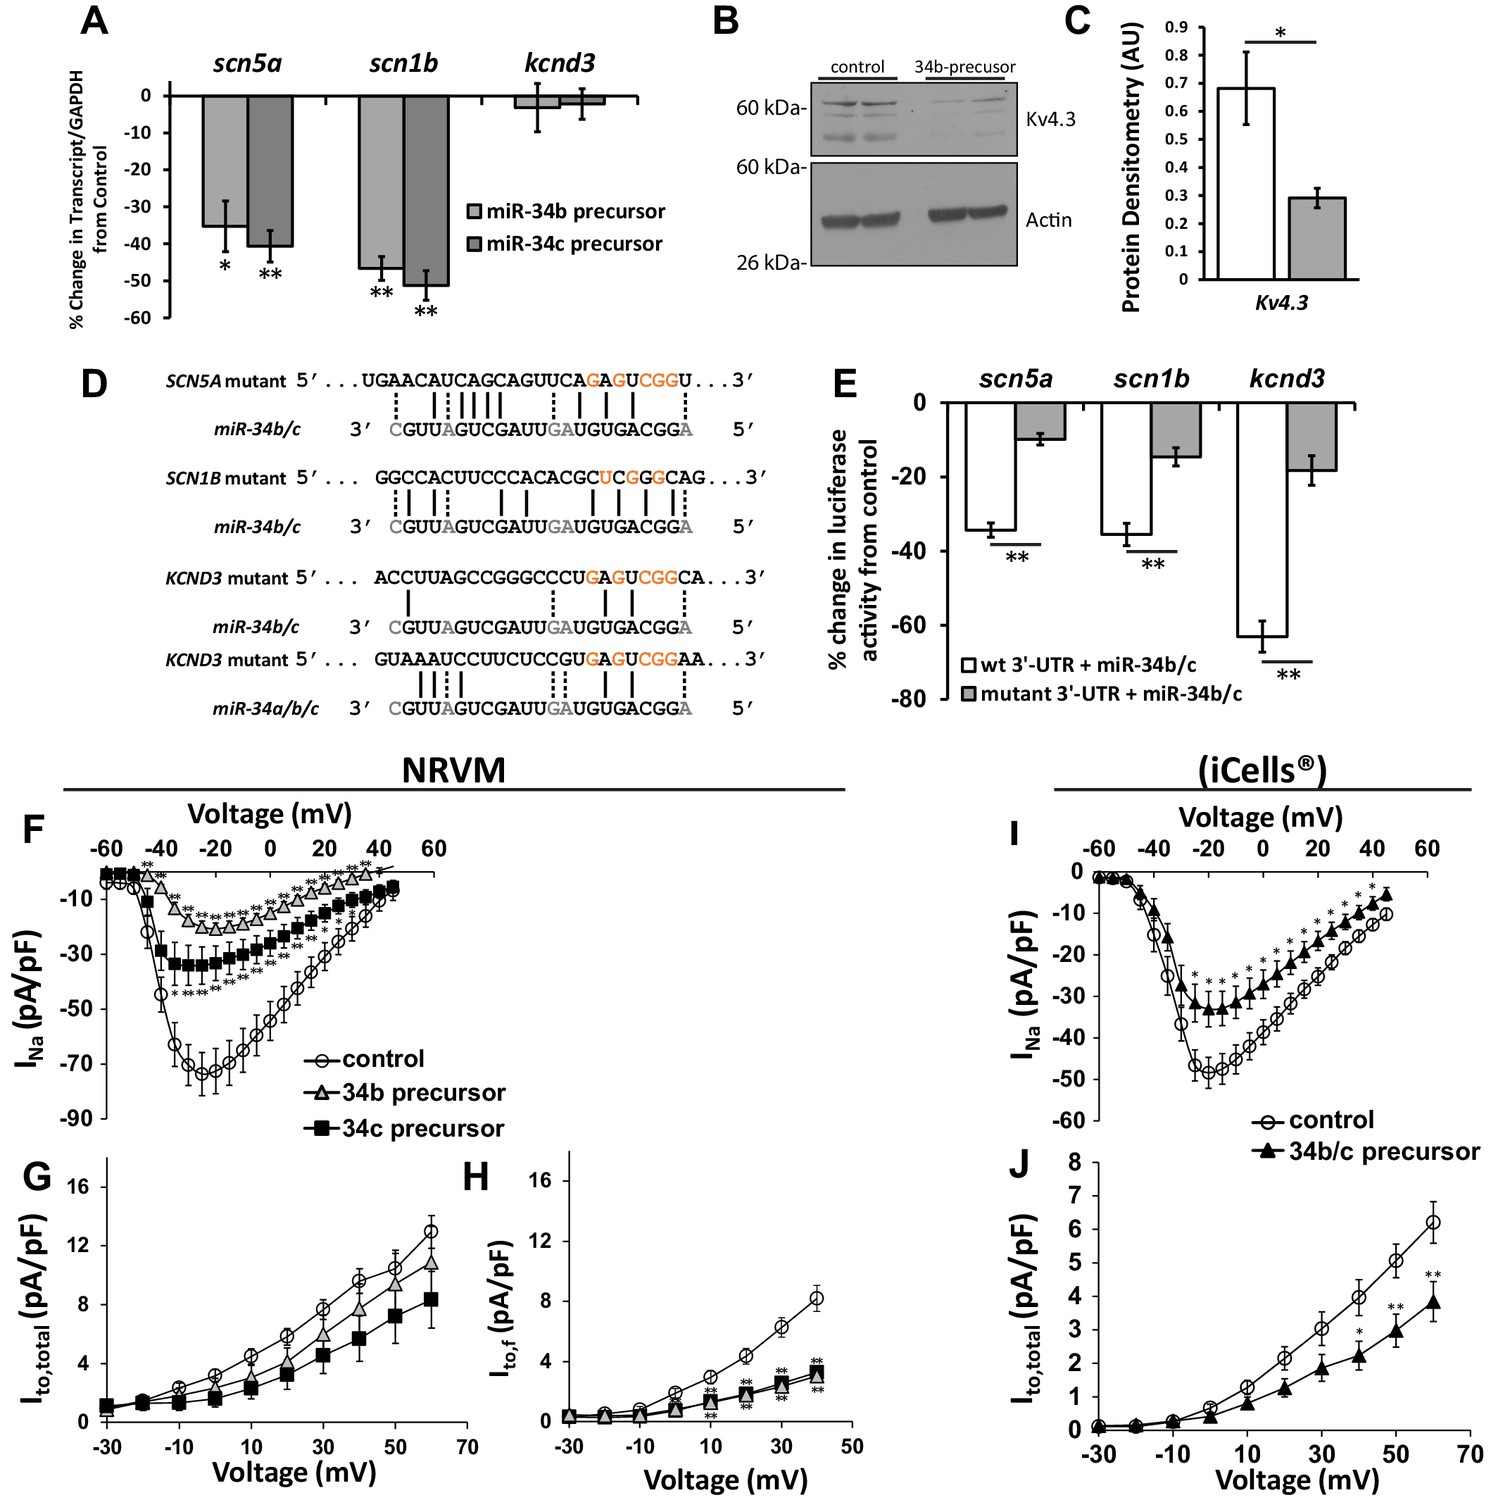
Cardiac ion channel directly regulated by miR-34a/b/c through interaction with their 3’-UTR.
(A) NRVM over-expressing precursors for miR-34b/c were collected for mRNA transcript levels. Results (normalized to non-targeting miR) show down-regulation of SCN5A, and SCN1B, but unchanged levels for KCND3 (n = 7–8). (B) Protein levels from NRVM with over-expressed miR-34b showing reduced protein expression for Kv4.3 (KCND3). Multiple bands for Kv4.3 represent different glycosylation states of the protein. (C) Summary data of the immunblot for Kv4.3 (n = 4). (D) Alignment of the 3’-UTR of SCN5A, SCN1B, and KCND3 genes with miRs-34b/c, with mutations made to the seed regions (highlighted in red) to disrupt interaction at the seed region. (E) Reporter assay with the 3’-UTR cloned into pmiRGlo reporter construct. Luciferase activity in HEK cells transfected with WT or mutant 3’-UTRs. Results are presented as a percent change from a non-targeting miR precursor (n = 5) normalized to renillin activity. (F) I/V curves for INa measured in NRVM over-expressing precursors for control (n = 24), miR-34b (n = 24), or miR-34c (n = 18). (G) I/V curves for Ito,total measured in NRVM over-expressing precursors for control (n = 15), miR-34b (n = 12), or miR-34c (n = 11). (H) Ito,f was also assessed in NRVM through kinetic subtraction of Ito,s. Resulting I/V curves now reveal a significant reduction in current density in miR-34b (n = 14) and miR-34c (n = 15) precursor treated cells compared to control (n = 16). (I) The same experiments conducted in human derived cardiomyocytes (iCells) expressing either control or miR-34b/c precursor together, measuring INa (control, n = 24; miR-34b/c, n = 21) and (J) Ito,total (control, n = 24; miR-34b/c, n = 25). Data presented as mean ± SEM. *p<0.05; **p<0.01, as indicated or compared to control. See also Figure 3—figure supplement 1.
Figure 3—figure supplement 1
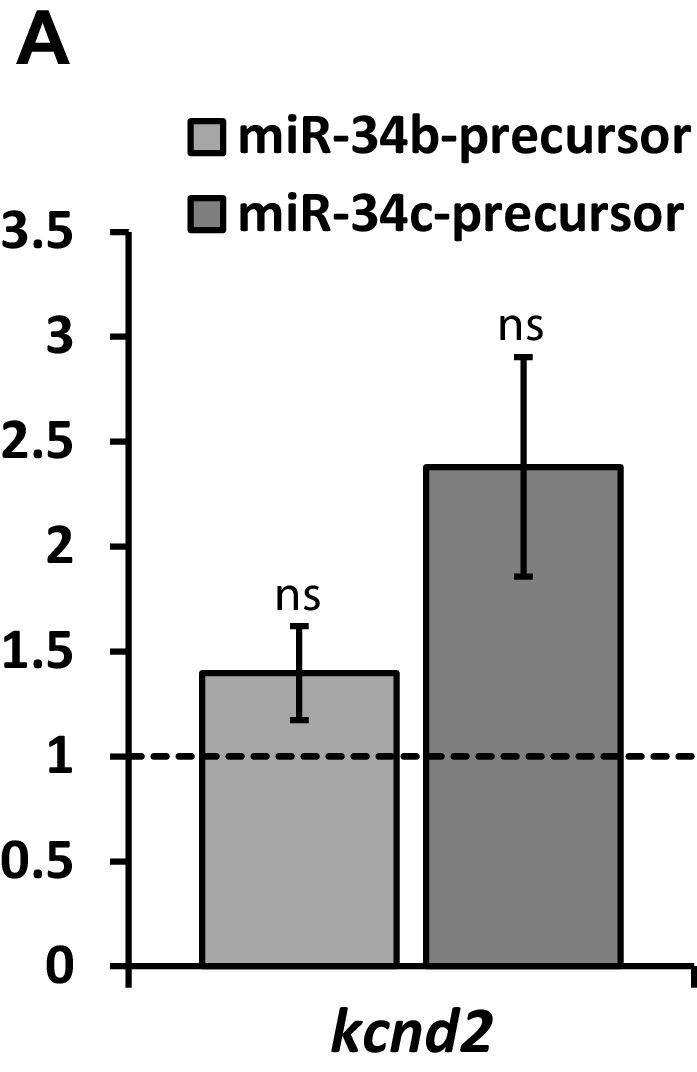
Kv4.2 (kcnd2) expression in NRVM following expression of miR-34b/c precursor.
RT-qPCR detection of Kv4.2 (kcnd2) following over-expression of miR-34b/c precursors expressed in NRVM. Results reflect fold changes relative to a control miR-precursor (n = 7). While the elevation in kcnd2 following miR-34b/c over-expression is not significant, a strongly trended elevation in suggests compensatory upregulation of Kv4.2, contributing to the minimal loss of Ito in NRVM, despite significant Kv4.3 loss. Data presented as mean ± SEM.
Figure 4
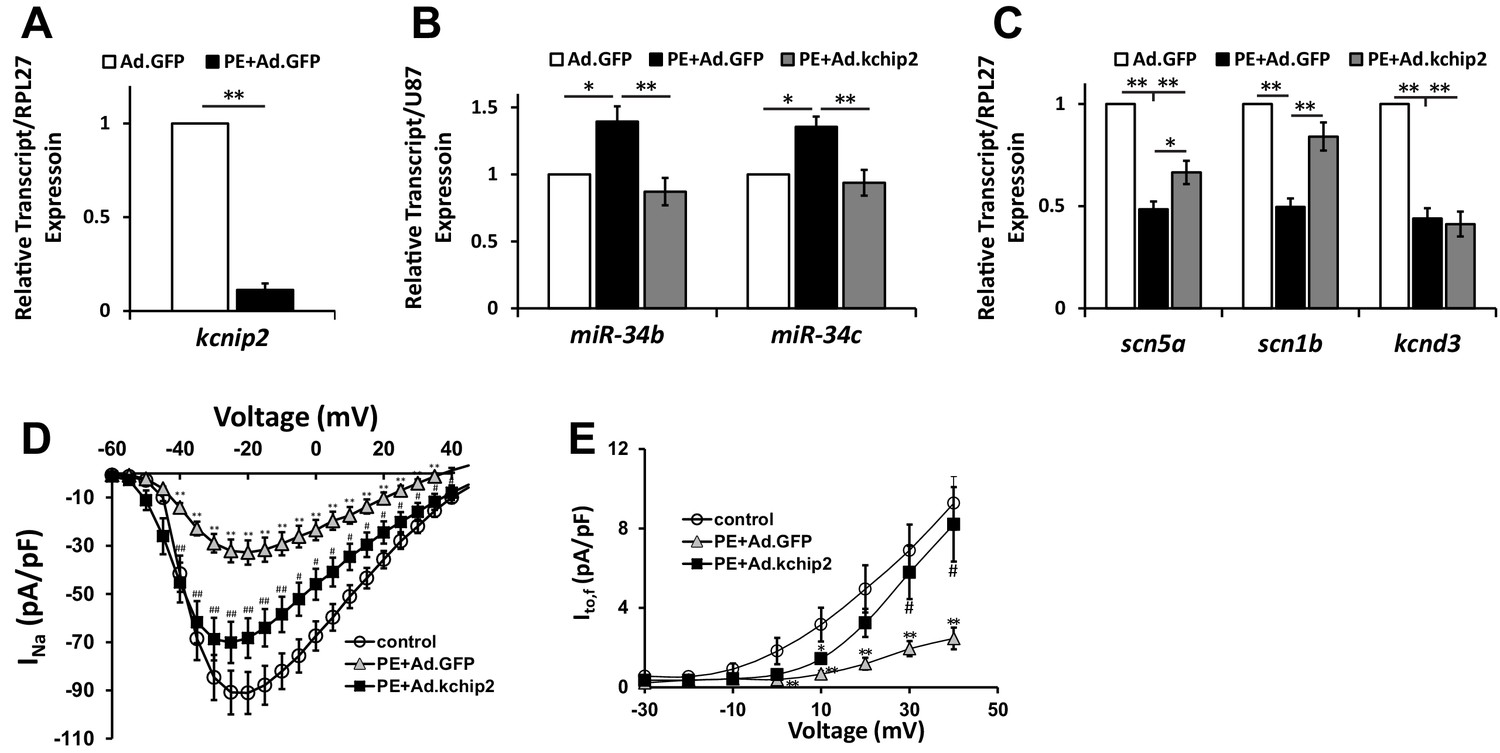
In vitro cardiac disease signaling links KChIP2 loss with miR-34 elevation.
(A) Real-time qPCR evaluation of relative kcnip2 following treatment with 100 μM PE for 48 hr in NRVM (n = 6). Results normalized to ribosomal protein RPL27. (B) Evaluation of miR-34b (n = 8) and miR-34c (n = 7) relative expression in NRVM under control (no PE with Ad.GFP), 100 μM PE with Ad.GFP, or 100 μM PE with Ad.KChIP2 to maintain KChIP2 expression during the 48 hr treatment. Expression levels were normalized to small nucleolar RNA, U87. (C) The same treatment conditions in (B), evaluating relative mRNA expression for SCN5A (n = 10), SCN1B (n = 10), and KCND3 (n = 7). (D) Functional current-voltage measurements of INa from NRVM under control (n = 29), PE+Ad.GFP (n = 27), and PE+Ad.KChIP2 (n = 30). (E) I/V curve for Ito,f recordings in control (n = 7), PE+Ad.GFP (n = 9) and PE+Ad.KChIP2 (n = 9). Data presented as mean ± SEM. *p<0.05, **p<0.01, as indicated or compared to control, #p<0.05, compared to PE+Ad.GFP.
Figure 5

Preservation of the KChIP2/miR-34b/c axis in human heart failure.
(A) Human tissue taken from the left ventricle of non-failing (NF) (n = 8) and failing patients (n = 20) evaluating KChIP2 and miR-34b/c RNA expression. KChIP2 levels were normalized to GAPDH and miR expression to small nucleolar RNA U6. (B) Evaluation of the human miR-34b/c reveals a conserved DRE motif in proximity of the miR-34b stem loop (−242 bp), as predicted by MatInspector, suggesting conservation of KChIP2 activity in the regulation of miR-34b/c expression. (C) Human heart failure tissue evaluating RNA levels for SCN5A, SCN1B, and KCND3. Significant reductions in heart failure samples (n = 20) were observed for SCN5A and KCND3, but not for SCN1B, compared to non-failing tissue (n = 8). (D) Alignment of the 3’-UTR of SCN5A, SCN1B, and KCND3 genes with miRs-34b/c from human. Grayed letters indicate variation in sequence between miR-34b and −34c. A single site of interaction is indicated for SCN5A, matching observations in the rat, while KCND3 has three potential sites, compared to two observed in the rat. Notably, SCN1B miR-34b/c targeting is not conserved in human shown by imperfect hybridization in the seed region. Data presented as mean ± SEM. *p<0.05; **p<0.01, as indicated or compared to control. #p<0.05, ##PP<0.01 compared to PE+Ad.GFP.
Figure 6 with 1 supplement

miR-34 block reverses loss of both INa and Ito in disease signaling.
(A) INa I/V curve measured in NRVM transfected with either non-targeting antimirs (control, n = 26), non-targeting miR + 100 μM PE (PE+control antimir, n = 20), or miR-34b/c antimirs + 100 μM PE (PE+miR-34 antimir, n = 21) for 48 hr. (B) Ito,total I/V measurements in NRVM showing current density is lost in PE+control (n = 16) and remains down in the PE+miR-34 antimir (n = 16), compared to control (n = 17) cells. (C) Ito,f I/V measurements in NRVM. Cells treated with PE+control antimir (n = 22) have reduced current density, that is now partially restored in the PE+miR-34 antimir (n = 23) cells compared to control (n = 27). (D) I/V curve for INa taken in iCells showing that miR-34 antimirs (n = 6) can rescue current density back toward control (n = 6), when compared to PE+control (n = 6). (D) I/V curve for Ito,total measurements in iCells showing miR-34b/c antimir in the presence of PE (n = 15) can rescue current density towards control (n = 15) while PE+control (n = 15) remains reduced. Data presented as mean ± SEM. *p<0.05 versus control, **p<0.01, as indicated or compared to control antimir, #p<0.05, ##p<0.01 compared to PE+control antimir. See also Figure 6—figure supplement 1.
Figure 6—figure supplement 1
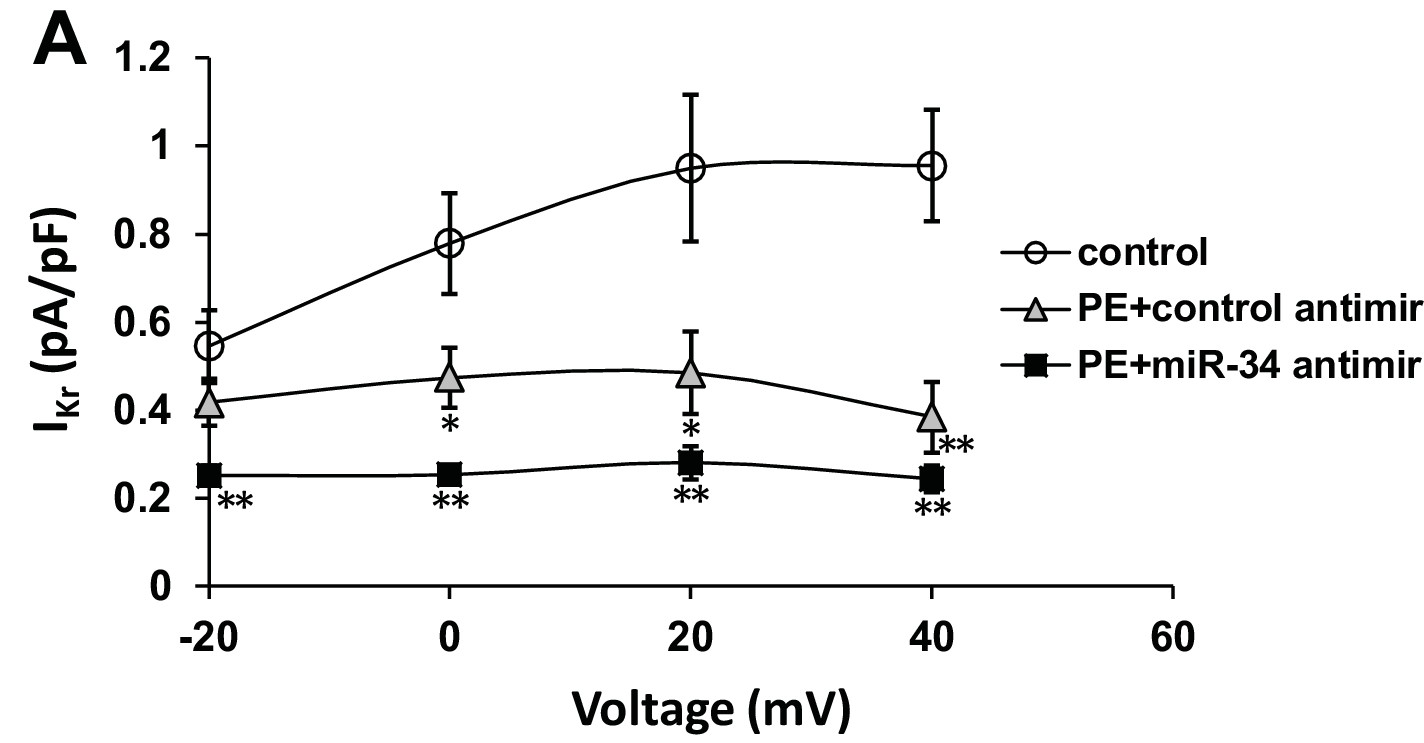
IKr is insensitive to miR-34 block following PE stimulation.
(A) IKr I/V curve measured in iCells transfected with either non-targeting antimirs (control, n = 6), non-targeting miR + 100 μM PE (PE+control antimir, n = 6), or miR-34b/c antimirs + 100 μM PE (PE+miR-34 antimir, n = 6) for 48 hr. Lack of restoration suggests specificity of miR-34b/c targeting to specific ion channel transcripts. Data presented as mean ± SEM. *p<0.05, **p<0.01, versus control.
Figure 7
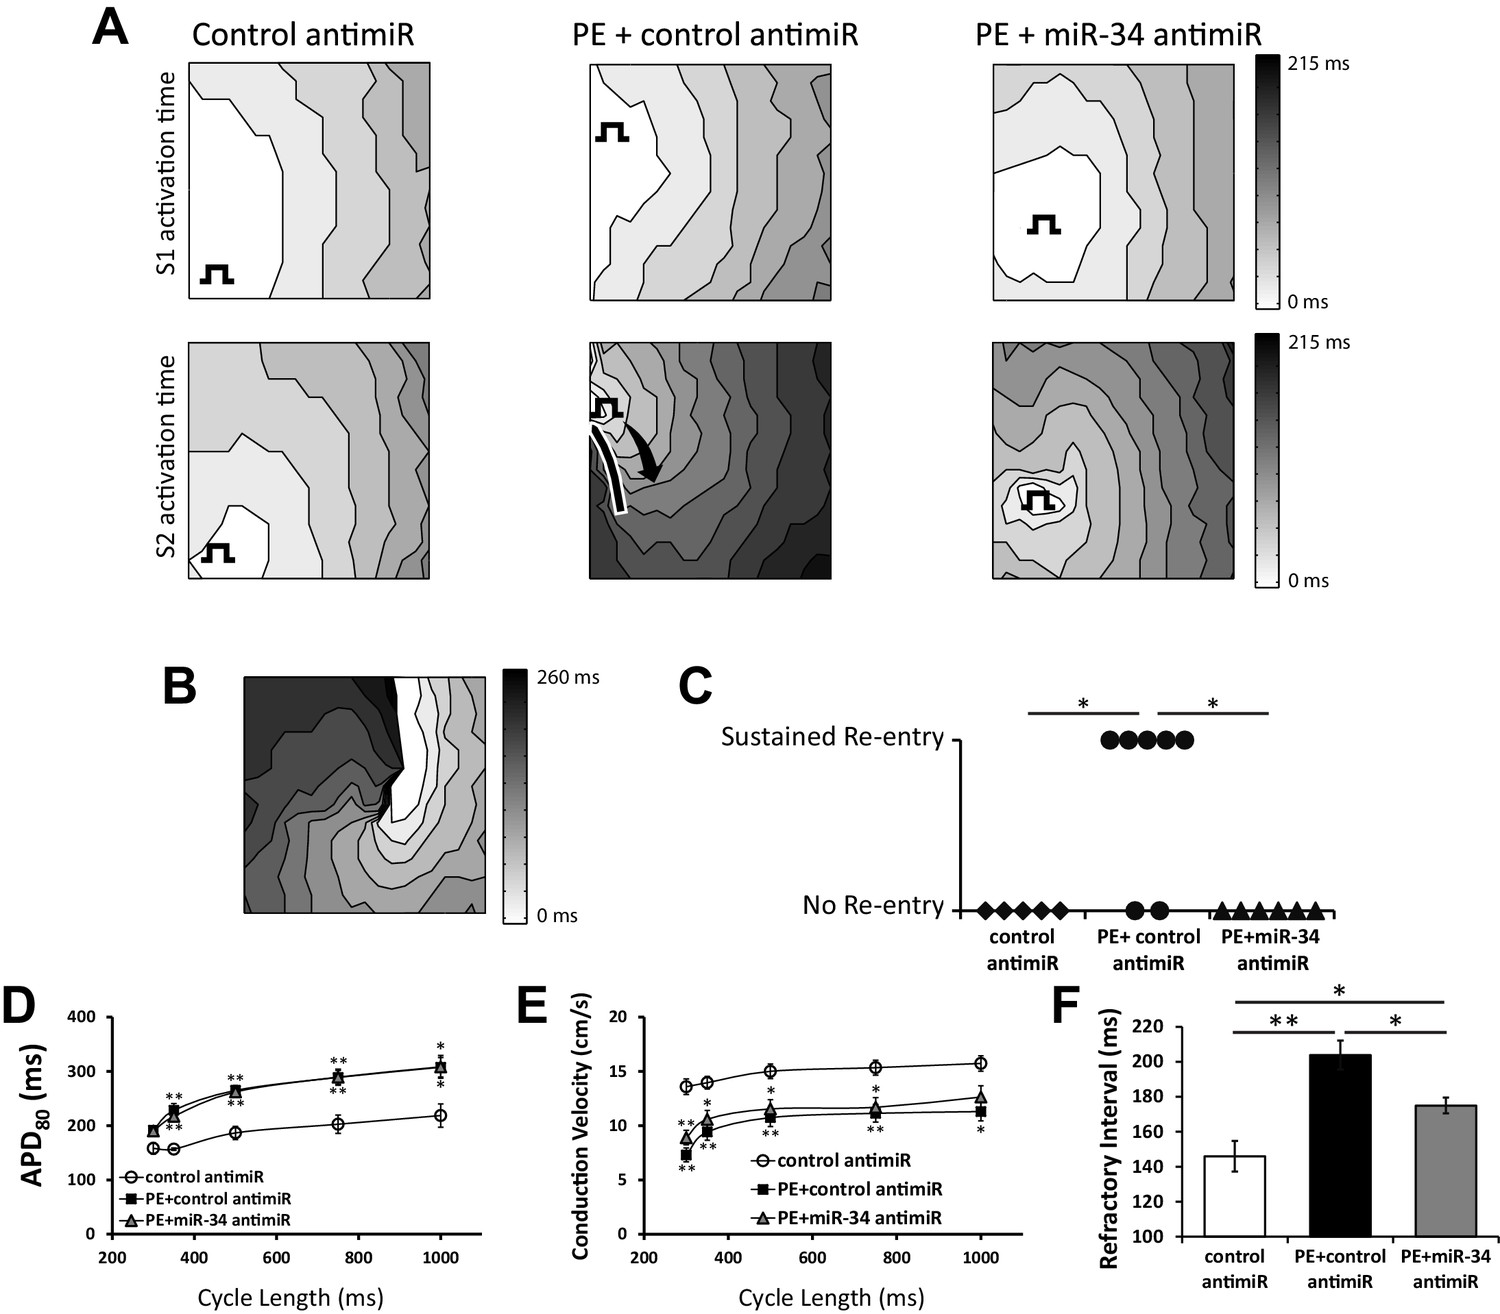
miR-34 block retains excitability in NRVM monolayers following prolonged PE treatment.
(A) Isochronal conduction maps of monolayers submitted to PE (100 μM) with either a non-targeting control or miR-34b/c antimir. Conduction maps on the top row represent the final S1 (750 ms) preceding the S2, showing no pre-existing abnormalities in propagation. The square function represents the site of pacing. The second row shows the first incidence of capture of the premature stimulus (S2). PE + control antimir results in significant conduction block around the pacing site (solid line). Conduction block was minimal in control and PE + miR-34b/c antimir groups. (B) Conduction map showing an example of sustained reentry for the PE + control antimir treated group shown in (A). (C) Summary data for the occurrence of sustained reentry following S1S2 pacing. (D) Restitution curve of APD80 in paced NRVM monolayers treated with either control antimir (n = 6–8), PE + control antimir (n = 6–11), or PE + miR-34b/c antimir (n = 7–12). (E) Conduction velocity restitution curve in paced NRVM monolayers treated with either control antimir (n = 6–8), PE + control antimir (n = 6–11), or PE + miR-34b/c antimir (n = 17–12). (F) Measurement of the effected refractory interval evaluated by identifying the shortest premature stimulus that would elicit capture or arrhythmia induction, under control (n = 6), PE+control antimir (n = 13), and PE+miR-34b/c antimir (n = 12). Data presented as mean ± SEM. *p<0.05, **p<0.01, as indicated or compared to control antimir.
Additional files
-
Supplementary file 1
List of genes regulated from microarray following KChIP2 silencing.
- https://doi.org/10.7554/eLife.17304.012
Download links
A two-part list of links to download the article, or parts of the article, in various formats.
Downloads (link to download the article as PDF)
Open citations (links to open the citations from this article in various online reference manager services)
Cite this article (links to download the citations from this article in formats compatible with various reference manager tools)
KChIP2 is a core transcriptional regulator of cardiac excitability
eLife 6:e17304.
https://doi.org/10.7554/eLife.17304


