Midbrain dopamine neurons signal aversion in a reward-context-dependent manner
- Harvard University, United States
Figures
Figure 1
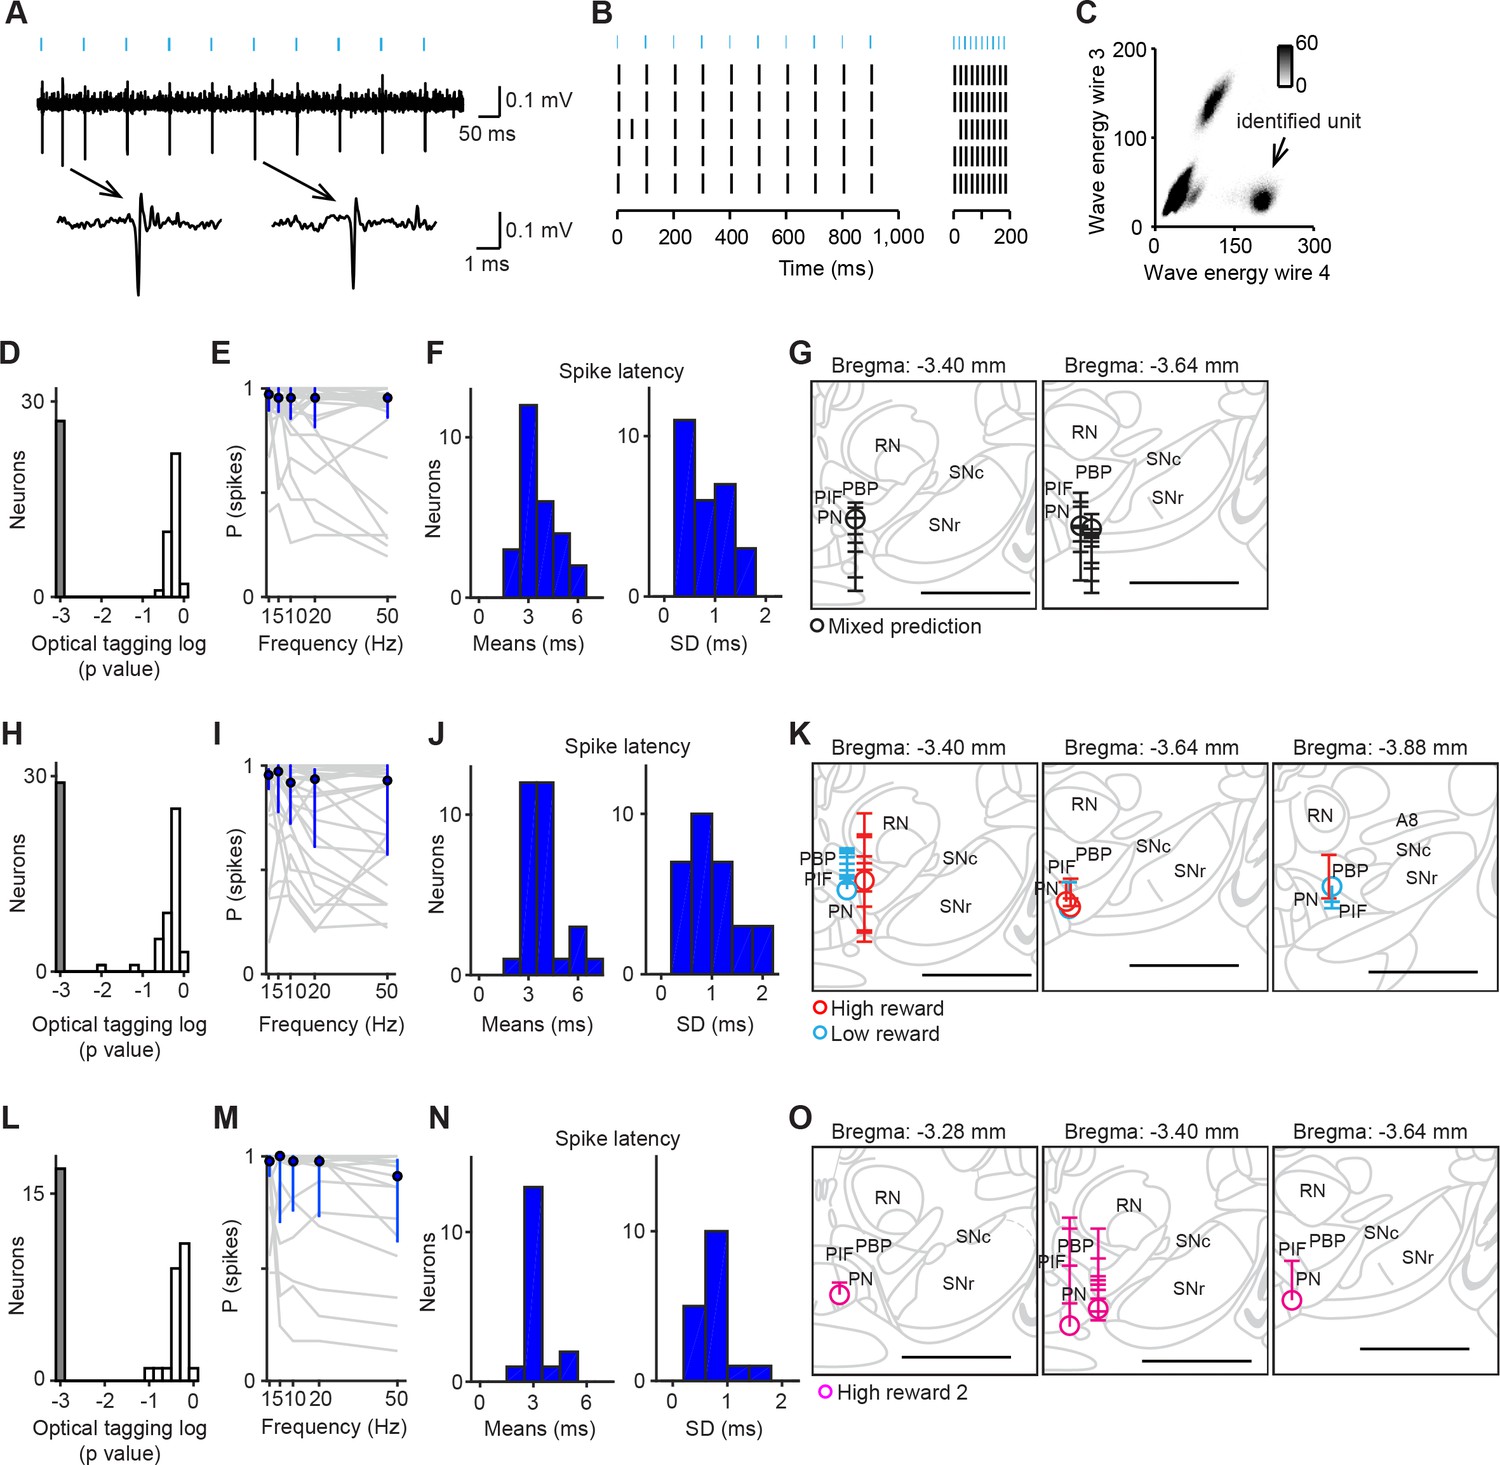
Optogenetic identification of dopamine neurons in the ventral tegmental area (VTA).
(A) Voltage trace from 10 pulses of 10 Hz light stimulation (cyan bars, top) of a representative dopamine neuron. A spontaneous spike and a light-triggered spike were magnified at the bottom. (B) Responses from this neuron to 10 Hz (left) and 50 Hz (right) stimulation. (C) Isolation of an identified dopamine neuron from noise and other units. (D) Histogram of p values testing whether light-activation induced significant changes in spike timing (n = 62 neurons) in the mixed prediction task. The p values were derived from SALT (Stimulus-Associated spike Latency Test; see Materials and methods). Neurons with p values < 0.001 and waveform correlations > 0.9 were considered identified (grey). P values and waveform correlations were calculated using light stimulation with all the frequencies (1–50 Hz). (E) Probability of light-evoked spike as a function of stimulation frequency for each dopamine neuron (grey) and the average across dopamine neurons (blue circles and bars, median and interquartile range). (F) Histograms of the mean (left) and S.D. (right) spike latency to light stimulation with all the frequencies (1–50 Hz) for 26 identified dopamine neurons. (G) Reconstruction of the positions of individual dopamine neurons recorded in the mixed prediction task. Each circle represents a lesion site from individual animals used in the mixed prediction task. Each horizontal line on the track (indicated by a vertical line over the lesion site) indicates estimated recording positions of individual dopamine neurons. Labeled structures: parabrachial pigmented nucleus of the VTA (PBP), parainterfascicular nucleus of the VTA (PIF), paranigral nucleus of the VTA (PN), red nucleus (RN), substantia nigra pars compacta (SNc), and substantia nigra pars reticulata (SNr). Scale bar, 1 mm. (H–J) Optogenetic identification of dopamine neurons recorded in high and low reward probability tasks (29 dopamine neurons identified out of 73 neurons). Conventions are the same as in D–F. (K) Reconstruction of the positions of individual dopamine neurons recorded in high (red) and low (cyan) reward probability tasks. Conventions are the same as in G. (L–N) Optogenetic identification of dopamine neurons recorded in high reward probability task 2 (17 dopamine neurons identified out of 41 neurons). (O) Reconstruction of the positions of individual dopamine neurons recorded in high reward probability task 2 (magenta).
Figure 2 with 1 supplement
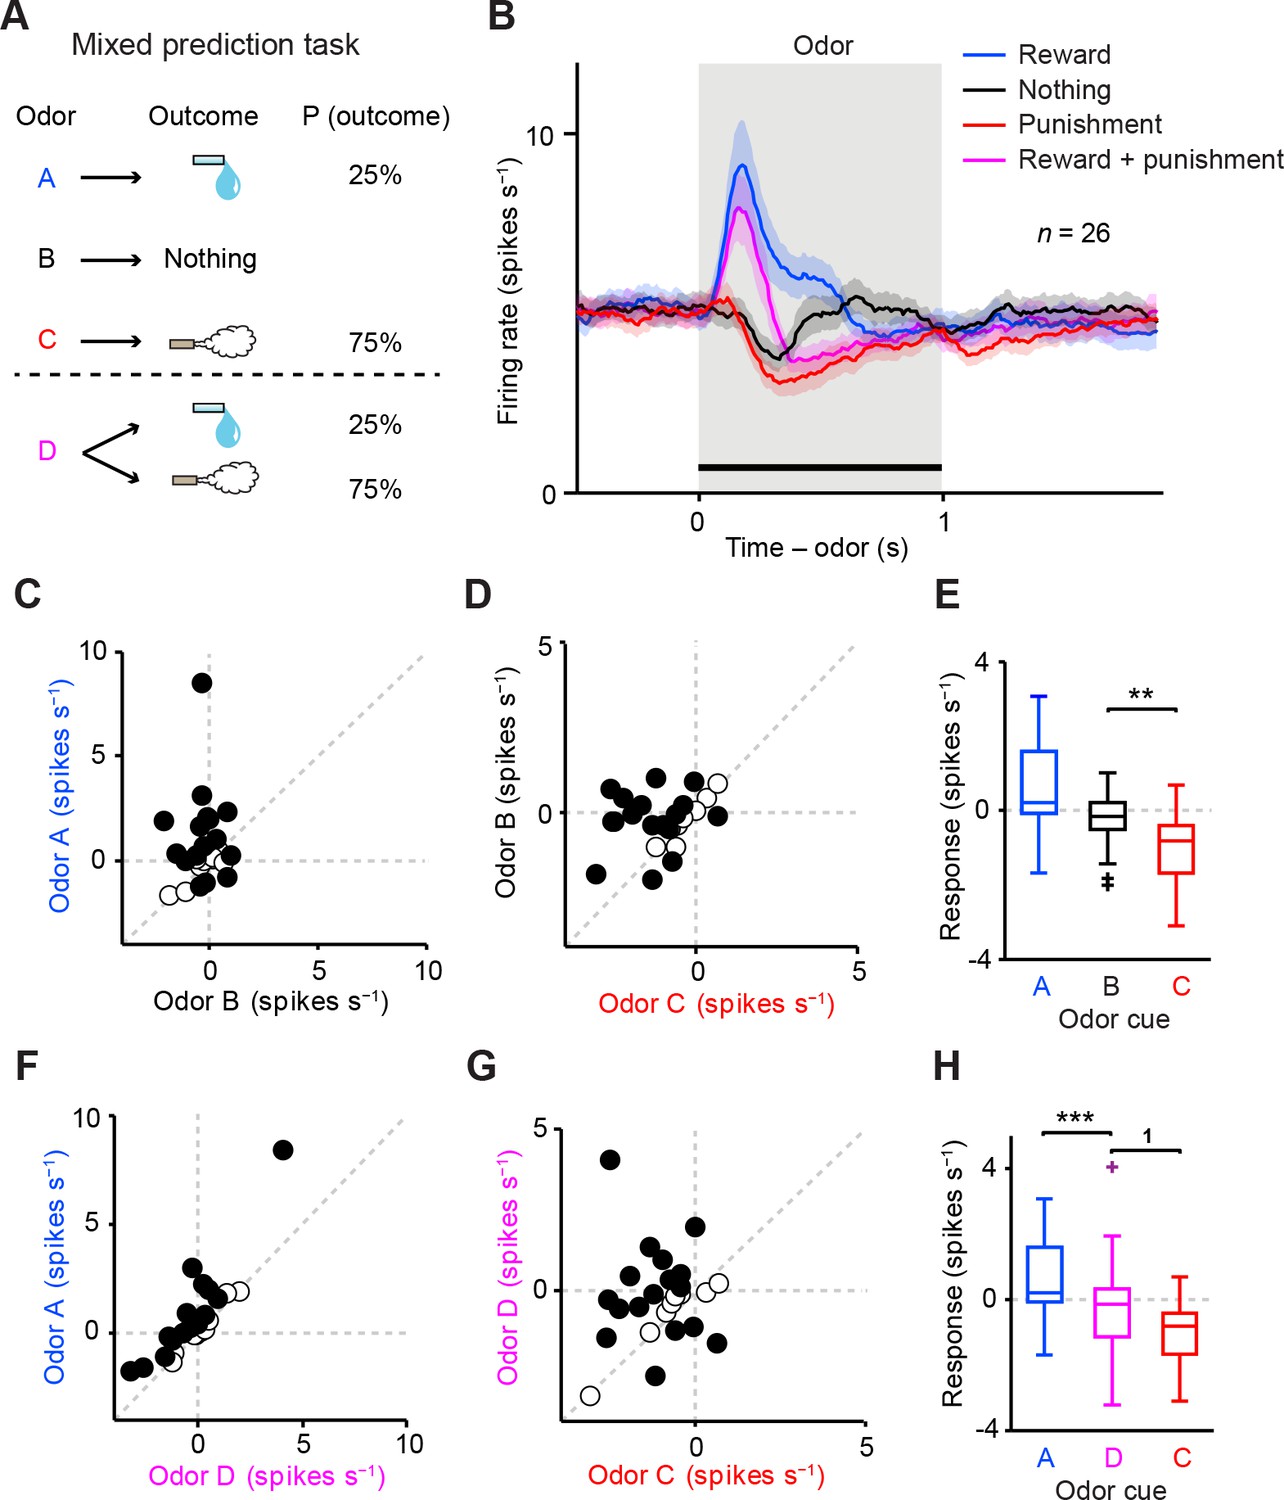
Dopamine neurons integrate values of both valences, reward and aversion.
(A) Task design in the mixed prediction task. (B) Mean ± S.E.M. of firing rates of optogenetically-identified dopamine neurons during all four trial conditions; reward (blue), nothing (black), punishment (red), and both reward and punishment (magenta). (C) Scatter plot of the mean responses during the CS epoch (0–1 s, indicated by a solid black line in B) for reward versus nothing. The baseline firing rate (−1–0 s from odor onset) was subtracted for each neuron. Black filled circles indicate neurons with significant difference between responses to the CS predicting reward and that predicting nothing (unpaired t test, p<0.05). (D) Scatter plot of the mean responses during the CS epoch for nothing versus punishment. Black filled circles indicate neurons with significant difference between responses to the CS predicting nothing and that predicting punishment. (E) Comparison of the responses of individual neurons (n = 26) during CS (0–1 s) predicting reward (blue), nothing (black) and punishment (red). For all box plots, the central mark is the median, the edges of the box are the 25th and 75th percentiles, and the whiskers extend to the most extreme data points not considered outliers (points 1.5 × interquartile range away from the 25th or 75th percentile), and outliers are plotted individually as plus symbols. **t(25) = 3.7, p=0.001, paired t test. One outlier >5 Hz in response to Odor A is not represented. (F) Scatter plot of the mean responses during the CS epoch for reward versus reward and punishment. Black filled circles indicate neurons with significant difference between responses to the CS predicting reward and that predicting reward and punishment. (G) Scatter plot of the mean responses during the CS epoch for reward and punishment versus punishment. Black filled circles indicate neurons with significant difference between responses to the CS predicting punishment and that predicting reward and punishment. (H) Comparison of the responses during CS predicting reward (blue), both reward and punishment (magenta), and punishment (red). 1t(25) = 2.5, p=0.02; ***t(25) = 4.4, p=2.0 × 10⁻⁴, paired t test. One outlier >5 Hz in response to Odor A is not represented.
Figure 2—figure supplement 1
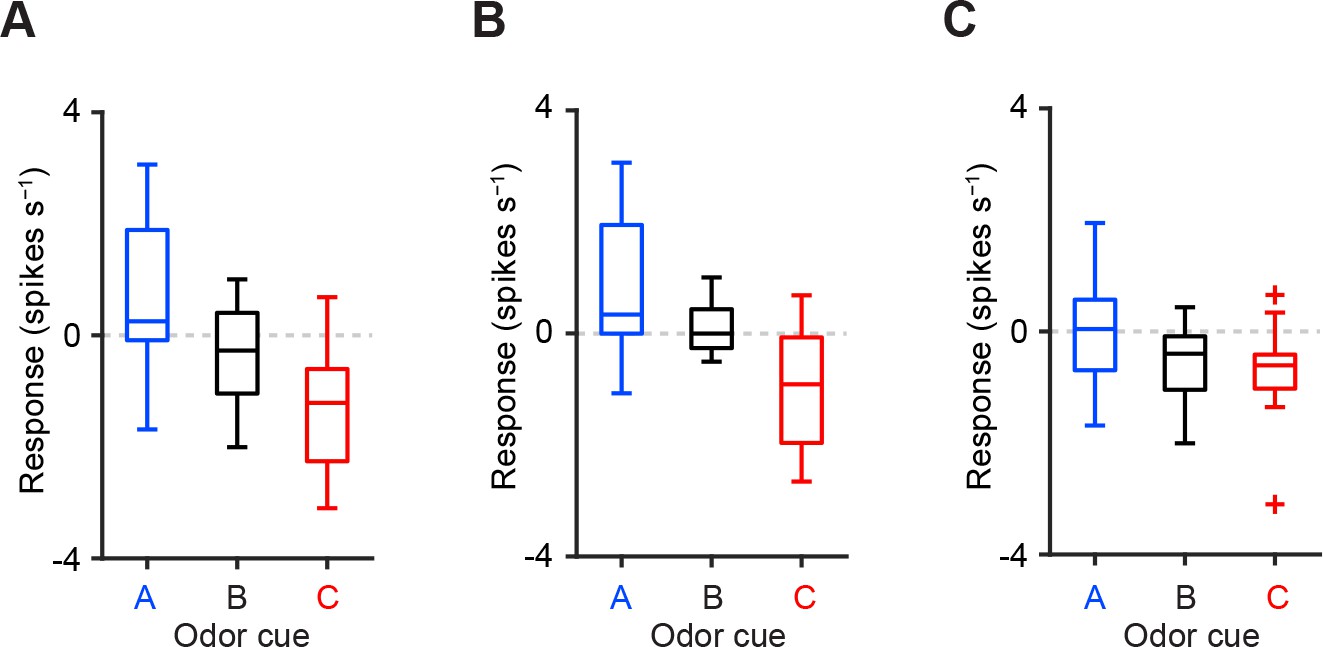
Comparison of CS responses using dopamine neurons from two animals instead of three.
(A–C) Comparison of the responses of individual dopamine neurons (A, n = 18; B, n = 18; and C, n = 16 from two mice) during CS (0–1 s) predicting reward (blue), nothing (black) and punishment (red). For all box plots, the central mark is the median, the edges of the box are the 25th and 75th percentiles, and the whiskers extend to the most extreme data points not considered outliers (points 1.5 × interquartile range away from the 25th or 75th percentile), and outliers are plotted individually as plus symbols. One outlier >5 Hz in response to Odor A is not represented in A and B.
Figure 3 with 1 supplement
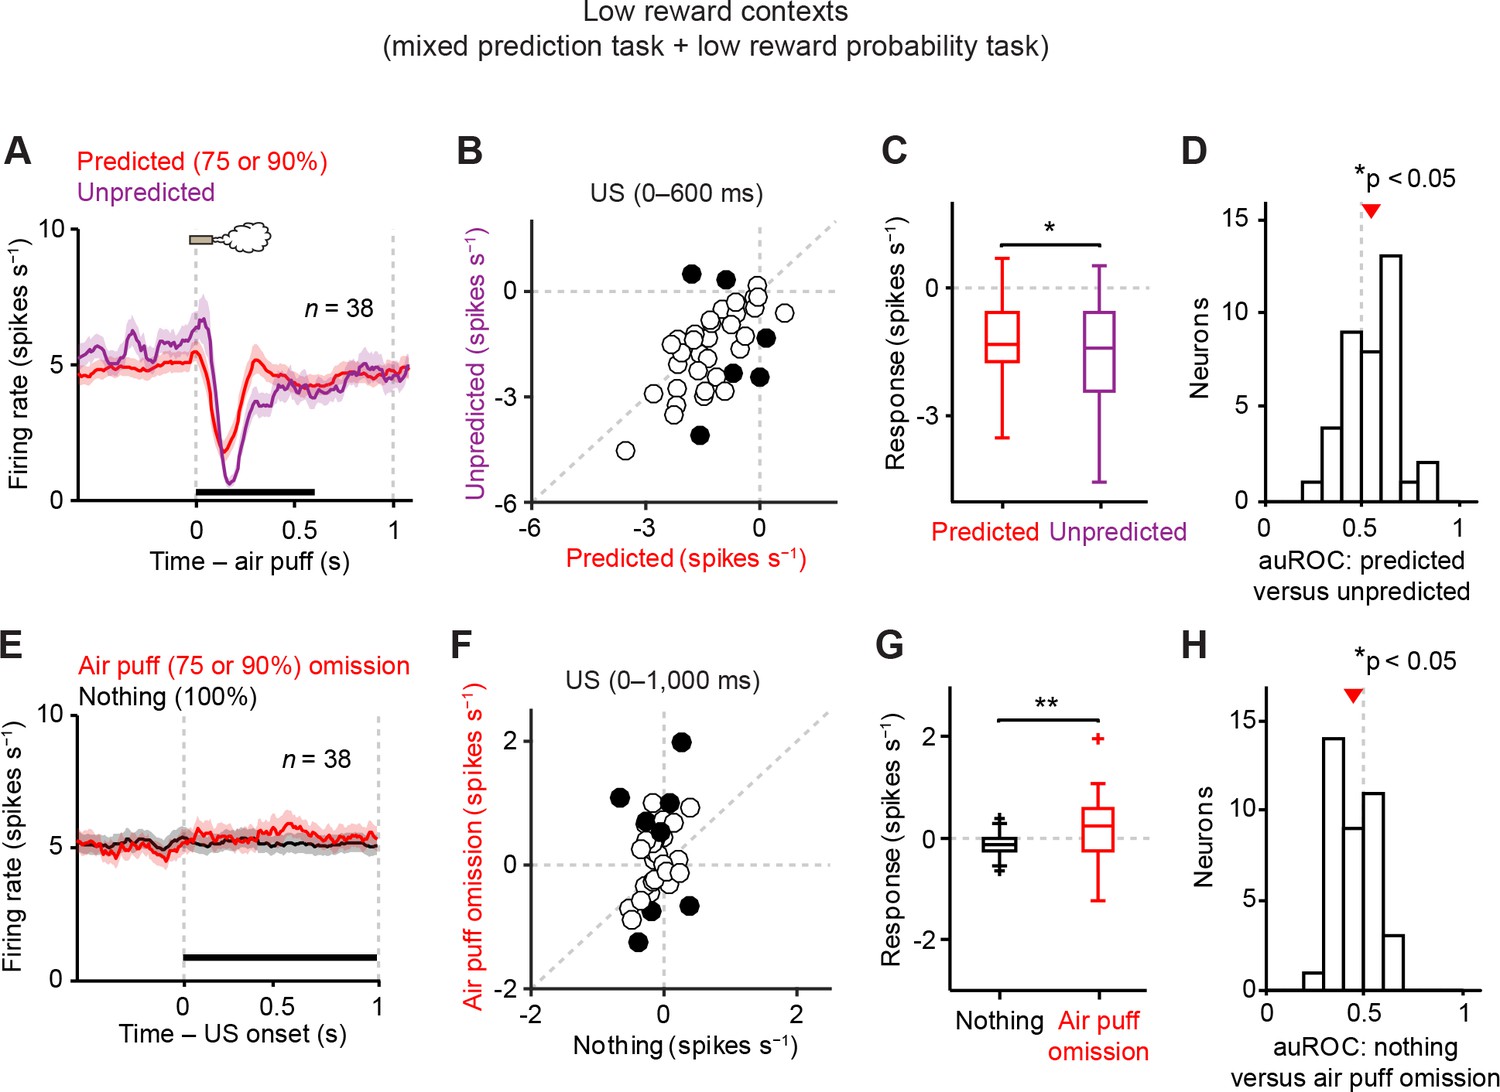
Dopamine neurons signal aversive prediction error.
(A) Mean ± S.E.M. of firing rate of dopamine neurons in response to predicted (red) and unpredicted air puff (purple). (B) Scatter plot of the responses to predicted and unpredicted air puff (0–600 ms after air puff, indicated by a black solid line in A). Each data point represents an individual dopamine neuron. The baseline firing rate (−1–0 s from odor onset) was subtracted for each neuron. Black filled circles indicate neurons with significant difference between responses to unpredicted and predicted air puff (unpaired t test, p<0.05). (C) Comparison of the responses to predicted and unpredicted air puff (n = 38). For all box plots, central mark is the median, box edges are 25th and 75th percentiles, whiskers extend to the most extreme data points not considered outliers (points 1.5 × interquartile range away from the 25th or 75th percentile), and outliers are plotted as plus symbols. *t(37) = 2.4, p=0.02, paired t test. (D) Histogram of changes in firing rate during the US epoch (0–600 ms) of predicted versus unpredicted air puff. The population average of the auROC curve was significantly different from 0.5 (n = 38, *t(37) = 2.5, p=0.015, one-sample t test). Red arrow indicates mean auROC value. (E) Mean ± S.E.M. of firing rate around the outcome period in air puff omission (red) and nothing (black) trials. (F) A scatter plot of the firing rate during the outcome period in air puff omission trials and nothing trials (0–1000 ms after US onset, indicated by a black solid line in E) subtracted by the baseline firing rate (−1–0 s from odor onset) for each neuron. Black filled circles indicate neurons with significant difference between firing rates during the outcome period in air puff omitted and nothing trials. (G) Comparison of the responses during air puff omission trial and nothing trial conditions. **t(37) = 2.8, p=0.008, paired t test. (H) Histogram of changes in firing rate during the US epoch (0–1000 ms) of air puff omission versus nothing trials. The population average of auROC curve was significantly different from 0.5 (n = 38, *t(37) = 2.7, p=0.011, one-sample t test).
Figure 3—figure supplement 1
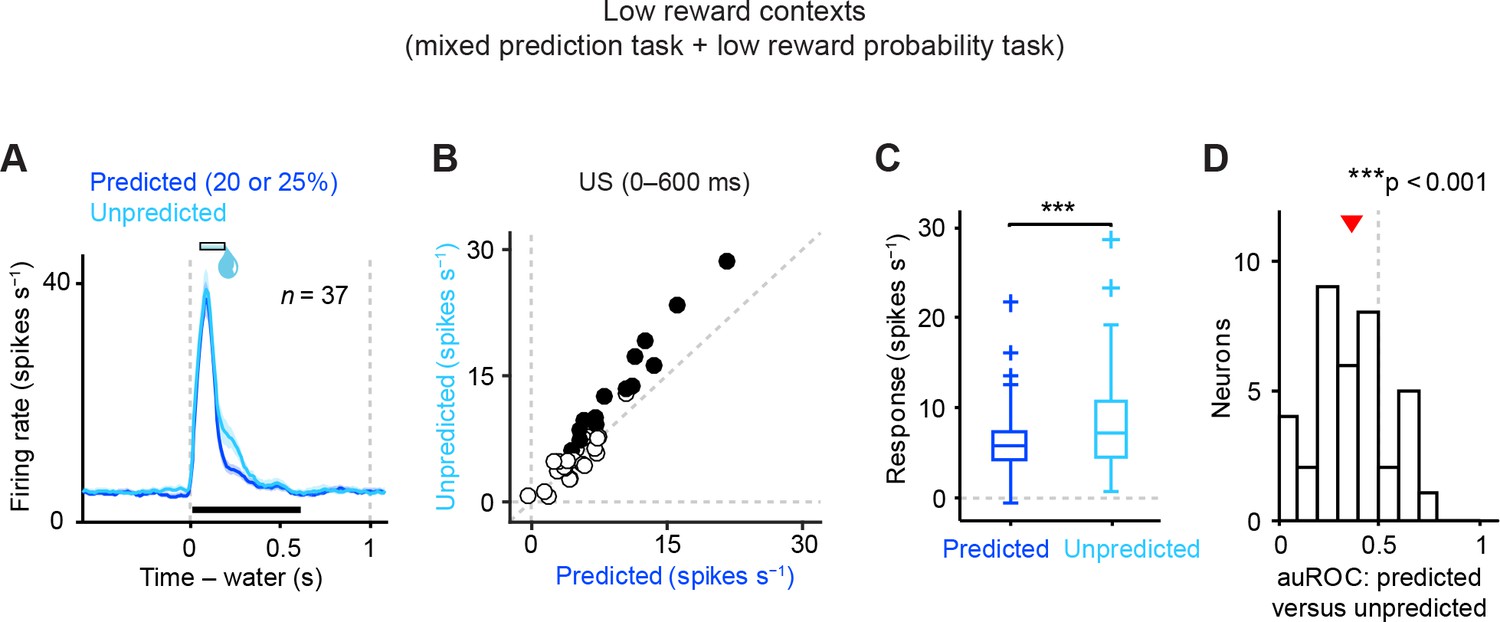
Reward prediction error coding by dopamine neurons in low reward contexts.
(A) Mean ± S.E.M. of firing rate of dopamine neurons in response to predicted (blue) and unpredicted water (cyan). Data were collected from two different low reward probability tasks—the mixed prediction task and the low reward probability task. (B) Scatter plot of the responses to predicted and unpredicted water (0–600 ms after water, indicated by a black solid line in A). Each data point represents an individual dopamine neuron (n = 37). The baseline firing rate (−1–0 s from odor onset) was subtracted for each neuron. Black filled circles indicate neurons with significant difference between response to unpredicted water and that to predicted water (unpaired t test, p<0.05). (C) Comparison of the responses to predicted and unpredicted water (n = 37 dopamine neurons). Central mark is the median, box edges are 25th and 75th percentiles, whiskers extend to the most extreme data points not considered outliers (points 1.5 × interquartile range away from the 25th or 75th percentile), and outliers are plotted as plus symbols. ***t(36) = 4.5, p=7.6 × 10⁻⁵, paired t test. (D) Histogram of changes in firing rate during the US epoch (0–600 ms) of predicted versus unpredicted water. The population average of auROC curve was significantly different from 0.5 (n = 37, ***t(36) = 4.4, p=8.1 × 10⁻⁵, one-sample t test). Red arrow indicates mean auROC value.
Figure 4 with 1 supplement
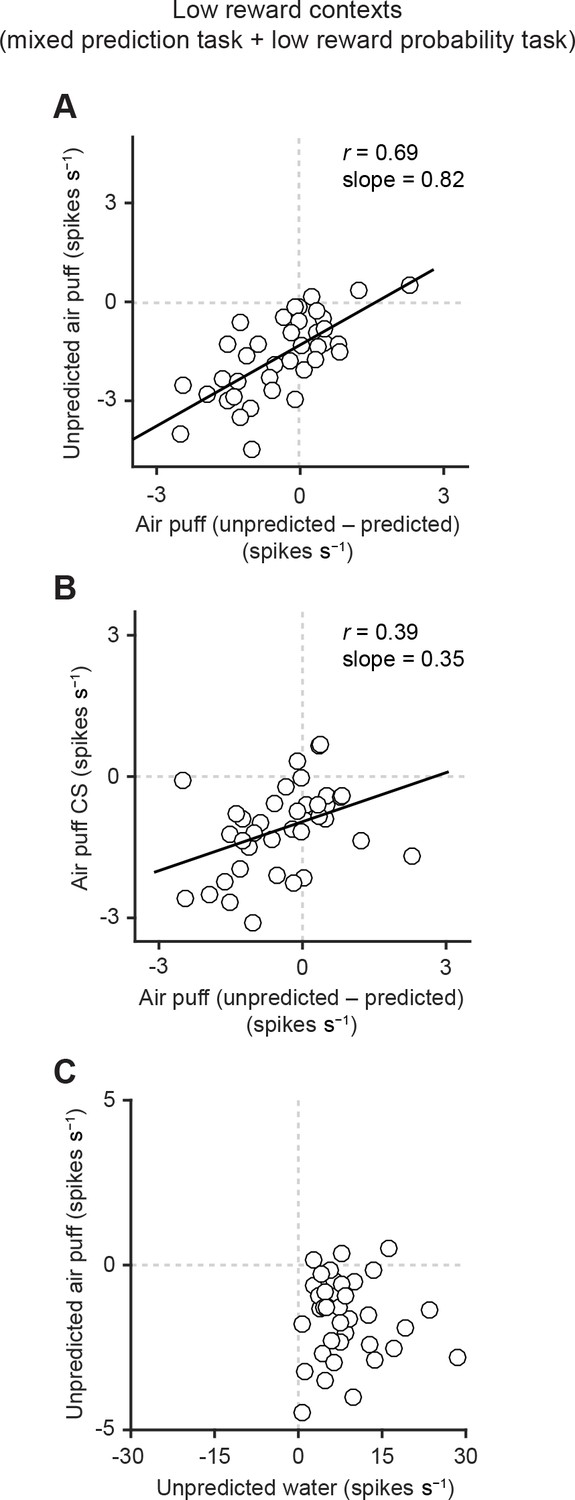
Correlation between responses related to aversive stimuli in dopamine neurons.
(A) Scatter plot of the responses to unpredicted air puff (0–600 ms from air puff onset) and the effects of prediction on the responses to air puff US (subtraction of responses to unpredicted air puff from responses to predicted air puff, 0–600 ms from air puff onset) in dopamine neurons. Each data point represents an individual dopamine neuron (n = 38). The baseline firing rate (−1–0 s from odor onset) was subtracted for each neuron. Solid line, best-fit linear regression. Pearson’s correlation, r = 0.69, p=1.9 × 10⁻⁶. (B) Scatter plot of the responses to CS predicting air puff (0–1000 ms from odor onset) and the effects of prediction on the responses to air puff in dopamine neurons (n = 38). Pearson’s correlation, r = 0.39, p=0.016. (C) Scatter plot of the responses of individual dopamine neurons (n = 37) to unpredicted water and air puff (0–600 ms from water and air puff onsets, respectively). No correlation between these two responses (Pearson’s correlation, r = -0.04, p=0.834).
Figure 4—figure supplement 1
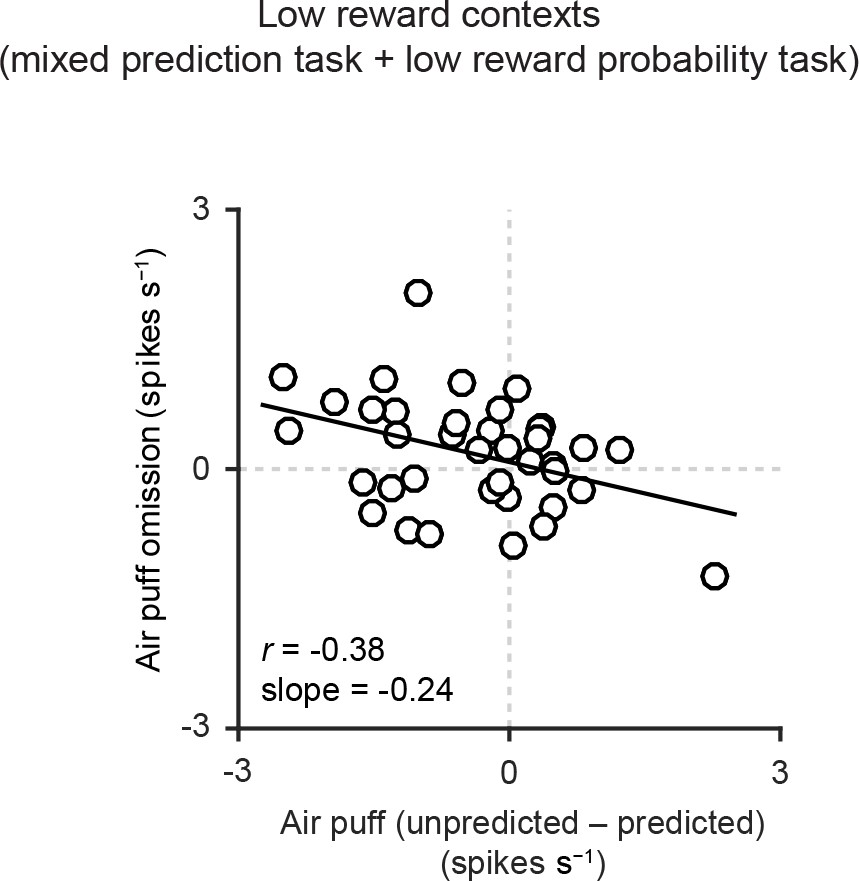
Correlation between responses related to air puff omission and the effects of prediction on the responses to air puff US.
Scatter plot of the firing rate during the outcome period in air puff omission trials (0–1 s after air puff onset) subtracted by the baseline firing rate (−1–0 s from odor onset) and the effects of prediction on the responses to air puff (subtraction of responses to unpredicted air puff from responses to predicted air puff, 0–600 ms from air puff onset). Each data point represents an individual dopamine neuron (n = 38). Pearson’s correlation, r = -0.38, p=0.02. Solid line, best-fit linear regression.
Figure 5 with 3 supplements
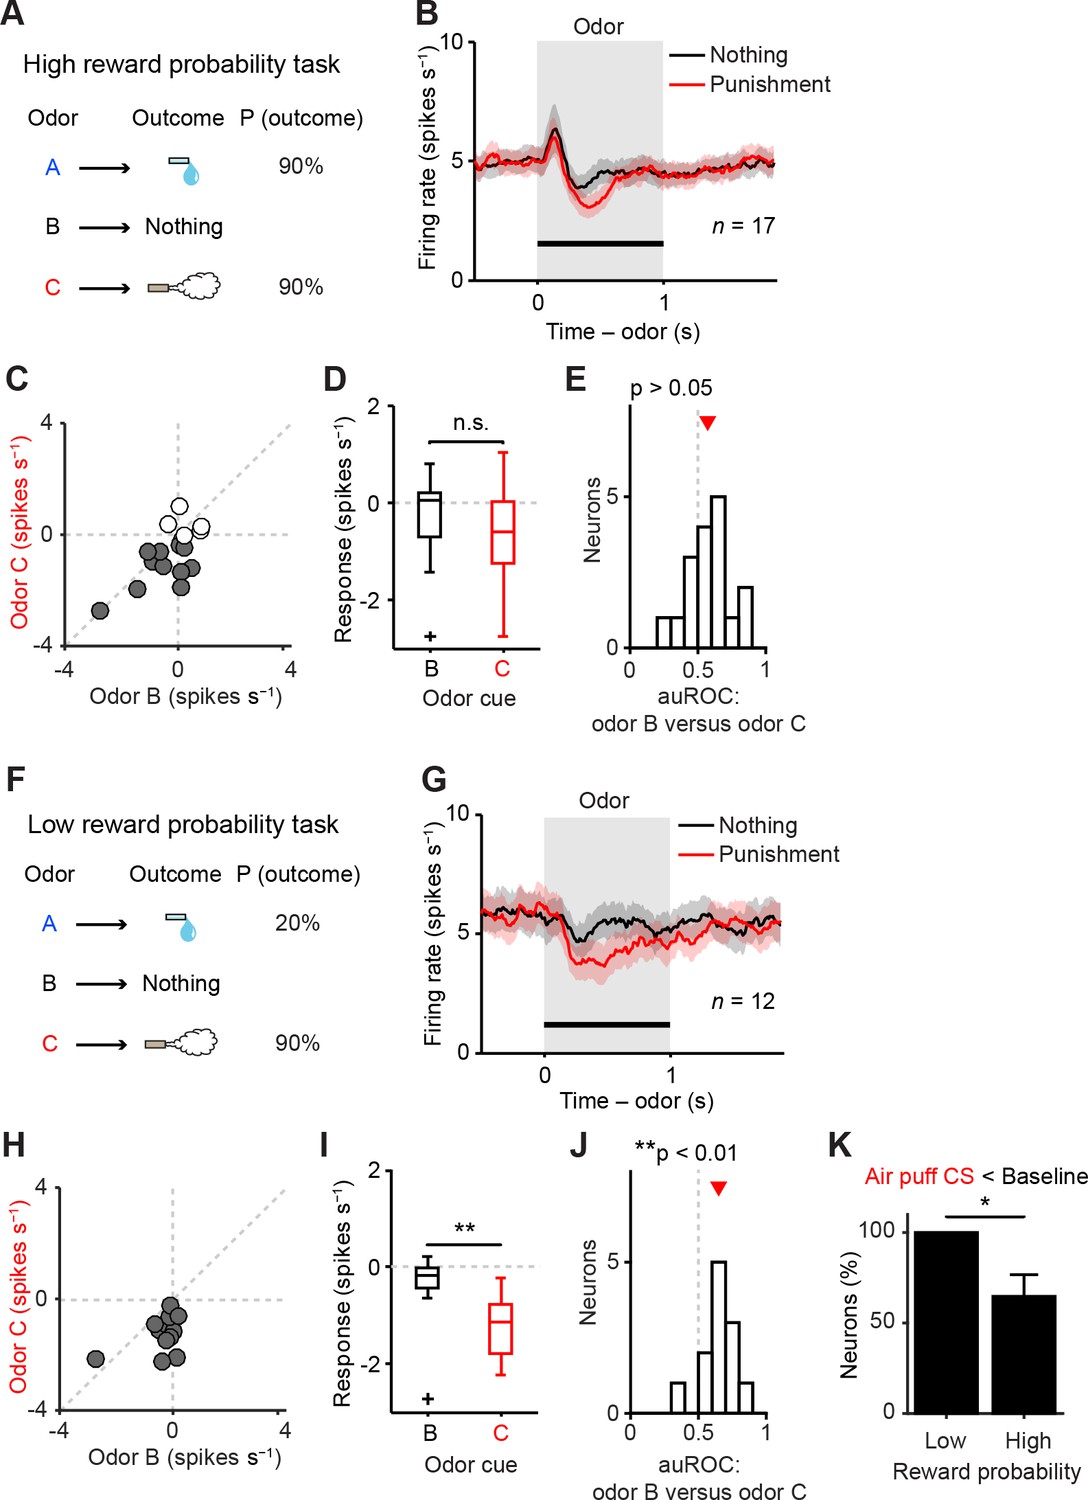
Representation of negative value of aversive stimuli depends on reward context.
(A) Task design in the high reward probability task. (B) Mean ± S.E.M. of firing rate of optogenetically-identified dopamine neurons during two trial conditions; nothing (black) and punishment (red). (C) Scatter plot of the mean responses during the CS epoch (0–1 s, indicated by a solid black line in B) for punishment versus nothing. The baseline firing rate (−1–0 s from odor onset) was subtracted for each neuron. Filled grey circles (11 out of 17 circles), dopamine neurons showing significant inhibition to punishment CS than the average baseline firing rate (n = 80 trials, p<0.05, one-sample t test). (D) Comparison of the responses of individual neurons during CS (0–1 s) predicting nothing (black) and punishment (red). For all box plots, central mark is the median, box edges are 25th and 75th percentiles, whiskers extend to the most extreme data points not considered outliers (points 1.5 × interquartile range away from the 25th or 75th percentile), and outliers are plotted as plus symbols. t(16) = 2.1, p>0.05, paired t test. n.s., not significant. (E) Histogram of changes in firing rate during the CS epoch (0–1 s) of nothing versus punishment. The population average of the area under the receiver-operating characteristic (auROC) curve was not significantly different from 0.5 (n = 17, t(16) = 1.9, p>0.05, one-sample t test). Red arrow indicates mean auROC value. (F) Task design in the low reward probability task. (G) Mean ± S.E.M. of firing rate of optogenetically-identified dopamine neurons during two trial conditions; nothing (black) and punishment (red). (H) Scatter plot of the mean responses during the CS epoch (0–1 s, indicated by a solid black line in G) for punishment versus nothing. Filled grey circles (12 out of 12 circles), dopamine neurons showing significant inhibition to punishment CS than the average baseline firing rate (n = 80 trials, p<0.05, one-sample t test). (I) Comparison of the responses of individual neurons during CS (0–1 s) predicting nothing (black) and punishment (red). **t(11) = 3.8, p=0.003, paired t test. (J) Histogram of changes in firing rate during the CS epoch (0–1 s) of nothing versus punishment. The population average of the auROC curve was significantly different from 0.5 (n = 12, **t(11) = 4.2, p=0.002, one-sample t test). (K) Comparison of the percentage of dopamine neurons showing significant inhibition to punishment CS than baseline (Air puff CS < Baseline) between high and low reward probability tasks. *chi(1) = 5.34, p=0.02, chi-square test. Error bar, S.E.M.
Figure 5—figure supplement 1
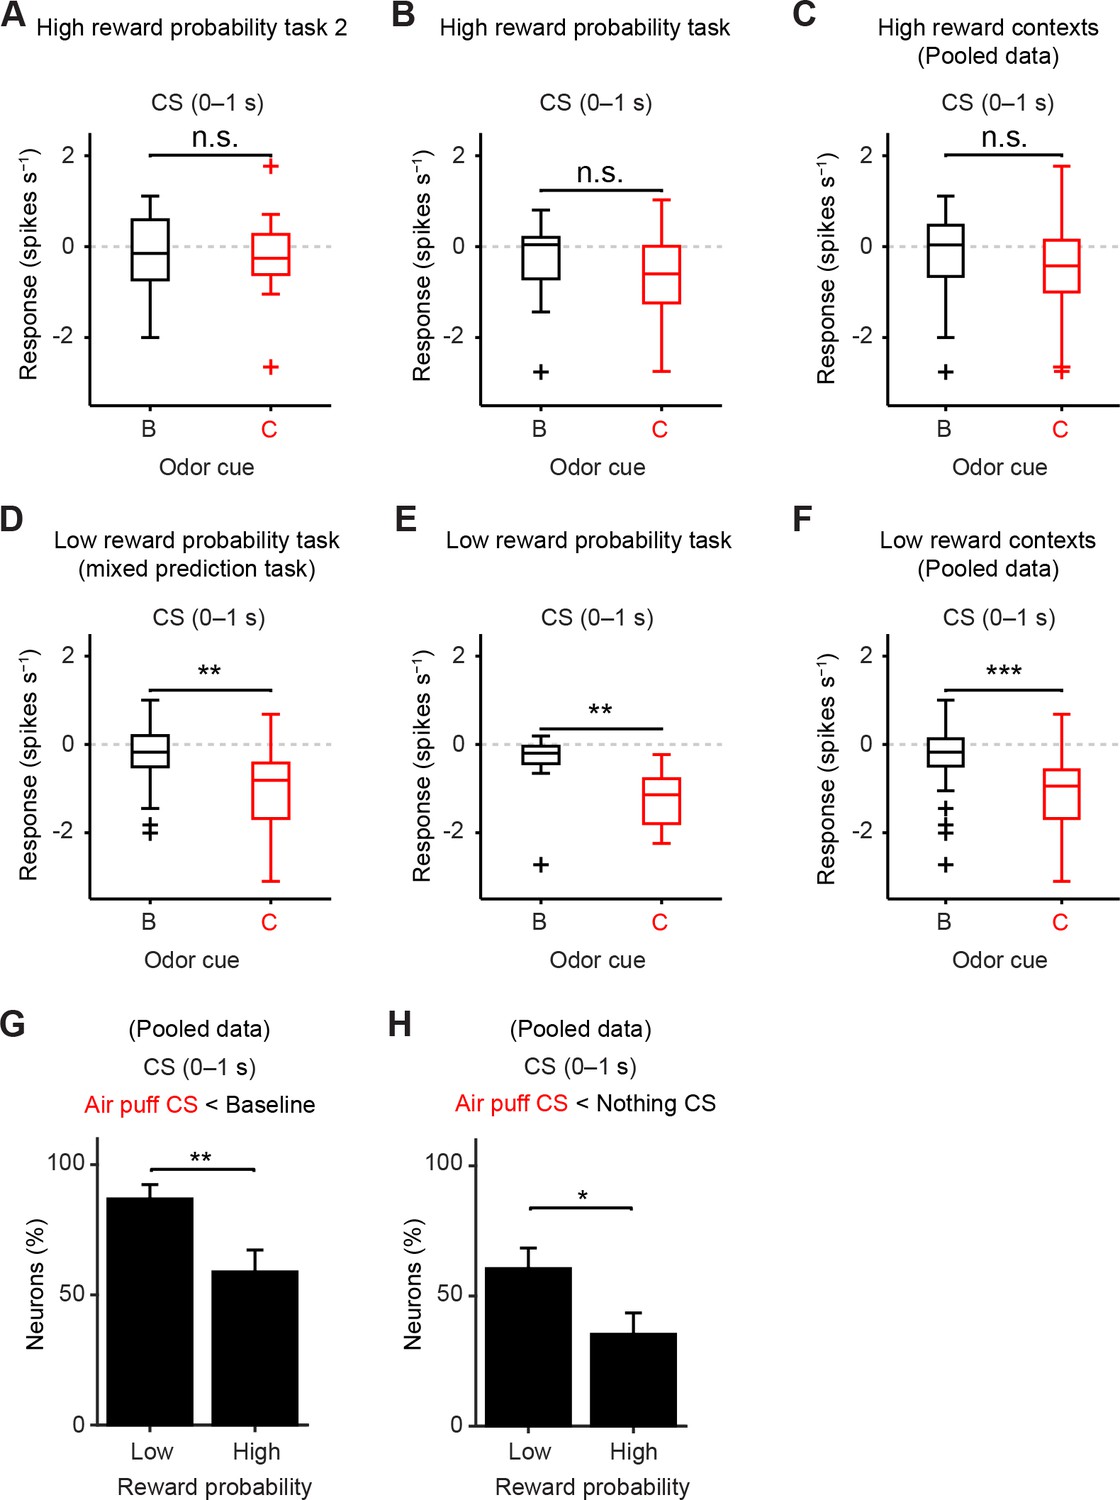
The response to air puff-predicting CS was consistently smaller than that to nothing-predicting CS in low reward contexts.
(A–F) Comparisons of responses of individual dopamine neurons during CS (0–1 s) predicting nothing (black) and punishment (red) in high reward probability task 2 (A, n = 17, t(16) = 0.35, p=0.73, paired t test), high reward probability task (B, n = 17, t(16) = 2.1, p=0.05), high reward contexts (data collected from two high reward probability tasks; C, n = 34, t(33) = 1.5, p=0.14), mixed prediction task (D, n = 26, **t(25) = 3.7, p=1.2 × 10⁻³), low reward probability task (E, n = 12, **t(11) = 3.8, p=2.8 × 10⁻³), and low reward contexts (data pooled from mixed prediction task and low reward probability task; F, n = 38, ***t(37) = 5.0, p=1.5 × 10⁻⁵). For all box plots, central mark is the median, box edges are 25th and 75th percentiles, whiskers extend to the most extreme data points not considered outliers (points 1.5 × interquartile range away from the 25th or 75th percentile), and outliers are plotted as plus symbols. n.s., not significant. (G) Comparison of the percentage of dopamine neurons showing significant inhibition to punishment CS than baseline (Air puff CS < Baseline) between high and low reward contexts (n = 34 and 38, respectively). **chi(1) = 7.25, p=7.1 × 10⁻³, chi-square test. Error bar, S.E.M. (H) Comparison of the percentage of dopamine neurons showing significant inhibition to punishment CS than nothing CS (Air puff CS < Nothing CS) between high and low reward contexts (n = 34 and 38, respectively). *chi(1) = 4.57, p=0.03, chi-square test.
Figure 5—figure supplement 2
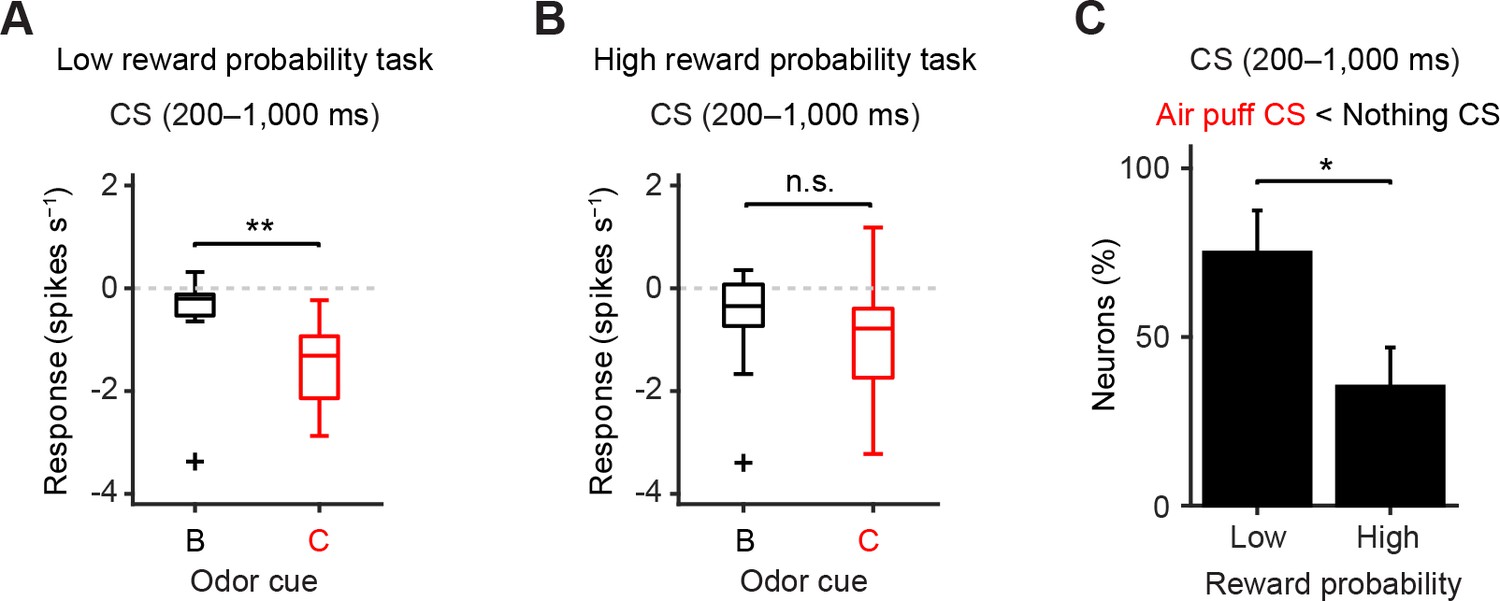
The later response to air puff-predicting CS was smaller than that to nothing-predicting CS in the low reward probability task.
(A–B) Comparison of the later responses (200–1000 ms after odor onset) of individual neurons to CSs predicting nothing (black) and punishment (red) in different reward probability tasks (A, n = 12 dopamine neurons in the low reward probability task; B, n = 17 in the high reward probability task). For all box plots, the central mark is the median, the edges of the box are the 25th and 75th percentiles, and the whiskers extend to the most extreme data points not considered outliers (points 1.5 × interquartile range away from the 25th or 75th percentile), and outliers are plotted individually as plus symbols. **t(11) = 4.0, p=2.0 × 10⁻³; and t(16) = 2.0, p=0.07, paired t test. n.s., not significant. (C) Comparison of the percentage of dopamine neurons showing significant inhibition to punishment CS than nothing CS (Air puff CS < Nothing CS) between high and low reward probability tasks. *chi(1) = 4.44, p=0.04, chi-square test. Error bar, S.E.M.
Figure 5—figure supplement 3
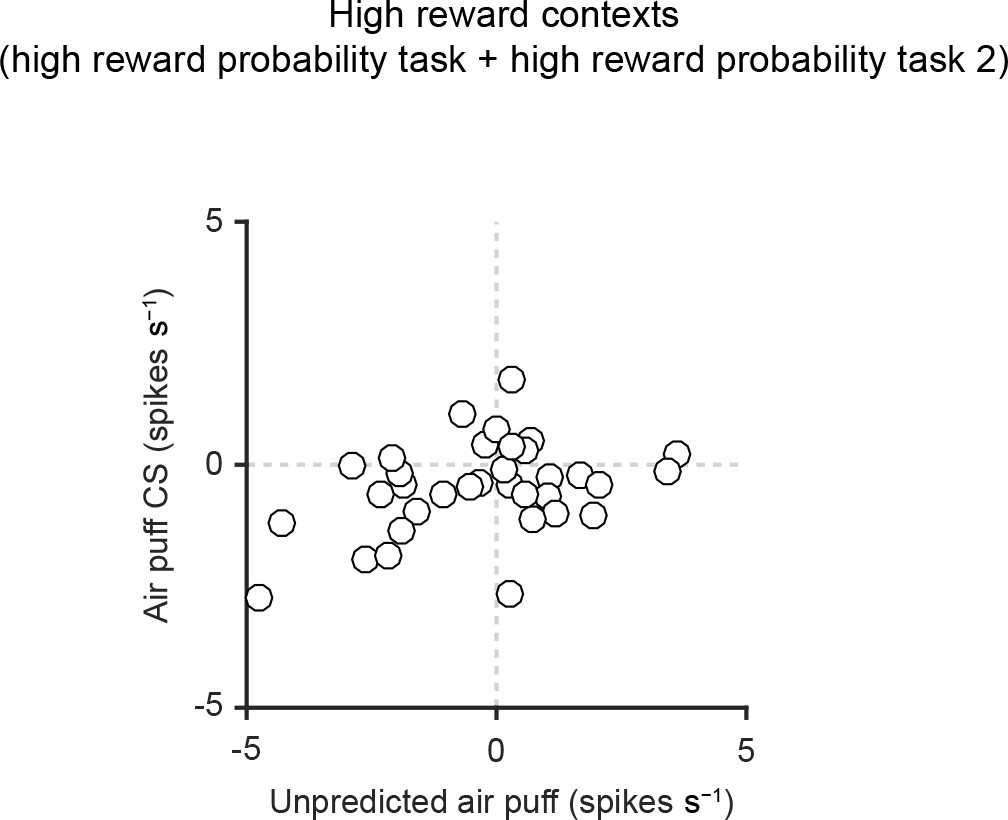
Scatter plot of responses of individual dopamine neurons to air puff-predicting CS and unpredicted air puff in high reward contexts.
Scatter plot of the responses to air puff-predicting CS (0–1 s from odor onset) and unpredicted air puff US (0–600 ms from air puff onset). Each data point represents an individual dopamine neuron (n = 34). The baseline firing rate (−1–0 s from odor onset) was subtracted for each neuron.
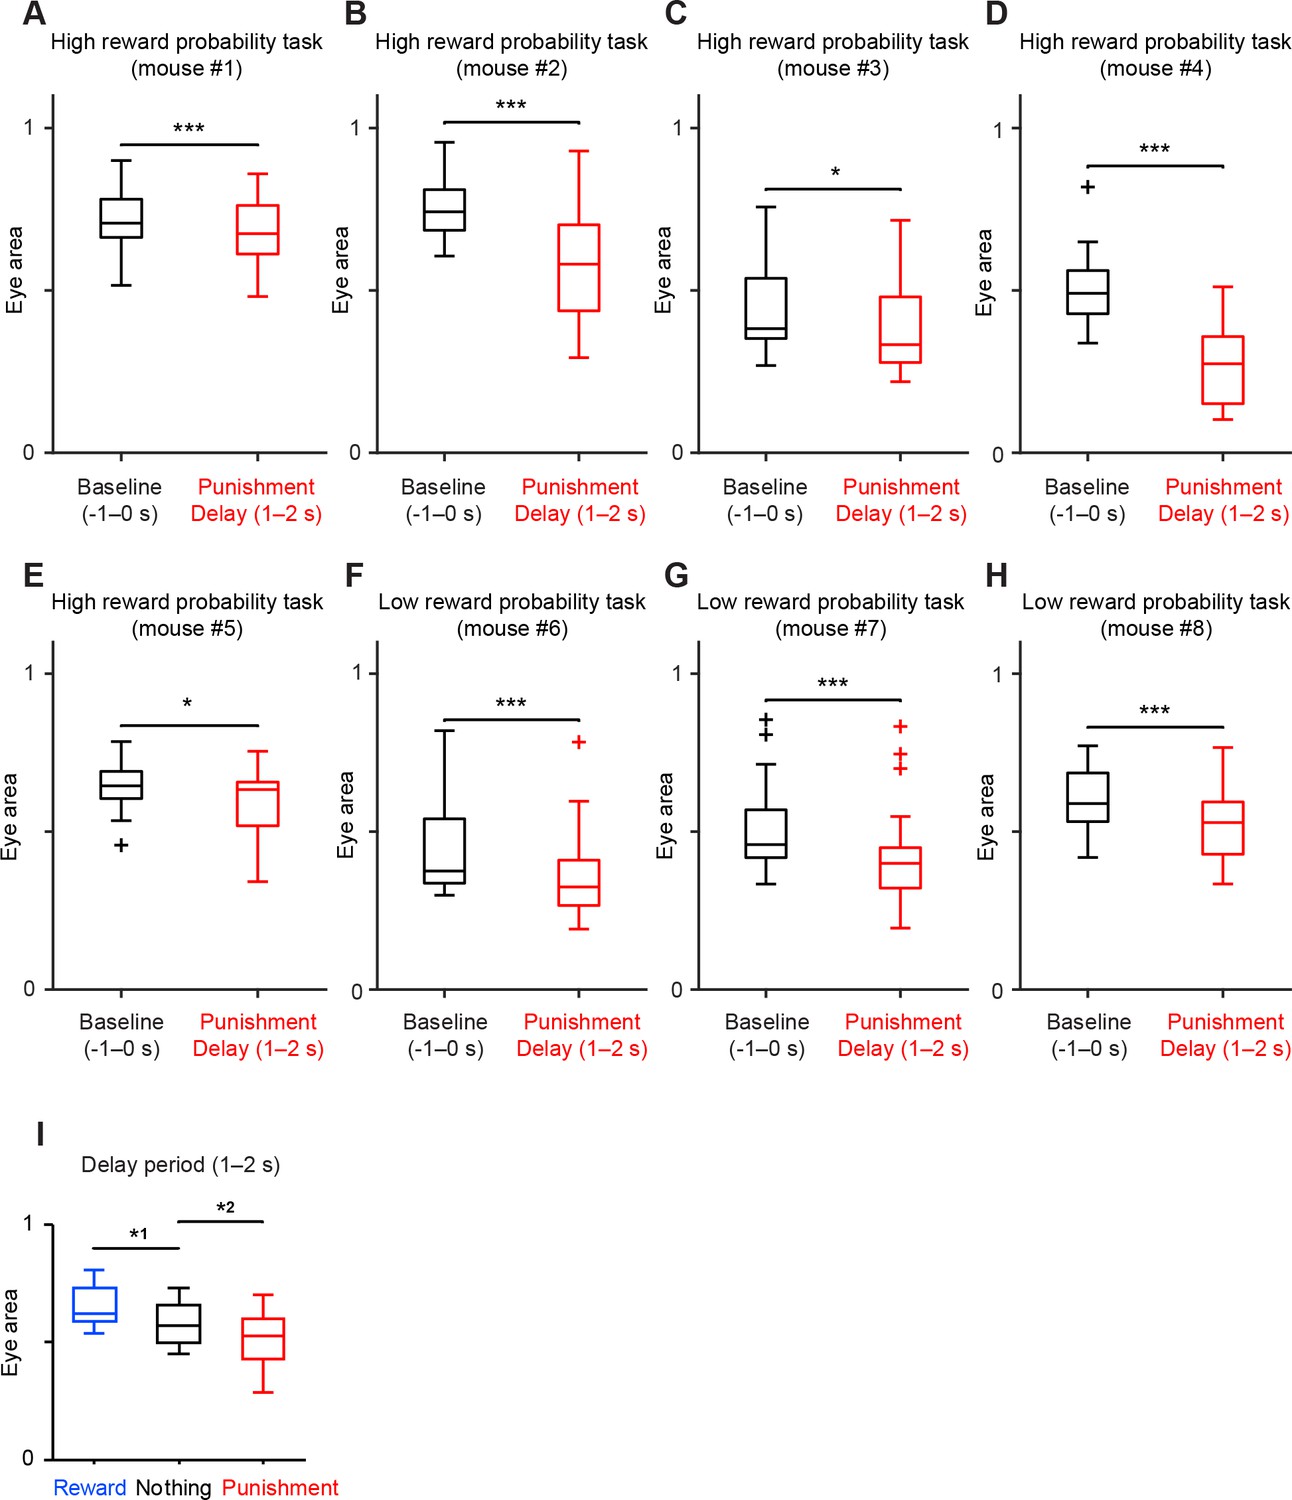
Figure 6 with 4 supplements

Relation between CS response of dopamine neurons and behavior.
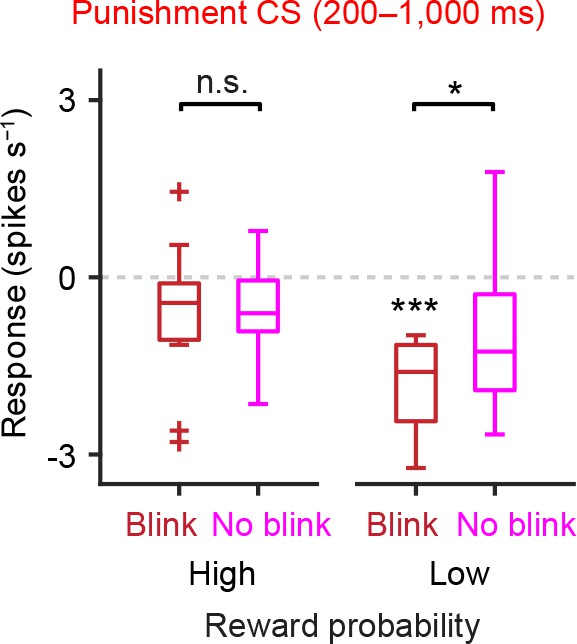
(A) Eye blinking behavior during all three trial conditions in an example session in the high reward probability task. Red color indicates small eye area. (B) Average eye area during all three trial conditions in the example session; reward (blue), nothing (black) and punishment (air puff, red). (C) Comparison of the eye area during baseline (−1–0 s from odor onset, black) and delay period (1–2 s, red) in punishment trial condition from an example animal (n = 21 sessions). For all box plots, central mark is the median, box edges are 25th and 75th percentiles, whiskers extend to the most extreme data points not considered outliers (points 1.5 × interquartile range away from the 25th or 75th percentile), and outliers are plotted as plus symbols. ***t(20) = 14.7, p=3.4 × 10⁻¹², paired t test. (D) Comparison of the responses of individual dopamine neurons (n = 23) during punishment CS (0–1 s) between blink (dark red) and no-blink trials (magenta). The baseline firing rate (−1–0 s from odor onset) was subtracted for each neuron. **t(22) = 3.0, p=0.007, paired t test. (E) Comparison of the responses of individual dopamine neurons during punishment CS (0–1 s) in blink and no-blink trials in high and low reward probability tasks (n = 13 and 10 neurons from these two tasks, respectively). The baseline firing rate (−1–0 s from odor onset) was subtracted for each neuron. ***t(9) = 7.4, p=4.3 × 10⁻⁵, one-sample t test;*t(9) = 3.0, p=0.016; and t(12) = 1.3, p=0.207, paired t test. n.s., not significant. (F) Comparison of the responses of individual dopamine neurons during reward-predicting CS (0–1 s) between trials with anticipatory and no anticipatory licks (≥3 and <3 licks s−1 during delay period, respectively). In 90% water trials (left), only 9 out of 34 dopamine neurons were collected, as the number of trials in which the animal did not show anticipatory licking was small. In 20–25% water trials (right), 33 out of 38 dopamine neurons were collected. The baseline firing rate (−1–0 s from odor onset) was subtracted for each neuron. 1t(8) = 2.322, p=0.0488, paired t test; 2t(8) = 3.141, p=0.0138, one-sample t test.
Figure 6—figure supplement 1
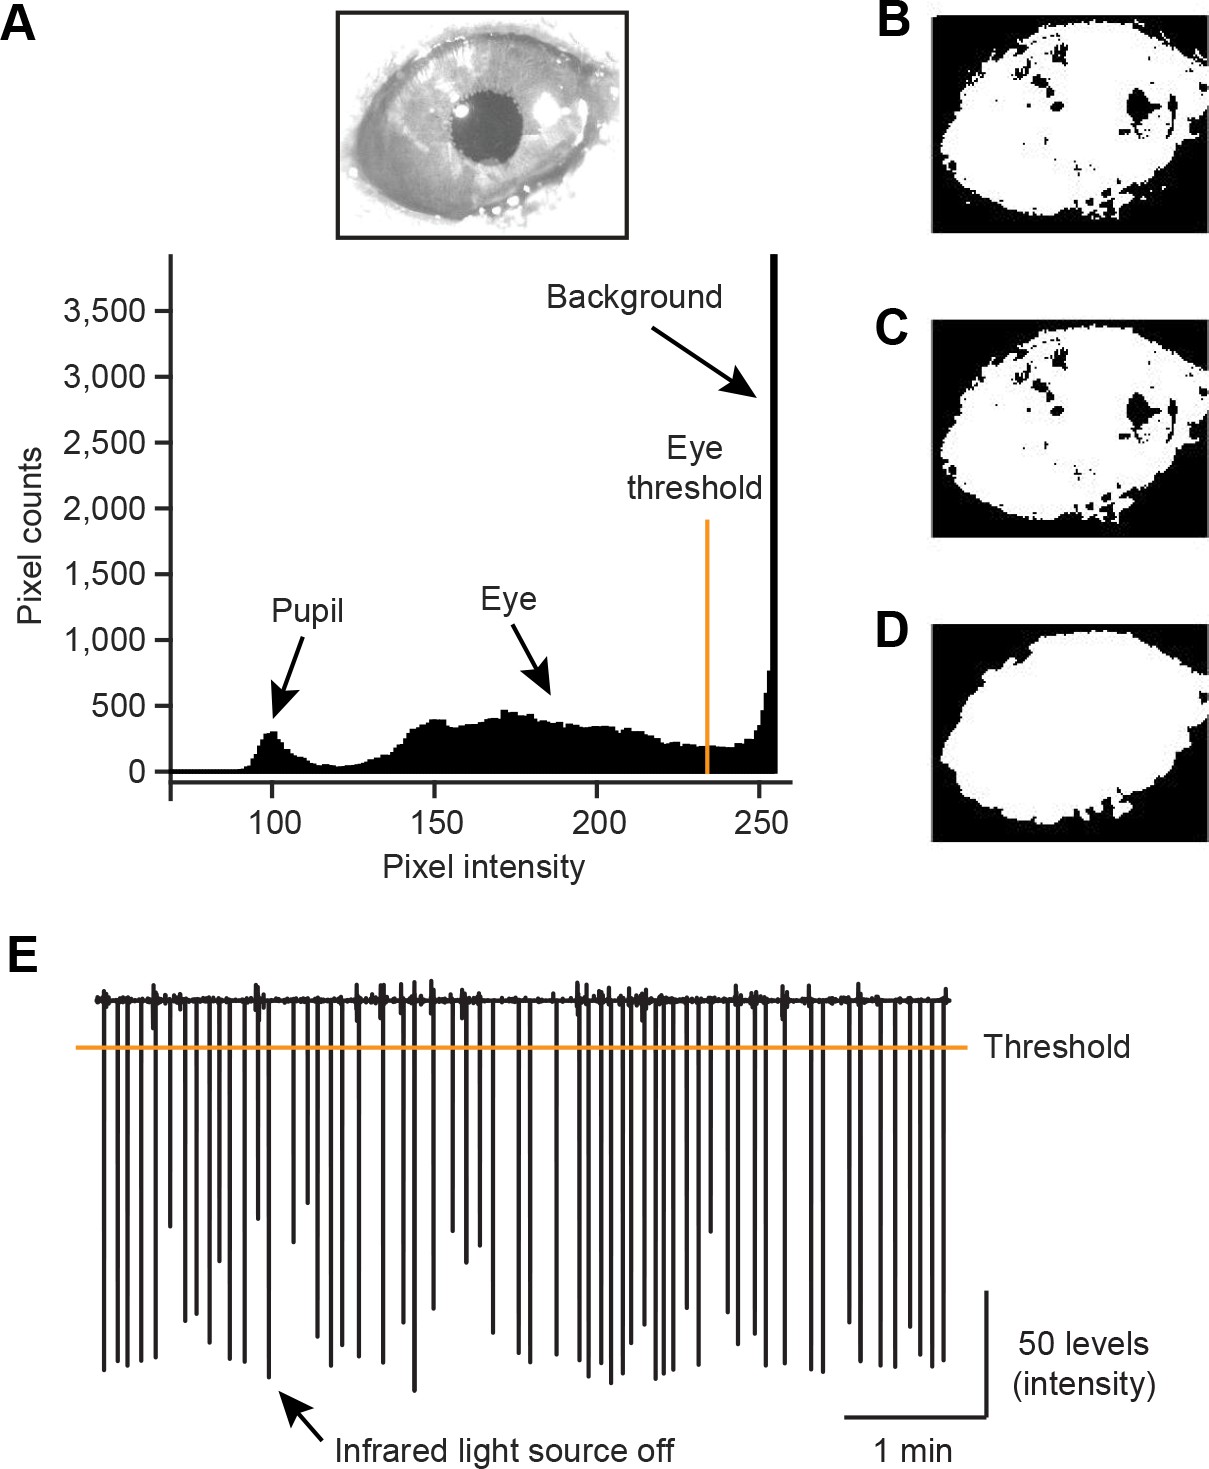
Extraction of eye area from video frames.
(A) A histogram showing the distribution of pixels with different intensity (0–255 levels, bottom) in an example frame of the right eye region (top). A threshold 234 pixel intensity was used to separate eye area from the background. (B) Pixels with intensity smaller than the eye threshold was set to 1 (white) and others were set to 0 (black). (C) White small patches outside of the eye on the binary image in B were removed. (D) Smoothing the eye patch. (E) The averaged pixel intensities of example video frames were plotted. Troughs of the value indicate short infrared light source off (<25 ms) delivered 2 s after every US onset.
Figure 6—figure supplement 2
All the animals showed anticipatory eye-blinking to air puff in both low and high reward probability conditions.
(A–H) Comparison of the eye area during baseline (−1–0 s from odor onset, black) and delay period (1–2 s from odor onset, red) in punishment (air puff) trial condition. For all box plots, central mark is the median, box edges are 25th and 75th percentiles, whiskers extend to the most extreme data points not considered outliers (points 1.5 × interquartile range away from the 25th or 75th percentile), and outliers are plotted as plus symbols. Each boxplot represents data from each animal (5 from the high reward probability task, and 3 from the low reward probability task). ***t(21) = 3.9, p=8.5 × 10⁻⁴ (n = 22 sessions), paired t test in A; ***t(17) = 6.3, p=8.4 × 10⁻⁶ (n = 18 sessions), paired t test in B; *U = 342, p=0.02 (n = 32 sessions), Mann-Whitney U test in C; ***t(20) = 14.7, p=3.4 × 10⁻¹² (n = 21 sessions), paired t test in D; *t(16) = 2.9, p=0.01(n = 17 sessions), paired t test in E; ***t(15) = 4.2, p=7.0 × 10⁻⁴ (n = 16 sessions), paired t test in F; ***t(25) = 8.2, p=1.4 × 10⁻⁸ (n = 26 sessions), paired t test in G; and ***t(18) = 5.2, p=5.6 × 10⁻⁵ (n = 19 sessions), paired t test in H. (I) Comparison of the eye area during delay period (1–2 s after odor onset) in all three trial conditions; reward (blue), nothing (black) and punishment (red). Data were from 8 mice. *1t(7) = 3.6, p=0.009; and *2t(7) = 3.2, p=0.01, paired t test.
Figure 6—figure supplement 3
Correlation between eye-blinking behavior and inhibitory responses to air puff-predicting CS during the later response window in low reward contexts.
Comparison of the responses of individual dopamine neurons during late period of punishment CS (200–1000 ms) in the high and low reward probability tasks (n = 13 and 10 neurons from these two tasks, respectively). The baseline firing rate (−1–0 s from odor onset) was subtracted for each neuron. For all box plots, central mark is the median, box edges are 25th and 75th percentiles, whiskers extend to the most extreme data points not considered outliers (points 1.5 × interquartile range away from the 25th or 75th percentile), and outliers are plotted as plus symbols. ***t(9) = 7.0, p=6.4 × 10⁻⁵, one-sample t test; *t(9) = 3.0, p=0.016; and t(12) = 0.22, p=0.83, paired t test. n.s., not significant.
Figure 6—figure supplement 4
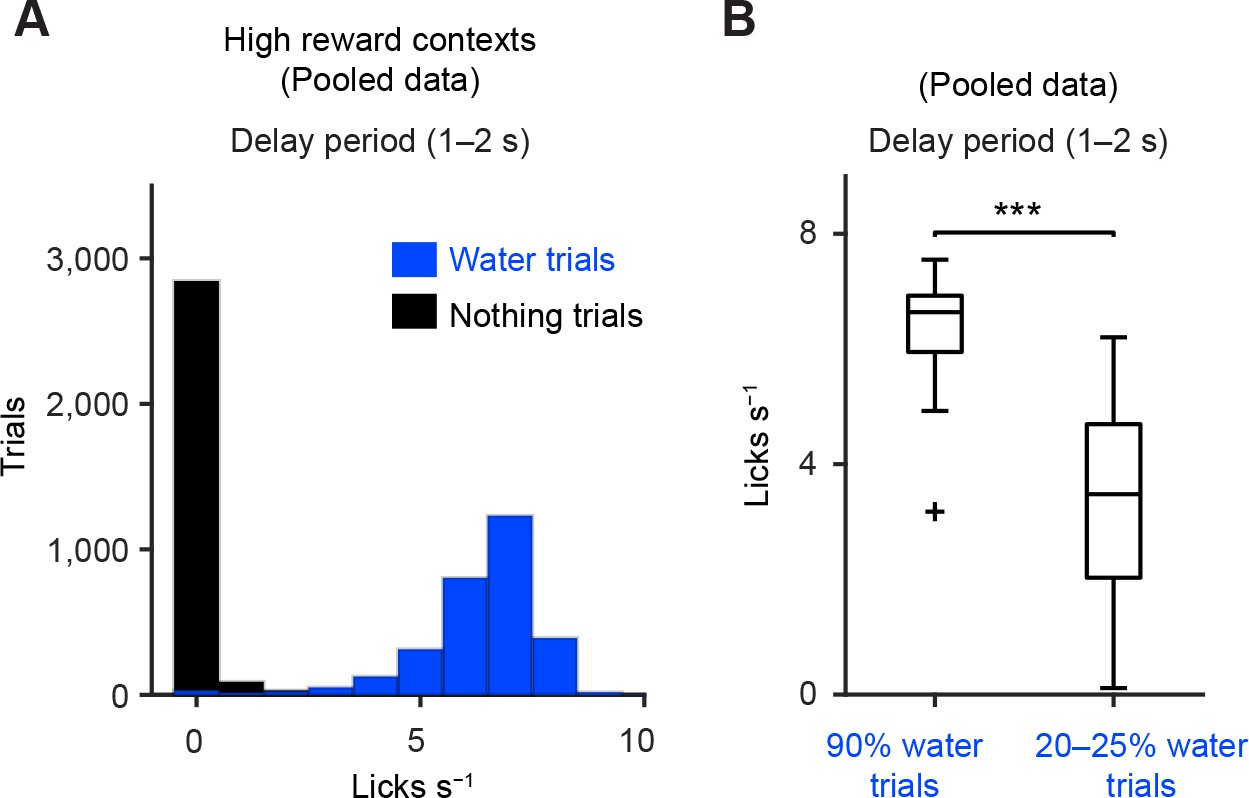
Anticipated licking behavior during delay period.
(A) Histograms of the lick rate during the delay period (1–2 s from odor onset) during 90% water trials (blue) and nothing trials (black) from all the sessions in which dopamine neurons were identified. (B) Comparison of the lick rates during the delay period between 90% water trials and 20–25% water trials (n = 34 and 38 sessions, respectively). Central mark is the median, box edges are 25th and 75th percentiles, whiskers extend to the most extreme data points not considered outliers (points 1.5 × interquartile range away from the 25th or 75th percentile), and an outlier is plotted as plus symbols. ***t(70) = 8.8, p=5.3 × 10⁻¹³, unpaired t test.
Tables
Table 1
Summary of task conditions.
| Task | CS (% outcome) | Reward trials (%) | Free reward (%) | ||||
|---|---|---|---|---|---|---|---|
| Outcome | Odor A (Reward CS) | Odor B (Nothing CS) | Odor C (Air puff CS) | Odor D (Reward and air puff CS) | |||
| Mixed prediction task | Water | 25 | 0 | 0 | 25 | 13 | 2 |
| Air puff | 0 | 0 | 75 | 75 | |||
| Low reward probability task | Water | 20 | 0 | 0 | 7 | 6 | |
| Air puff | 0 | 0 | 90 | ||||
| High reward probability task | Water | 90 | 0 | 0 | 30 | 6 | |
| Air puff | 0 | 0 | 90 | ||||
| High reward probability task 2 | Water | 90 | 0 | 0 | 30 | 7 | |
| Air puff | 0 | 0 | 80 | ||||
Download links
A two-part list of links to download the article, or parts of the article, in various formats.
Downloads (link to download the article as PDF)
Open citations (links to open the citations from this article in various online reference manager services)
Cite this article (links to download the citations from this article in formats compatible with various reference manager tools)
Midbrain dopamine neurons signal aversion in a reward-context-dependent manner
eLife 5:e17328.
https://doi.org/10.7554/eLife.17328


