Hippocampal pattern completion is linked to gamma power increases and alpha power decreases during recollection
- University of Birmingham, United Kingdom
- Radboud University Nijmegen, Netherlands
- Ruhr University Bochum, Germany
- Faculty of Psychology, Ruhr University Bochum, Germany
- University of Bonn, Germany
Figures
Figure 1
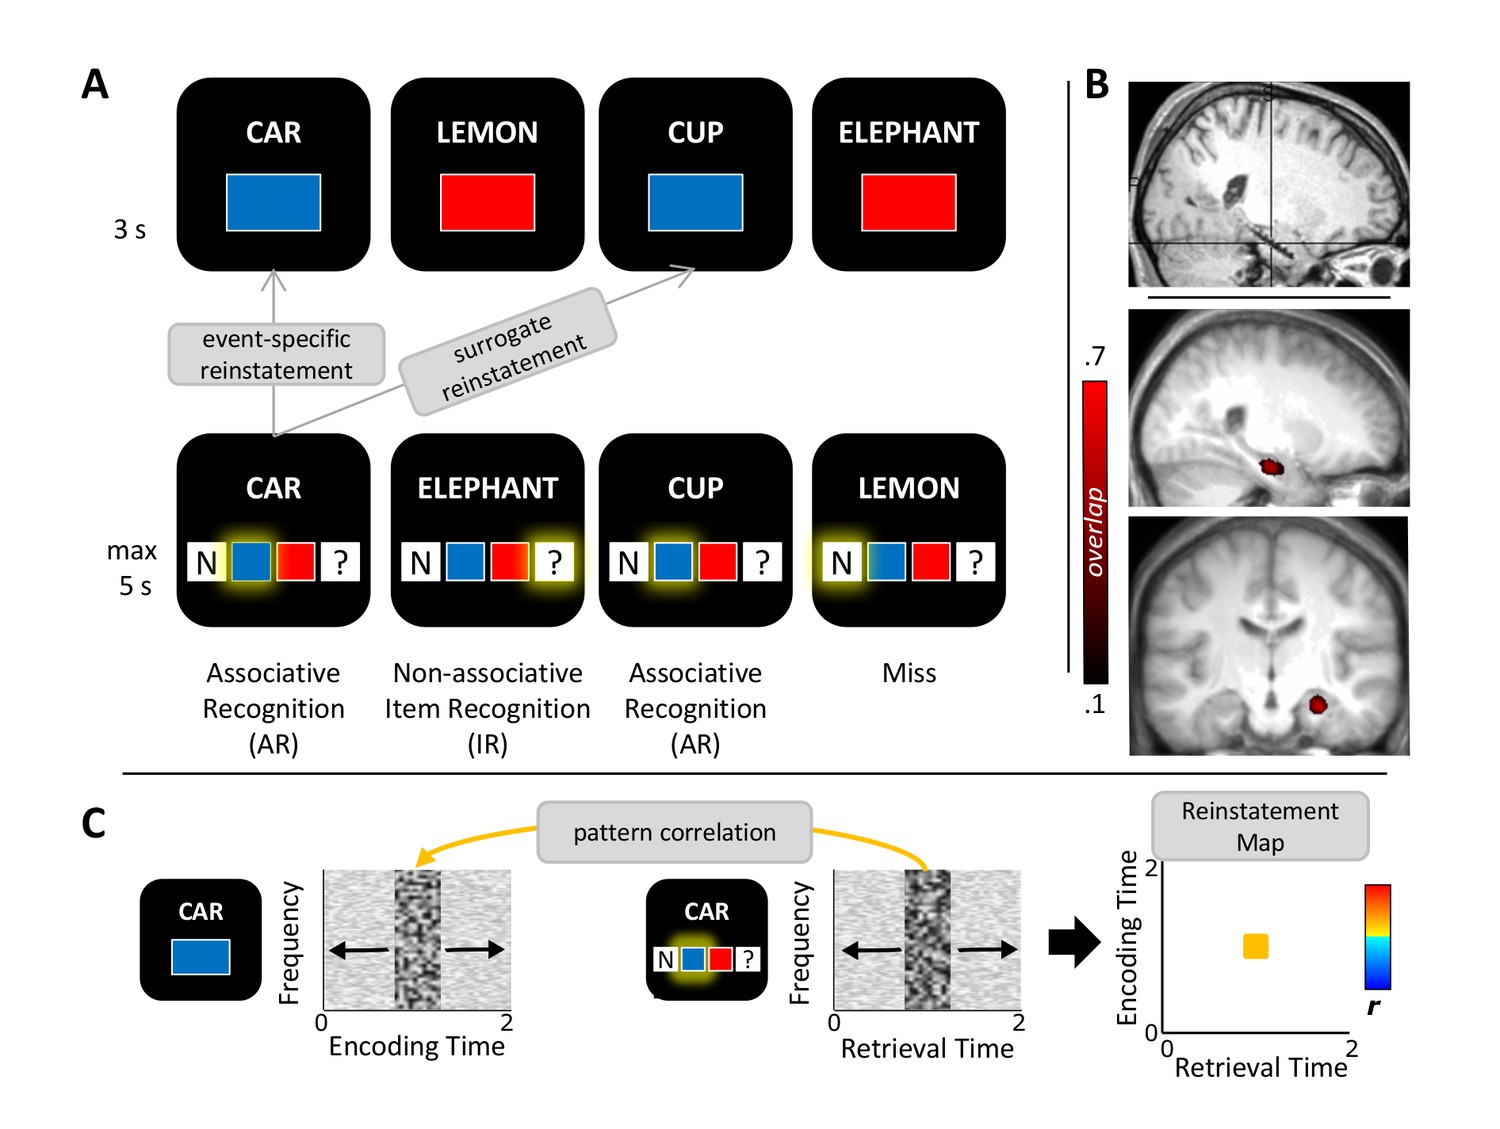
Study protocol.
(A) Experimental paradigm. During encoding (top), participants saw nouns together with one of two colours or one of two scenes (not shown) and indicated whether the combination was plausible or implausible. During retrieval (bottom), the same nouns along with previously unseen nouns were shown and participants indicated their memory for both the noun and the association. Pattern completion was operationalized as the event-specific reinstatement during successful associative recognition (AR) compared to non-associative item recognition (IR) and compared to surrogate data representing the similarity with all other trials in which the same association was recollected. (B) Anterior hippocampus electrode selection. Top: MNI-normalized post-implantation MRI of a single participant, with cross-hair placed on the selected contact. Bottom: Saggital and coronal mean pre-implantation MRI across 11 participants (MNI-normalized). Heat map shows the proportional overlap of 5 mm-radius spheres centred on each participant’s selected electrode. (C) Schematic overview of the reinstatement analysis. For each trial, retrieval and encoding patterns were correlated via a sliding 400 ms window encompassing relative power changes from 2–100 Hz (1-Hz steps from 2–29 Hz, 5-Hz steps from 30–100 Hz). Each instance of correlating a frequency x time encoding pattern with a frequency x time retrieval pattern results in a single correlation bin in a trial-specific reinstatement map (right). These maps were then averaged for each memory condition and taken forward to random-effects analyses across participants.
Figure 2 with 1 supplement
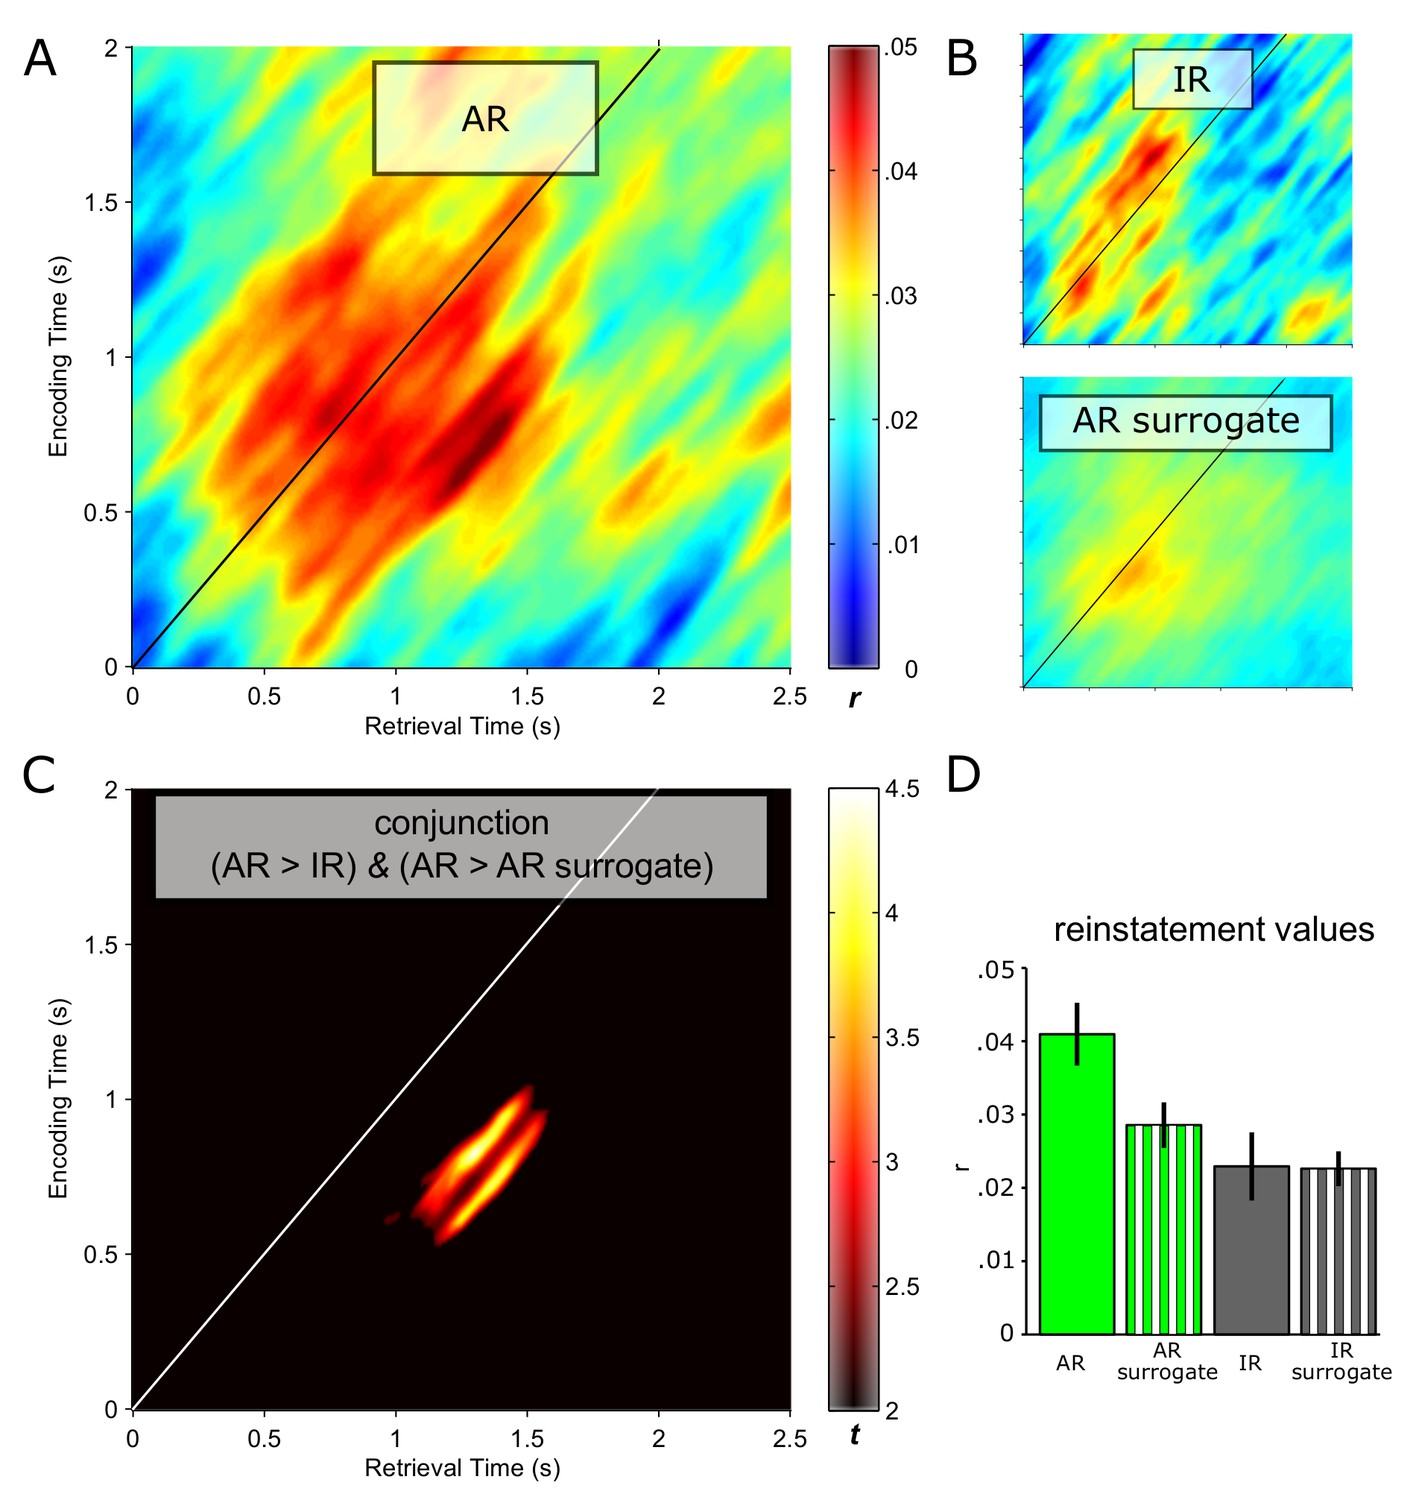
Pattern completion in the hippocampus during recollection.
Reinstatement maps based on sliding encoding-retrieval pattern correlations are shown for successful associative recognition (AR; (A)), for non-associative item recognition (IR; B top) and for AR surrogate data (B, bottom). X/Y axes and colour range are identical across panels. (C) Conjunction (minimum t statistic) of significant pairwise comparisons of AR vs. IR and AR vs. AR surrogates, each comparison thresholded at P<0.05 (cluster corrected). The diagonals in A–C highlight same time points at encoding and retrieval. Results show that encoding patterns from ~0.5 to 1 s are reliably reinstated from ~1 to 1.5 s during successful AR. (D) Average (± SEM) reinstatement values of 0.5 to 1 s encoding patterns at 1 to 1.5 s during retrieval are plotted for AR, IR and their respective surrogates for illustration purposes.
Figure 2—figure supplement 1

Contributions of different frequency bands to reinstatement.
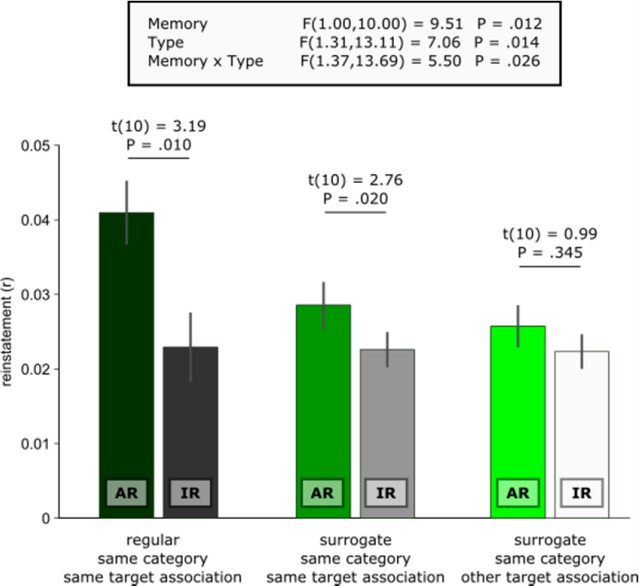
Analyses were conducted using a 400 ms time-frequency window centred on 0.75 s at encoding and 1.25 s at retrieval (where the maximum effect was observed in the main analysis, Figure 2C). (A) Reinstatement values for AR after selectively excluding (left) or only including (right) a particular frequency band. ‘Reference’ denotes the reinstatement value when including all frequency bands (c.f., Figure 2A). Bars show mean ± s.e.m. across participants (n=11). In a repeated measures ANOVA on reinstatement values including the factors Set (excluded, only) and Frequency Band (δ, θ, α, β, γ1, γ2), there was a significant main effect of Set (F(1, 10) = 83.43, P<0.001), but no main effect of Frequency Band (F(2.63, 26.28) = 1.95,P = 0.153) nor a Set x Frequency Band interaction (F(2.61, 26.06) = 0.58, P = 0.608). Note also that there was no effect of Frequency Band when analysing each set separately [band excluded: F(1.96, 19.59) = 2.44, P = 0.114; band only: F(2.57, 25.66) = 0.99, P = 0.403]. (B) Effect sizes (minimum t of the conjunction AR > AR surrogates & AR > IR) after selectively excluding (left) or only including (right) a particular frequency band. ‘Reference’ denotes the effect when including all frequency bands (c.f., Figure 2C). Dashed horizontal red line denotes the critical t value for P<0.05 (df = 10), uncorrected. (C) Decomposition of the ‘reference’ reinstatement into contributions of each frequency (‘correlation weights’): the product of normalized ‘standard scores’ was calculated for each time-frequency bin in the 400 ms window centred at 0.75 s encoding/1.25 s retrieval. To yield the relative contribution of each frequency to the observed correlation, these scores were summed across the 41 time bins. Note that the sum of these correlation weights along the frequency axis would again be the correlation coefficient between the encoding and retrieval time-frequency window (‘reference’). Correlation weights are separately shown for AR (green) and AR surrogates (grey). Frequencies are plotted on a log scale. Vertical lines show transitions between δ, θ, α, β, γ1 and γ2 bands. A repeated measures ANOVA including the factors Condition (AR, AR surrogates) and Frequency (2:1:29 30:5:100) on these correlation weights revealed only a main effect of Condition (F(1, 10) = 10.09, P = 0.010; reflecting the greater reinstatement for AR than for AR surrogates), and no main effect of Frequency F(5.98, 59.83) = 1.74, P = 0.128) nor a Condition x Frequency interaction (F(5.65, 56.49) = 1.32, P = 0.267).
Figure 3 with 4 supplements
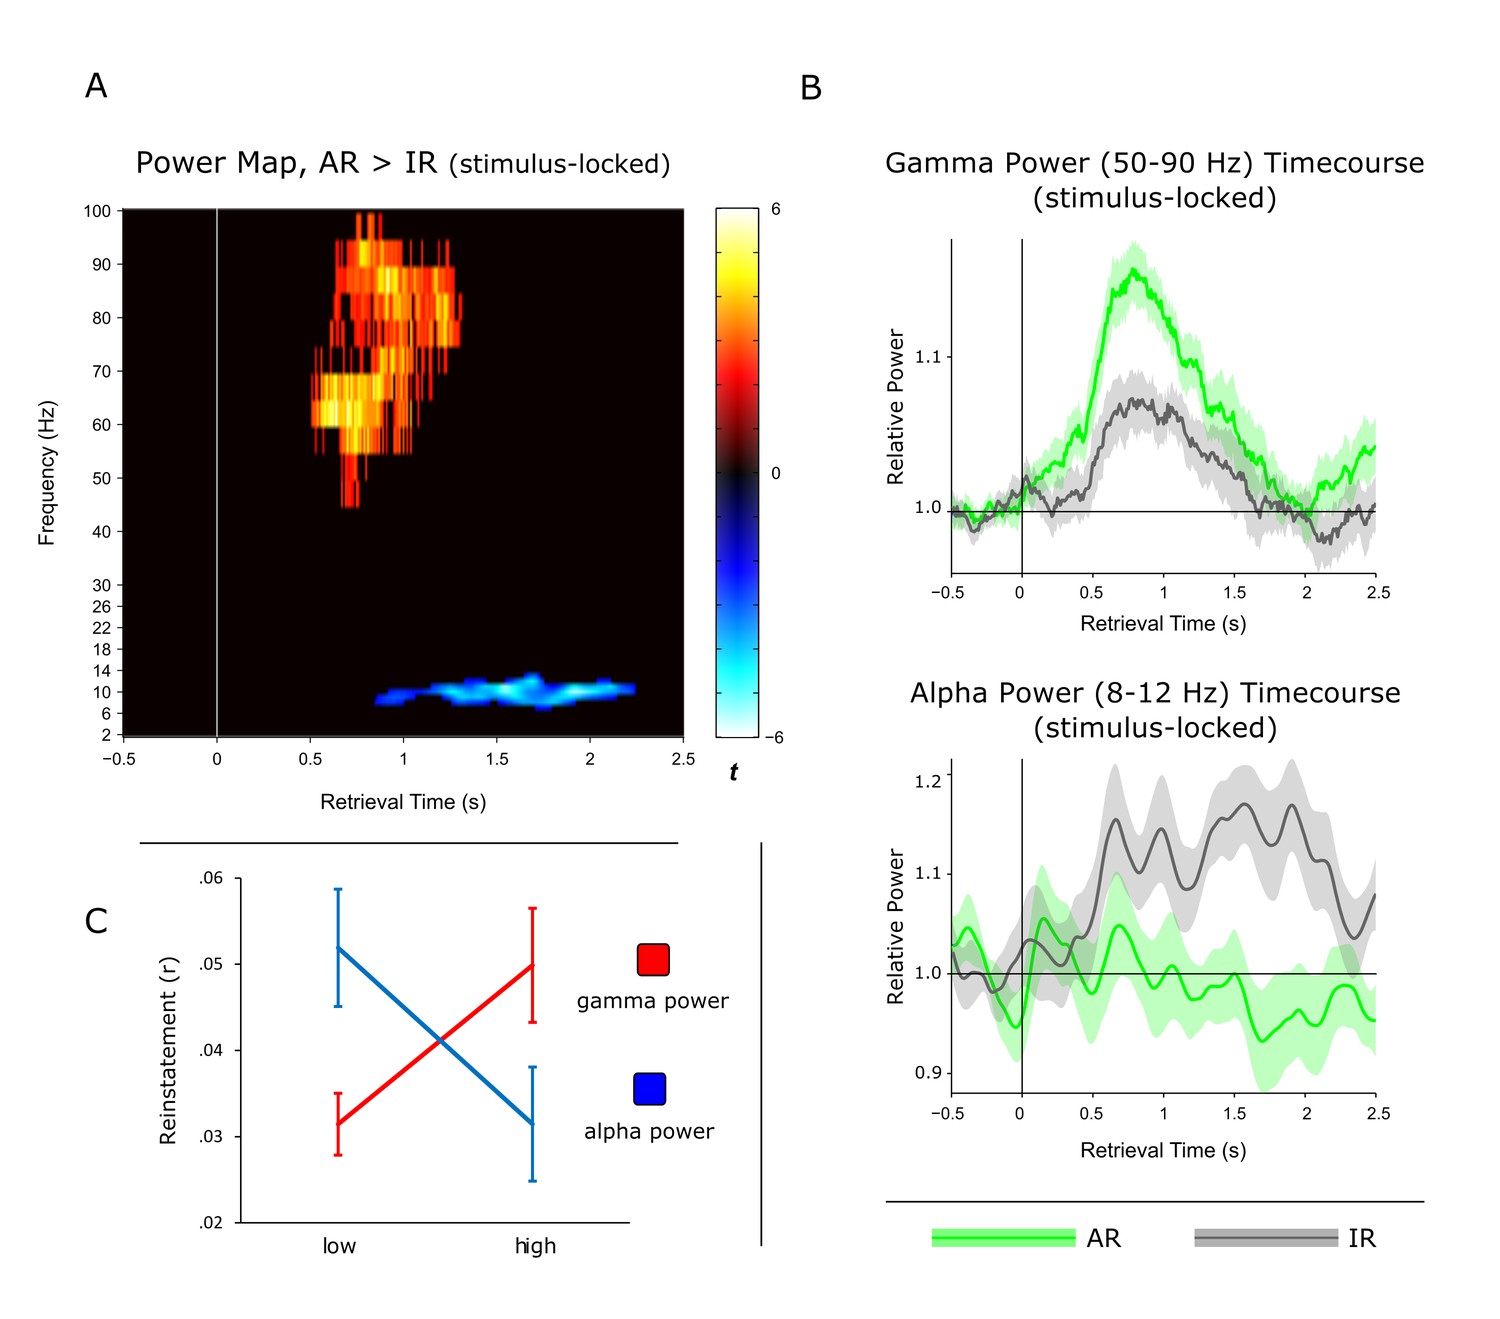
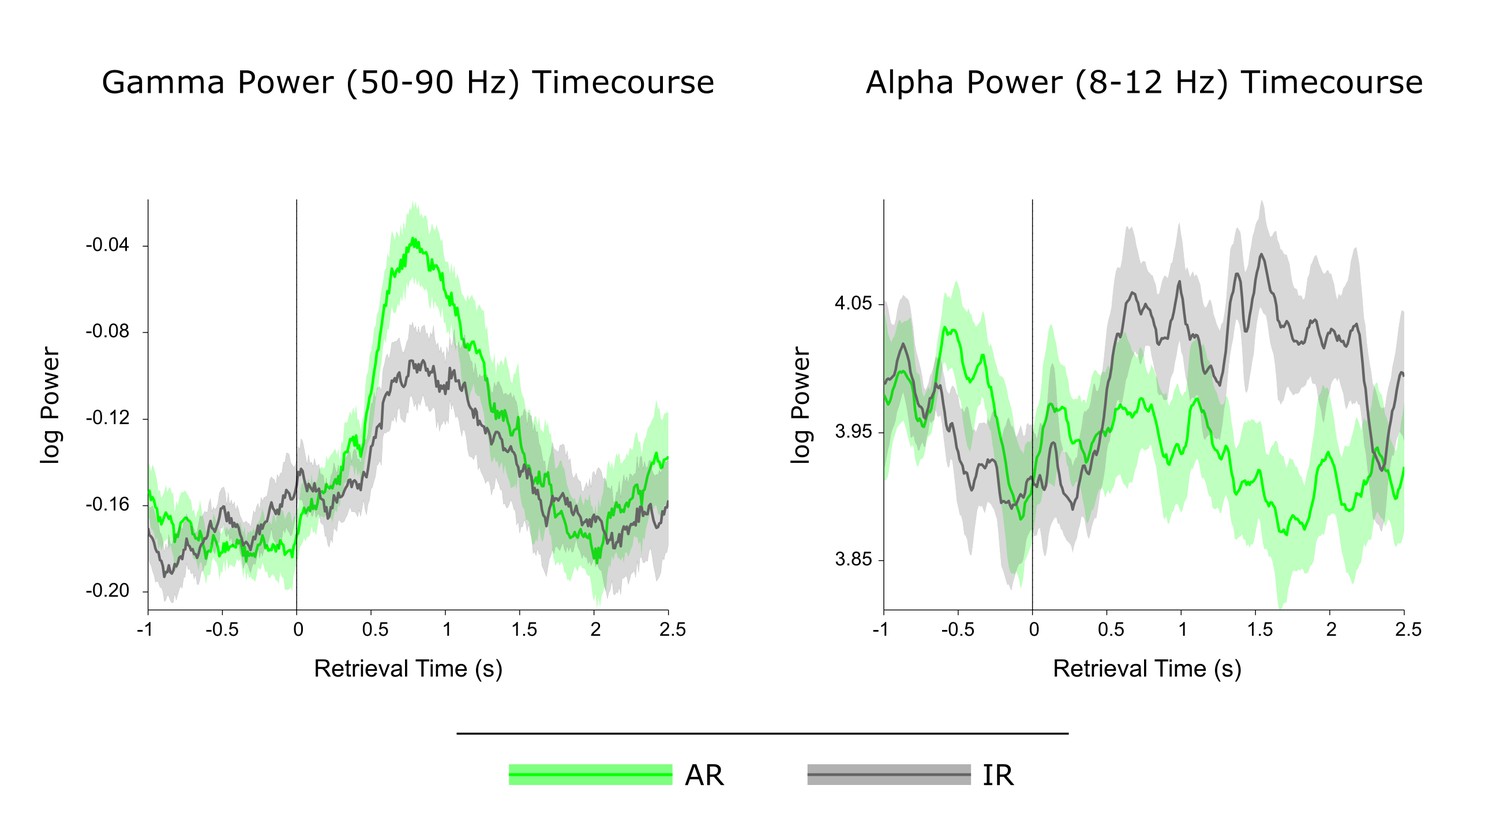
Power dynamics during recollection.
(A) Time-frequency contrast map comparing successful associative recognition (AR) with non-associative item recognition (IR), revealing a cluster of increased power for AR in the gamma band (50–90 Hz) followed by a cluster of increased power for IR in the alpha band (8–12 Hz). Map is thresholded at P<0.05 (corrected), with the unthresholded contrast map shown in Figure 3—figure supplement 1. (B) The time courses of AR and IR in the resulting frequency bands for illustration of relative power in- and decreases. (C) Link between gamma power increases/alpha power decreases during AR and pattern reinstatement. Median-split of power values reveals greater reinstatement during AR trials when gamma power is high and alpha power is low.
Figure 3—figure supplement 1
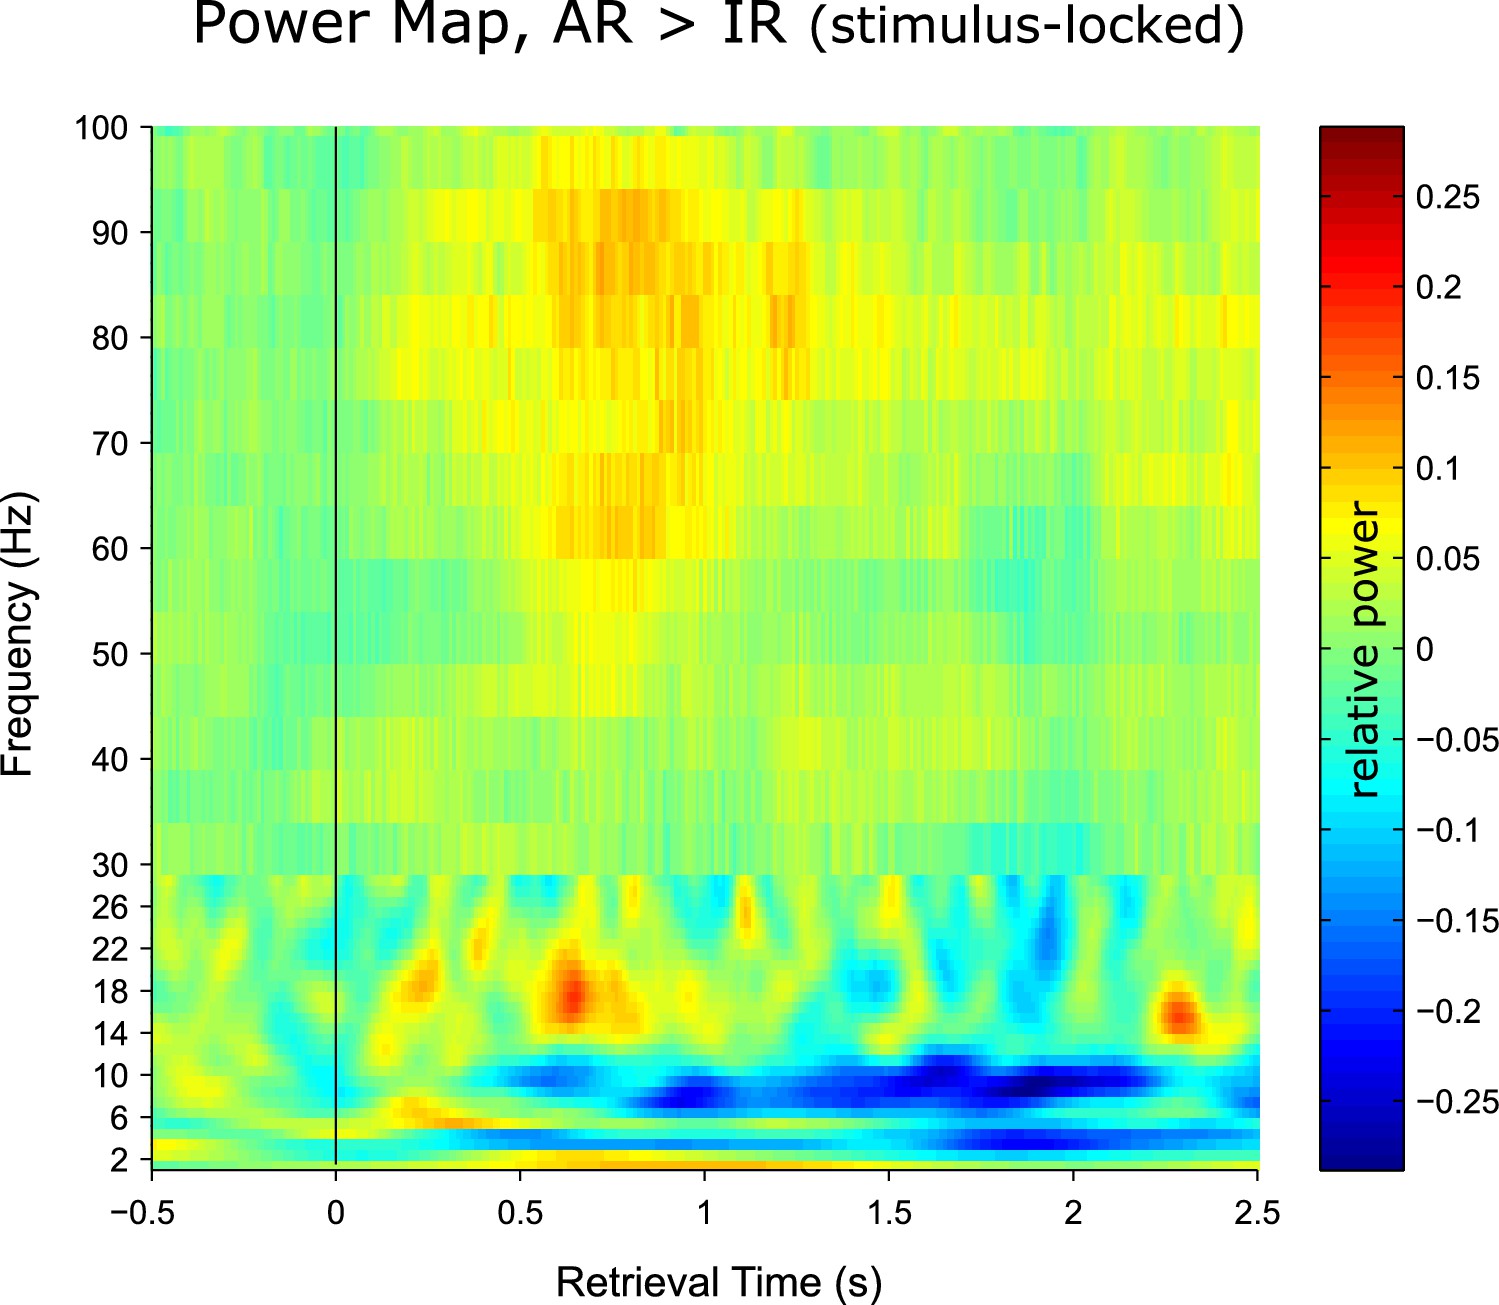
Unthresholded time-frequency representation of the contrast associative recognition (AR) > non-associative item recognition (IR).
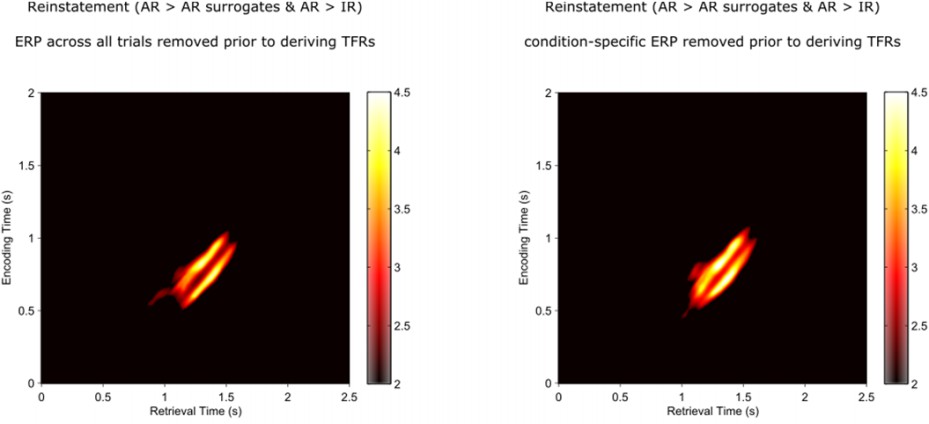
Note that the transition in resolution at 30 Hz reflects the switch from Hanning-taper for lower frequencies to multitaper for higher frequencies (Materials and methods).
Figure 3—figure supplement 2
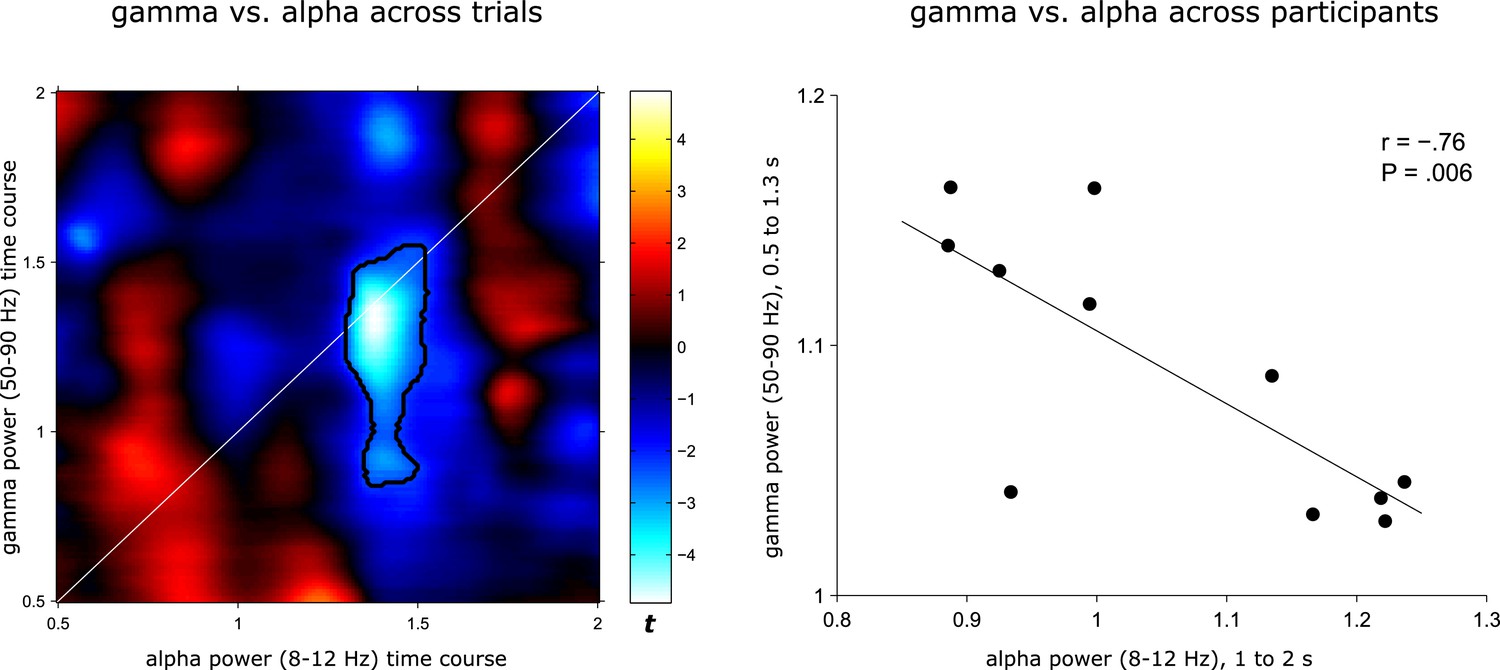
Earlier gamma power and later alpha power are negatively correlated.
Left: Trial-by-trial Pearson correlations of gamma and alpha timecourses were calculated for each participant for 0.5 to 2 s (spanning the time windows where gamma and alpha effects were observed for AR vs. IR, Figure 3), separately for AR and IR trials. The resulting correlation maps were then collapsed across AR and IR, Fisher z transformed and compared against 0 to reveal positive or negative correlations reliable across participants. Statistical map represents t values for the group-level t test against 0. Values above the diagonal reflect earlier alpha power correlating with later gamma power and values below the diagonal reflect earlier gamma power correlating with later alpha power. Black contour highlights a significant cluster (P<0.05, corrected) in which earlier gamma power from ~.8 to 1.5 s correlates negatively with later alpha power from ~1.3 to 1.5 s. Right: Across-participant Pearson correlation of 0.5 to 1.3 s gamma power with 1 to 2 s alpha power (i.e. the time-frequency clusters showing condition differences between AR vs. IR, Figure 3). Power values were derived separately for AR and IR trials and then collapsed prior to calculating the correlation.
Figure 3—figure supplement 3
No condition differences in the baseline period.
Gamma and alpha retrieval time courses (log transformed) are shown without baseline correcting the data, ensuring that condition differences are not driven by pre-stimulus baseline effects (see main text for statistics).
Figure 3—figure supplement 4
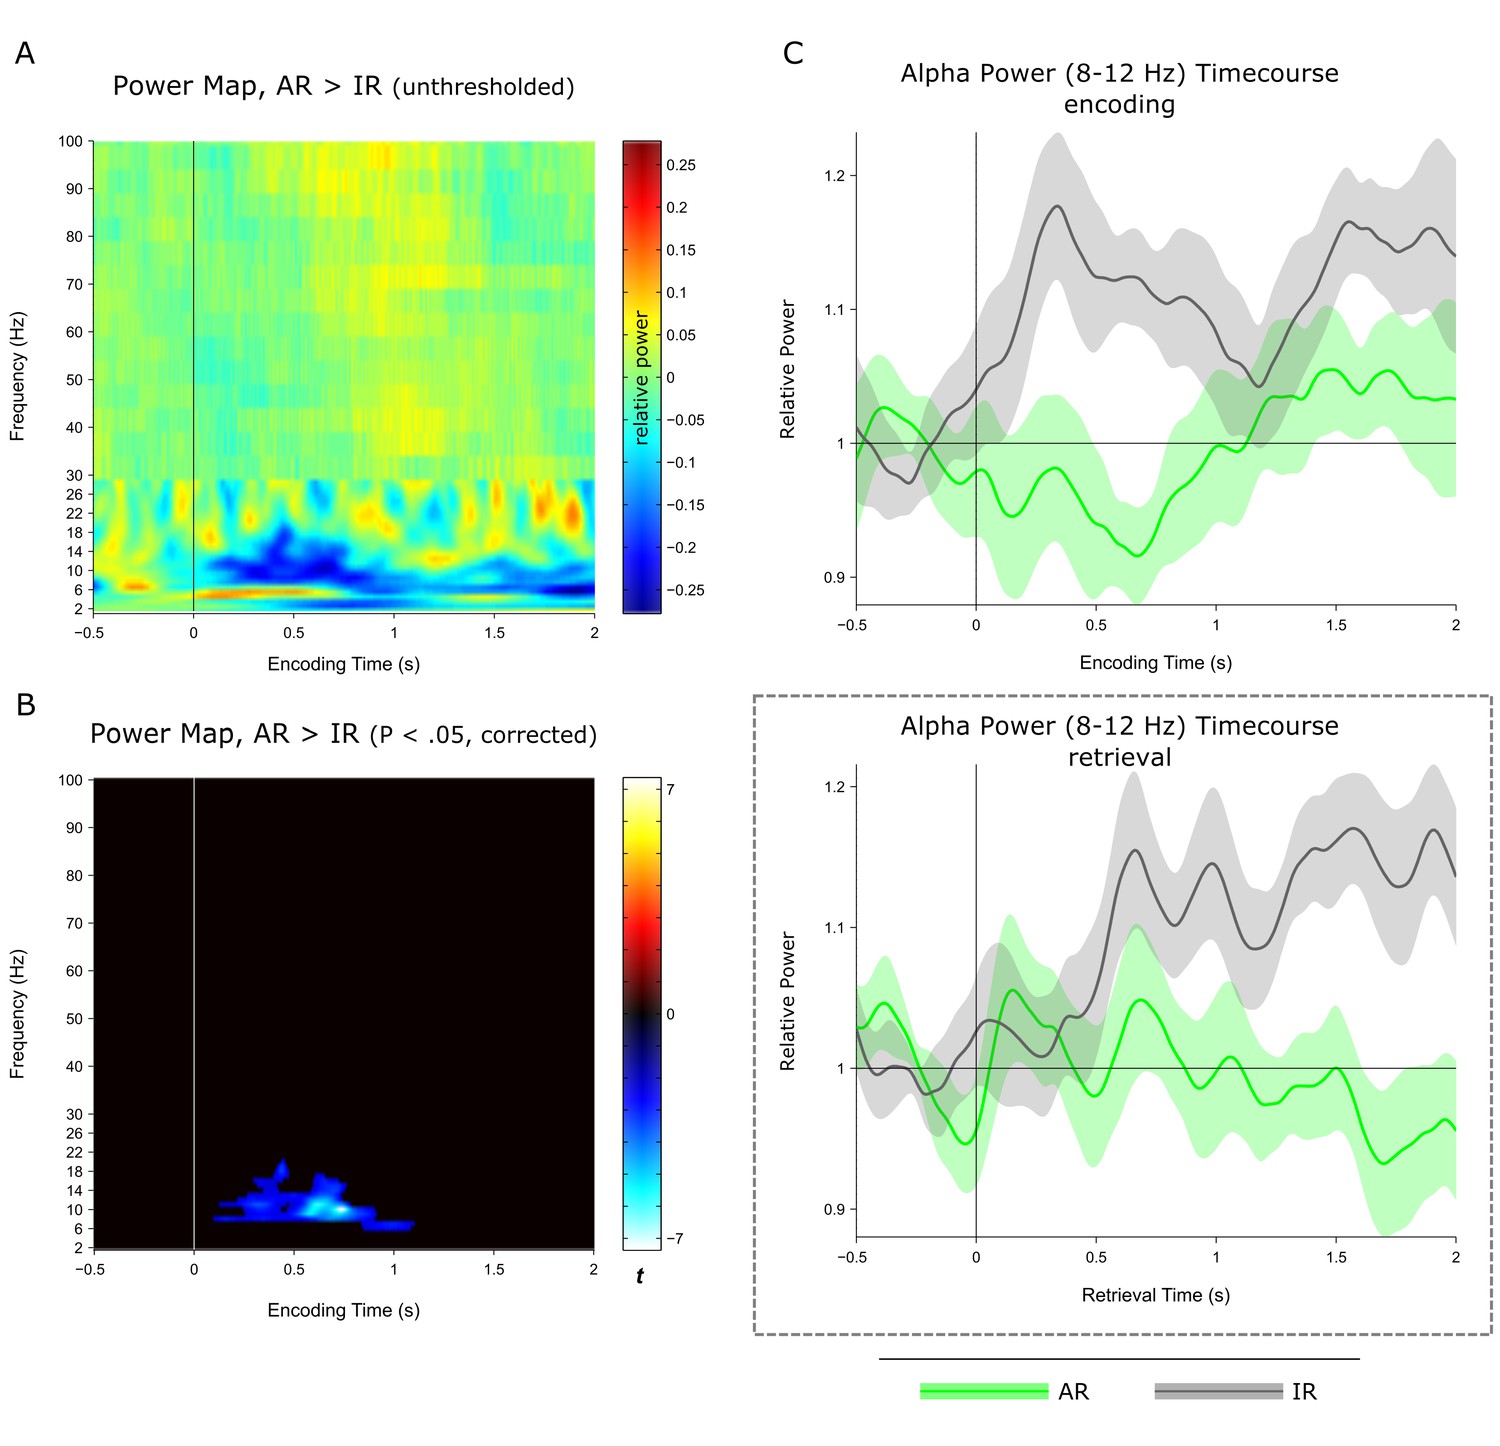
Encoding data.
(A) Time-frequency representation of the contrast subsequent associative recognition (AR) > subsequent non-associative item recognition (IR). Note that the transition in resolution at 30 Hz reflects the switch from Hanning-taper for lower frequencies to multitaper for higher frequencies (Materials and methods). (B) Same as A, after statistical thresholding (P<0.05, corrected). Note the pronounced cluster centred on the alpha frequency band (8–12 Hz). (C) top: Encoding power time courses of AR and IR for 8–12 Hz. bottom: For comparison, alpha power (8–12 Hz) timecourses of AR and IR at retrieval are plotted. When dividing the time axis into an early and a late interval (0 to 1 s vs. 1 to 2 s), there was a significant interaction of time window (early, late) x memory stage (encoding, retrieval) x condition (AR, IR) (F(1,10) = 10.27, P = 0.009). This interaction reflected the fact that there was a significant increase of IR vs. AR in the early time window at encoding (t(10) = 4.25, P = 0.002) but not at retrieval (t(10) = 1.82, P = 0.099), whereas the increase of IR vs AR in the late time window was more pronounced at retrieval (t(10) = 8.47, P<0.001) than at encoding (t(10) = 2.30, P = 0.044).
Figure 4 with 2 supplements
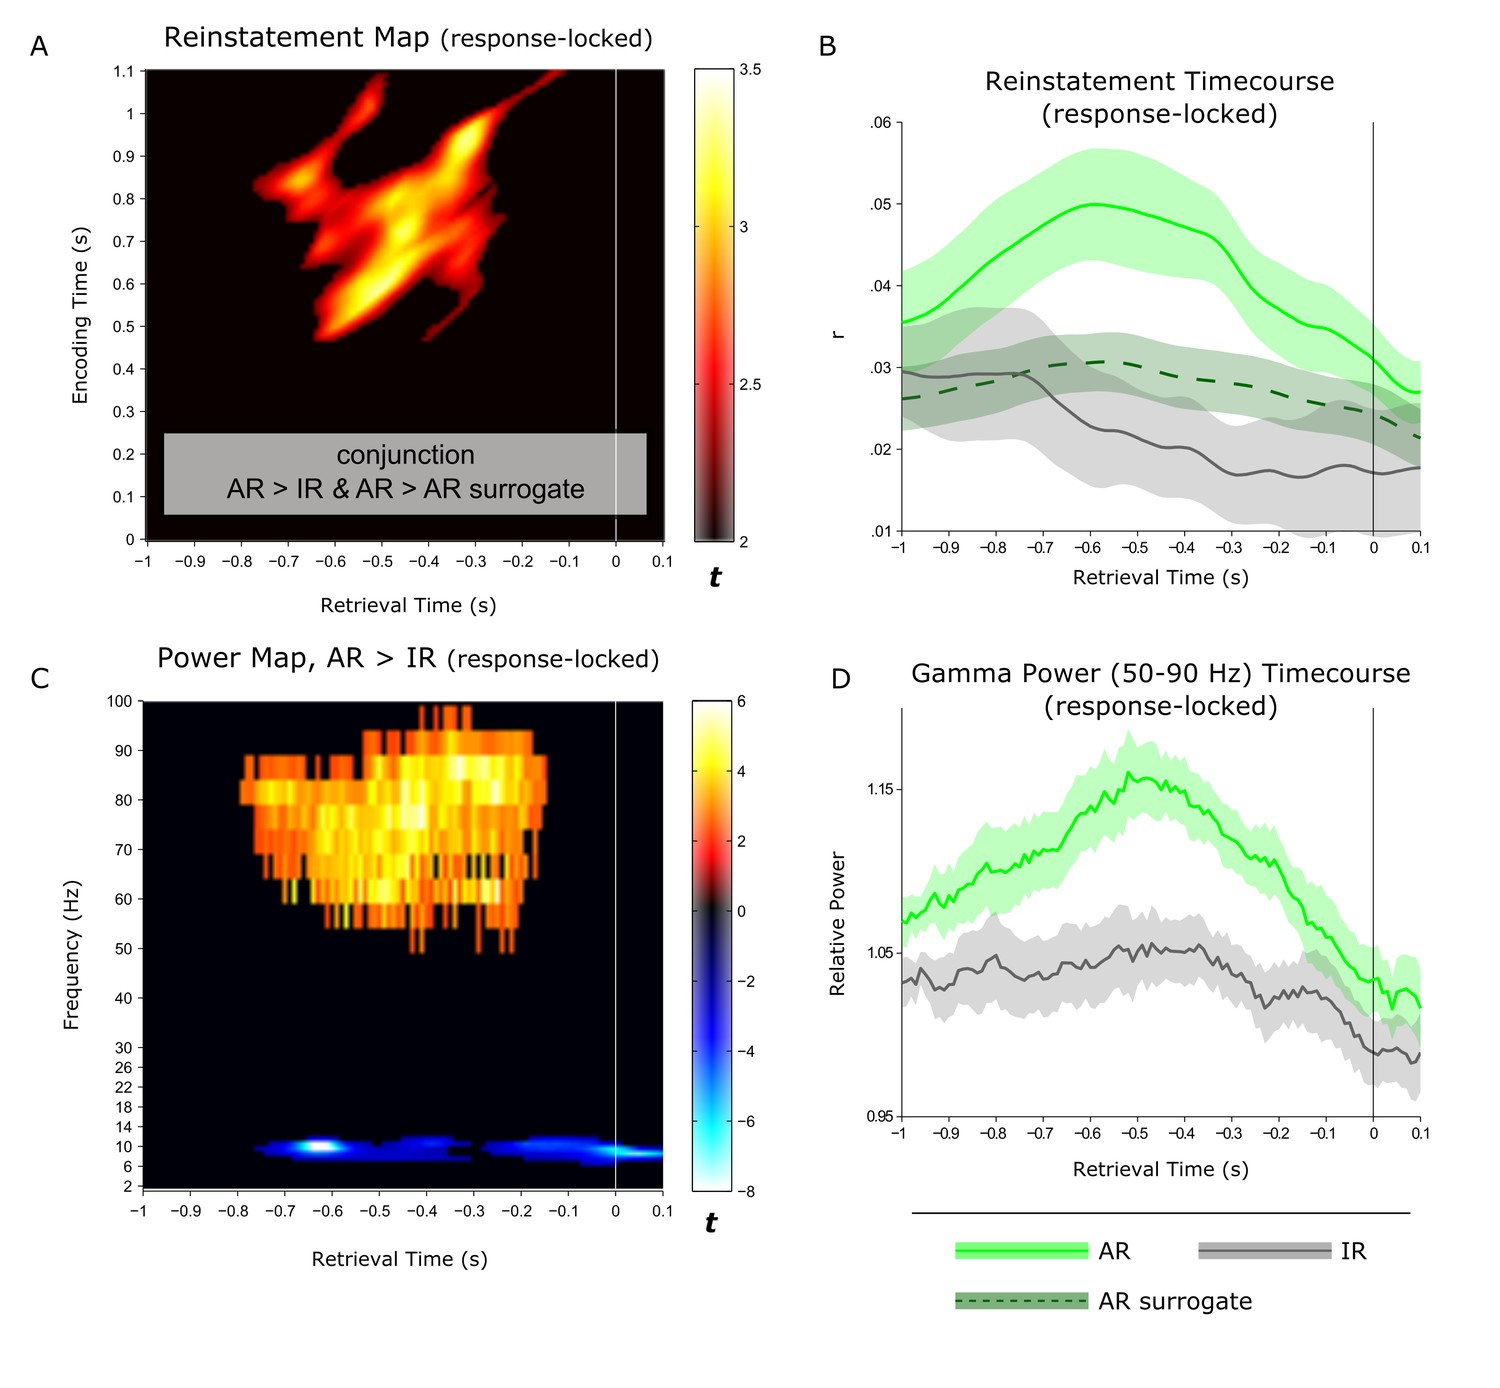
Linking hippocampal reinstatement and power dynamics to behaviour.
(A) Reinstatement map from −1 s to +0.1 s relative to the behavioural response, revealing a significant cluster of ~0.5-1 s encoding patterns being reinstated from ~−0.8 to −0.2 s prior to the button press. (B) For visualization, average (± SEM) time-course data are shown for reinstatement of the ~0.5 to 1 s encoding patterns for associative recognition (AR), non-associative item recognition (IR) and AR surrogate data. (C) Power contrast map of AR > IR from −1 s to +0.1 s relative to the behavioural response, revealing a significant gamma power (50–90 Hz) cluster from ~−0.8 to −0.2 s during retrieval and a more sustained, narrow-band alpha power (8–12 Hz) cluster. (D) For visualization, average (± SEM) power time-course data are shown for associative recognition (AR) and non-associative item recognition (IR).
Figure 4—figure supplement 1
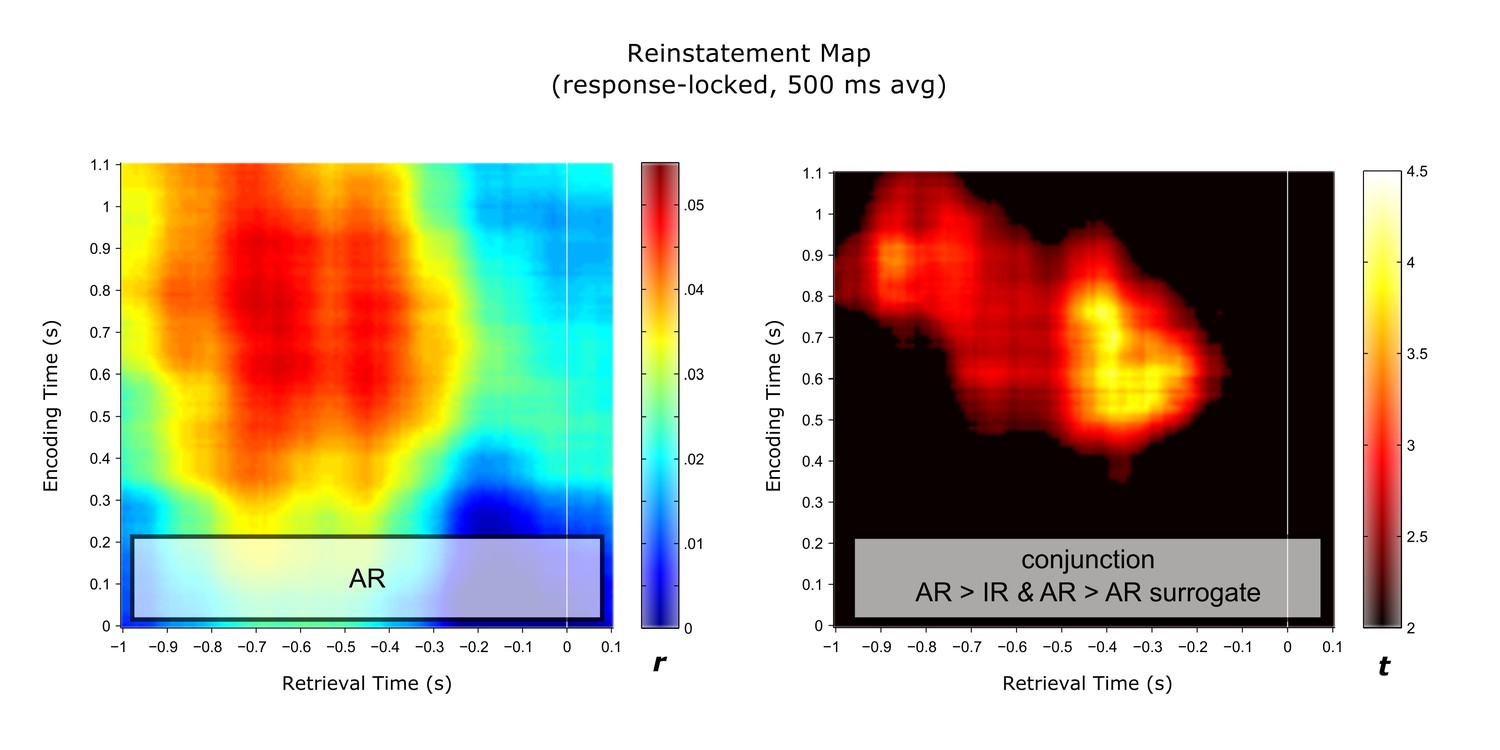
Response-locked reinstatement map with modified analytical settings.
Results are based on sliding encoding-retrieval pattern correlations, using integrated 500 ms windows at each frequency. Left: Reinstatement map for successful associative recognition (AR). Right: Conjunction (minimum t statistic) of significant pairwise comparisons of AR vs. IR and AR vs. AR surrogates, each comparison thresholded at P<0.05 (cluster corrected). Results show that encoding patterns from ~0.5 to 1 s are reliably reinstated from ~1 to 0.2 s prior to the behavioural response.
Figure 4—figure supplement 2
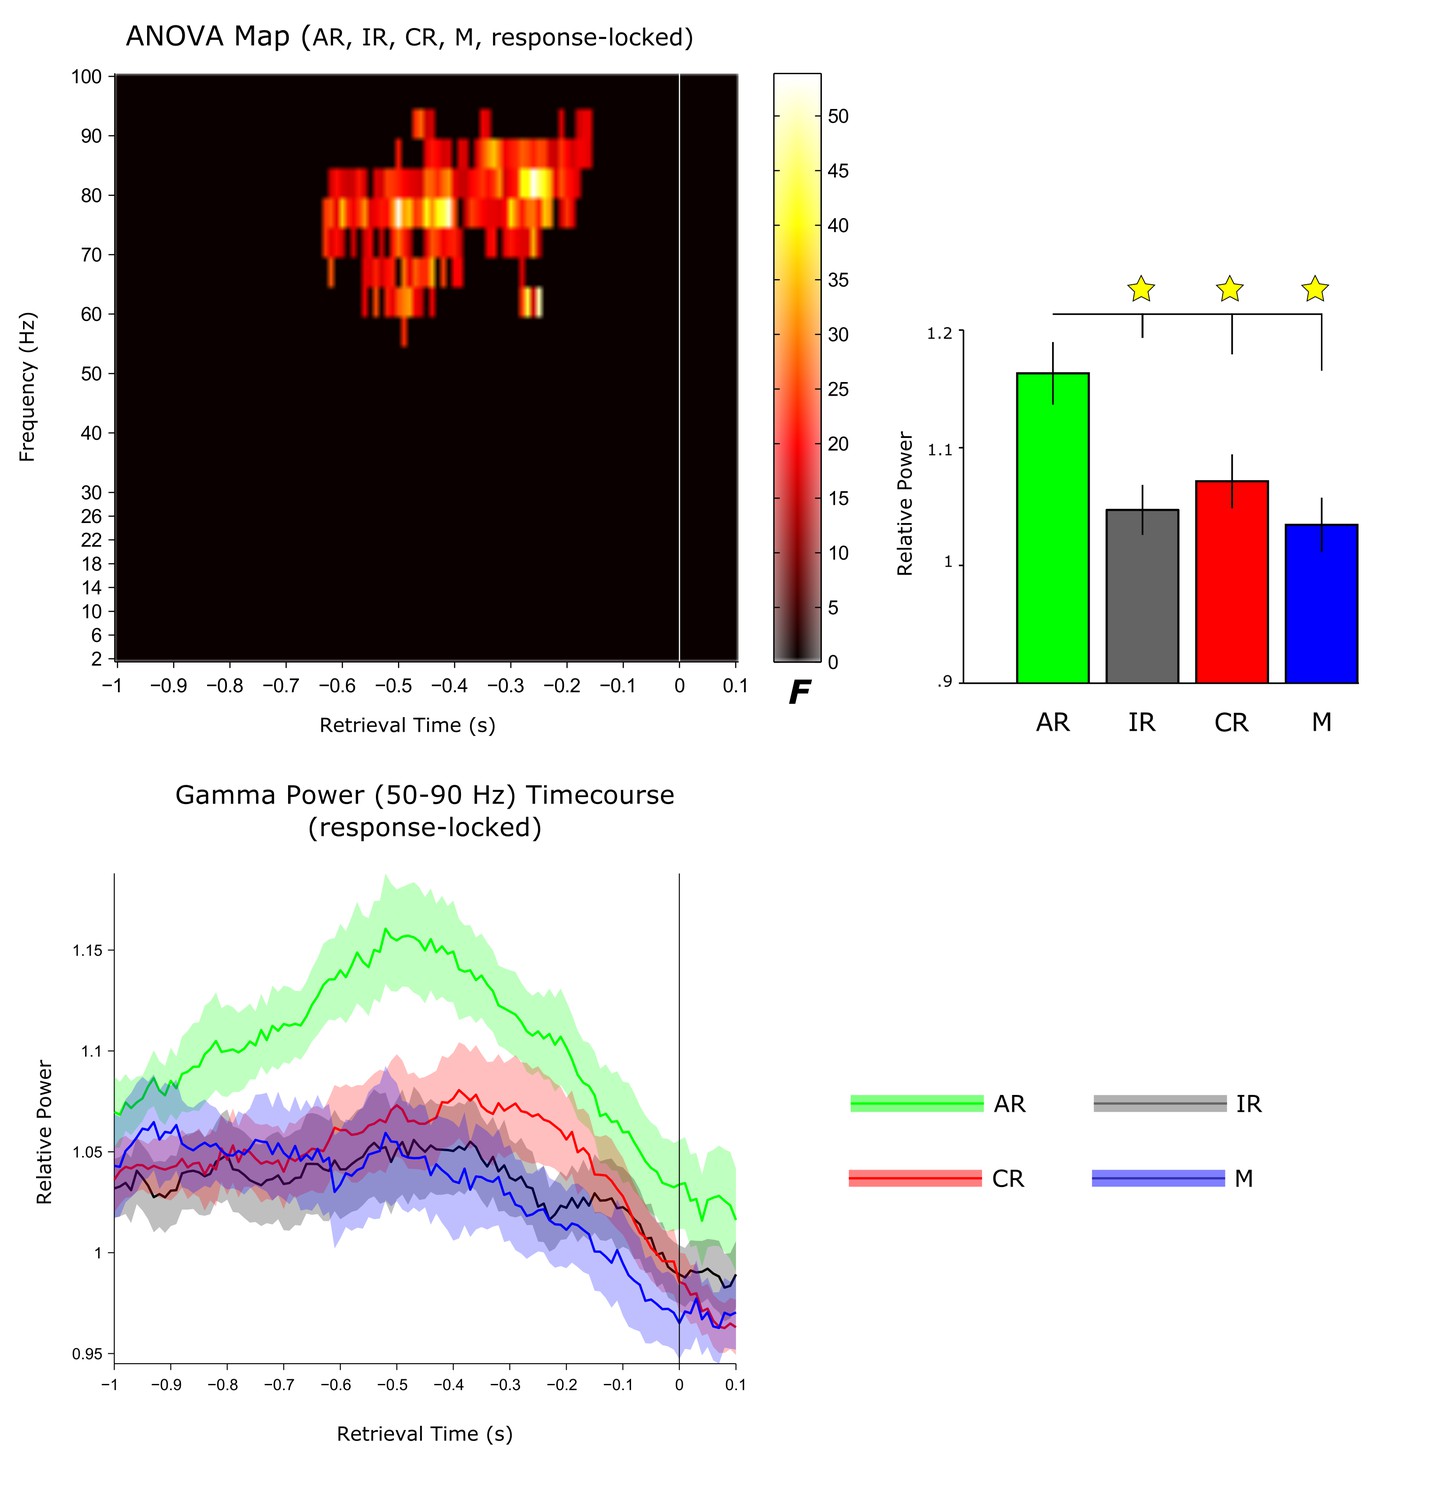
Selectivity of hippocampal gamma oscillations to recollection.
Top: In an exploratory analysis, an omnibus one-way repeated-measures ANOVA was used to identify response-locked time-frequency points that distinguish between associative recognition (AR), non-associative item recognition (IR), misses (M) and correct rejections (CR). Results (cluster-corrected for multiple comparisons) reveal a single significant cluster in the gamma band (55–95 Hz). Bar graphs show the condition-specific power values extracted from the resulting cluster. Pairwise comparisons showed that AR trials were accompanied by significantly greater gamma power than all other conditions (all t(10) > 2.63, P<0.026), with no difference across IR, M and CR trials (all t(10) < 1.53, P>0.159. Bottom: Response-locked gamma power time course for the frequency range resulting in the main comparison of AR > IR (50–90 Hz; Figure 2). Data show average ± SEM across participants.
Author Response Image 1
Author Response Image 2
Author response image 3
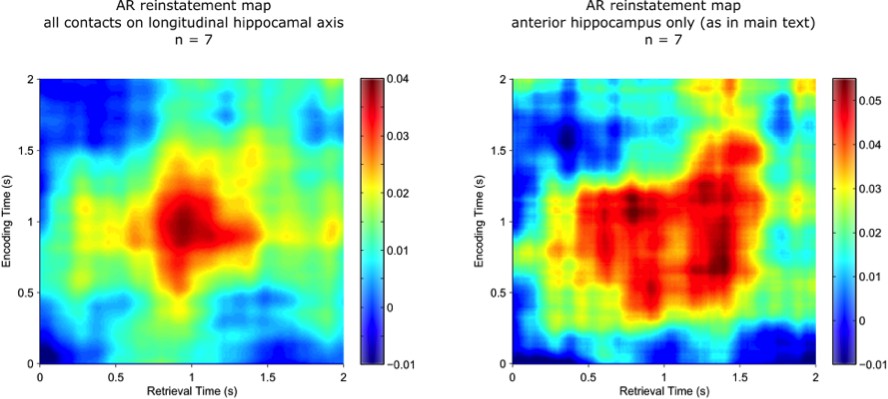
The figure shows that the resulting reinstatement map for AR trials based on all hippocampal channels (left) is qualitatively very similar to the same participants’ reinstatement map for AR trials based on the selected anterior hippocampal contact only (right).
https://doi.org/10.7554/eLife.17397.017Tables
Table 1
Behavioural results. a. Average (and SEM) proportion of hits and correct rejections out of all old and new test nouns, respectively. b. Average (and SEM) proportion of associative memory performance out of all hits.
a. recognition memory | |
|---|---|
| hit | 0.76 (0.04) |
| correct rejection | 0.79 (0.05) |
b. associative memory | |
|---|---|
| association correct | 0.52 (0.05) |
| "don't know" association | 0.32 (0.07) |
| association incorrect | 0.16 (0.03) |
Table 2
Behavioural results, separated by colour and scene blocks. a. Average (and SEM) proportion of 'plausible' and 'implausible' responses during encoding. b. Average (and SEM) proportional associative memory performance for old item hits.
| a. encoding responses | Colour | Scene |
|---|---|---|
| "plausible" | 0.50 (0.03) | 0.46 (0.05) |
| "implausible" | 0.47 (0.03) | 0.50 (0.05) |
| invalid | 0.04 (0.02) | 0.04 (0.02) |
| b. memory performance | Colour | Scene |
|---|---|---|
| association correct | 0.51 (0.06) | 0.52 (0.05) |
| "don't know" association | 0.32 (0.08) | 0.31 (0.07) |
| association incorrect | 0.16 (0.03) | 0.17 (0.03) |
Download links
A two-part list of links to download the article, or parts of the article, in various formats.
Downloads (link to download the article as PDF)
Open citations (links to open the citations from this article in various online reference manager services)
Cite this article (links to download the citations from this article in formats compatible with various reference manager tools)
Hippocampal pattern completion is linked to gamma power increases and alpha power decreases during recollection
eLife 5:e17397.
https://doi.org/10.7554/eLife.17397


