Complementary mechanisms create direction selectivity in the fly
- Max Planck Institute of Neurobiology, Germany
- Baylor College of Medicine, United States
Figures
Figure 1
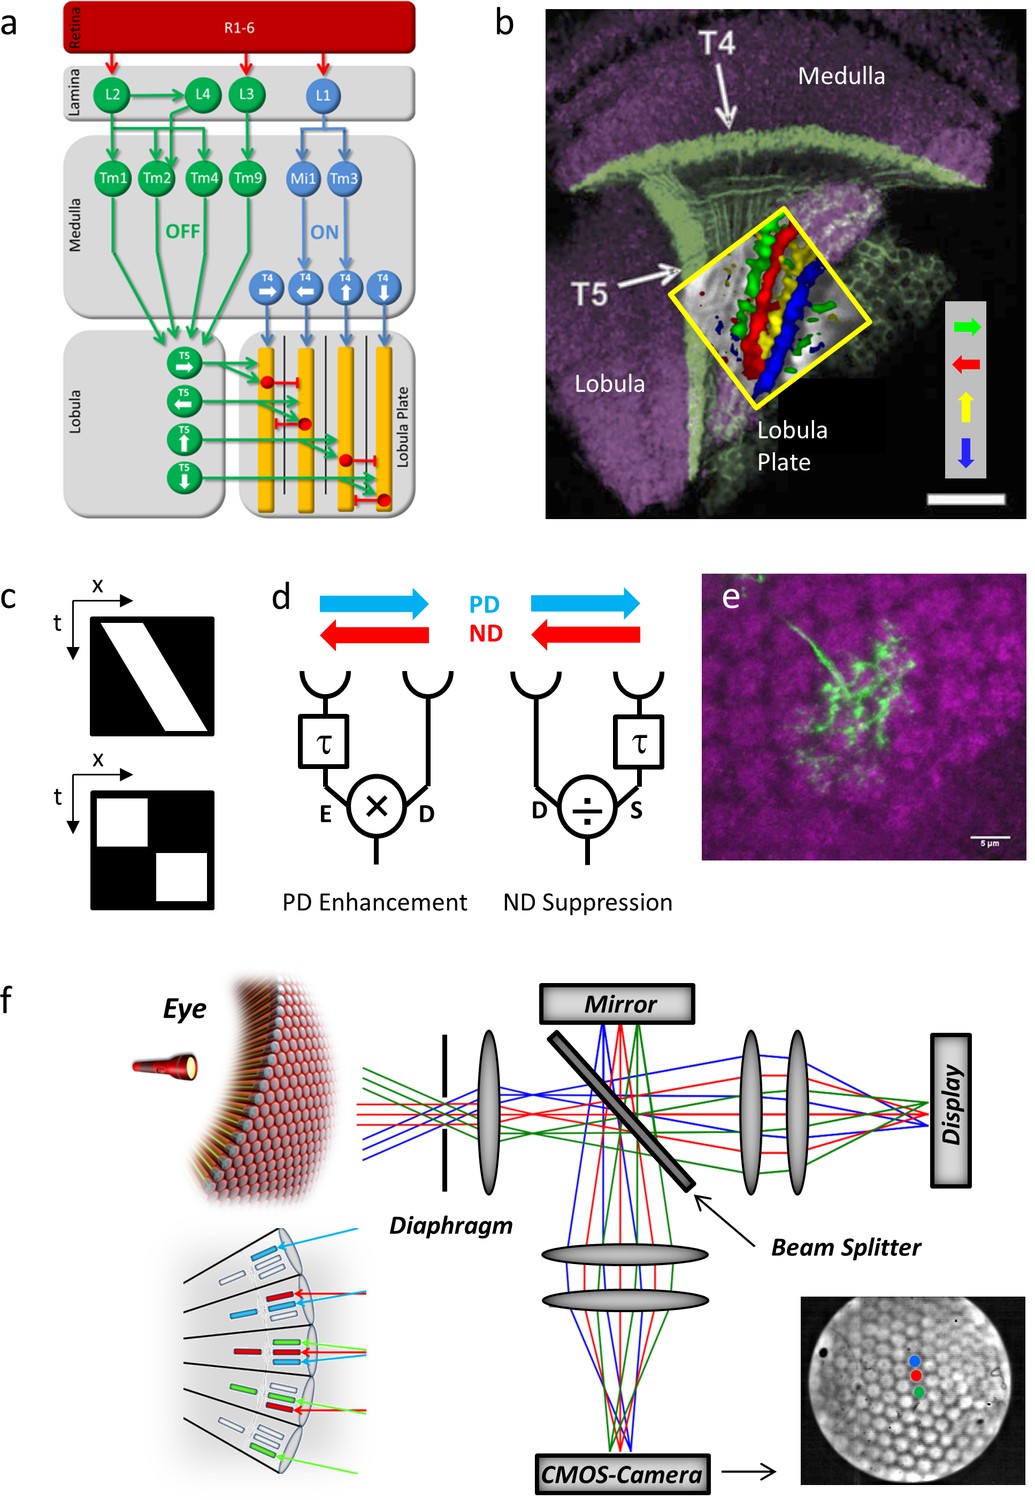
Fly optic lobe and visual stimulation.
(a) Circuit diagram of the ON and the OFF pathway of fly motion vision. Directionally selective signals are carried via T4 and T5 cells to four layers of the lobula plate, where T4 and T5 cells with the same preferred direction converge on the dendrites of the tangential cells (yellow). Inhibition is conveyed via local interneurons LPi (red). From Borst and Helmstaedter, 2015. (b) Confocal image of T4 and T5 cells and their directional tuning. The light green bands indicate the dendrites of T4 and T5 cells. The presynaptic terminals of both T4 and T5 cells form four distinct layers within the lobula plate. The inset shows the result of two-photon calcium imaging, revealing four subgroups of T4 and T5 cells tuned to the four cardinal directions. Scale bar, 20 μm. From Borst and Helmstaedter, 2015. (c) Continuous (top) versus apparent motion (bottom), shown as x-t-plots where the luminance distribution is shown along one spatial (x) and the time axis (t). During continuous motion at constant velocity, a luminance profile is smoothly drifting along one direction, giving rise to a slanted bar in the x-t-plot. During apparent motion, the luminance profile is stable for a while and then jumps to a new position. (d) Two mechanisms proposed to account for direction selectivity. In each model, the signal from one photoreceptor is delayed by a temporal filter (τ) and fed, together with the direct signal from the neighboring photoreceptor, into a nonlinearity. In case of preferred direction enhancement (left), the delayed signal (E) enhances the direct signal (D), e.g. by a multiplication (E x D), in case of the null direction suppression (right), the delayed signal (S) suppresses the direct signal (D), e.g. by a division (D/S). (e) Immunostaining of a single T4 dendrite in layer 10 of the medulla (green) covering multiple columns (counterstained against bruchpilot, purple). (f) Setup for telescopic stimulation of single lamina columns. Antidromic illumination of the eye (left) results in parallel beams from the 6+2 photoreceptors in neighboring facets with identical optical axes. These are focused in the back focal plane of the objective projected onto a CMOS camera. In addition, an AMOLED display is coupled into the beam path to precisely stimulate single lamina columns. Lower left inset: The fly eye and the principle of neural superposition. Light rays parallel to each other shown in the same color activate different photoreceptors in neighboring ommatidia that converge onto a single column in the lamina (‘neuro-ommatidium’). Lower right inset: Picture from the CMOS camera, showing the far field radiation pattern of the Drosophila eye. Dot stimuli can be precisely positioned such as to stimulate single lamina columns.
Figure 2
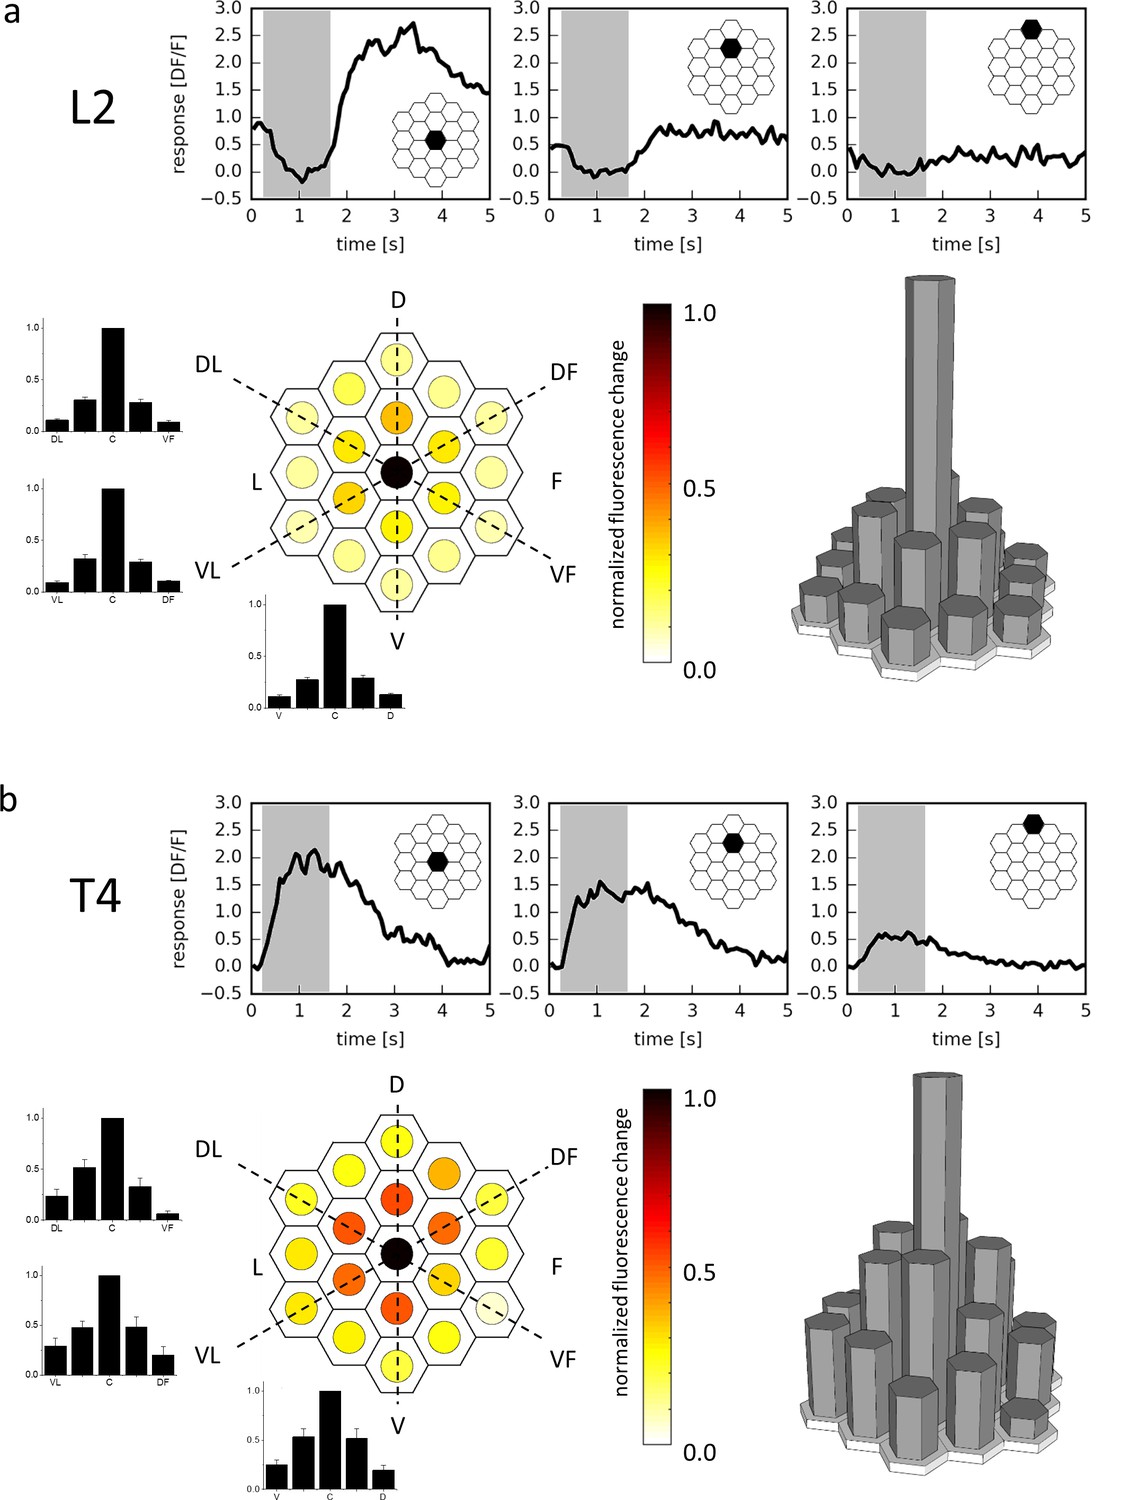
Receptive field of L2 (a) and T4 (b) cells.
Three example traces from a single terminal (top, stimulated ommatidium indicated in black) and mean responses (bottom) of L2 cells (a, n = 23 cells from six flies) and T4 cells (b, n = 10 cells from 10 flies) to flicker stimuli presented at 19 different columnar positions. The responses of individual cells were averaged after alignment to the maximum and normalization and are shown in false color code (left) as well as in 3D bar plots (right). In addition, responses are presented as bar plots along the three axes (dashed lines) of the hexagonal array (mean ± SEM). D = dorsal, V = ventral, L = lateral, F = frontal, DL = dorso-lateral, VF = ventro-frontal, VL = ventro-lateral, DF = dorso-frontal.
Figure 3
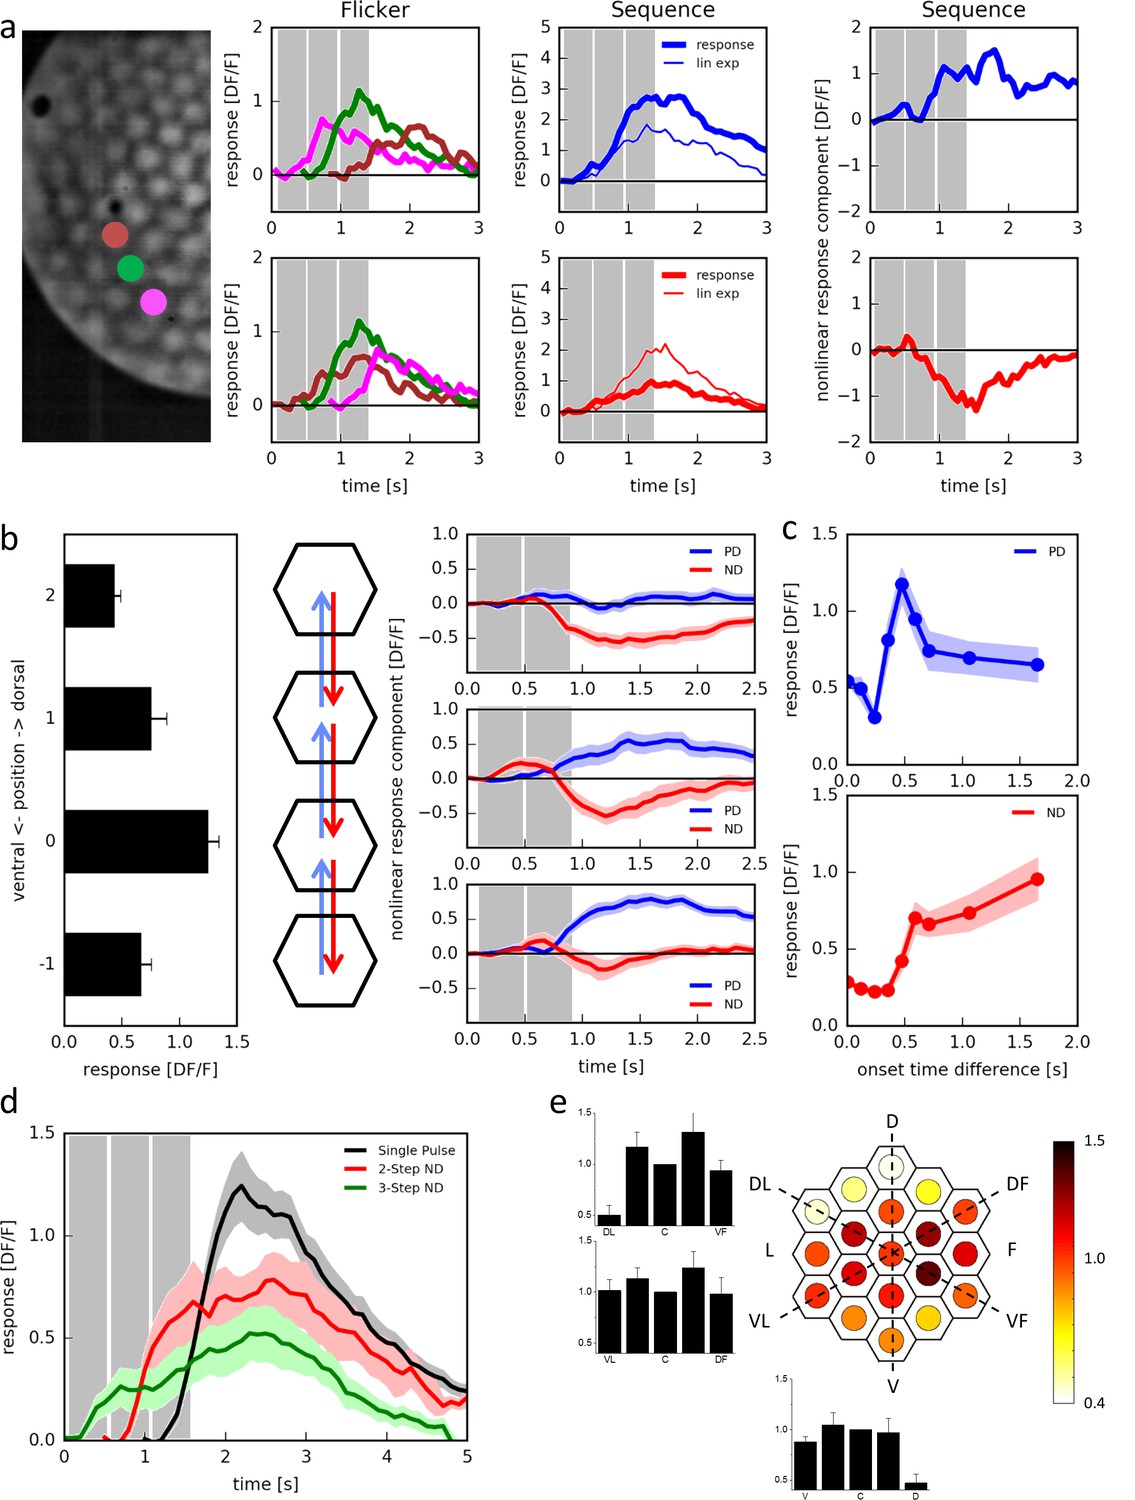
Responses of T4 neurons to apparent motion stimulation.
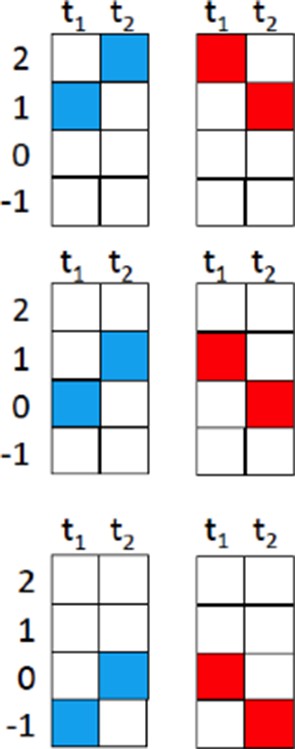
(a) Response of a single T4 cell recorded in a single sweep to three-step apparent motion stimuli. The image shows the position of the three stimuli. Left: Responses to individual light pulses (‘Flicker’) delivered at the three different positions. The responses are shifted according to the stimulus protocol used for the subsequent apparent motion stimuli. Middle: Responses of T4 to apparent motion stimuli in preferred and null direction (thick line = measured response, thin line = linear expectation, i.e. sum of responses to the single light pulses). Right: Nonlinear response component defined as the difference between measured response and linear expectation. The responses are the mean obtained from n = 3 stimulus repetitions. Similar data were obtained in 12 experiments. (b) Dependence of the nonlinear two-step response component on the position within the receptive field of T4 cells. Left: Responses to individual light pulses at the four positions. Middle: Stimulus arrangement. Right: Nonlinear response component. Data represent the mean ± SEM (n = 15 cells in 11 flies). (c) Responses to 2-step apparent motion stimuli as a function of the onset time delay (top: preferred direction, location −1 -> 0; bottom: null direction, location 2 -> 0). Data represent the mean ± SEM (upper: n = 13 cells from 8 flies; lower: n = 7 cells from 7 flies). (d) Average responses to a flicker stimulus of the central neuro-ommatidium (black), to a two-step (red) and a three-step (green) null-direction apparent motion sequence (mean ± SEM, n = 11 T4 cells from eight flies). (e) Mean responses of T4 cells to pulses presented to the central column and simultaneously to one of the 18 surrounding columns. Responses were averaged after alignment to the receptive field center, normalized to the flicker response to the central column and are shown in false color code and as bar plots along the three axes of the hexagonal array (mean ± SEM, n = 10 T4 cells from 8 flies). Abbreviations as in Figure 2.
Figure 4
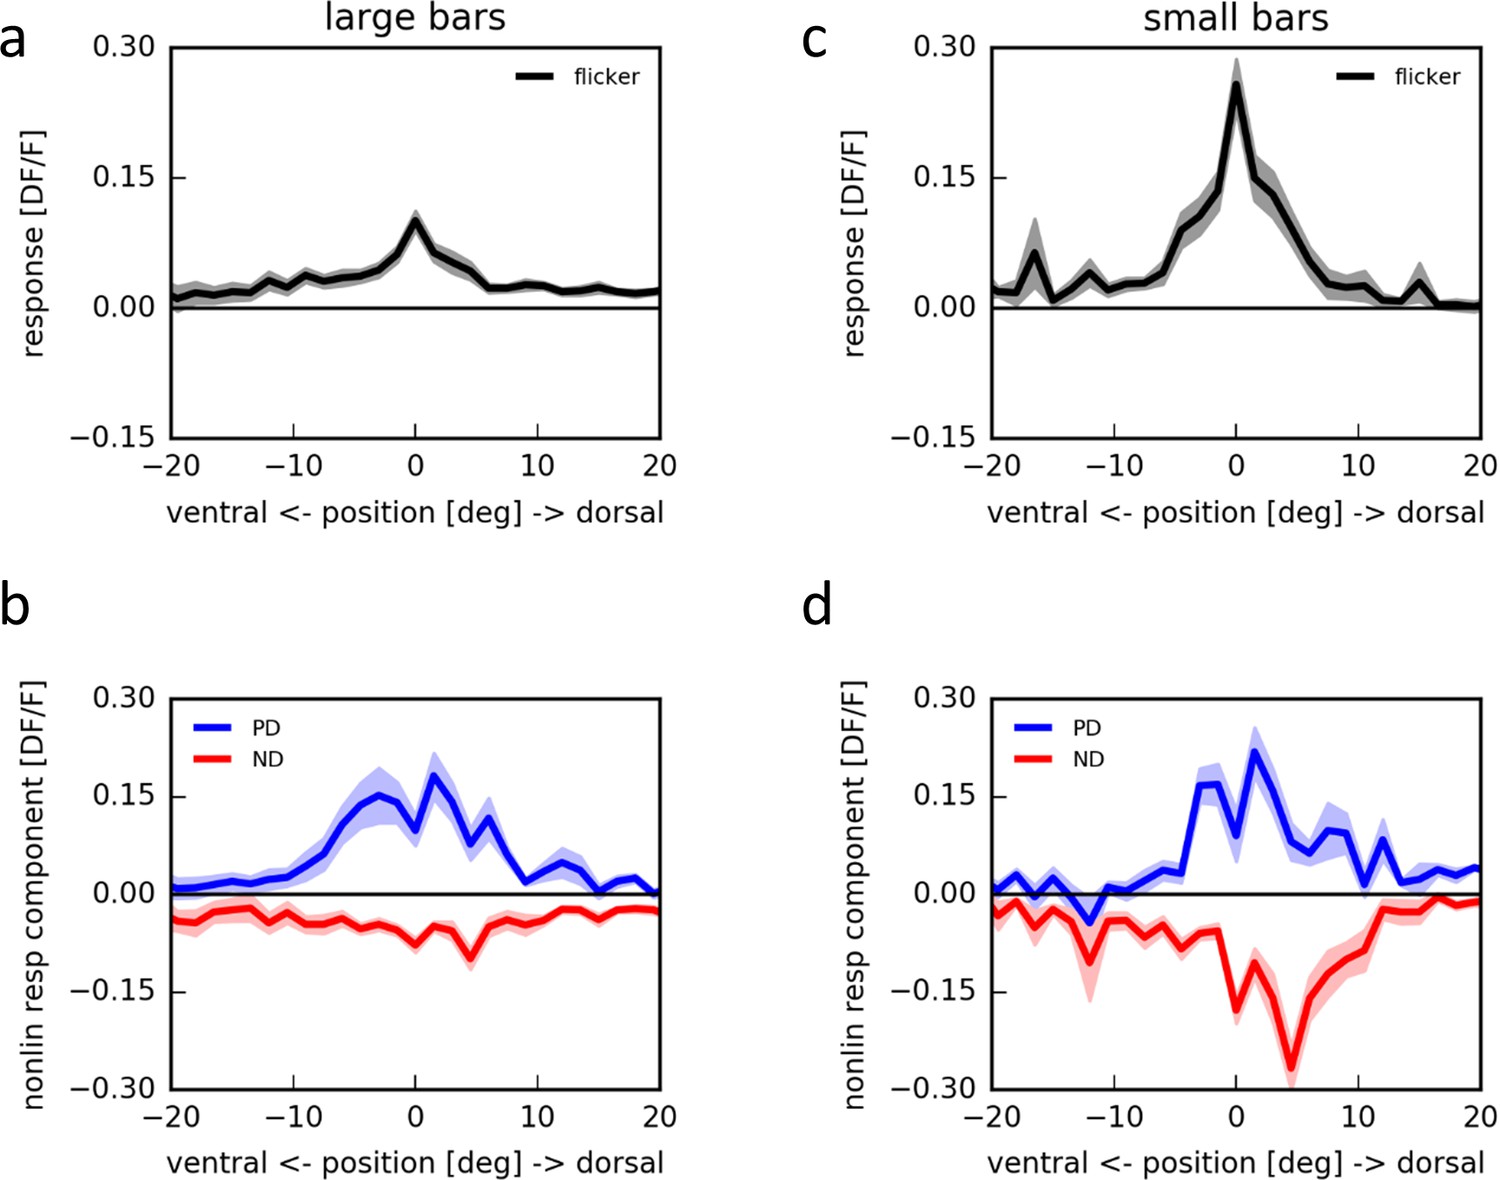
Apparent motion stimulation on a LED arena.
(a) Flicker responses of T4 cells to the presentation of a large horizontal bar (180˚ × 4.5˚) at different elevations on a LED arena, aligned to the elevation evoking the maximum response (n = 17 cells from 5 flies). (b) Corresponding non-linear response components to two-step apparent motion sequences at different elevations on an LED arena in the preferred (blue) and null direction (red). (c,d) as in (a,b) for small horizontal bars (4.5˚ × 3˚) (n = 18 cells from 5 flies).
Figure 5
Computer simulations.
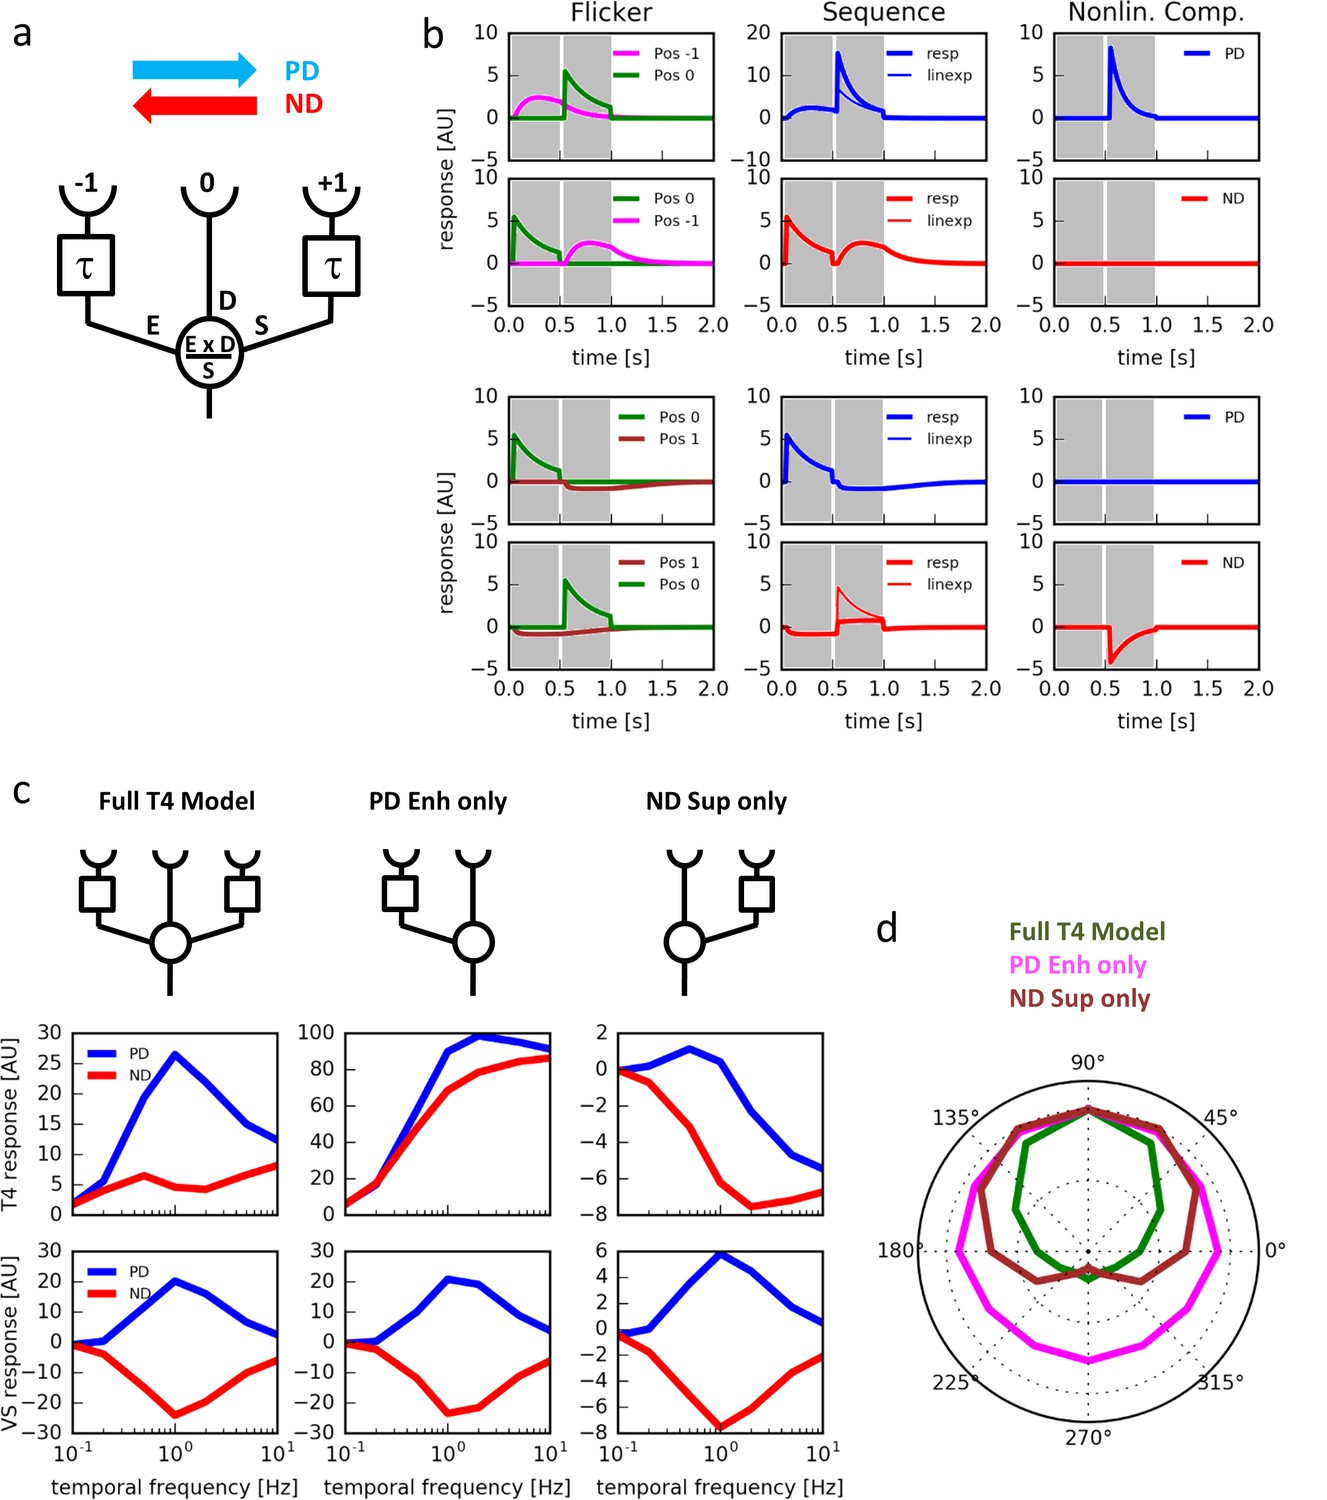
(a) Model T4 cell combining preferred direction enhancement and null direction suppression (compare with Figure 1d). (b) Left: Responses to individual light pulses (‘Flicker’) delivered at the three different positions. The responses are shifted according to the stimulus protocol used for the subsequent apparent motion stimuli. Middle: Responses of the model unit to apparent motion stimuli in preferred and null direction (thick line = measured response, thin line = linear expectation, i.e. sum of responses to the single light pulses). Right: Nonlinear response component defined as the difference between measured response and linear expectation. Preferred direction enhancement occurs only between positions −1 and 0, null direction suppression only between positions 0 and 1. (c) Comparison of three models (top row): a full model, as in (a), implementing preferred direction enhancement and null direction suppression (left), one with preferred direction enhancement only (center) and one with null direction suppression only (right). Temporal frequency tuning of model T4 cells (middle row) and tangential cells (bottom row) using motion of a sine-grating (spatial wavelength = 50°, contrast = 1.0) along the preferred (PD) and null direction (ND), based on those 3 models. (d) Directional tuning of an array of model T4 cells using the motion of a sine-grating (spatial wavelength = 50°, contrast = 1.0, temporal frequency = 1.0) for the same 3 models.
Figure 6
Response properties of T4/T5 neurons.
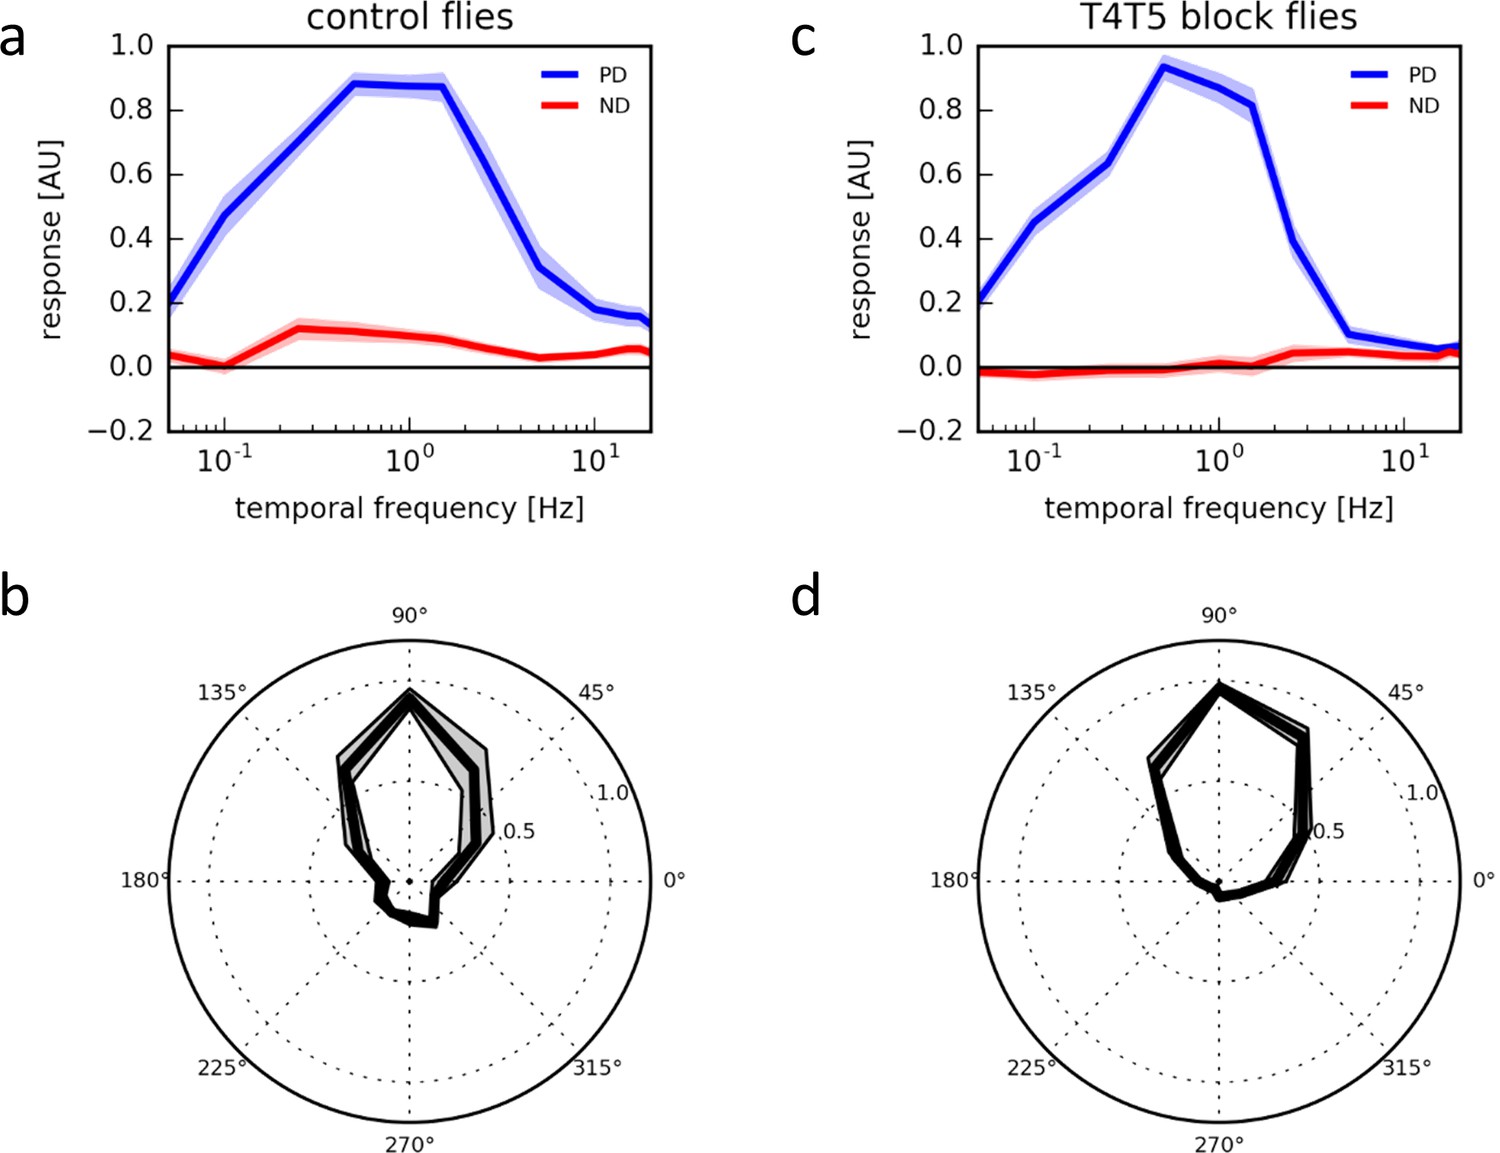
(a) Temporal frequency tuning of T4/T5 cells in control flies showing the normalized ΔF/F responses to square-wave gratings in the preferred (up, blue) and null direction (down, red) (n = 15 flies). (b) Directional tuning of T4/T5 cells to square-wave gratings moving at a temporal frequency of 1 Hz (n = 7). (c,d) Temporal (c, n = 9) and directional tuning (d, n = 9) of T4/T5 cells with their synaptic output blocked by expression of the tetanus toxin light chain. All data represent the mean ± SEM (shaded).
Author response image 1
Additional files
-
Supplementary file 1
Recordings from tangential cells in flies where synaptic output from all T4 and T5 cells was blocked by expression of tetanus toxin (a,c) and in control flies (b,d).
(a,b) Responses of tangential cells of the Vertical System (VS) to square-wave gratings moving in the preferred (blue) and null (red) direction of T4T5 block (A, w-; R59E08-AD / UAS-TNT-E; R42F06-DBD / VT50384-lexA, lexAop-GCaMP6m; n = 5 cells in 3 flies) and control flies (B, w-; R59E08-AD / cyo; R42F06-DBD / VT50384-lexA, lexAop-GCaMP6m; n = 9 cells in 5 flies). (c,d) Directional tuning of the same cells to square-wave gratings moving in 12 different directions. Preferred direction (blue) and null direction (red) responses were averaged over the first second of stimulation. Negative null direction responses were plotted on the opposite polar coordinates. Stimuli were presented on an LED arena (see Materials and methods). Gratings had a spatial wavelength of 24°, a contrast of 1 and moved at 24°/s, i.e. at a temporal frequency of 1 Hz. In all panels, data represent the mean ± SEM.
- https://doi.org/10.7554/eLife.17421.009
Download links
A two-part list of links to download the article, or parts of the article, in various formats.
Downloads (link to download the article as PDF)
Open citations (links to open the citations from this article in various online reference manager services)
Cite this article (links to download the citations from this article in formats compatible with various reference manager tools)
Complementary mechanisms create direction selectivity in the fly
eLife 5:e17421.
https://doi.org/10.7554/eLife.17421


