Co-transcriptional R-loops are the main cause of estrogen-induced DNA damage
- Stanford University School of Medicine, United States
- University of California, Davis, United States
Figures
Figure 1 with 6 supplements
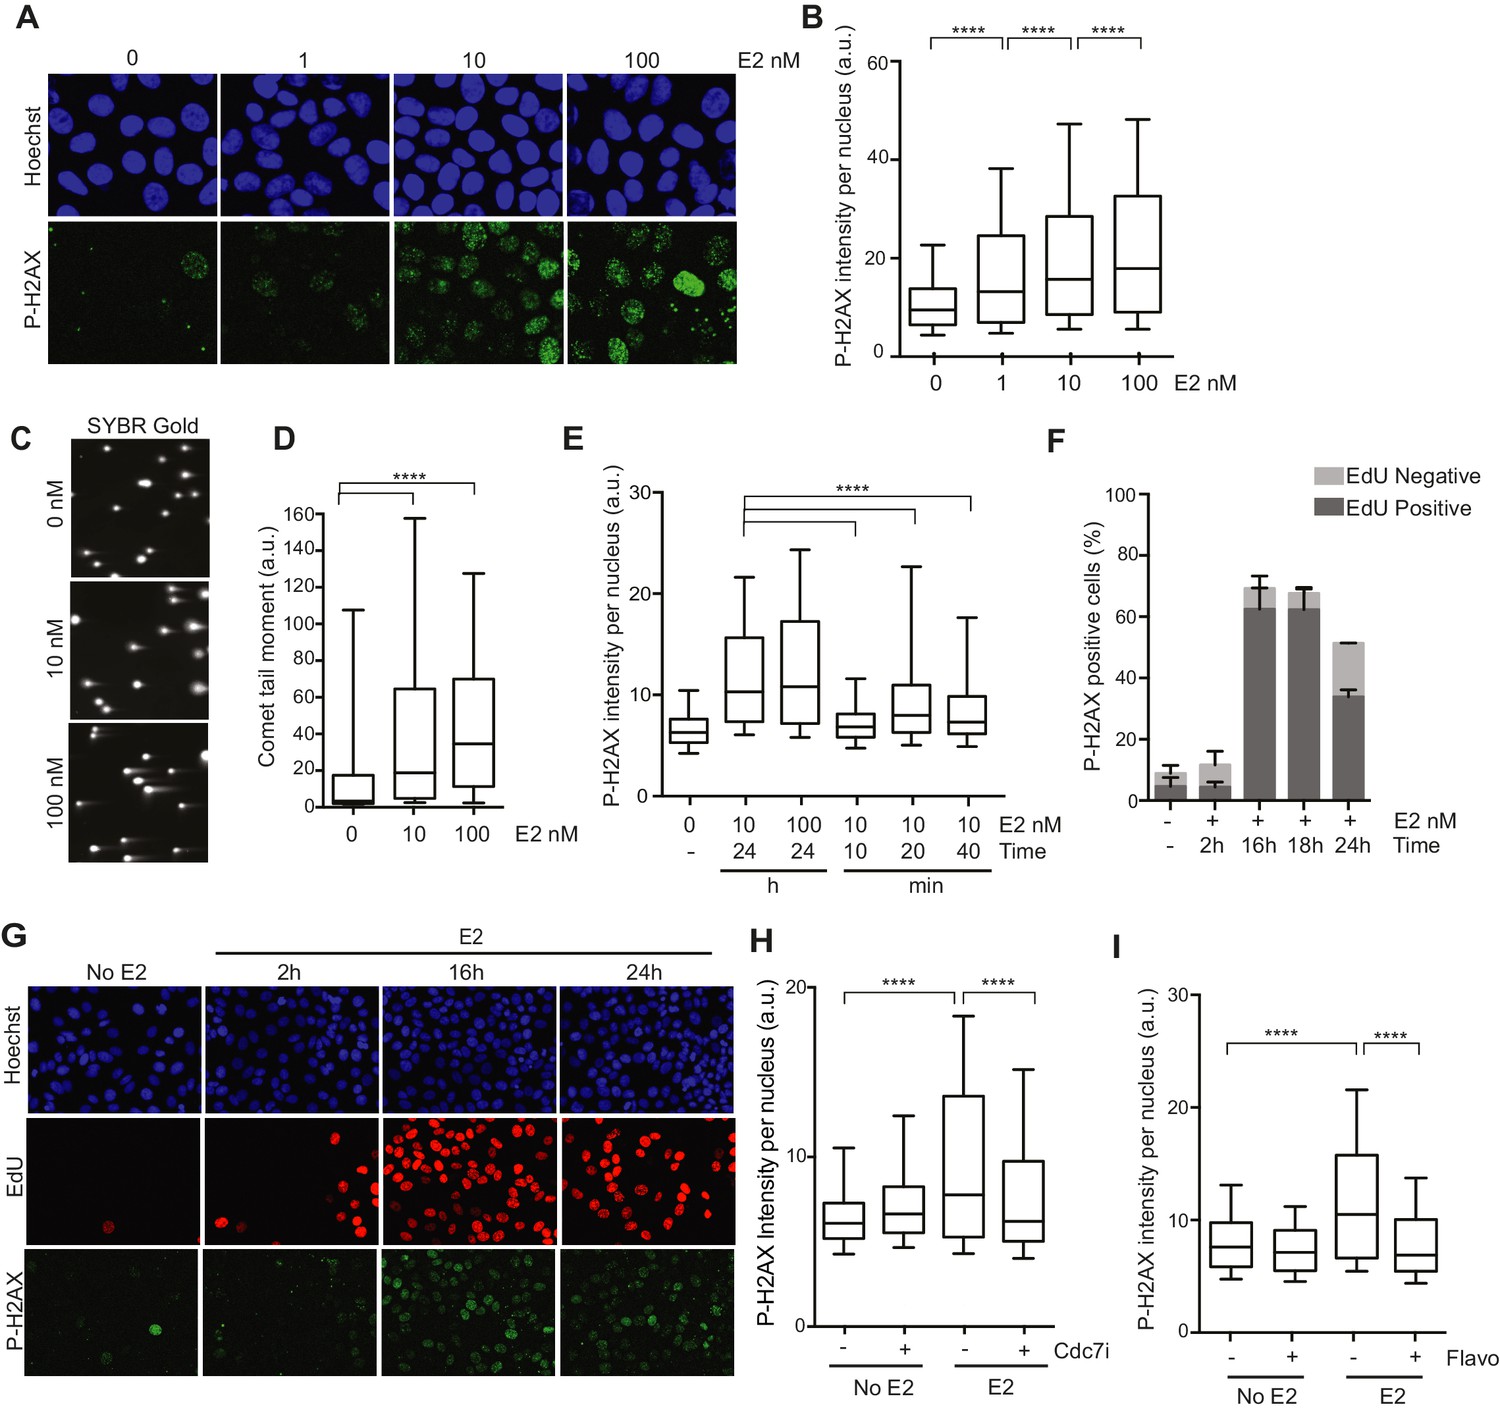
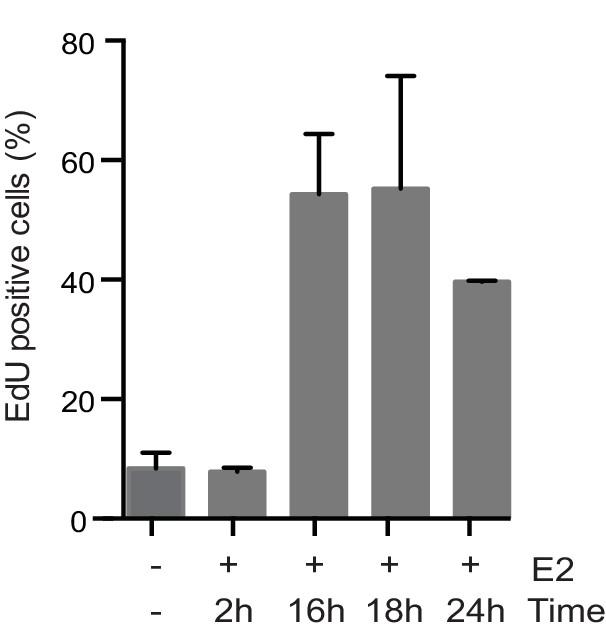
Estrogen induces DNA damage and DSBs in a replication-dependent manner.
(A) Immunostaining for P-H2AX in MCF7 cells treated with 0, 1, 10, or 100 nM E2 for 24 hr. (B) Quantification of P-H2AX immunostaining for data shown in (A), ****p<0.0001. n = 2 biological replicates. (C) Neutral comet assay in MCF7 cells treated with 0, 10, or 100 nM E2 for 24 hr. (D) Quantification of the neutral comet tail moment for data in (C). ****p<0.0001. n = 4 biological replicates. ≥50 comets/condition. (E) Quantification of P-H2AX immunostaining per nucleus in cells treated with 0, 10 or 100 nM E2 for indicated time prior to fixation. min = minutes, h = hours. ****p<0.0001. n = 3 biological replicates. (F) Quantification of the percent of P-H2AX positive cells and EdU staining in cells treated with 0 or 100 nM E2 for the indicated time. Cells were pulsed for 30 min with 10 μM EdU prior to fixation. Error bars represent SD of 2 biological replicates. (G) Immunostaining for EdU and P-H2AX for the experiment described in (F). (H) Quantification of P-H2AX immunostaining per nucleus in cells treated with 0 or 100 nM E2 concurrently with DMSO or 1 μM Cdc7 inhibitor PHA 767491 for 14 hr. Cells were pulsed with 10 μM EdU 30 min prior to fixation. n = 3 biological replicates. (I) Quantification of P-H2AX immunostaining in MCF7 cells treated with 0 or 100 nM E2 for 12 hr prior to the addition of 0.8 μM flavopiridol or DMSO for 2 hr. Cells were pulsed with 10 μM EdU for 30 min prior to harvesting. ****p<0.0001. n = 3 biological replicates. For all graphs: box and whiskers represent 25–75 and 10–90 percentiles, respectively. The line represents the median value. a.u. = arbitrary units. Associated p-values are from non-parametric Mann-Whitney rank sum t-test. >1000 cells/condition unless noted.
Figure 1—figure supplement 1
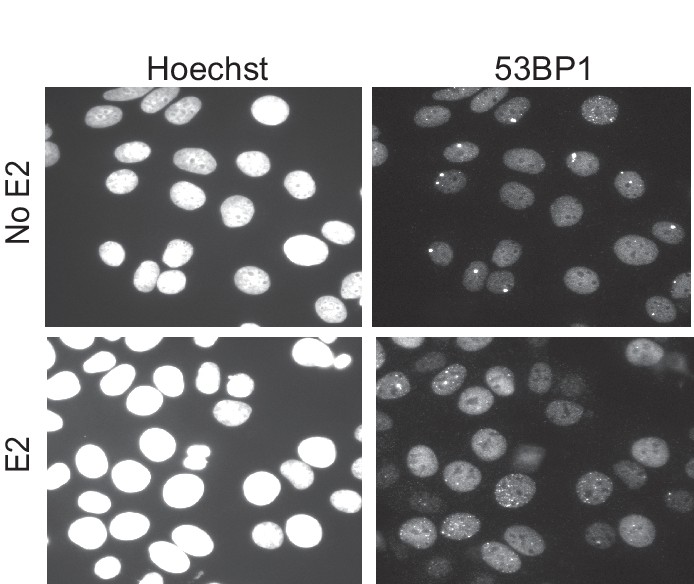
Immunostaining for 53BP1 in MCF7 cells either treated with 0 or 100 nM E2 for 24 hr.
Nuclei stained with Hoechst.
Figure 1—figure supplement 2
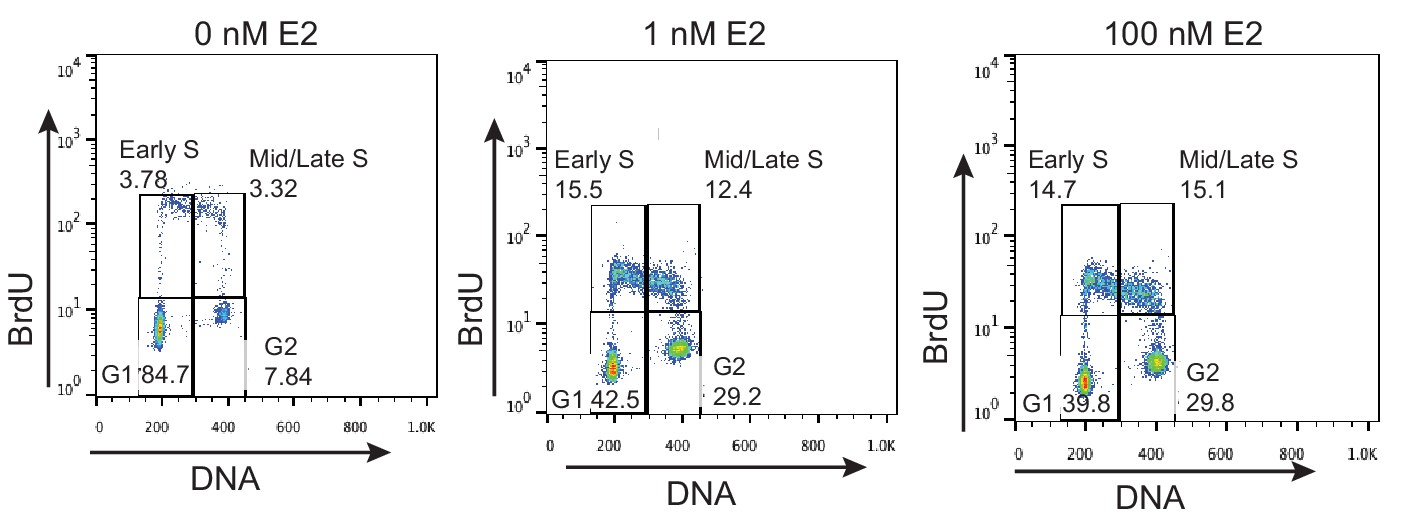
FACS profiles of MCF7 cells treated with 0 nM E2, 1 nM E2, or 100 nM E2 for 24 hr.
Cells were pulsed with 25 μM BrdU for 30 min prior to fixation. DNA content is marked by propidium iodide (x-axis) and BrdU incorporation is shown on the y-axis. The percentage of cells in each of the four cell-cycle quadrants is shown.
Figure 1—figure supplement 3
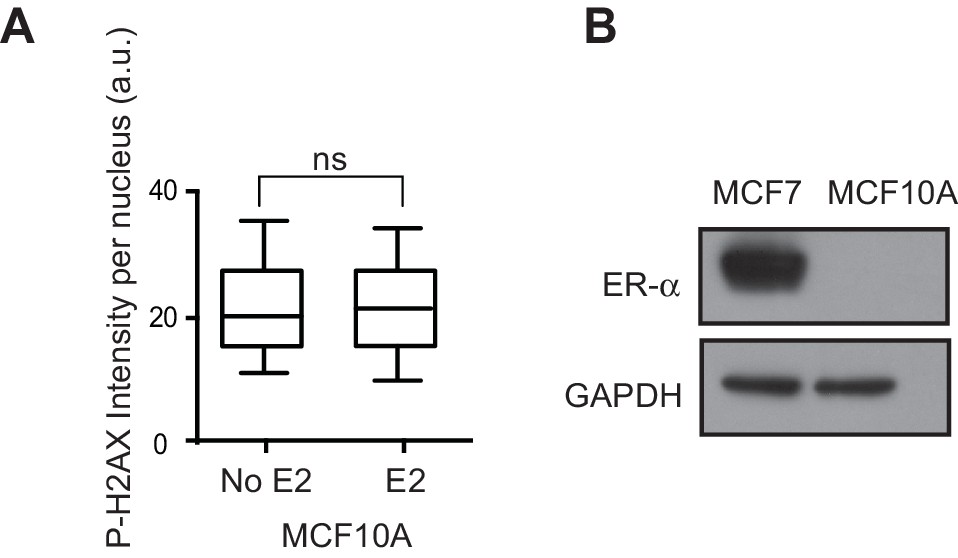
Effect of E2 on MCF10A cells.
(A) Quantification of P-H2AX immunostaining in MCF10A cells treated with 0 or 100 nM E2 for 24 hr. ns = not significant (non-parametric Mann-Whitney rank sum t-test). n = 3 biological replicates. >250 cells/condition. a.u. = arbitrary units. (B) Western blot for ER-α in MCF10A and MCF7 cells.
Figure 1—figure supplement 4
Quantification of the percent of cells positive for EdU incorporation after treatment with 0 or 100 nM E2 for the indicated length of time and then pulsed with 10 μM EdU for 30 min prior to fixation.
h = hours. Errors bars represent SD of 2 biological replicates.
Figure 1—figure supplement 5

Effects of PHA 767491 on EdU incorporation and Ser2 phosphorylation of RNA Pol II in MCF7 cells.
(A) Quantification of the percent of cells positive for EdU incorporation for cells treated with 0 or 100 nM E2 concurrently with DMSO or 1 μM Cdc7 inhibitor PHA 767491 for 14 hrs. Cells were pulsed with EdU 30 min prior to fixation. Errors bars represent the SD of 3 biological replicates. (B) Western blot of Ser2 CTD phosphorylation (pSer2) of RNA Pol II in MCF7 cells treated with 100 nM E2 concurrently with either control,1 μM Cdc7 inhibitor PHA 767491 for 14 hr, or 0.8 μM flavopiridol for 2 hrs.
Figure 1—figure supplement 6

Quantification of the percent of cells positive for EdU incorporation for cells treated with 0 or 100 nM E2 for 12 hr prior to the addition of 0.8 μM flavopiridol or DMSO for 2 hr.
Cells were pulsed with 10 μm EdU for 30 min prior to harvesting. Error bars represent the SD of 3 biological replicates.
Figure 2 with 2 supplements
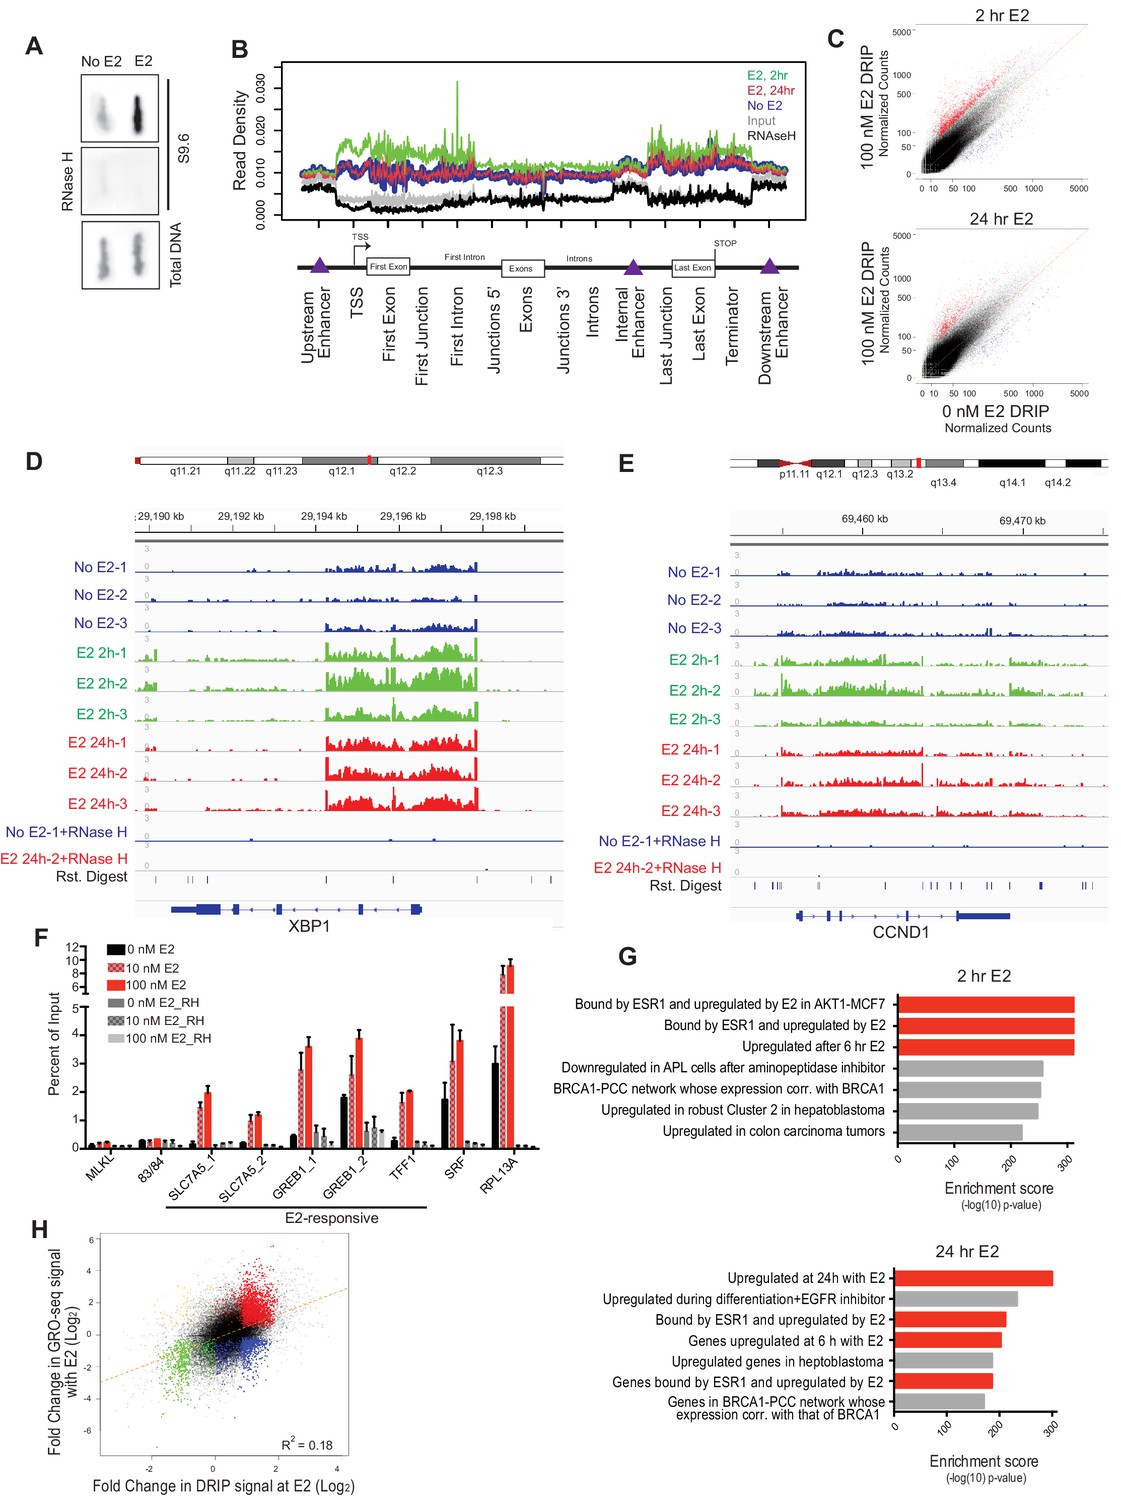
Estrogen induces robust R-loop formation at E2-responsive genes.
(A) Slot blot to detect global RNA-DNA hybrids with S9.6 antibody in MCF7 cells treated with 0 or 100 nM E2 for 24 hr. Total denatured DNA is stained with a single-strand DNA antibody. RNase H was added as indicated. (B) Meta-gene analysis for indicated DRIP signal over indicated genomic features. Data are shown for DRIP-seq biological replicate # 3. An enrichment is seen in all data sets but relative read density at these sites varies between replicates. (C) DRIP-seq read counts normalized for total mapped reads from DRIP in 0 nM E2 conditions vs DRIP from cells treated with 100 nm E2 for 2 hr (top) or 24 hr (bottom). Graphs are from 3 biological experiments. Black dots indicate DRIP peaks and red dots indicate induced DRIP peaks relative to 0 nM E2. (D) Integrated Genome Viewer (IGV) display of DRIP-seq enrichment at XBP1. Scale = million mapped reads. RNase H was performed prior to DRIP-seq on one replicate each from 0 nM E2 and 100 nM E2 24 hr. Independent replicates are shown as 1–3. (E) IGV display of CCND1 (Cyclin D1), as described in (D). (F) DRIP-qPCR validation. Cells were treated with 0, 10, or 100 nM E2 for 24 hr and harvested for DRIP. MLKL and 83/84 are negative controls. Error bars represent S.E.M. of 2 biological experiments. RNase H treatment was performed for 24 hr prior to DRIP-qPCR where indicated. (G) Functional signatures by GREAT of E2-induced DRIP peaks found to be differentially induced in 100 nM E2, 2 hr (top) or 100 nM E2 24 hr (bottom) than in 0 nM E2 treated cells. The 7 highest enrichment scores are shown, with red highlighting E2-associated signatures. (H) Fold change in DRIP signal after 2 hr of 100 nM E2 relative to 0 nM E2 (x-axis) vs. fold change in GRO-seq signal after 160 min of 100 nM E2 relative to 0 nM E2 (y-axis). E2-induced DRIP peaks that show a positive (red) or negative (blue) fold change in GRO-seq upon E2 stimulation are highlighted. Negative changes in DRIP upon E2 that correspond to a positive (yellow) or negative (green) fold change in GRO-seq are also shown. GRO-seq data from (Hah et al., 2011).
-
Figure 2—source data 1
Genomic coordinates for DRIP peaks identified as induced in MCF7 cells treated with 100 nM E2 for 2 hrs relative to MCF7 cells treated with 0 nM E2.
- https://doi.org/10.7554/eLife.17548.011
-
Figure 2—source data 2
Genomic coordinates for DRIP peaks identified as induced in MCF7 cells treated with 100 nM E2 for 24 hrs relative to MCF7 cells treated with 0 nM E2.
- https://doi.org/10.7554/eLife.17548.012
Figure 2—figure supplement 1

R-loops are induced with E2 prior to S phase and exhibit R-loop features.
(A) Average read count in input (x-axis) versus S9.6 immunoprecipitation (y-axis) in MCF7 cells treated with 0 nM E2 (left), 100 nM E2 for 24 hr (middle) or 100 nM E2 for 2 hr (right). Black dots above the diagonal represent DRIP peaks above input. Red dots correspond to E2-induced peaks. (B) RNase H treatment. Read per kilobase per million (RPKM) plots of DRIP peaks in 0 nM E2 versus DRIP peaks from 0 nM E2 sample treated with RNase H prior to IP (left) and of DRIP peaks from cells treated with 100 nM E2 for 24 hr versus DRIP peaks from cells treated with RNase H after 100 nM E2 for 24 hr (right). Red dots show identified E2-induced DRIP peaks and their sensitivity to RNase H. (C) GC skew density in DRIP peaks. The strongest 3000 DRIP peaks from each indicated samples are shown. GC skew obtained from Ginno et al., 2012. (D) G-quartet density in DRIP peaks. The strongest 3000 DRIP peaks from each indicated samples are shown. G-quartet data obtained from Chambers et al., 2015. (E) IGV display of DRIP-seq enrichment at SLC7A5. Scale = million mapped reads. An RNase H control was performed prior to DRIP-seq from 0 or 100 nM E2-treated cells for 24 hrs. Biological replicates are shown as 1–3. (F) FACS profiles of MCF7 cells treated with 0 nM E2 (left), or 100 nM E2 for 2 hr (middle) or 24 hrs (right). Cells were pulsed with 25 μM BrdU prior to fixation. DNA content is marked by propidium iodide (x-axis) and BrdU incorporation is shown on the y-axis. The percentage of cells in each of the four cell-cycle quadrants is shown.
-
Figure 2—figure supplement 1—source data 1
Genomic coordinates for all identified DRIP peaks from MCF7 cells treated with 0 nM E2.
- https://doi.org/10.7554/eLife.17548.014
-
Figure 2—figure supplement 1—source data 2
Genomic coordinates for all identified DRIP peaks from MCF7 cells treated with 100 nM E2 for 2 hrs.
- https://doi.org/10.7554/eLife.17548.015
-
Figure 2—figure supplement 1—source data 3
Genomic coordinates for all identified DRIP peaks from MCF7 cells treated with 100 nM E2 for 24 hr.
- https://doi.org/10.7554/eLife.17548.016
Figure 2—figure supplement 2

Sequence features and expression analysis associated with DRIP-seq.
(A) GC skew density in E2-induced DRIP peaks that show a positive (red) or negative (blue) change in GRO-seq upon E2. (B) G-quartet density in E2-induced DRIP peaks that show a positive (red) or negative (blue) change in GRO-seq upon E2. Error bands for (A,B) represent the 1st and 3rd quartile from 1000x bootstrap. (C) DRIP peak strength compared to expression level for DRIP performed with 0 nM E2 (left) and 100 nM E2 for 2 hr (middle) or 100 nM E2 for 24 hr (right). Expression levels in non-E2 treated or E2-treated cells for similar time periods obtained from publically available RNA-seq (Honkela et al., 2015).
Figure 3 with 3 supplements
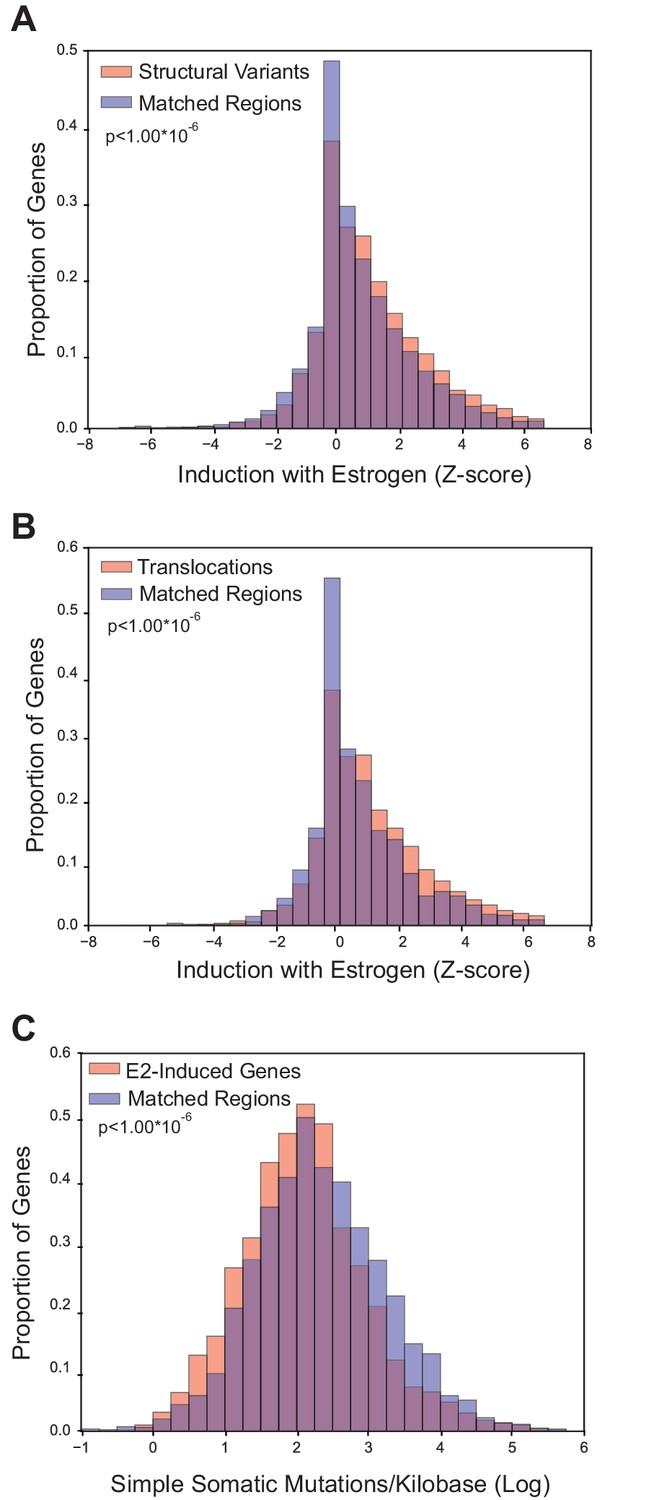
Breast cancer rearrangements are enriched in E2-responsive genes.
(A) Histogram of E2-induced expression changes (Z-score) for genes that overlap with breast cancer structural variants (red bars) compared to the distribution of E2-induced expression changes (Z-score) for a control gene set (blue bars), matched for expression level and replicating timing. Genes with structural variants are enriched in E2-responsive genes. p<1.00*10−6. (B) Histogram of E2-induced expression changes (Z-score) for genes with breast cancer translocations (red bars) compared to a control gene set (blue bars), as described in (A). Genes with translocations are enriched in E2-responsive genes p<1.00*10−6. (C) Histogram of enrichment of breast cancer simple somatic mutations in E2-responsive genes. Data plotted as the log transformation of simple somatic mutations per kilobase for E2-induced genes (red bars) relative to a matched set (blue bars), as described previously. E2-responsive genes have fewer simple somatic mutations than the control gene set (p<1.00*10–6). In A–C, p-values represent two-tailed bootstrap of medians. All breast cancer mutation data from (Nik-Zainal et al., 2016).
Figure 3—figure supplement 1
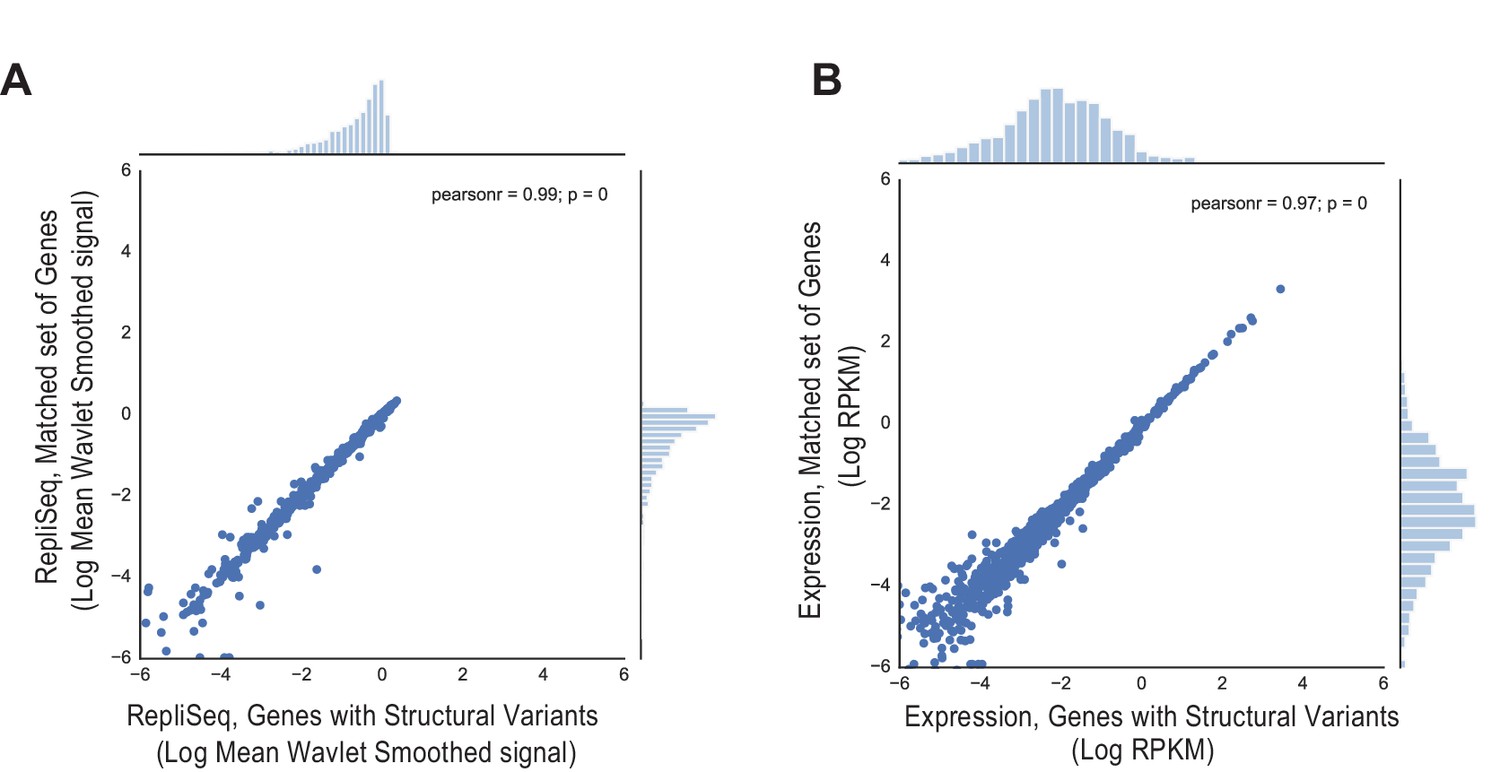
Comparison of (A) Replication timing based on RepliSeq signal across the gene body of regions containing structural variants in breast cancer (x-axis) relative to that of the matched regions (y-axis), and (B) Mean expression level based on RNA-seq of regions associated with structural variants (x-axis) relative to that of the matched regions (y-axis).
https://doi.org/10.7554/eLife.17548.019
Figure 3—figure supplement 2
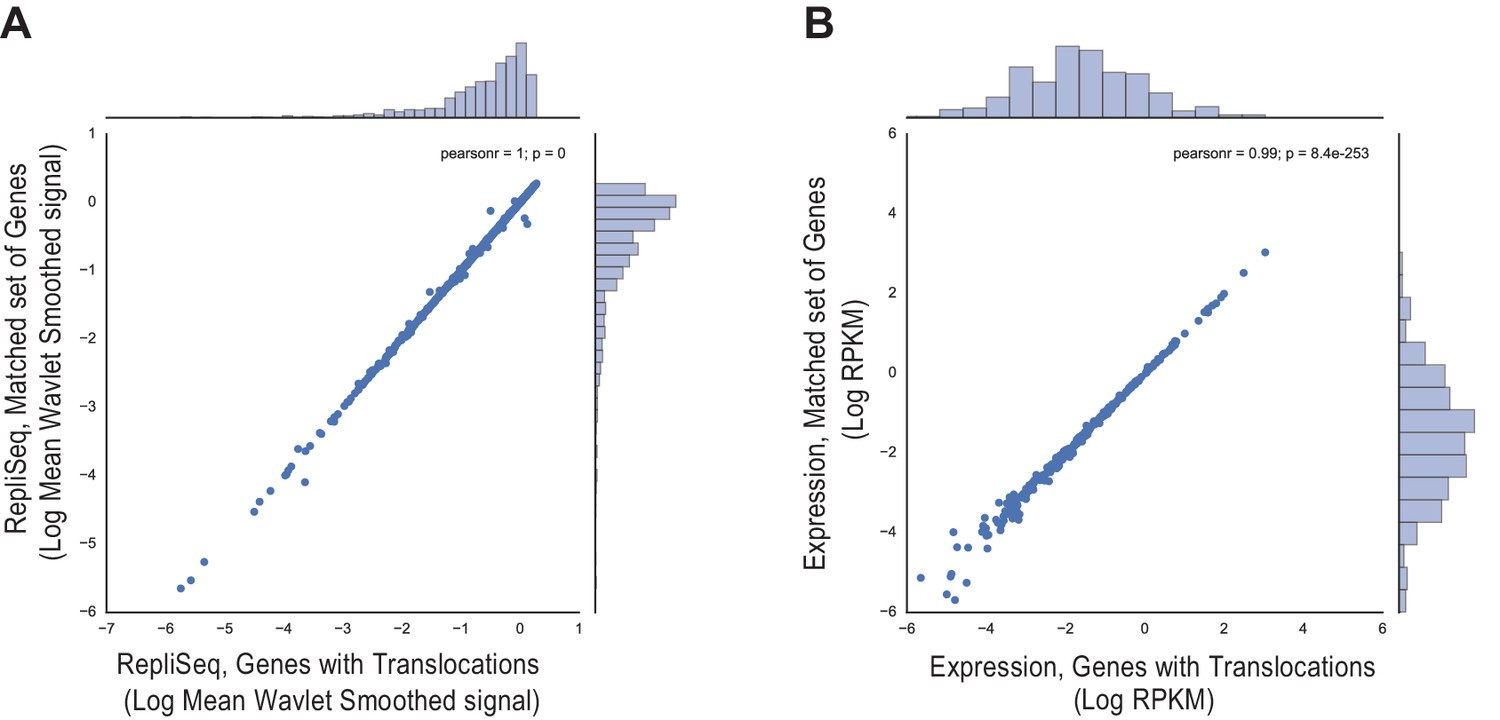
Comparison of (A) Replication timing based on RepliSeq signal across the gene body of translocated regions (x-axis) relative to that of the matched regions (y-axis), and (B) Mean expression level based on RNA-seq of translocations (x-axis) relative to that of the matched regions (y-axis).
https://doi.org/10.7554/eLife.17548.020
Figure 3—figure supplement 3
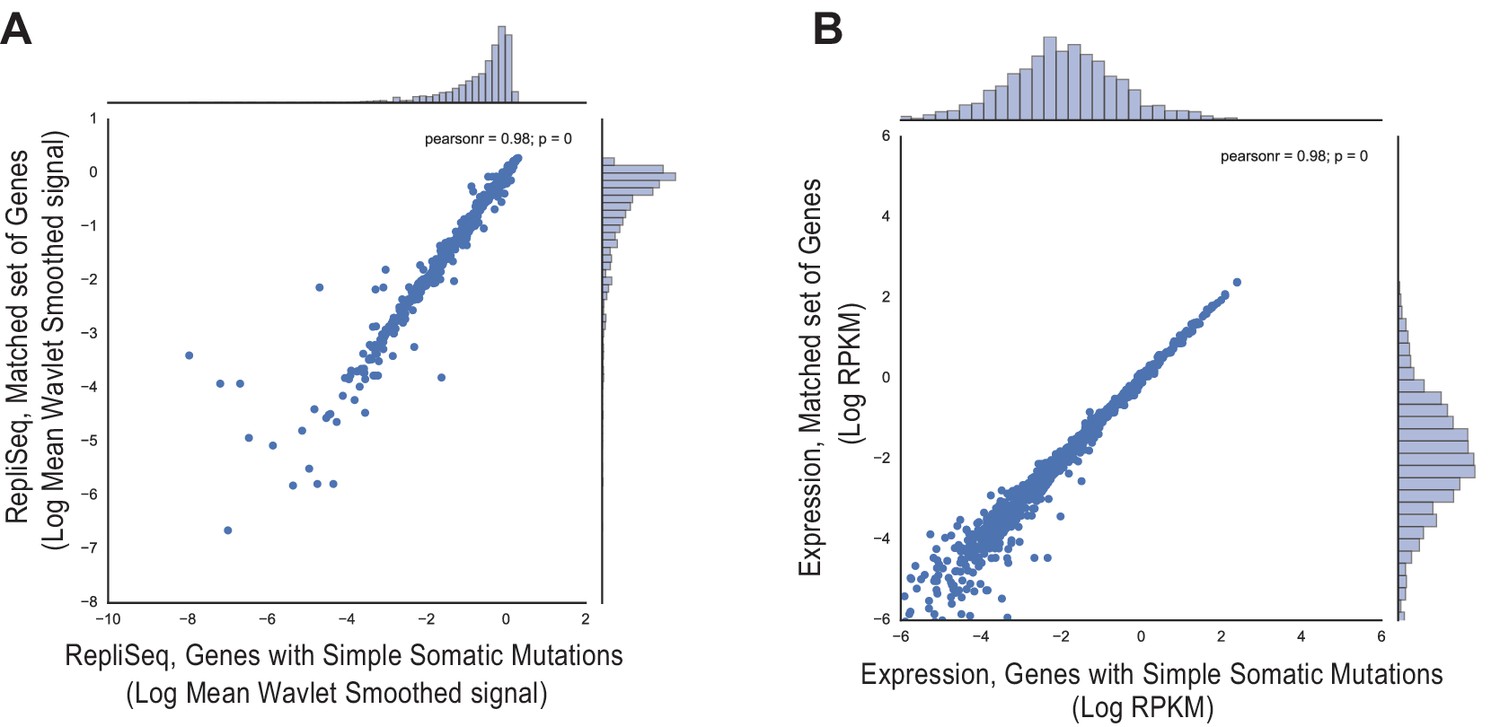
Comparison of (A) Replication timing based on RepliSeq signal across the gene body of genes with simple somatic mutations (x-axis) relative to that of the matched regions (y-axis), and (B) Mean expression level based on RNA-seq of genes with simple somatic mutations (x-axis) relative to that of the matched regions (y-axis).
https://doi.org/10.7554/eLife.17548.021
Figure 4 with 4 supplements
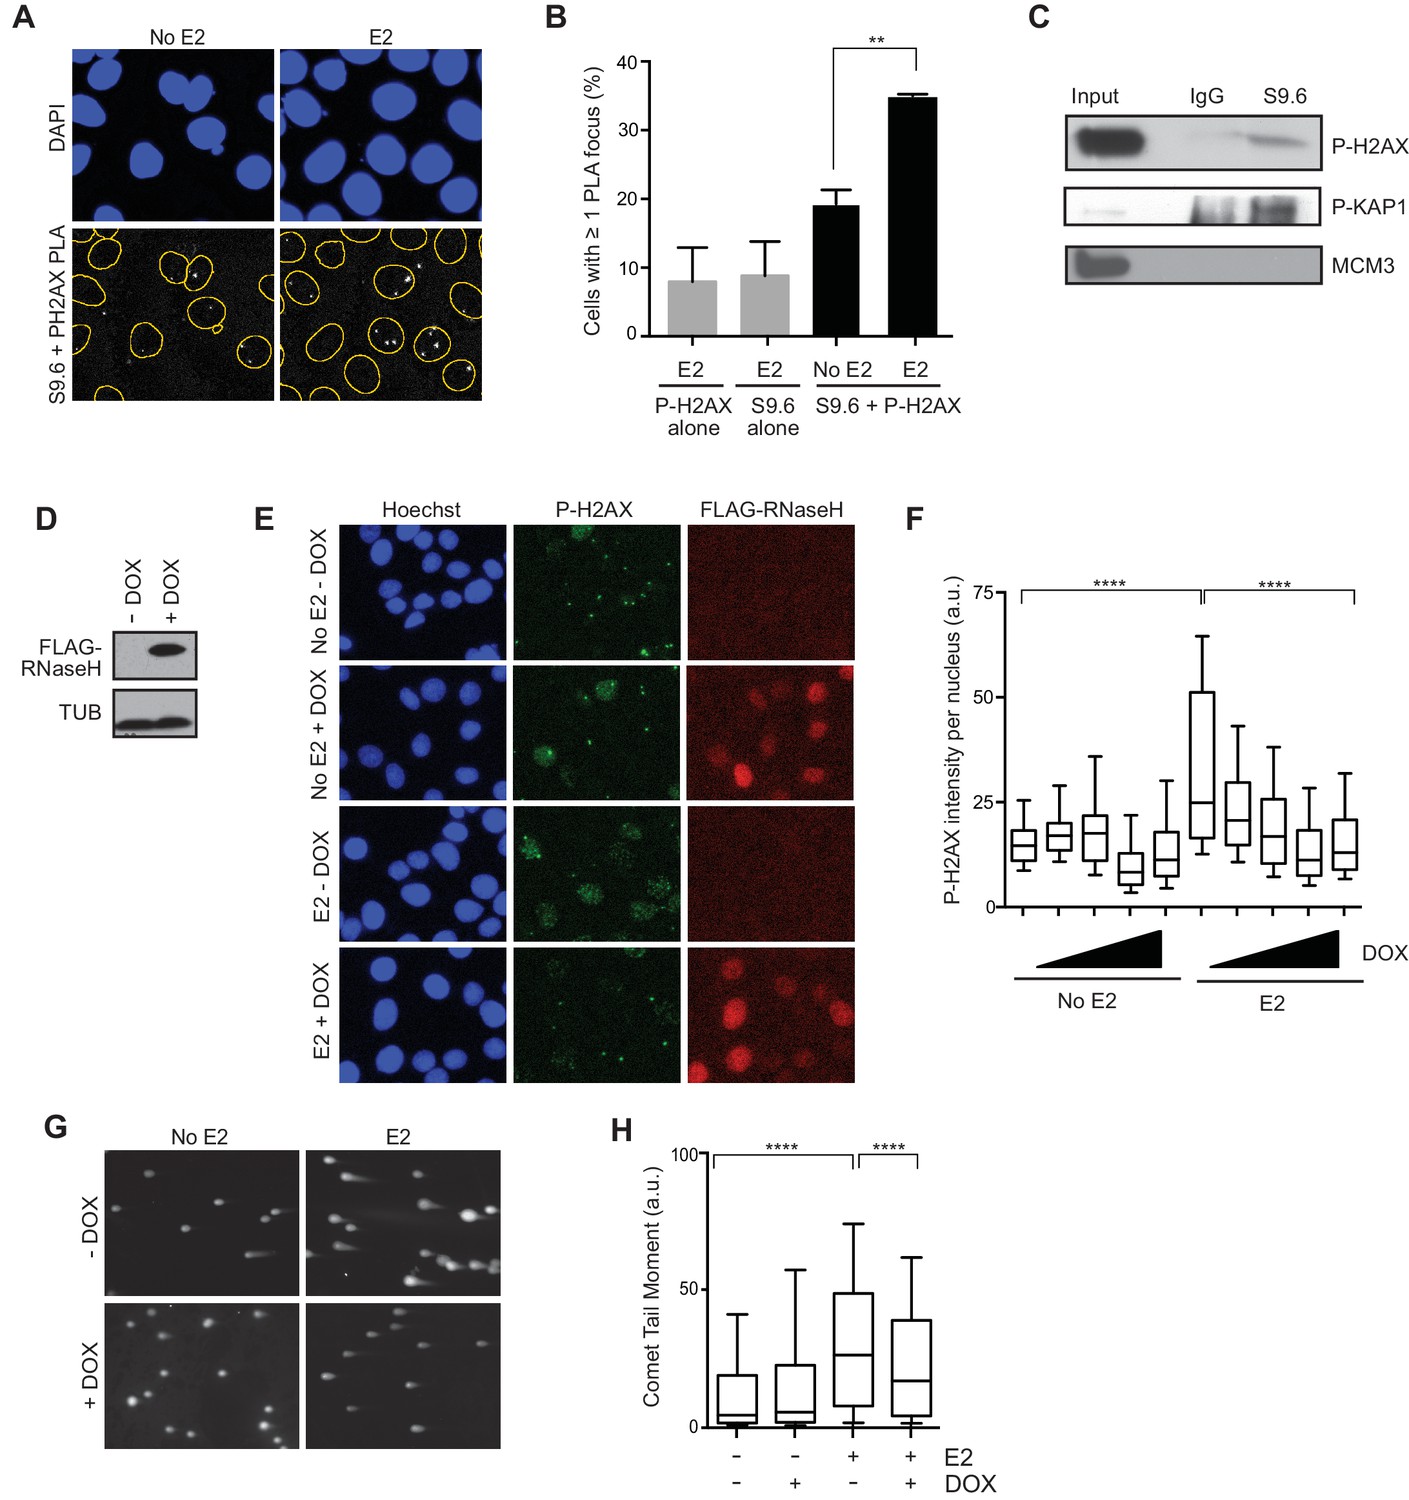
E2-induced R-loops occur on chromatin marked by DNA damage and RNase H reduces E2-induced DSBs.
(A) Proximity ligation assay between S9.6 antibody and P-H2AX antibody in cells treated either with 0 or 100 nM E2 for 24 hr. (B) Quantification of the percentage of cells with ≥ 1 PLA focus per nucleus. Single-antibody controls from cells treated with 100 nM E2 for 24 hr are shown. Error bars represent the SEM from 4 biological replicates. **p<0.01 (Student’s t-test). (C) P-H2AX and P-KAP1 levels from co-IP of S9.6 or IgG from cross-linked and sonicated cells treated with 100 nM E2 for 24 hr. Input is 60% of the IP. (D) Western blot with Flag antibody in MCF7 tetOn-RH cells. 1000 ng/mL doxycycline (DOX) was added for 48 hrs where indicated. (E) Immunostaining for P-H2AX and FLAG in MCF7 tetON-RH cells treated with increasing concentrations of DOX (100, 250, 500 1000 ng/mL) for 24 hrs prior to the addition of either 0 or 100 nM E2 for 24 hr. (F) Quantification of P-H2AX intensity for the experiment described in (E), where the triangle indicates increasing concentrations of DOX. ****p<0.0001 (non-parametric Mann-Whitney rank sum t-test). n = 3 biological replicates. >1000 cells/condition quantified. (G) Neutral comet assay in MCF7-tetOn-RH cells treated with or without 1000 ng/mL DOX for 24 hrs prior to 0 nM E2 or 100 nM for 24 hr. (H) Quantification of the neutral comet tail moment described in (G). **p<0.01 (non-parametric Mann-Whitney rank sum t-test). n = 3 biological replicates. >100 comets/condition. a.u. = arbitrary units.
Figure 4—figure supplement 1
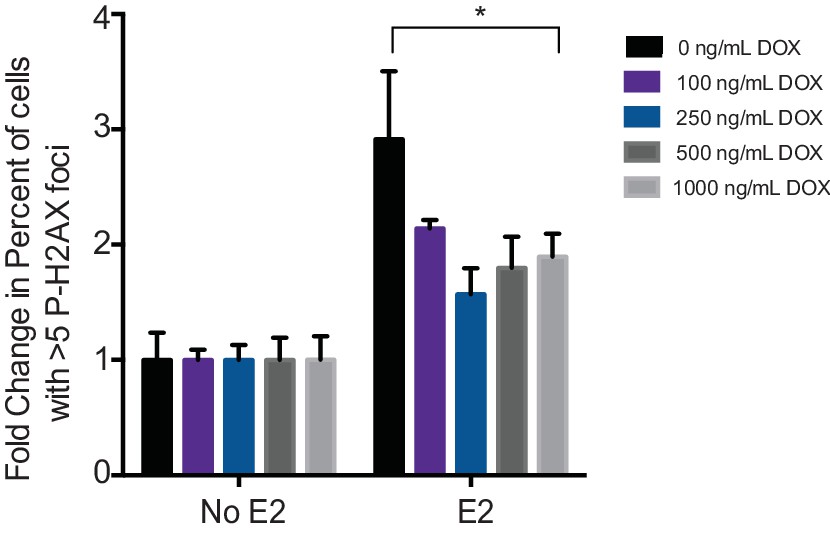
Quantification of the fold change in the percent of cells with >5 P-H2AX foci per cell in MCF7-tetON-RH cells treated with indicated concentrations of DOX. *p<0.05.
Error bars represent SD of 3 technical replicates.
Figure 4—figure supplement 2

Expression of RNase H prevents E2-induced DNA damage.
(A) Quantification of P-H2AX intensity per nucleus in MCF7 tetON-RH clone 6 (left) or MCF7 tetON-RH clone 8 (right) treated with 0 or 1000 ng/mL DOX for 24 hr prior to the addition of 0 nM or 100 nM E2 for 24 hr. ****p<0.0001 (non-parametric Mann-Whitney rank sum t-test). n = 3 technical replicates. >500 cells/condition. (B) Western blot with Flag antibody in MCF7 tetOn-RH cells, clones 6 and 8. DOX was added at 1000 ng/mL MCF7 tetOn-RH cells for 48 hr.
Figure 4—figure supplement 3
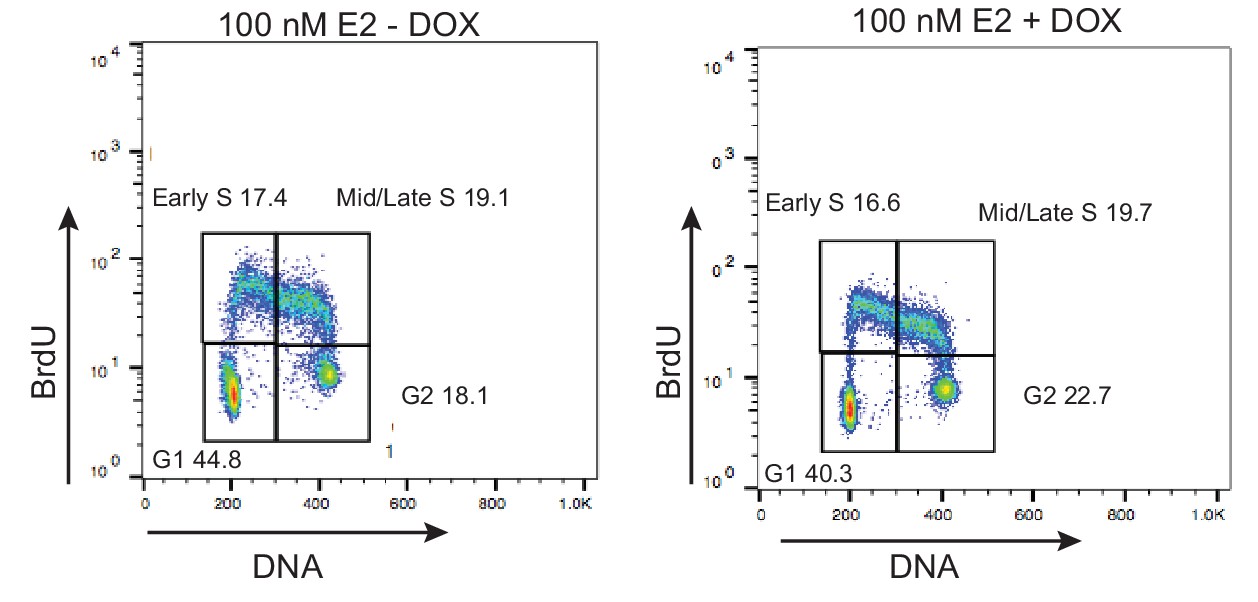
FACS profiles of MCF7 tetON-RH cells treated with or without 1000 ng/mL DOX for 24 hr prior to the addition of 100 nM E2 for 24 hr.
Cells were pulsed with 25 μM BrdU for 30 min prior to fixation. DNA content is marked by propidium iodide (x-axis) and BrdU incorporation is shown on the y-axis. The percentage of cells in each of the four cell-cycle quadrants is shown.
Figure 4—figure supplement 4
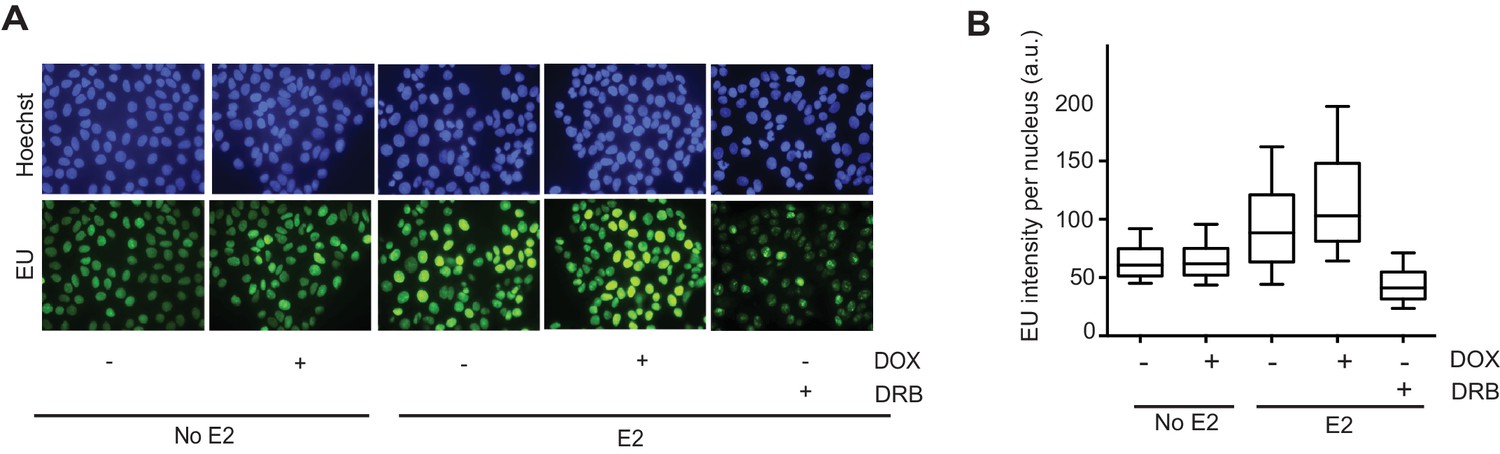
EU incorporation following RNase H expression in MCF7 cells.
(A) EU staining in MCF7 tetON-RH cells either treated with or without 1000 ng/mL DOX for 24 hr prior to the addition of 0 or 100 nM E2 for 24 hr (48 hr DOX total). 100 μM DRB was added for 2 hr. Cells were pulsed with 100 μM EU for 30 min before fixation. Hoechst is used to stain the nucleus. (B) Quantification of EU staining for the experiment described in (A). n = 2 biological replicates. >200 cells/condition. a.u. = arbitrary units.
Figure 5 with 1 supplement
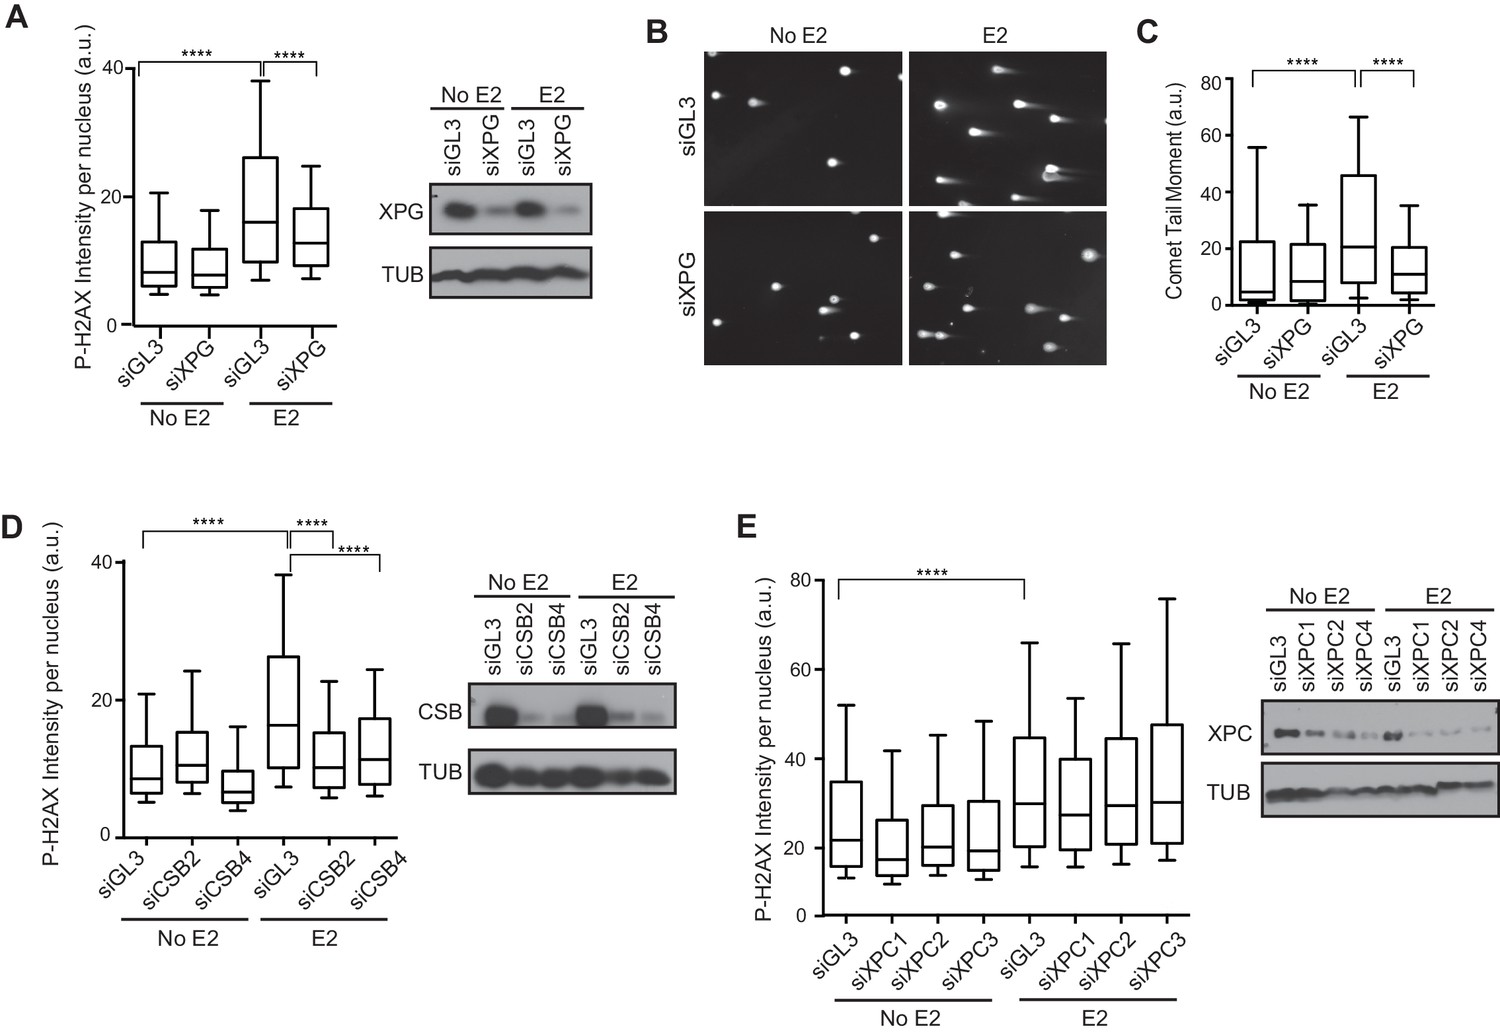
Knockdown of NER and R-loop processing factors reduces E2-induced DNA damage and DSBs.
(A) P-H2AX intensity based on immunostaining of MCF7 cells transfected with indicated siRNA 64 hrprior to the addition of 0 or 100 nM E2 for 24 hr. ****p<0.0001. Western blot shows the level of XPG. (B) Neutral comet assay in cells transfected with indicated siRNA 64 hr prior to the addition of 0 or 100 nM E2 for 24 hr. (C) Quantification of neutral comet tail moment described in (B). ****p<0.0001. >100 comets/condition. (D, E) P-H2AX intensity based on immunostaining in MCF7 cells treated as in (A) with the indicated siRNA. ****p<0.0001. Western blot shows the level of CSB or XPC. The siGL3 control in the quantification shown in (D) is the same as shown in (A). a.u. = arbitrary units. For all data, associated p-values are from non-parametric Mann-Whitney rank sum t-test. n=3 biological replicates. Quantification from >1000 cells/condition unless noted.
Figure 5—figure supplement 1
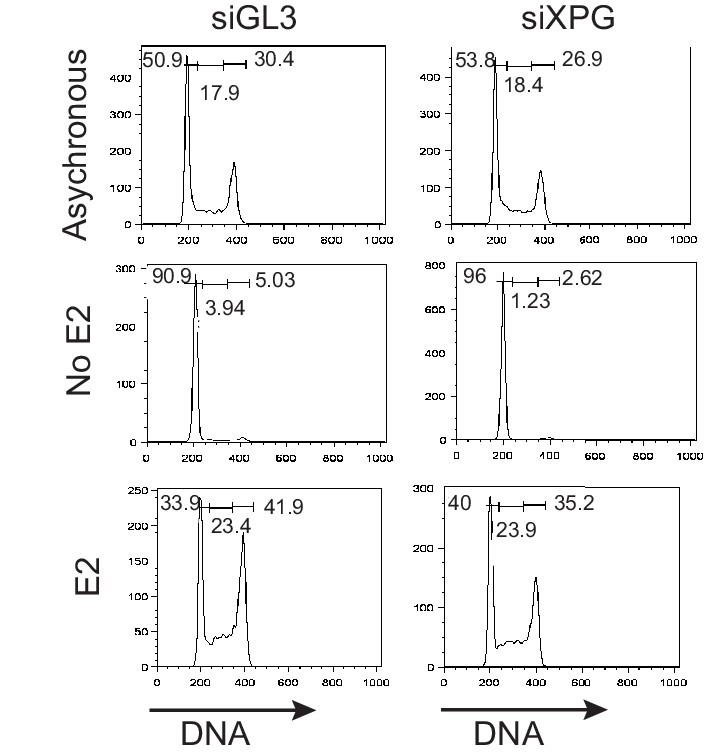
XPG knockdown does not alter E2-induced cell cycle progression.
(A) FACS profiles of MCF7 cells transfected with siXPG or siGL3 and grown for 64 hr prior to the addition of 0 or 100 nM E2 for 24 hr, with DNA content marked by propidium iodide (x-axis), and cell content shown on the y-axis.
Additional files
-
Supplementary file 1
DRIP-qPCR primers.
- https://doi.org/10.7554/eLife.17548.029
Download links
A two-part list of links to download the article, or parts of the article, in various formats.
Downloads (link to download the article as PDF)
Open citations (links to open the citations from this article in various online reference manager services)
Cite this article (links to download the citations from this article in formats compatible with various reference manager tools)
Co-transcriptional R-loops are the main cause of estrogen-induced DNA damage
eLife 5:e17548.
https://doi.org/10.7554/eLife.17548


