Prostaglandin signaling regulates nephron segment patterning of renal progenitors during zebrafish kidney development
- University of Notre Dame, United States
Figures
Figure 1
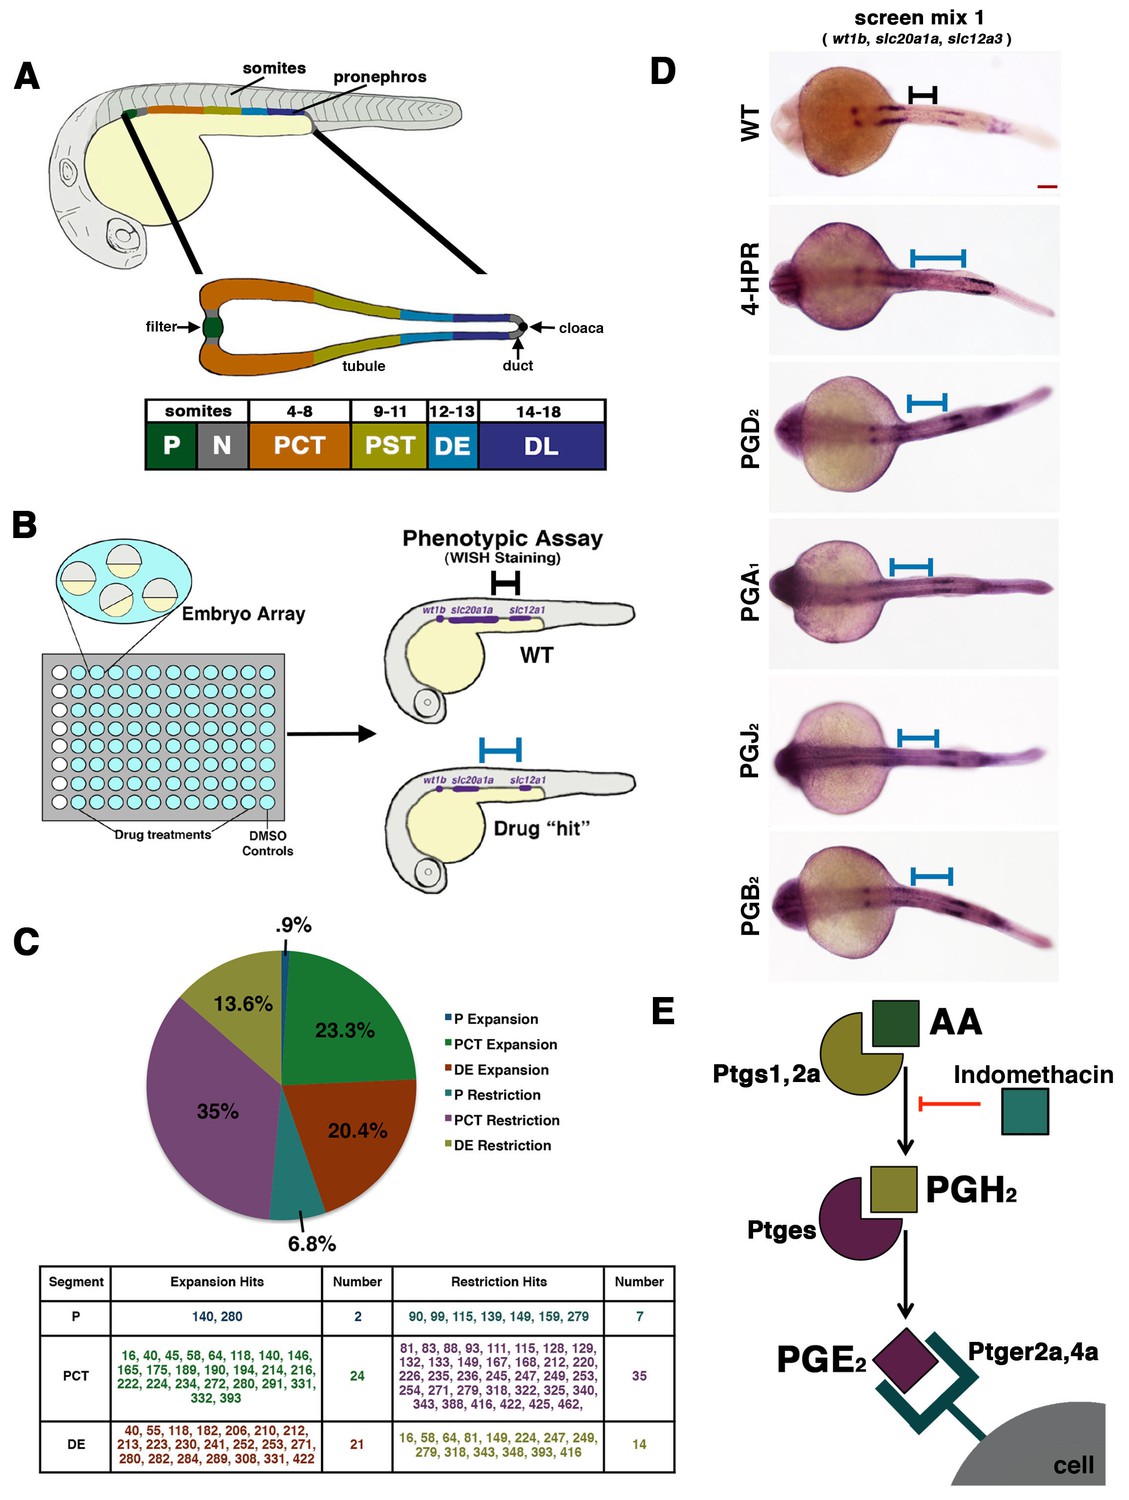
A novel small molecule screen reveals that prostaglandins alter nephron patterning.
(A) A diagram detailing the segmentation of the pronephros in relation to somites within the zebrafish embryo. Arrows indicate the blood filter, duct, and cloaca. (B) A schematic of the chemical genetic screen used for evaluating small molecules. Embryos were arrayed in 96-well plates and then exposed to drugs diluted in E3 medium from 60% epiboly to 24 hpf, where the embryos were then fixed and underwent WISH using a riboprobe cocktail to detect the P (wt1b), PCT (slc20a1a), and DE (slc12a1). Black and blue bars are used to illustrate changes between the WT embryo and an embryo with a patterning phenotype, respectively. (C) A pie graph and table denoting the number and percentage of small molecules hits from the chemical screen that expanded or restricted the P (blue and teal), PCT (green and purple) or DE (red and yellow). (D) WISH in 24 hpf stage embryos to detect the P (wt1b), PCT (slc20a1a), and DE (slc12a1) in WTs and those treated with 4-HPR, PGD2, PGA1, PGJ2, and PGB2. A black or blue bar was used to notate the segment change between the WT and drug treated embryos, respectively. Red scale bar, 70 µm. (E) Schematic showing example components of prostaglandin production and signaling. The precursor arachidonic acid (AA) interacts with either the Ptgs1 or Ptgs2a enzyme to generate an intermediate moiety, with the example here being PGH2. The intermediate interacts with a subsequent enzyme to produce the bioactive prostanoid molecule. Here, we depict the prostaglandin E synthase, Ptges, creating the bioactive prostaglandin PGE2 that can transduce signals through binding several G-protein coupled receptors such as Ptger2a and Ptger4a. Other receptors work with other bioactive prostaglandins. Indomethacin is a nonselective Cox (Ptgs1/Ptgs2a) inhibitor that prevents prostaglandin biosynthesis.
-
Figure 1—source data 1
Compilation of chemical screen phenotypic data.
For each compound, the dosage tested is listed along with the known biological function and the effect on zebrafish when treated between 4 and 24 hpf. The scoring key of ± indicates segment expansion or reduction.
- https://doi.org/10.7554/eLife.17551.003
Figure 2 with 4 supplements
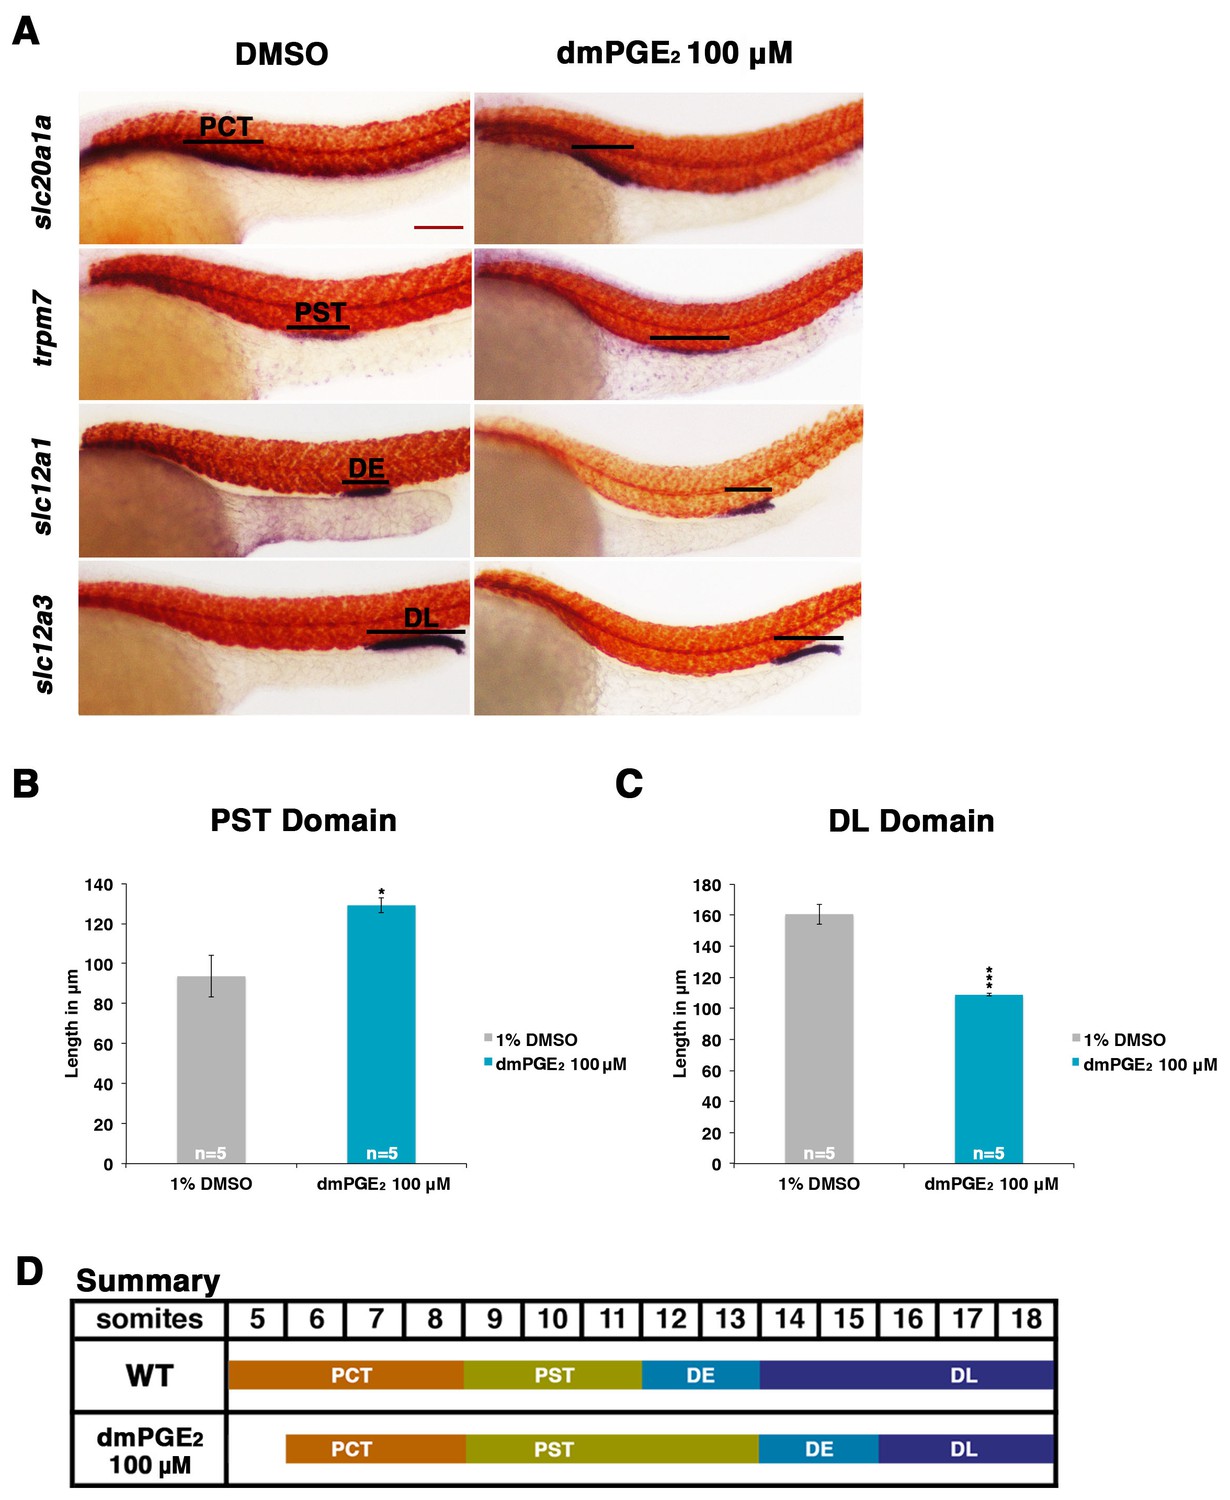
Exogenous prostaglandin activity promotes proximal straight tubule identity.
(A) Embryos were exposed to 100 µM dmPGE2 between 4 hpf and 24 hpf. WISH was used to stain for the PCT (slc20a1a), PST (trpm7), DE (slc12a1), and DL (slc12a3) (purple) and the somites (smyhc1) (red) at the 24 hpf stage. Black bars indicate segment gene expression domain. Red scale bar, 70 µm. (B,C) The PST and DL segments were measured in microns after incubation in 100 μM of dmPGE2 (n = 5 for each control and experimental group). (D) Summary depicting the nephron segments after exogenous dmPGE2 treatment. Data are represented as ± SD, significant by t test comparing each drug treatment to the DMSO control, *p<0.05, ***p<0.0005.
Figure 2—figure supplement 1
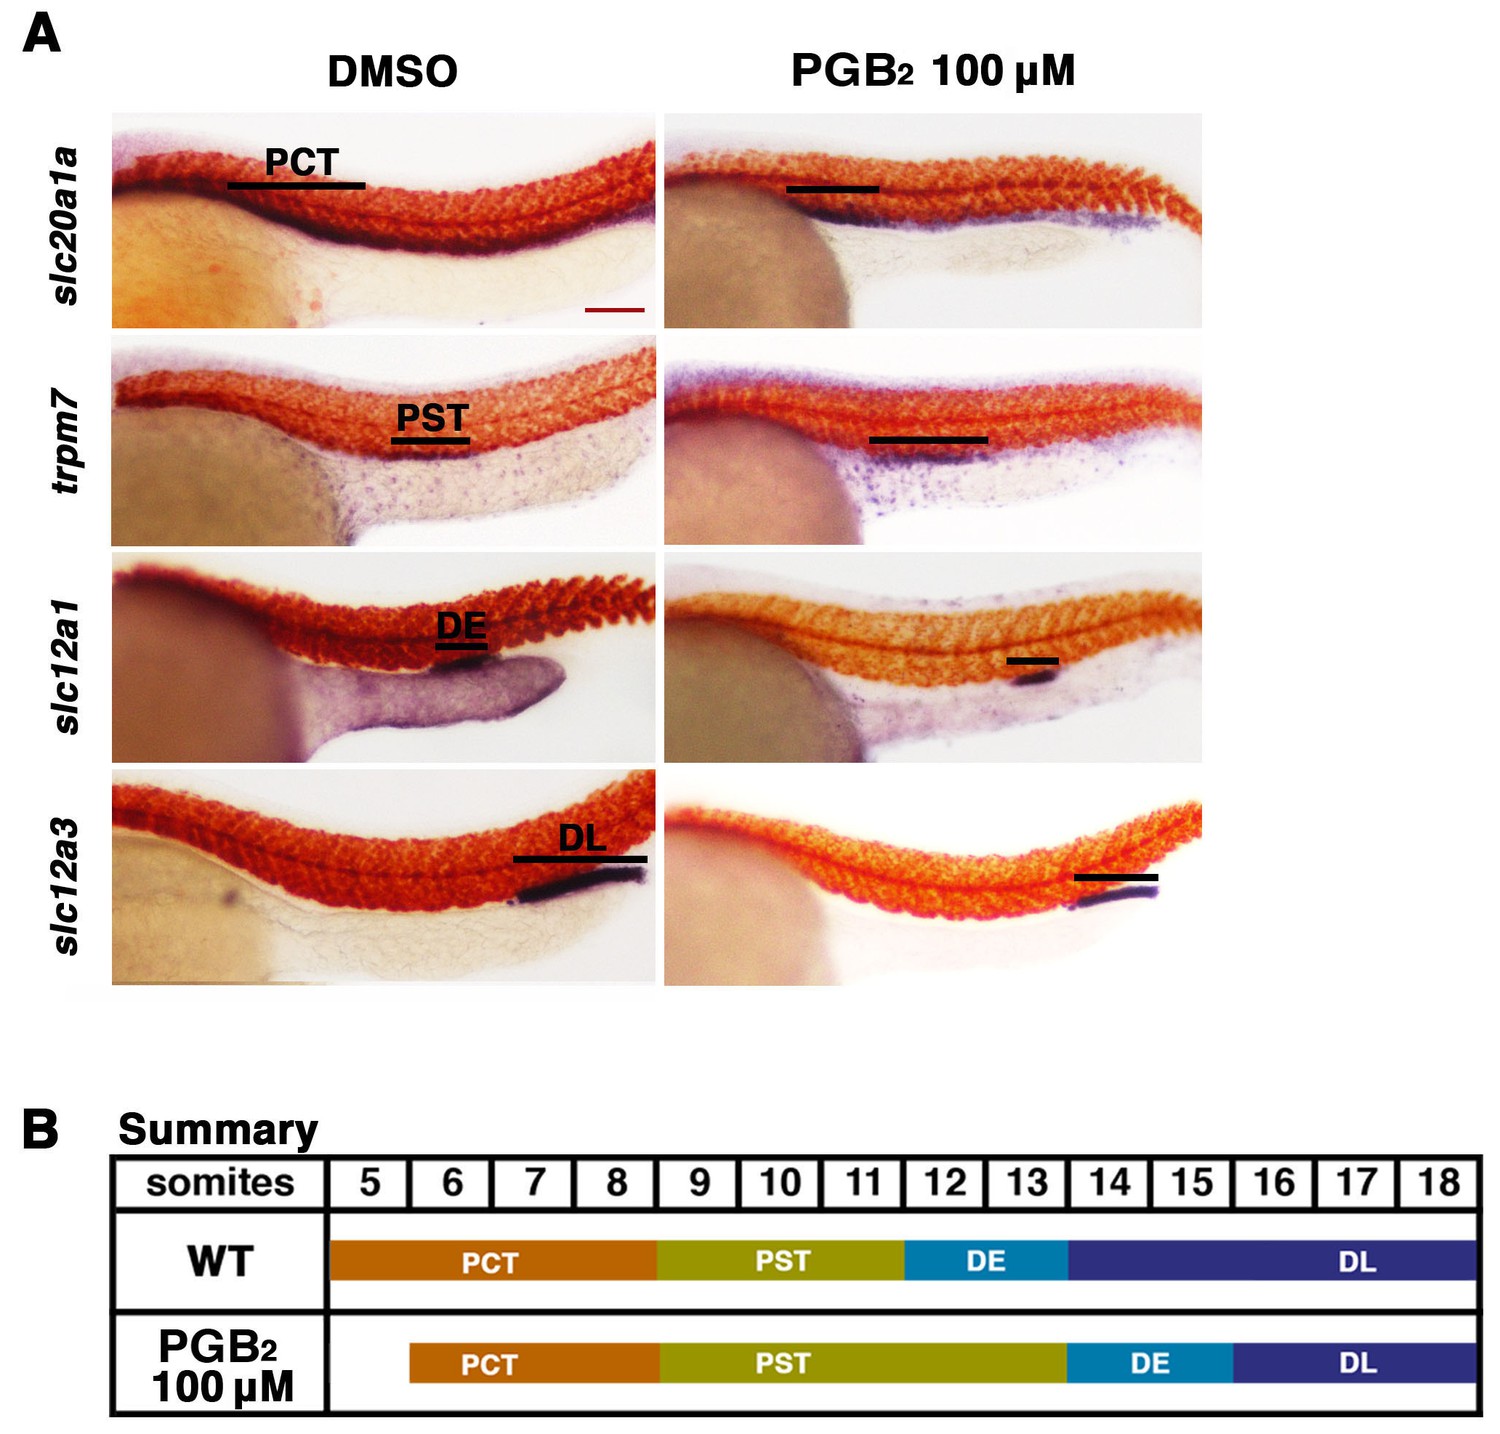
Exogenous PGB2 treatment is sufficient to expand the proximal straight tubule.
(A) Embryos were treated with PGB2 at 100 μM from 4 hpf to 24 hpf. Using WISH, embryos were stained for the PCT (slc20a1a), PST (trpm7), DE (slc12a1), and DL (slc12a3) (purple) and the somites (smyhc1) (red) at the 24 hpf stage. Black bars indicate segment gene expression domain. Red scale bar, 70 µm. (B) Summary depicting the nephron segments after PGB2 treatment at 100 μM.
Figure 2—figure supplement 2
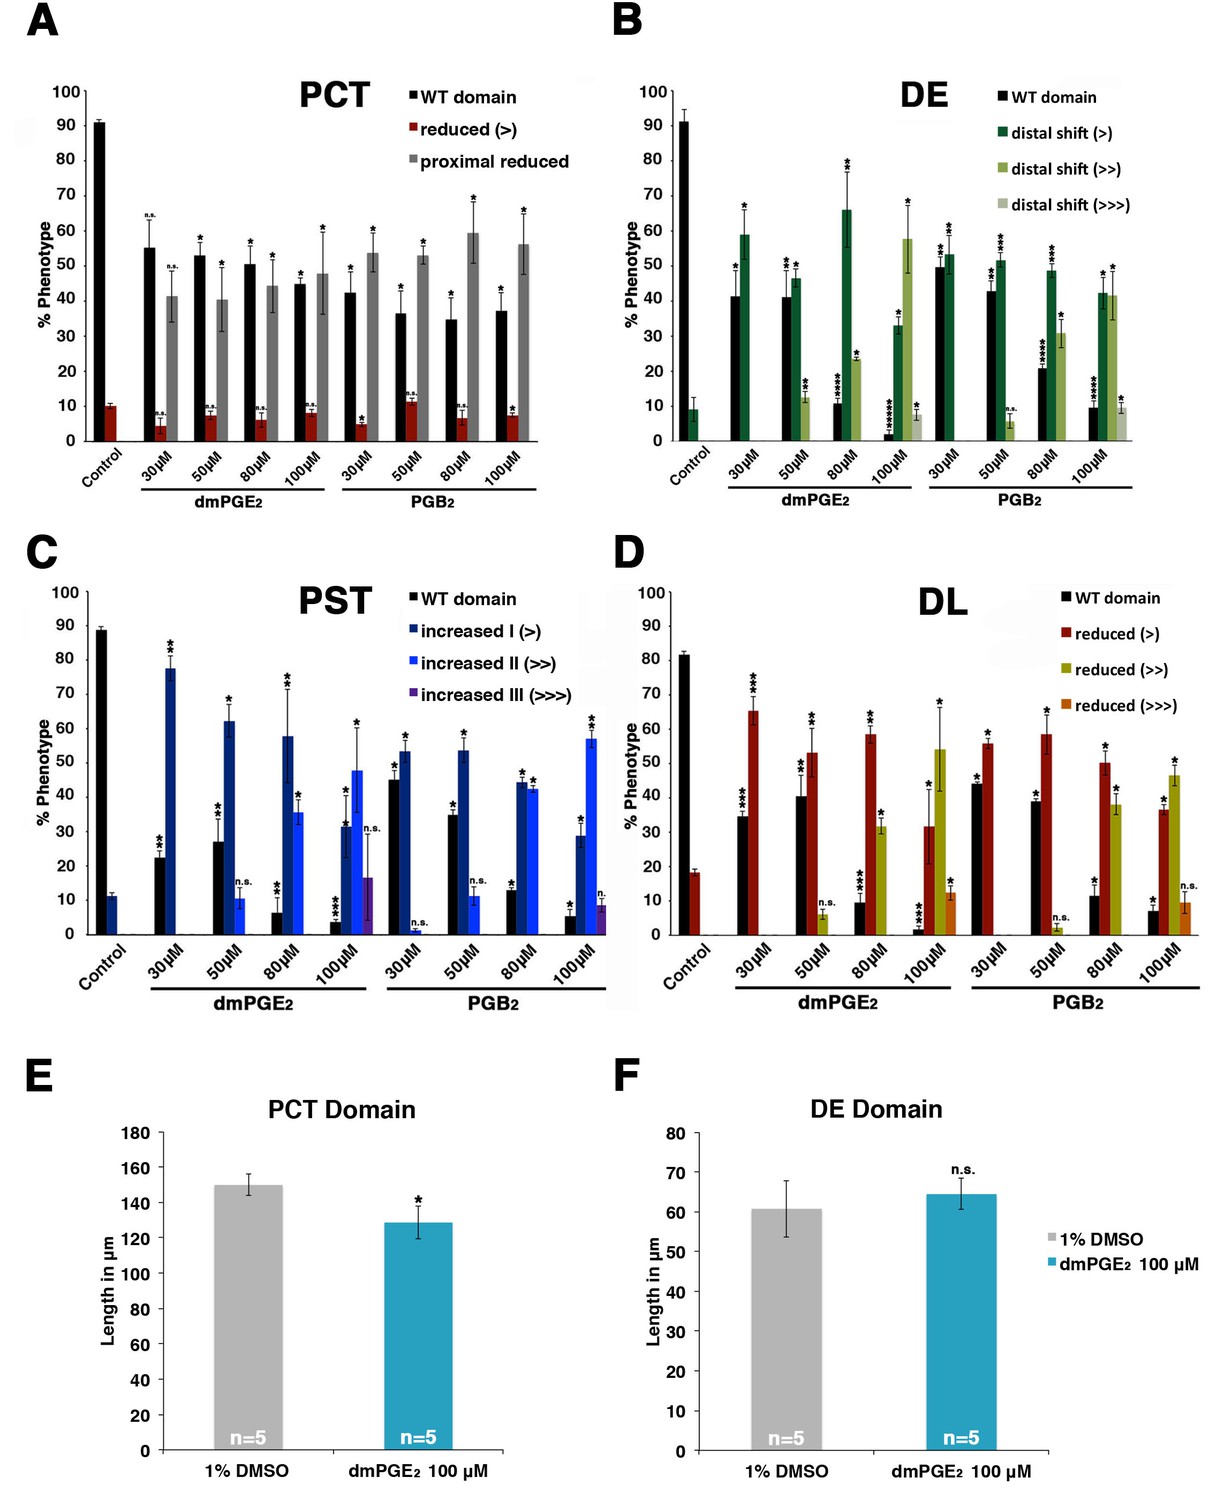
dmPGE2 and PGB2 treatment have dosage-dependent effects on pronephros segmentation.
(A–D) Embryos were incubated from 4 hpf to 24 hpf in 30 μM, 50 μM, 80 μM, and 100 μM solutions of dmPGE2 or PGB2. The PCT (slc20a1a), PST (trpm7), DE (slc12a1), and DL (slc12a3) (purple) and the somites (smyhc1) (red) were then stained at the 24 hpf stage for using WISH and quantified in triplicate per phenotype. Increments of greater than (>) or less than (<) were used to categorize segment changes, where each (>) or (<) represents a difference in segment area of one somite. At least 15 embryos were used per each control and experimental group. (E, F) The PCT and DE segments were measured in microns after incubation in 100 μM of dmPGE2 (n = 5 for each control and experimental group). Data are represented as ± SD, significant by t test comparing each drug treatment to the DMSO control, *p<0.05, **p<0.005, ***p<0.0005, ****p<0.00005, *****p<0.000005, where n.s. indicates not significant.
Figure 2—figure supplement 3
Embryos dimensions remain largely unchanged by dmPGE2 or indomethacin treatment.
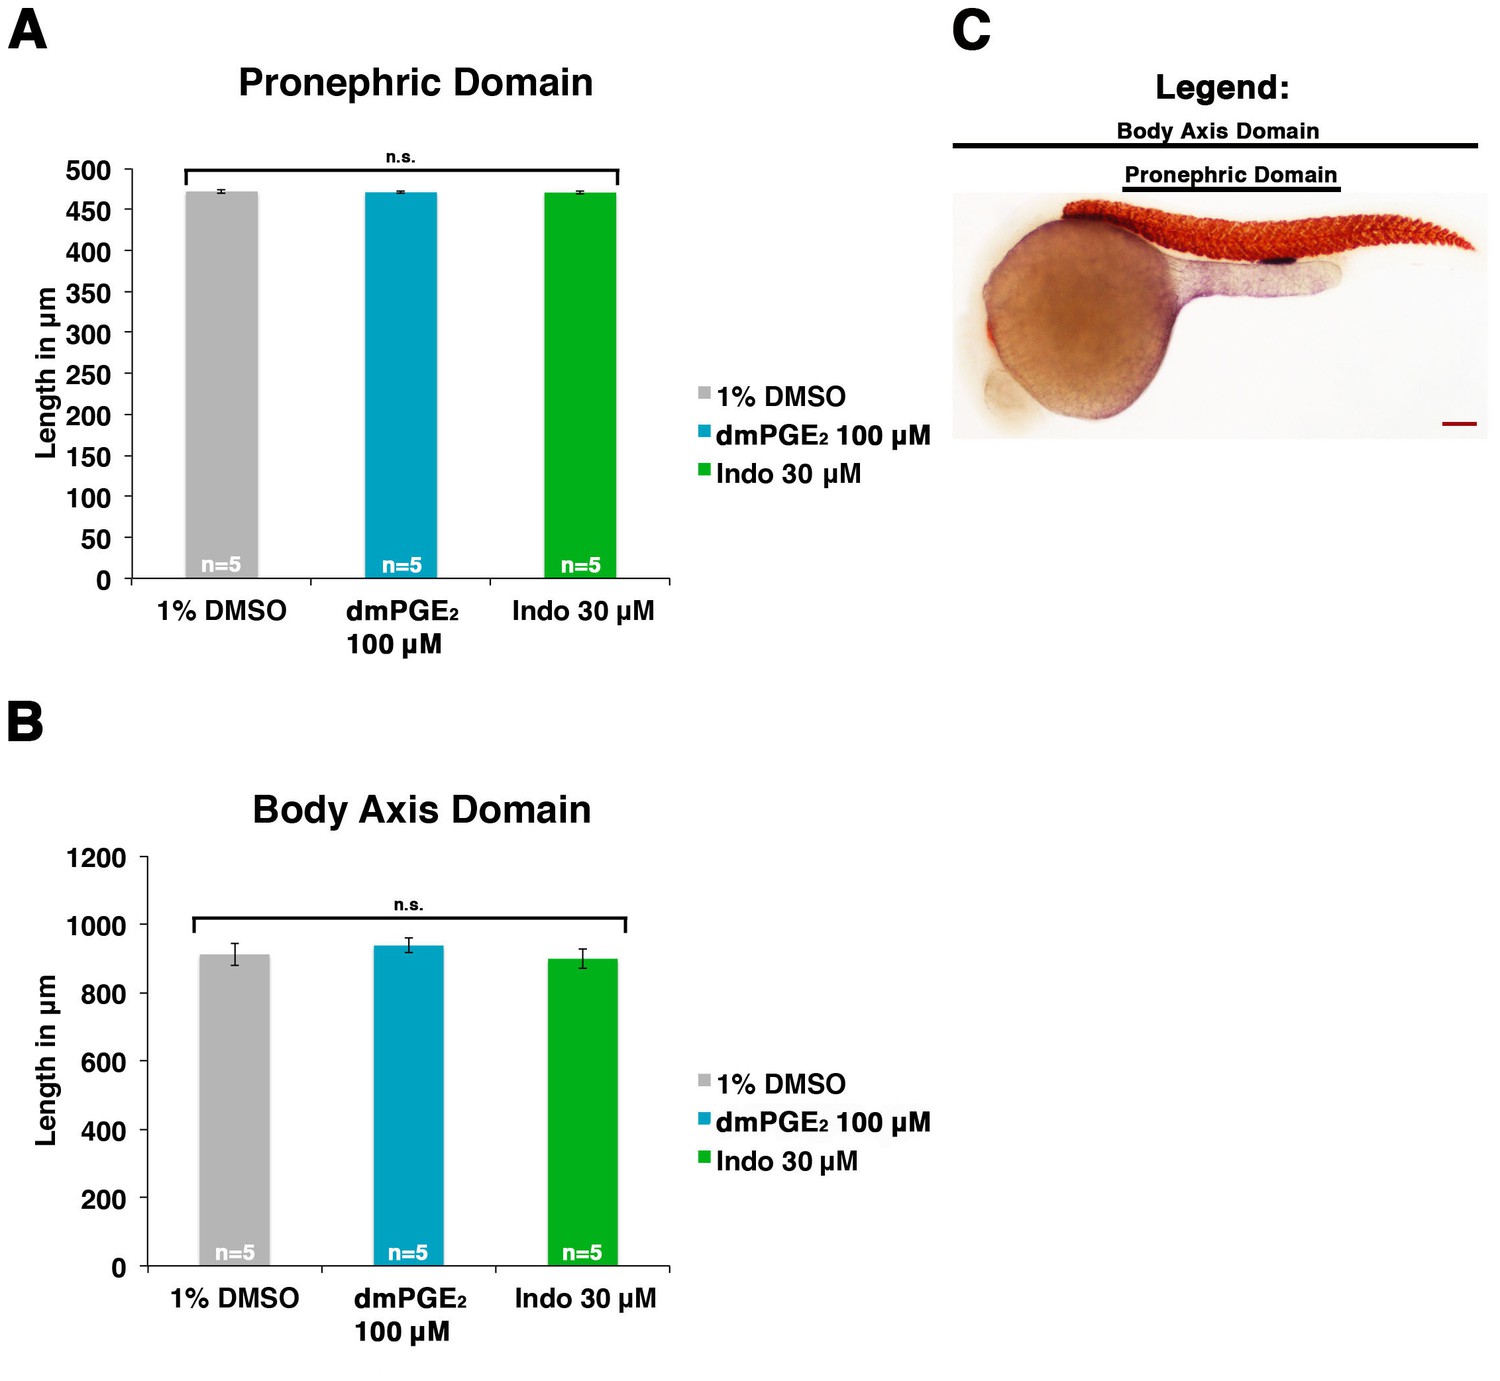
(A) The pronephric domain (starting at the beginning somite five to the end of somite 18) was measured in microns for embryos treated with 1% DMSO, 100 μM dmPGE2, or 30 μM indomethacin from 4 hpf to 24 hpf (n = 5). (B) The body axis domain at the 24 hpf stage was measured for embryos exposed to 1% DMSO, 100 μM dmPGE2, and 30 μM indomethacin. (C) An image of a 24 hpf embryo stained for slc12a1 and smyhc1, where black bars label the pronephric domain and the body axis domain. Red scale bar, 70 µm. Data are represented as ± SD, ANOVA used to compare samples, where n.s. indicates not significant.
Figure 2—figure supplement 4
Perturbation of the prostaglandin pathway fails to elicit gross blood or blood vessel abnormalities during development.
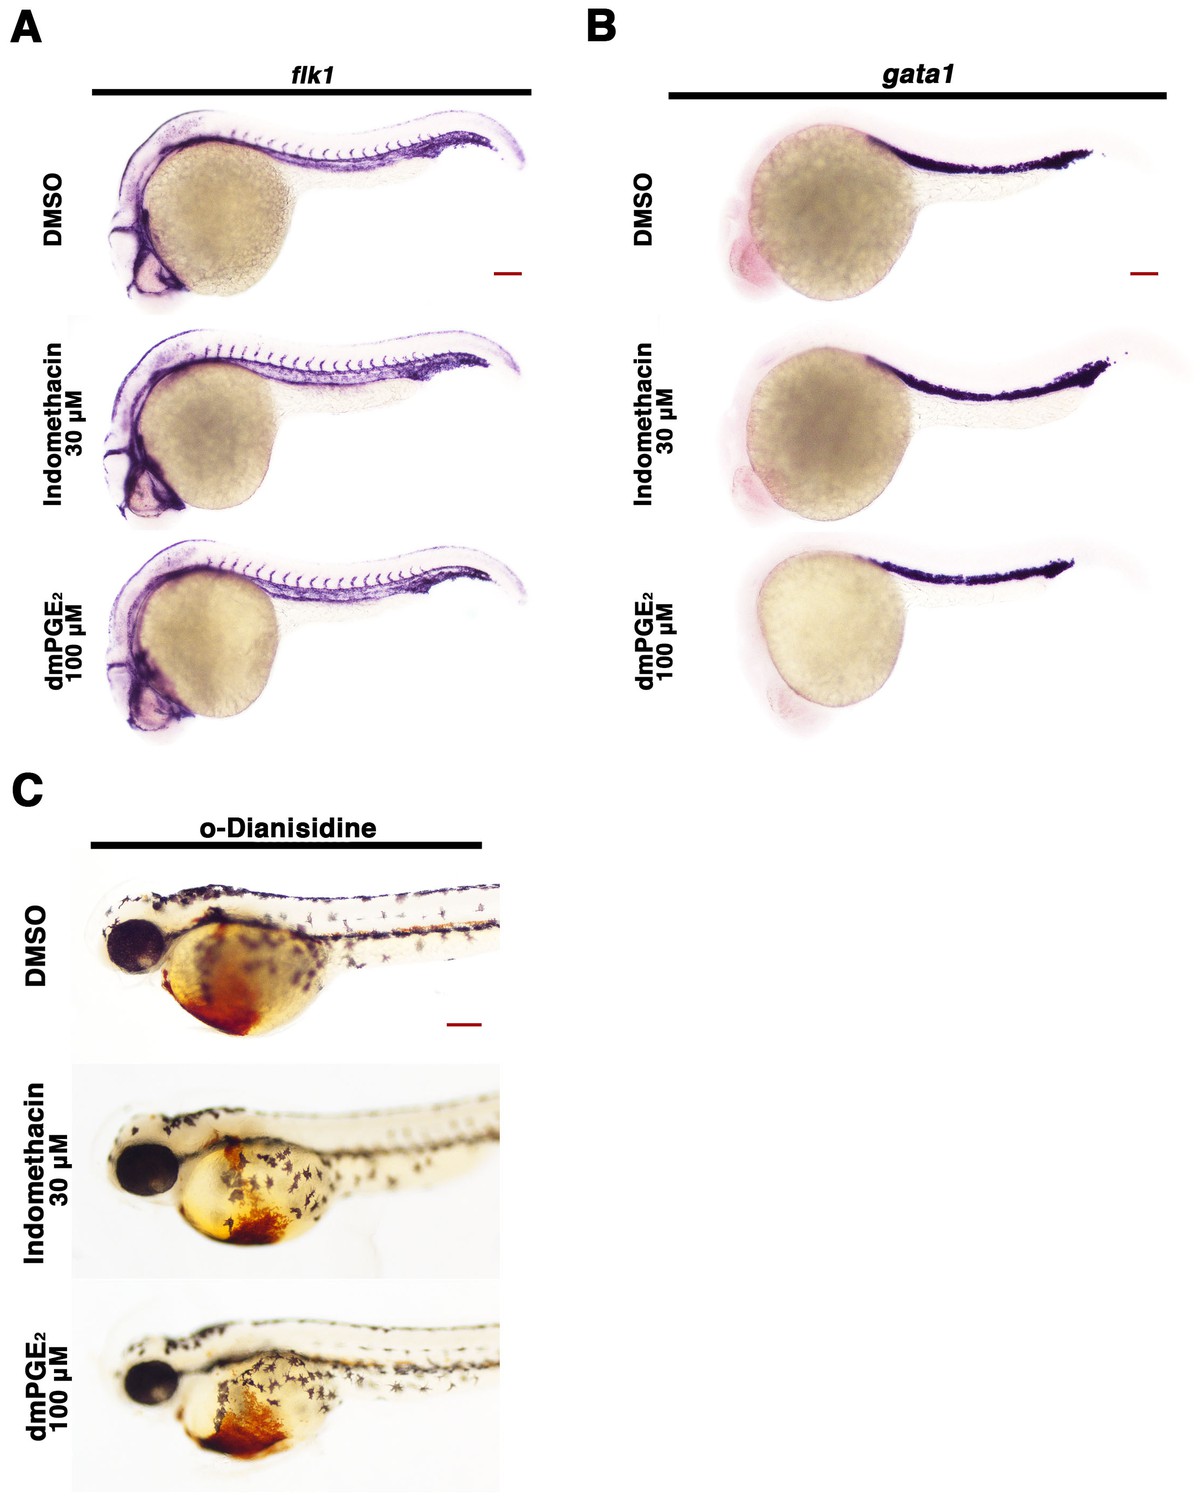
Embryos were treated with 1% DMSO, 30 μM indomethacin, or 100 μM dmPGE2 from 4 hpf to 24 hpf and WISH was performed to detect (A) vasculature (flk1) and (B) blood precursors (gata1) at the 24 hpf stage. (C) o-dianisidine staining was performed at the 55 hpf stage on embryos treated with 1% DMSO, 30 μM indomethacin, and 100 μM dmPGE2 from 4 hpf to 24 hpf in triplicate with at least 30 embryos. Red scale bar, 70 µm.
Figure 3 with 1 supplement
Prostaglandin production is required for normal distal cell fate specification.
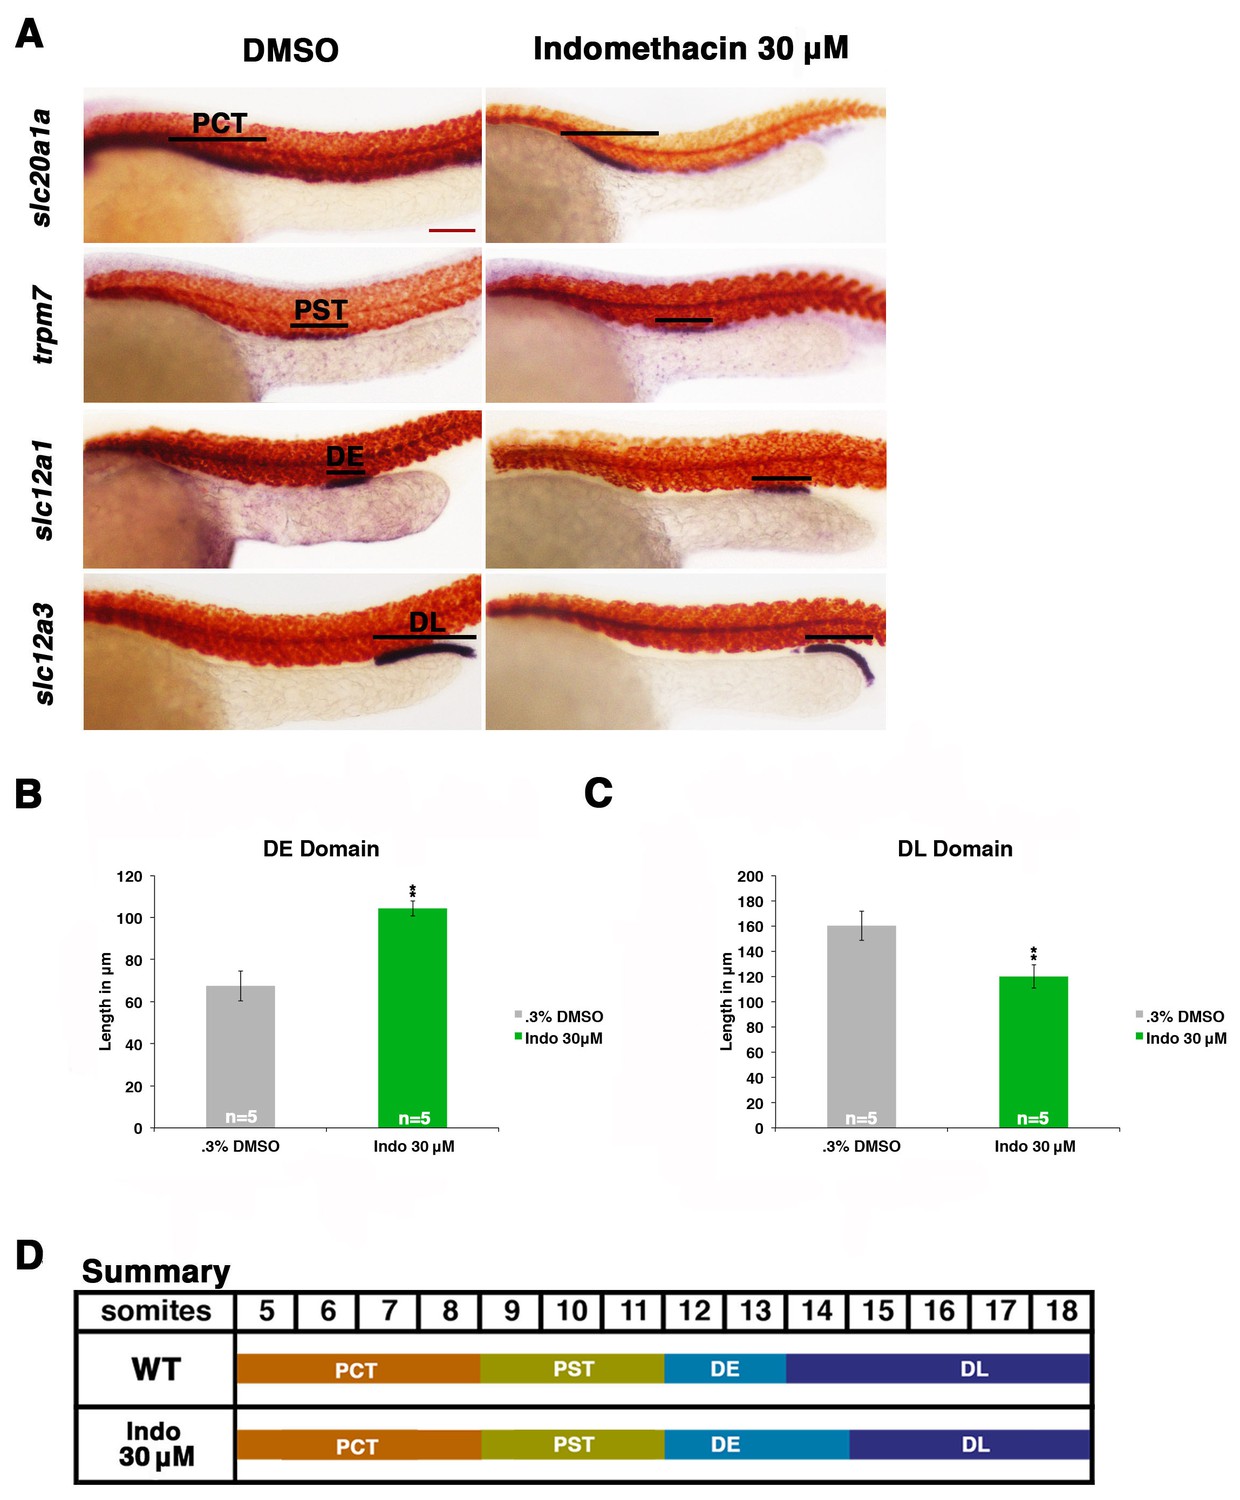
(A) Embryos were treated with 0.3% DMSO or the nonselective Cox inhibitor indomethacin at 30 μM from 4 hpf to 24 hpf. WISH was used to stain for the PCT (slc20a1a), PST (trpm7), DE (slc12a1), and DL (slc12a3) (purple) and the somites (smyhc1) (red) at the 24 hpf stage. Black bars indicate segment gene expression domain. Red scale bar, 70 µm. (B,C) The DE and DL segments were measured in microns (n = 5 for each control and experimental group). (D) A summary depicting the nephron segments after indomethacin treatment. Data are represented as ± SD, significant by t test comparing each drug treatment to the DMSO control group, **p<0.005.
Figure 3—figure supplement 1
Indomethacin treatment has no effect on proximal cell-fate choice, yet shifts the balance between distal identities.
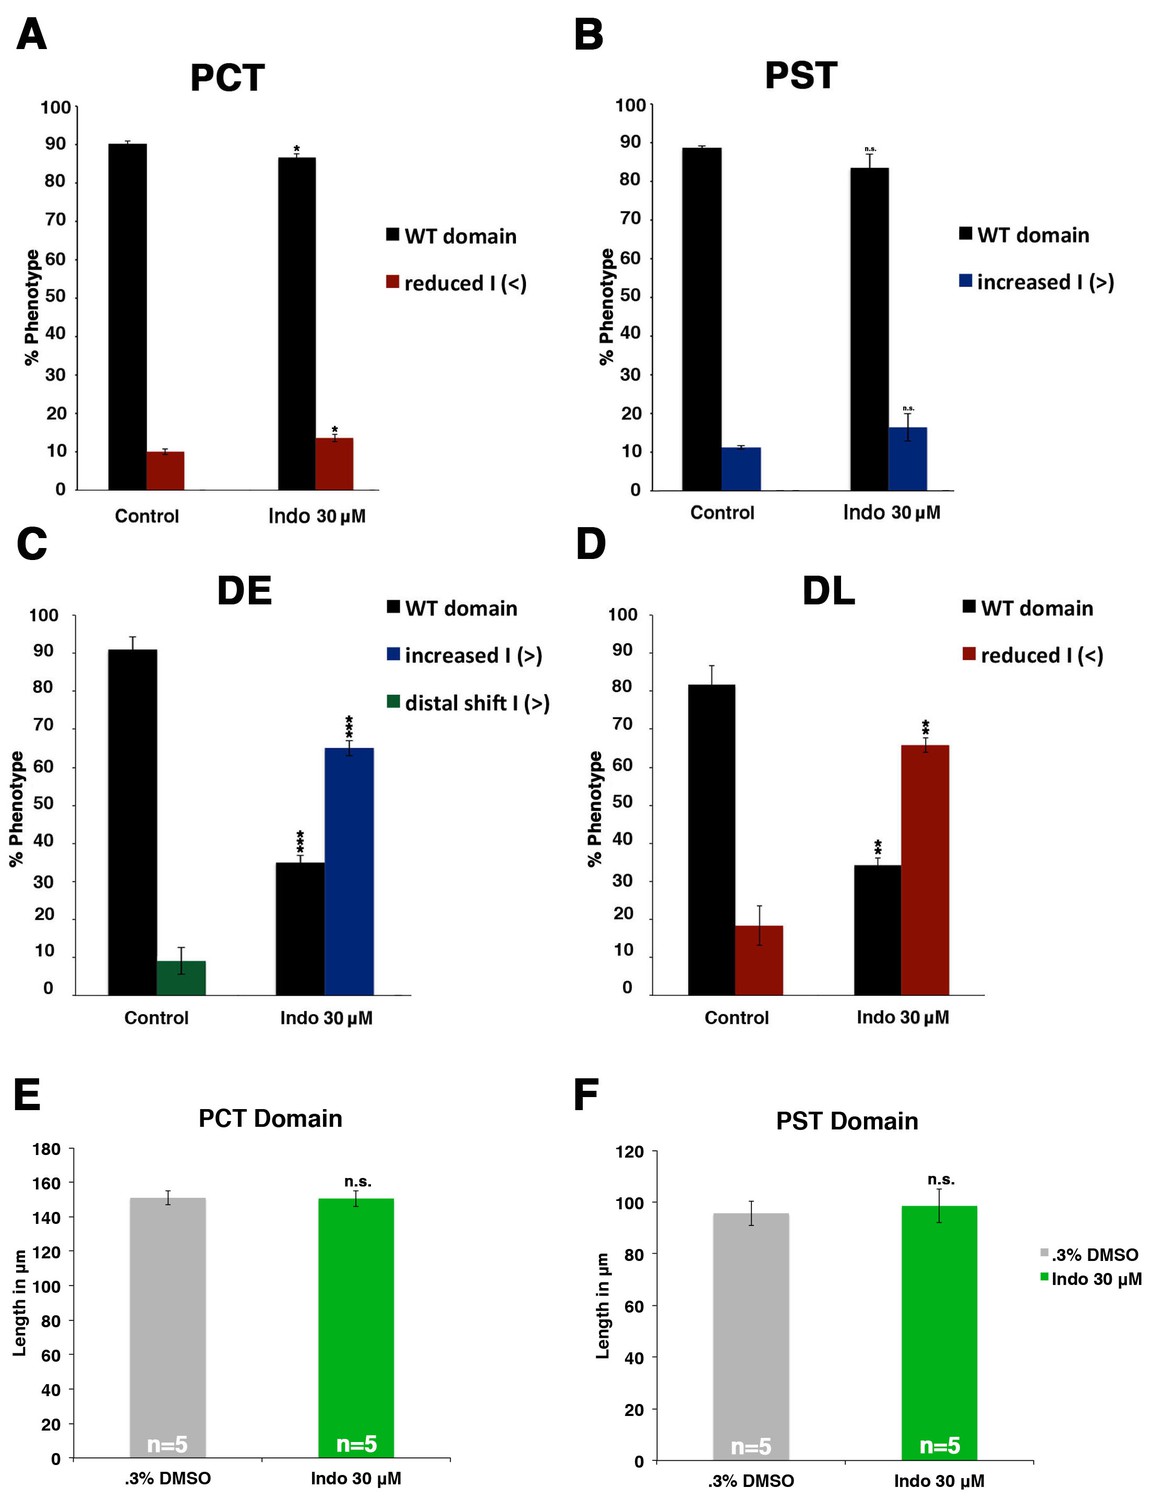
(A) The PCT (slc20a1a), PST (trpm7), DE (slc12a1), and DL (slc12a3) (purple) and the somites (smyhc1) (red) were quantified at the 24 hpf stage in triplicate according to changes in domain size after 30 μM indomethacin incubation from 4 hpf to 24 hpf. Greater than (>) and less than (<) were used to categorize embryos, where each (>) or (<) represents the difference of a somite change in segmentation. At least 20 embryos were used per control and experimental group. Data are represented as ± SD significant by t test comparing each drug treatment to corresponding DMSO control group, *p<0.05, **p<0.005, ***p<0.0005, where n.s. indicates not significant.
Figure 4 with 10 supplements
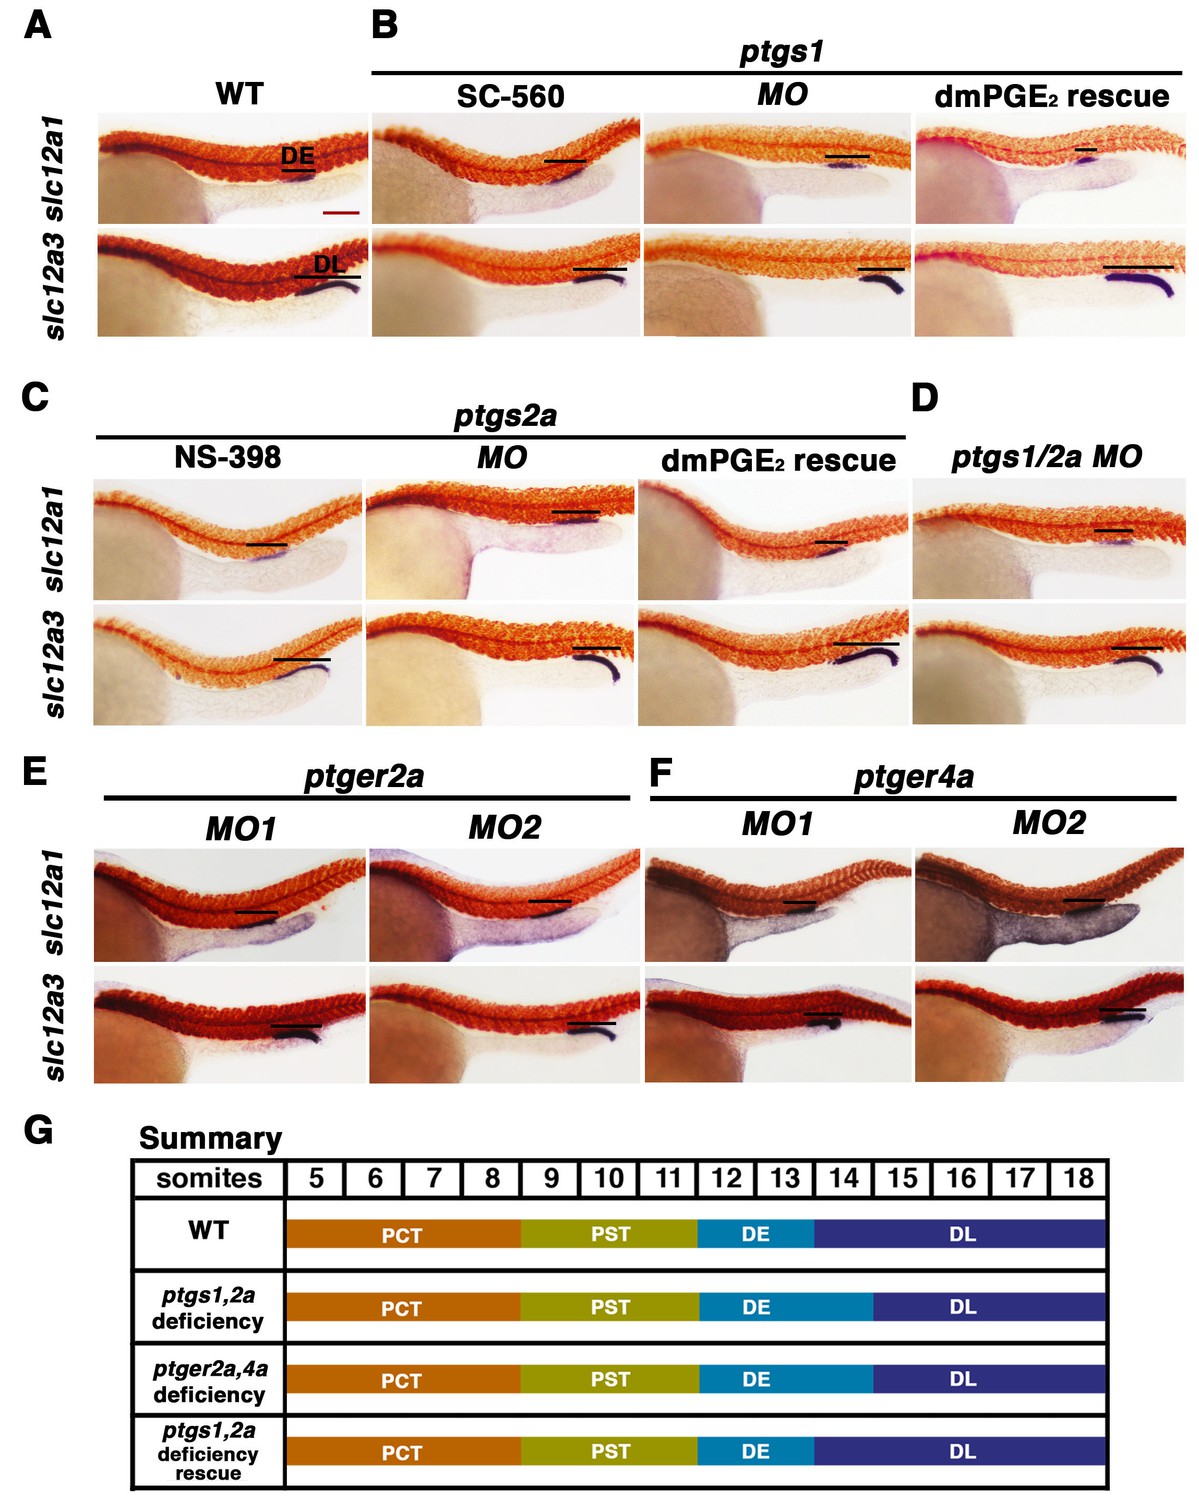
Prostaglandin signal inhibition results in an expansion of the distal early domain, which is rescued by the addition of exogenous dmPGE2.
Embryos were treated with a (A) 1% DMSO control, the (B) Ptgs1 selective inhibitor SC-560 at 50 μM from 4 hpf to 24 hpf, microinjected with the ptgs1 MO alone, or microinjected with the ptgs1 MO and treated with dmPGE2 from 4 hpf to 24 hpf. Embryos were treated with the (C) Ptgs2a selective inhibitor NS-398 at 50 μM from 4 hpf to 24 hpf, microinjected with the ptgs2a MO or microinjected with the ptgs2a MO and then treated with dmPGE2 at 50 μM from 4 hpf to 24 hpf. (D) Embryos were microinjected with a combination of the ptgs1 MO and ptgs2a MO. Embryos were microinjected with (E) ptger2a MO1, ptger2a MO2, (F) ptger4a MO1 and ptger4a MO2. (A–E) WISH was used to stain for the DE (slc12a1), DL (slc12a3) (purple), and the somites (smyhc1) (red) at the 24 hpf stage. Black bars indicate segment gene expression domain. Red scale bar, 70 µm. (G) Summary depicting the nephron segments after inducing deficiency of prostaglandin synthesis or receptor activity.
Figure 4—figure supplement 1
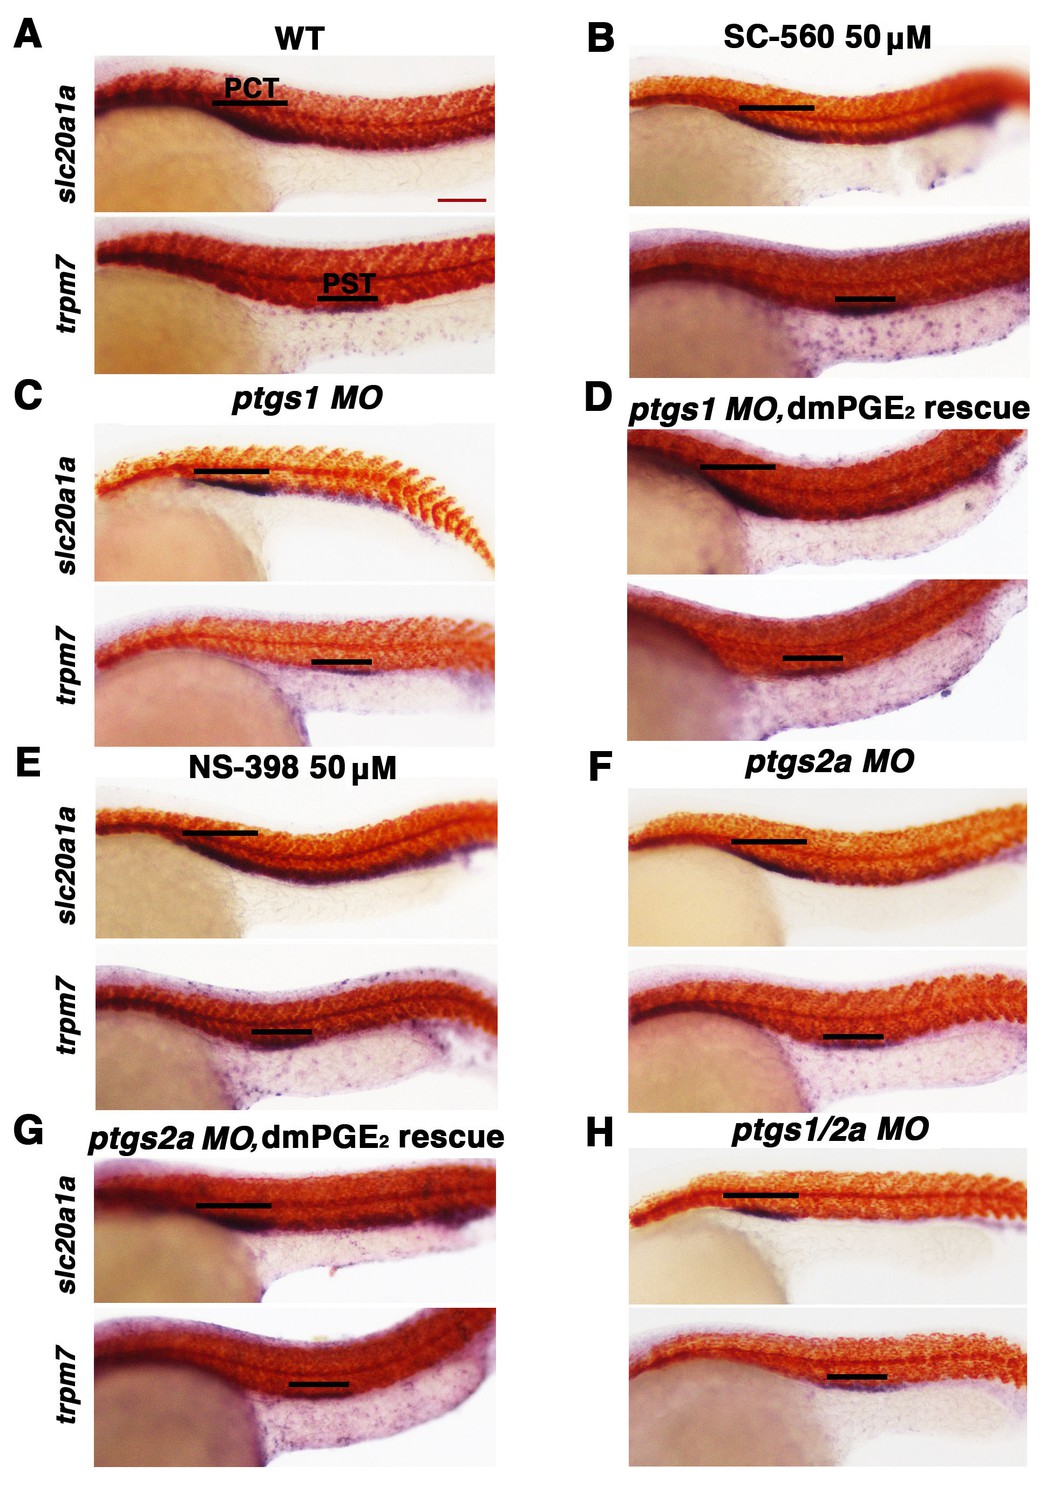
Inhibition of Ptgs1 or Ptgs2a did not alter proximal segment identity.
Embryos were treated with (A). 5% DMSO, (B) the selective Ptgs1 inhibitor SC-560 at 50 μM, and (E) the selective Ptgs2a inhibitor NS-398 at 50 μM from 4 hpf to 24 hpf. Embryos were microinjected with (C) ptgs1 MO, (F) ptgs2a MO or (H) both ptgs1 MO and ptgs2a MO together and grown until 24 hpf. Embryos were microinjected with (D) ptgs1 MO or (G) ptgs2a MO then exposed to 100 μM dmPGE2 from 4 hpf to 24 hpf. WISH was used to label the PCT (slc20a1a) and PST (trpm7) (purple) as well as the somites (smyhc1) (red) at the 24 hpf stage. Black bars indicate segment gene expression domain. Red scale bar, 70 µm.
Figure 4—figure supplement 2
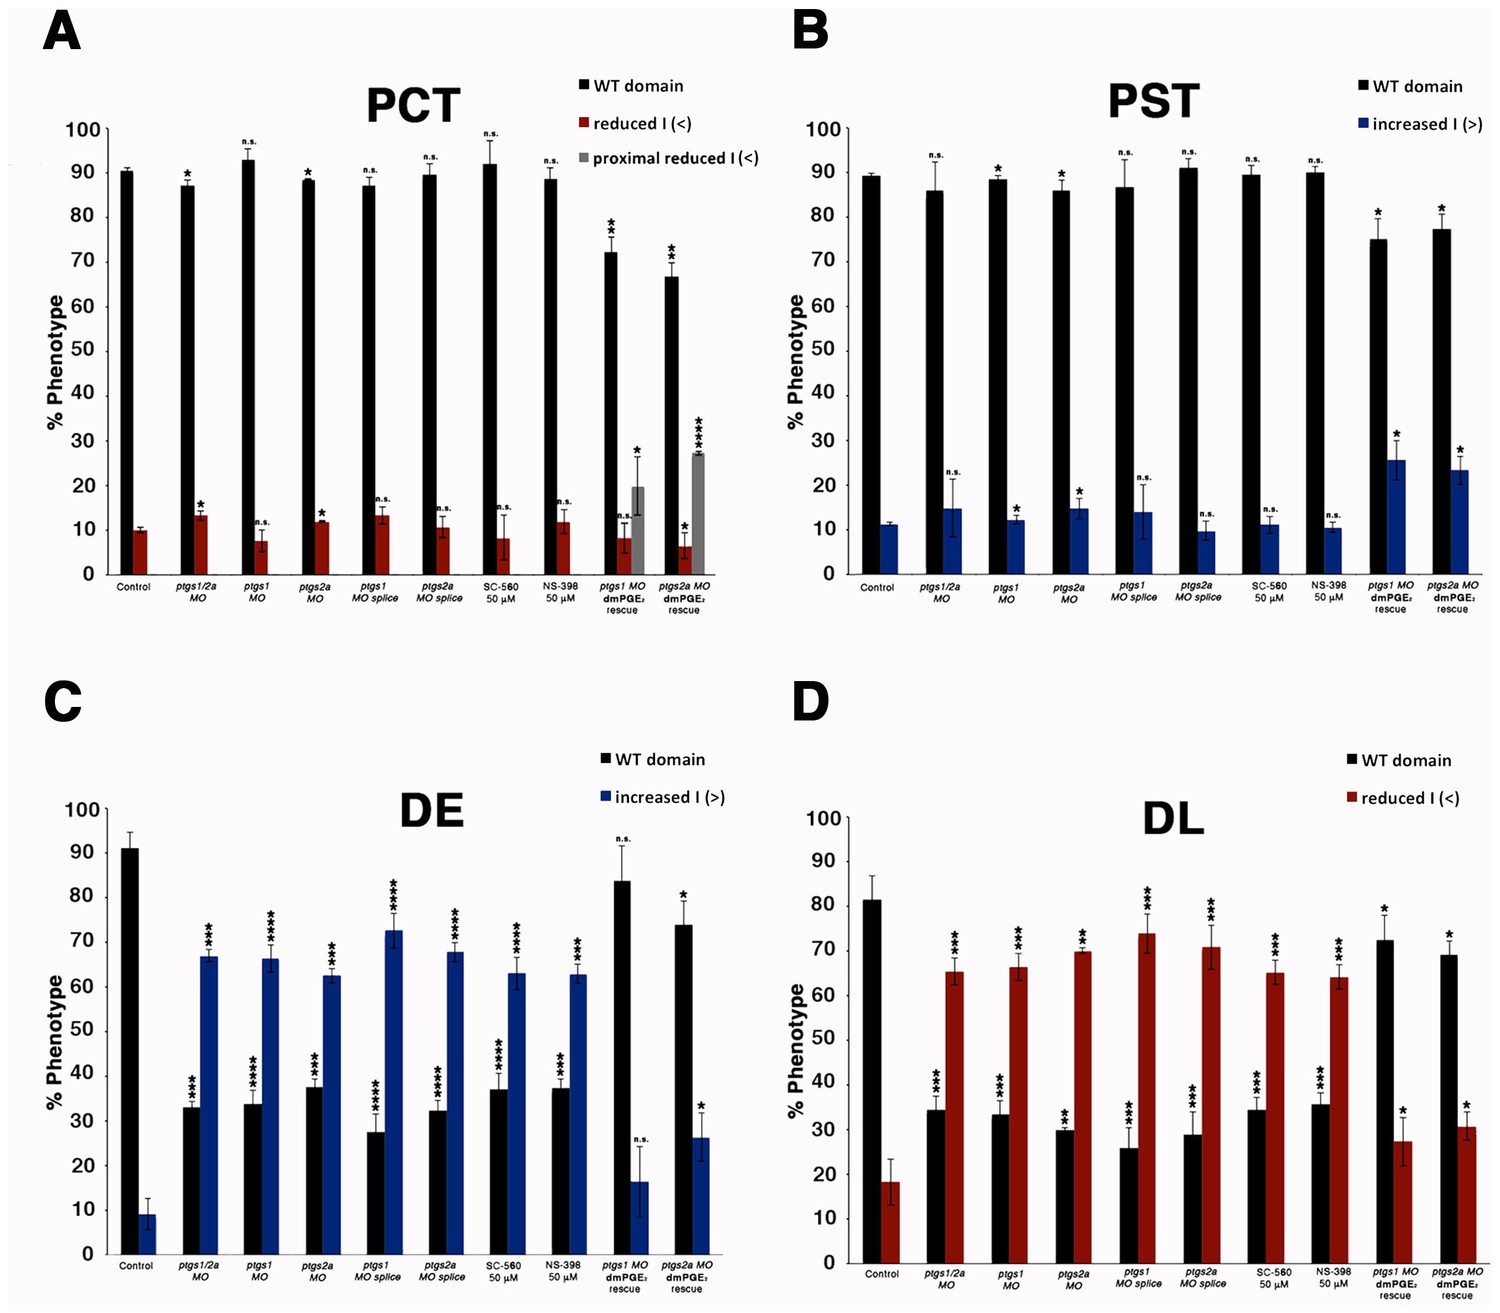
Diminishing Ptgs1 or Ptgs2a function causes distal early cell-fate identity to be favored at the expense of the distal late domain.
(A) The PCT, (B) PST, (C) DE, and (D) DL segment phenotypes were quantified in triplicate at the 24 hpf stage according to comparisons to the somites for ptgs1/2a double MO, ptgs1 MO, ptgs2a MO, ptgs1 splice MO, and ptgs2a splice MO microinjections, SC-560 and NS-398 at 50 μM from 4 hpf to 24 hpf, and for embryos microinjected with either ptgs1 MO or ptgs2a MO and treated with dmPGE2 at 50 μM from 4 hpf to 24 hpf. Greater than (>) and less than (<) were used to categorize embryos, where each (>) or (<) represents the difference of a somite change in segmentation. At least 15 embryos were used per control and experimental group. Data are represented as ± SD significant by t test comparing each drug treatment to the corresponding DMSO control group, *p<0.05, **p<0.005, ***p<0.0005, ****p<0.00005, where n.s. indicates not significant.
Figure 4—figure supplement 3
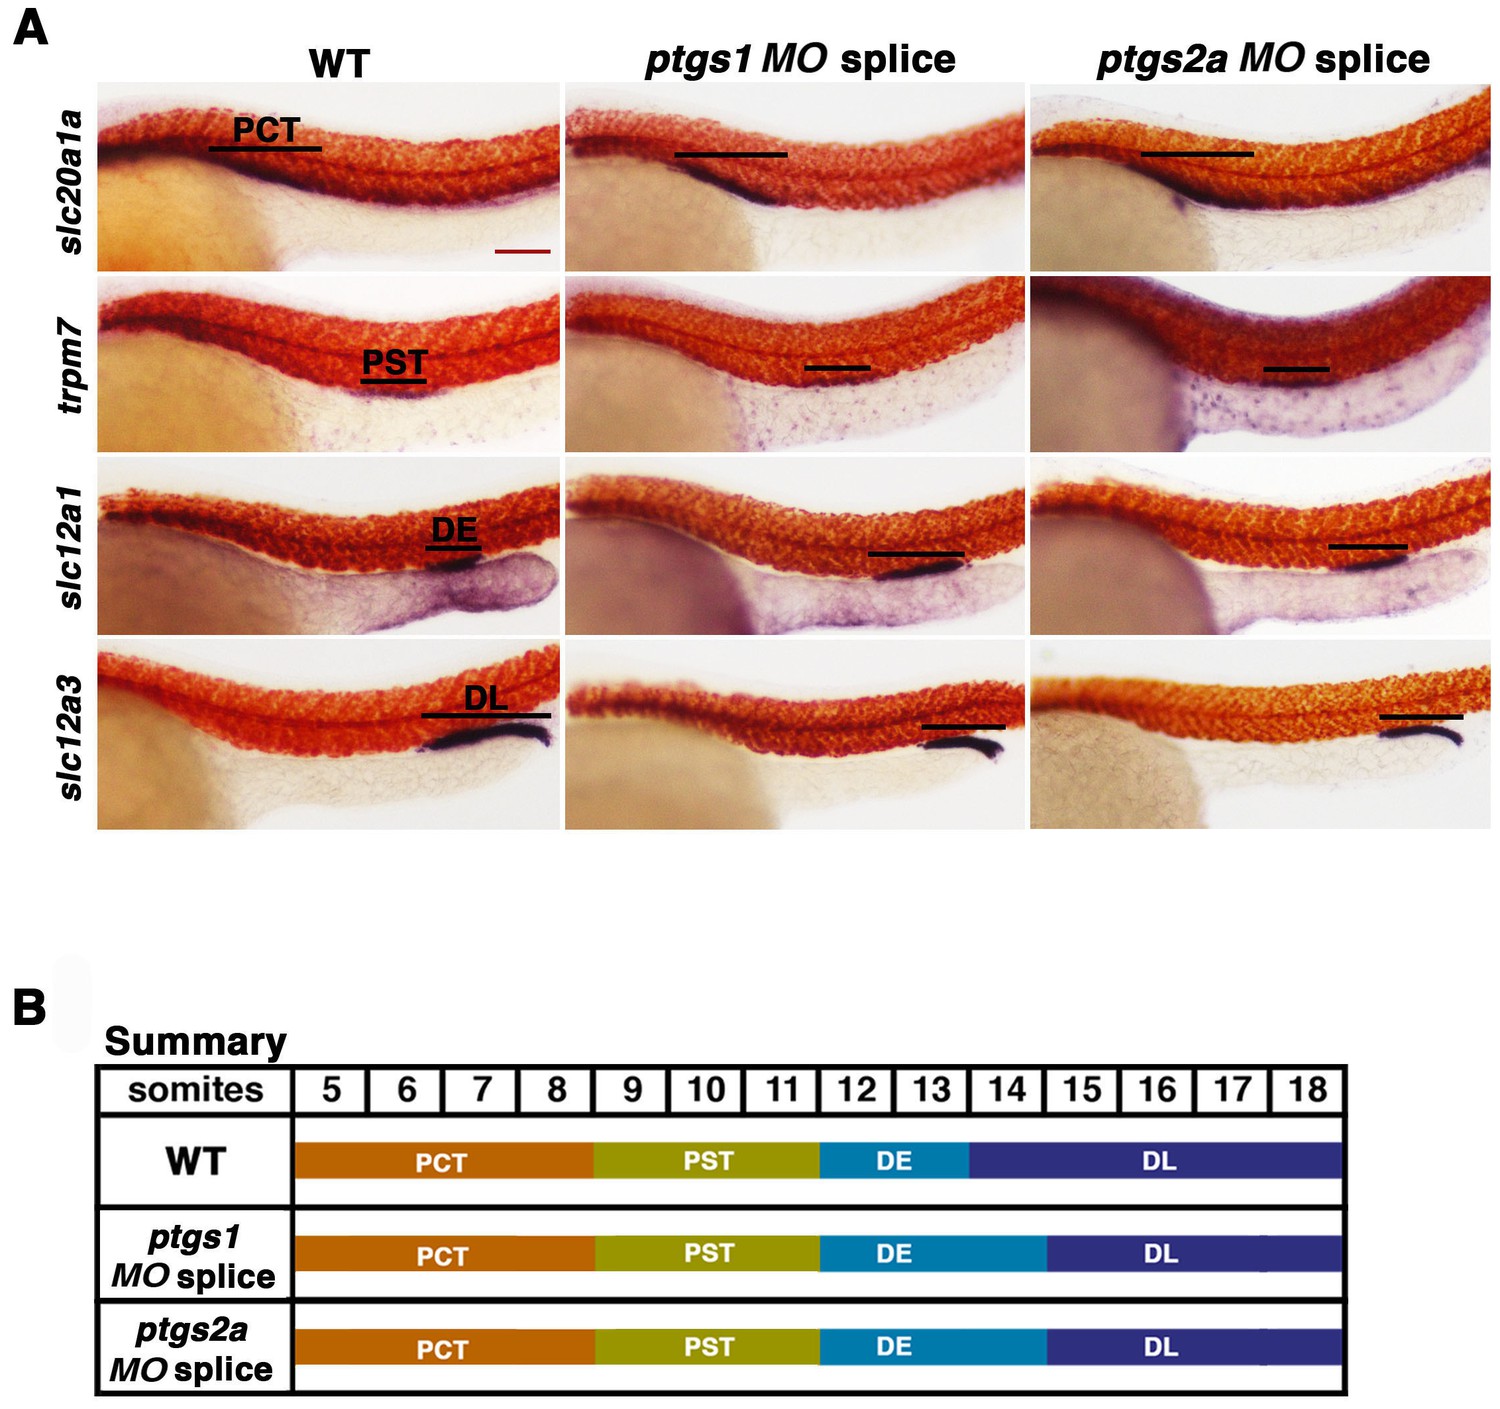
Inhibiting prostaglandin synthesis with splice morpholinos promotes distal early identity.
(A) WT embryos were microinjected with either ptgs1 MO splice or ptgs2a MO splice and grown until 24 hpf. WISH was used to assay for the PCT (slc20a1a), PST (trpm7), DE (slc12a1), and DL (slc12a3) (purple) and the somites (smyhc1) (red) at the 24 hpf stage. Black bars indicate segment gene expression domain. Red scale bar, 70 µm. (B) A somite summary map depicting the changes induced by ptgs1 MO splice and ptgs2a MO splice microinjection.
Figure 4—figure supplement 4
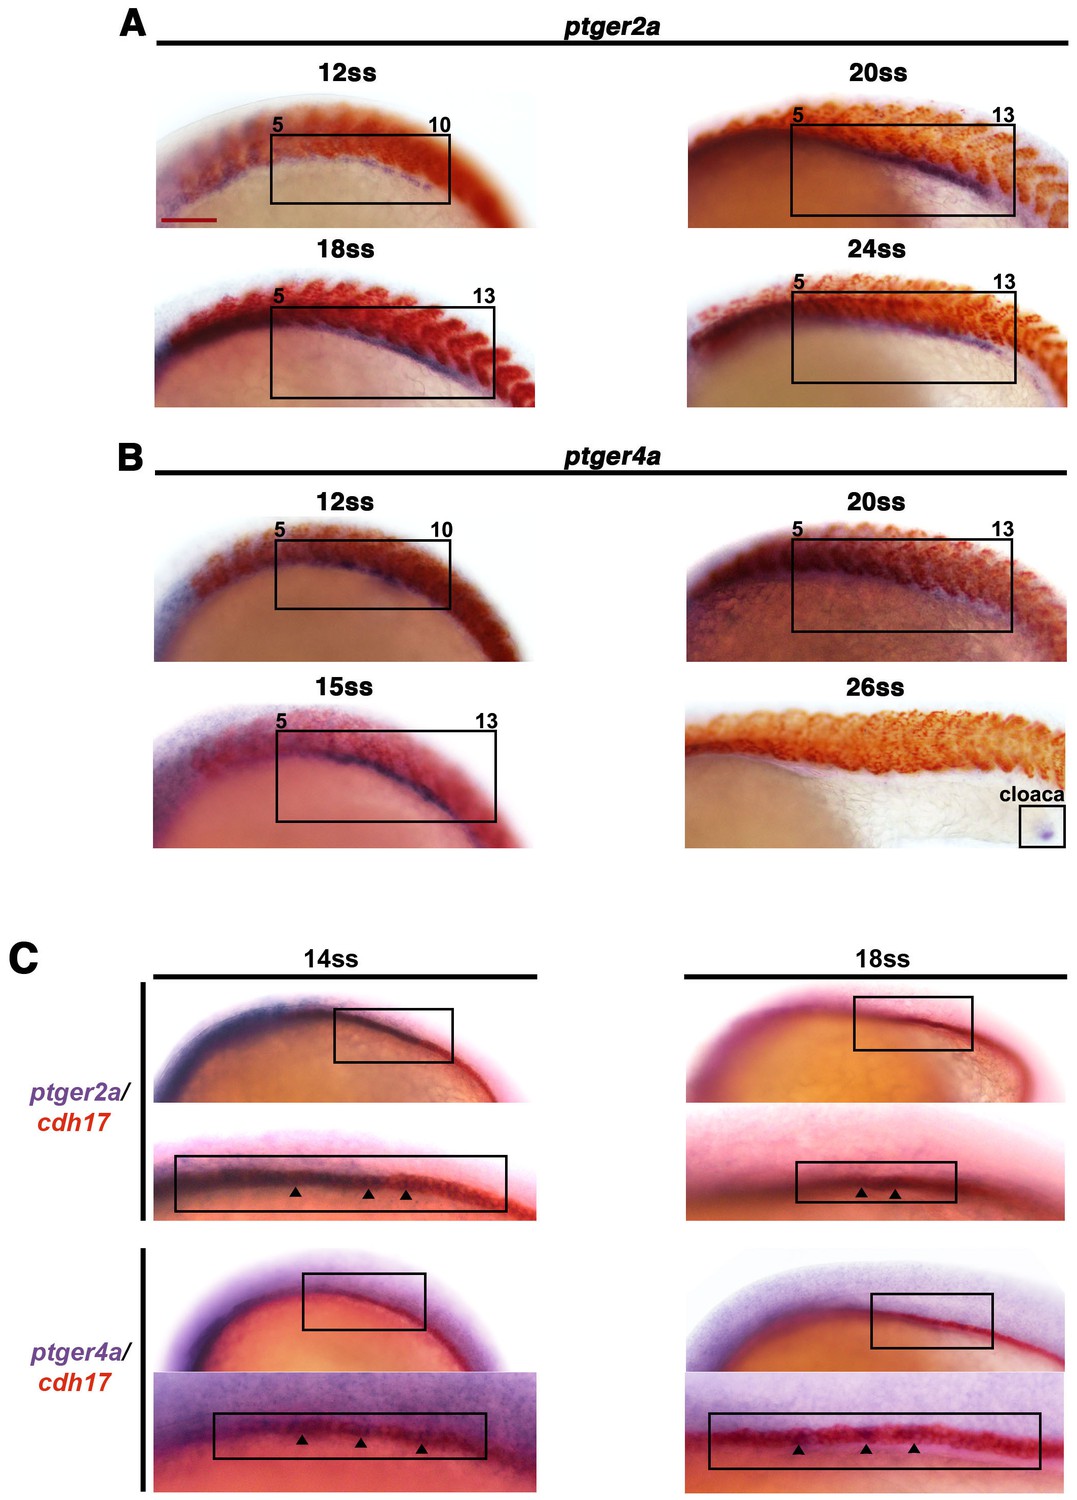
The prostaglandin receptor transcripts ptger2a and ptger4a are expressed in the pronephros during development and co-localize with the nephron.
WT embryos from the 12 ss through 26 ss were stained for (A) ptger2a or (B) ptger4a transcript expression (purple) and the somites (red) using WISH. The ptger2a and ptger4a expression domains are framed in black boxes. WT embryos at the 14 ss and 18 ss were co-stained for (C) ptger2a and cdh17 (D) and ptger4a and cdh17, where transcripts encoding the latter mark the entire nephron. Asterisks demarcate co-localization between markers. Black bars indicate receptor gene expression domain. Red scale bar, 70 µm.
Figure 4—figure supplement 5
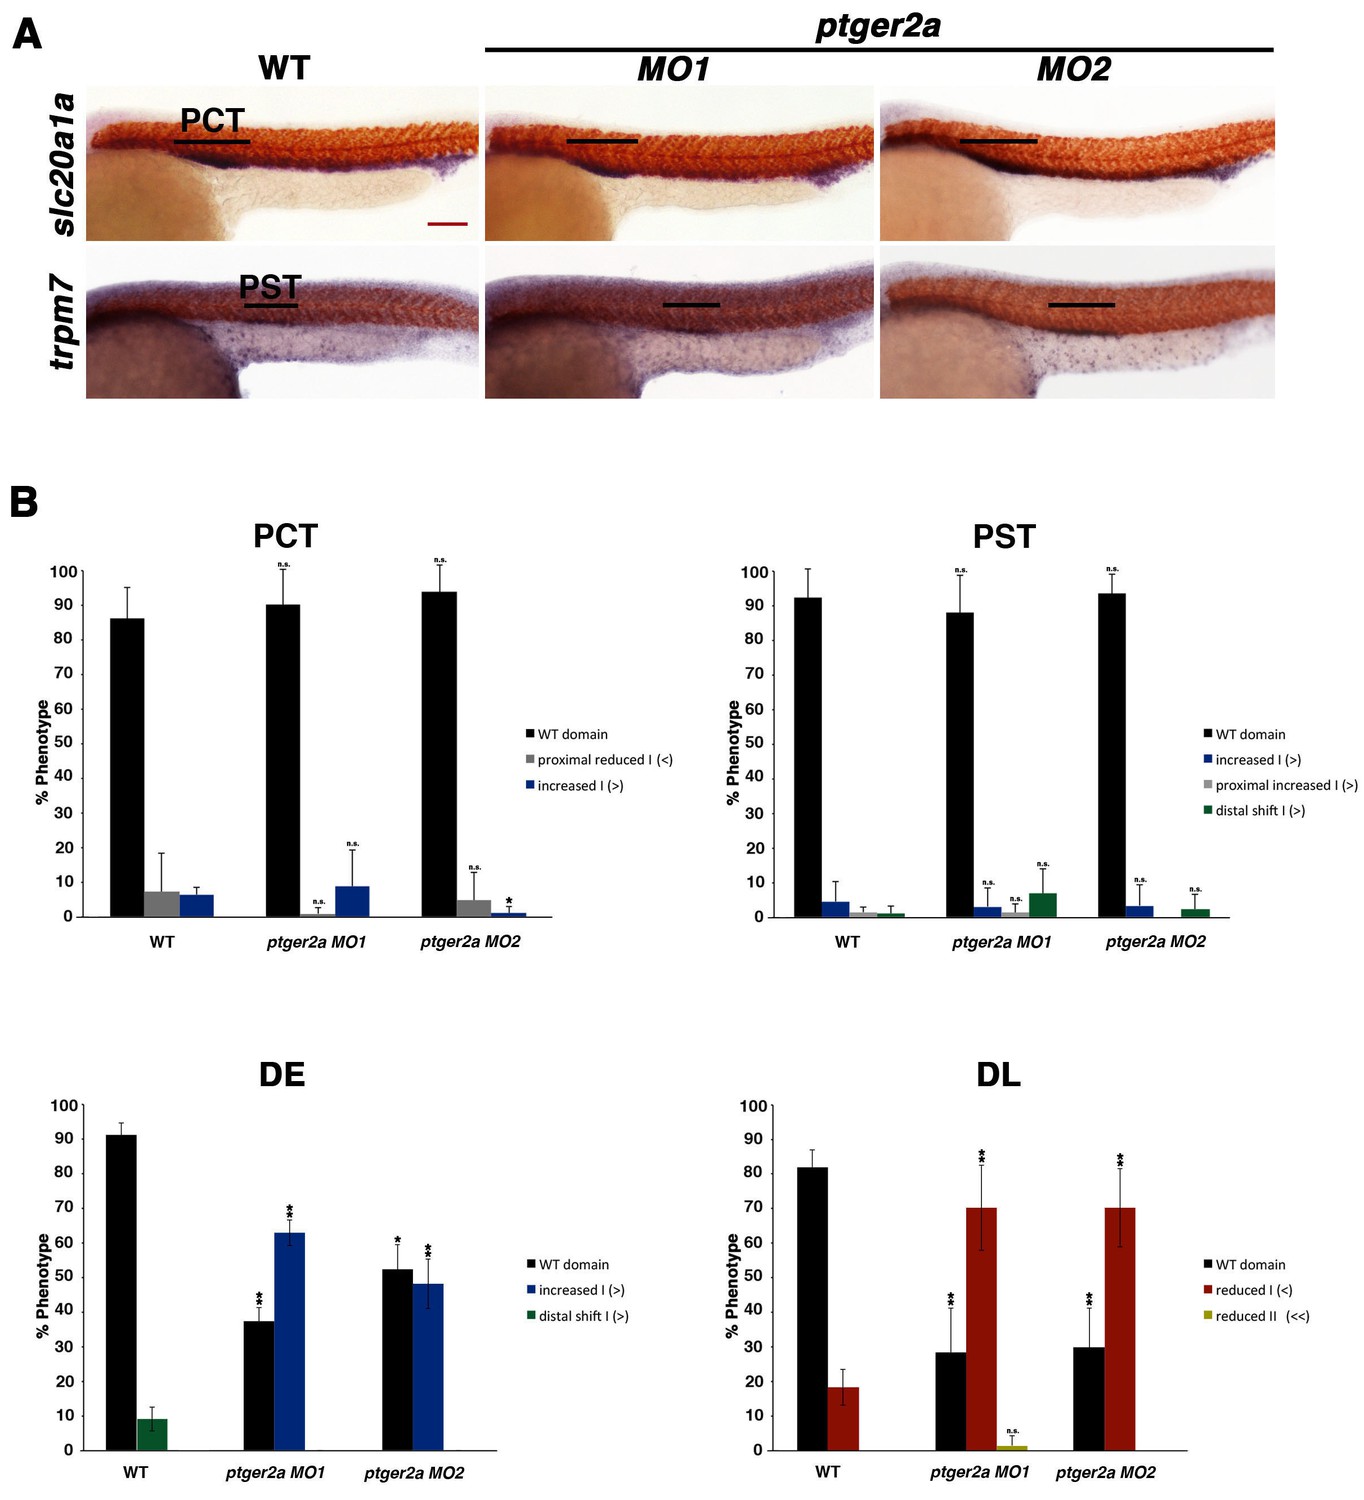
Morpholino inhibition of ptger2a fails to affect proximal segment identity.
(A) Embryos were microinjected with ptger2a MO1 or MO2 and grown until 24 hpf. WISH was used to visualize the PCT (slc20a1a) and PST (trpm7) (purple) and the somites (red) at the 24 hpf stage. Black bars indicate segment gene expression domain. Red scale bar, 70 µm. (B) Segment areas for the PCT, PST, DE, and DL were quantified in triplicate using parallel somites. Greater than (>) and less than (<) were used to categorize embryos, where each (>) or (<) represents the difference of a somite in segment area. At least 20 embryos were used per control and experimental group. Data are represented as ± SD significant by t test comparing each drug treatment to the corresponding DMSO control group, *p<0.05, **p<0.005, where n.s. indicates not significant.
Figure 4—figure supplement 6
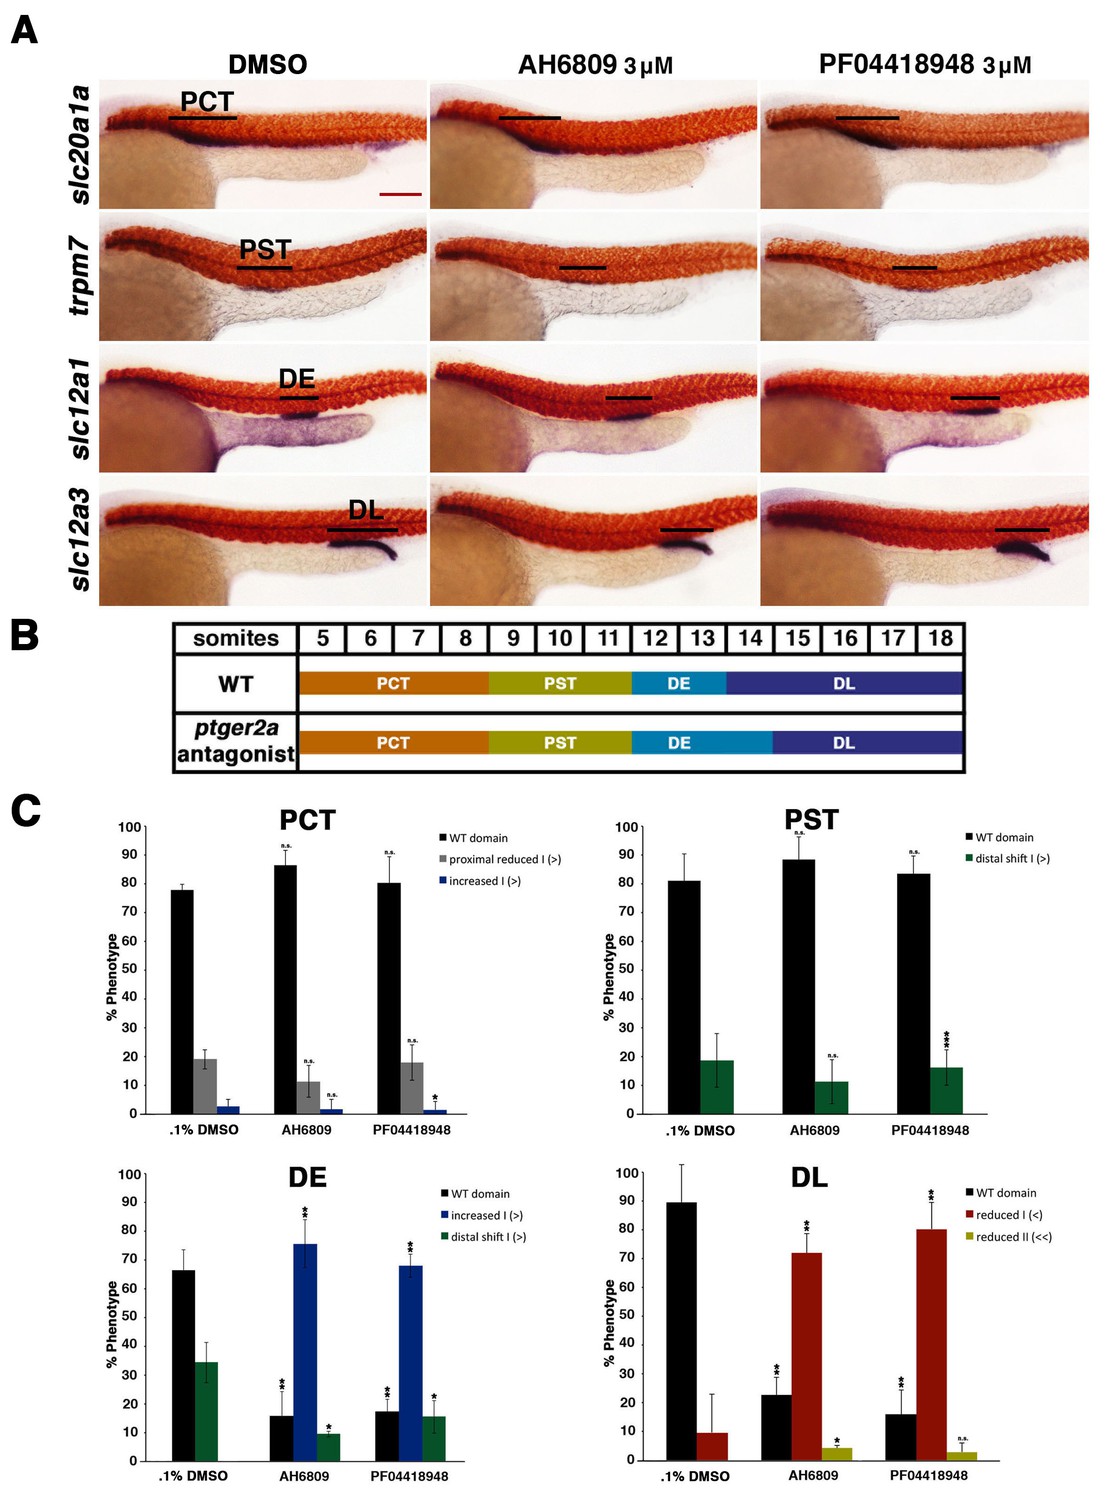
Inhibition of ptger2a using small molecule antagonists promotes distal early fate-choice.
(A) Embryos were exposed to 0.1% DMSO, 3 μM AH6809, or 3 μM PF04418948 from 4 hpf to 24 hpf. WISH was used to stain for the PCT (slc20a1a), PST (trpm7), DE (slc12a1), and DL (slc12a3) (purple) and the somites (smyhc1) (red) at the 24 hpf stage. Black bars indicate segment gene expression domain. Red scale bar, 70 µm. (B) A somite summary schematic describing the changes in patterning caused by ptger2a antagonist treatment. (C) The PCT, PST, DE, and DL segments were quantified per phenotype in triplicate using juxtaposed somites. Greater than (>) and less than (<) were used to categorize embryos, where each (>) or (<) represents the difference of a somite in the pertinent segment area. At least 20 embryos were used for each control and experimental group. Data are represented as ± SD significant by t test comparing each drug treatment to the corresponding DMSO control group, *p<0.05, **p<0.005, ***p<0.0005, where n.s. indicates not significant.
Figure 4—figure supplement 7
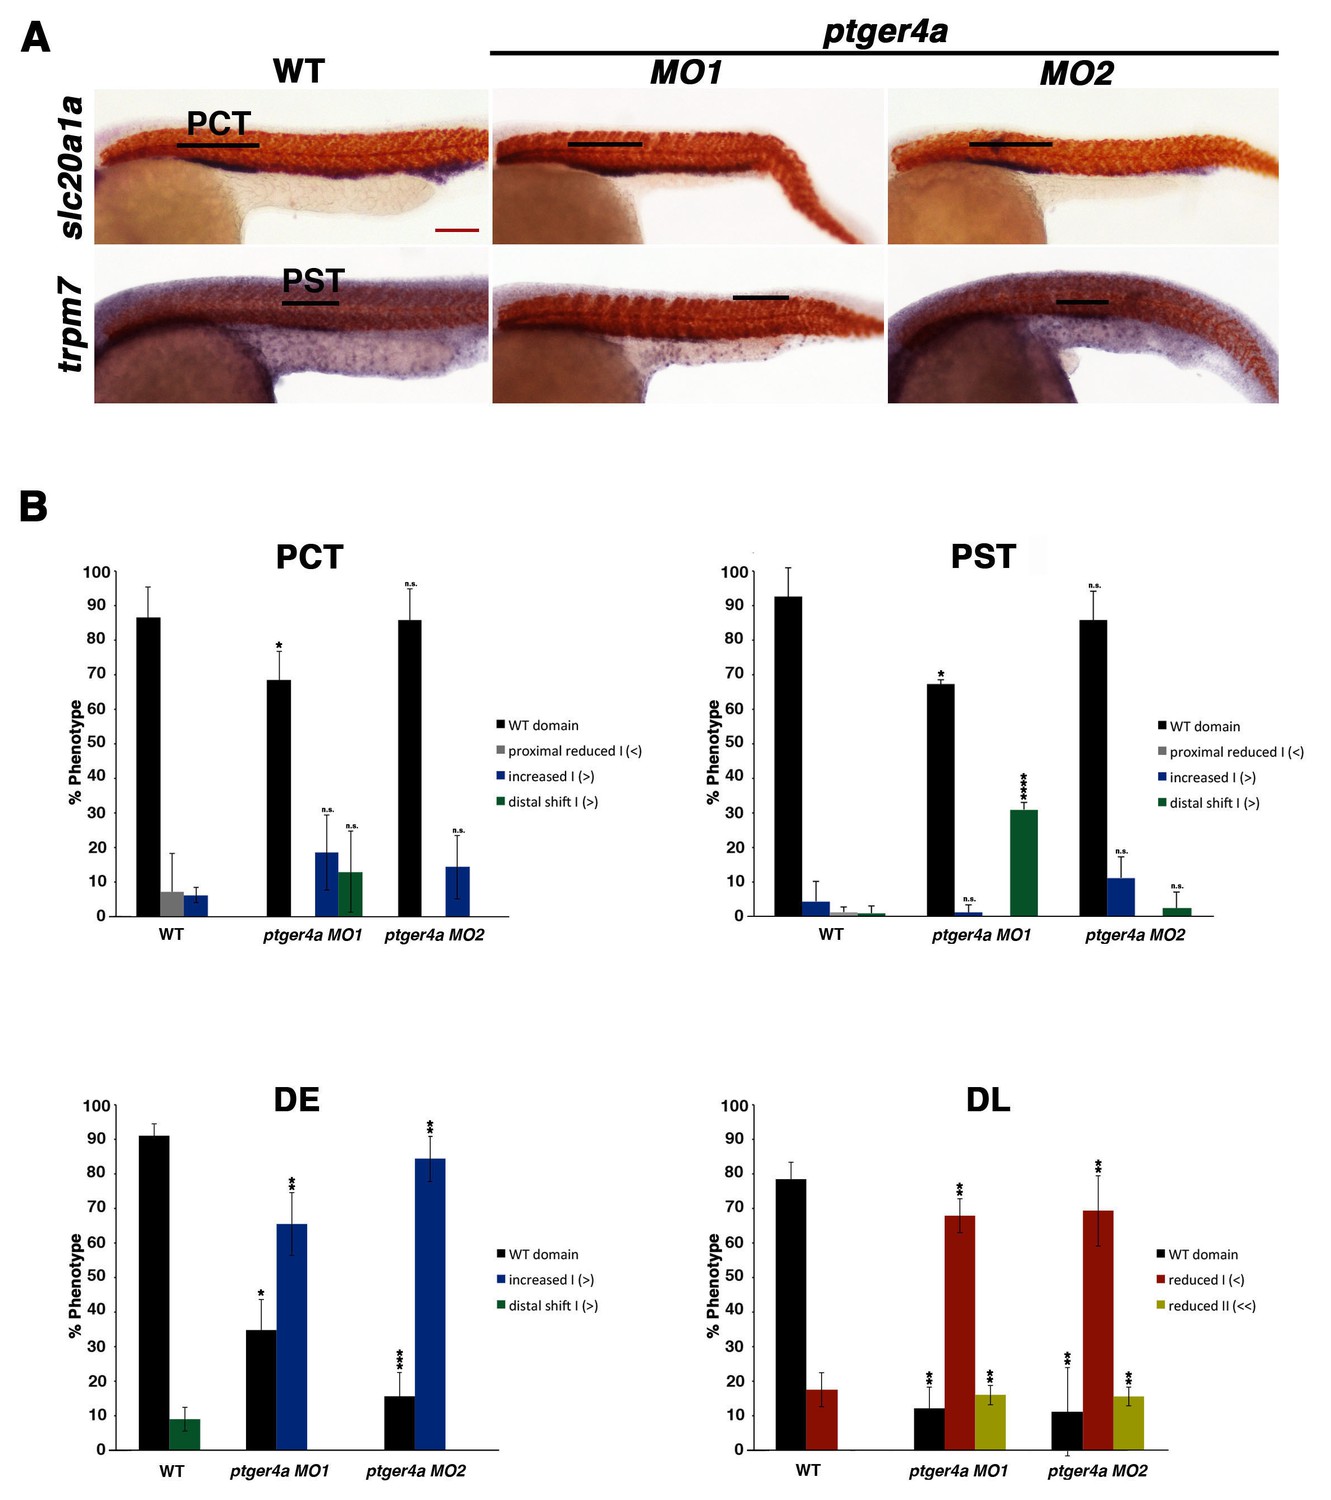
ptger4a MO knockdown results in an expansion of the distal early segment.
(A) Embryos were microinjected with ptger4a MO1 or ptger4a MO2 and grown until 24 hpf. Embryos were stained for the PCT (slc20a1a), PST (trpm7), (purple) and the somites (smyhc1) (red) using WISH at the 24 hpf stage. Black bars indicate segment gene expression domain. Red scale bar, 70 µm. (B) The PCT, PST, DE, and DL were quantified in triplicate using parallel somites to categorize phenotypes. Greater than (>) and less than (<) were used to categorize embryos, where each (>) or (<) represents the difference of a somite in the pertinent segment area. At least 20 embryos were used for each control and experimental group. Data are represented as ± SD significant by t test comparing each drug treatment to the corresponding DMSO control group, *p<0.05, **p<0.005, ***p<0.0005, ****p<0.00005, where n.s. indicates not significant.
Figure 4—figure supplement 8
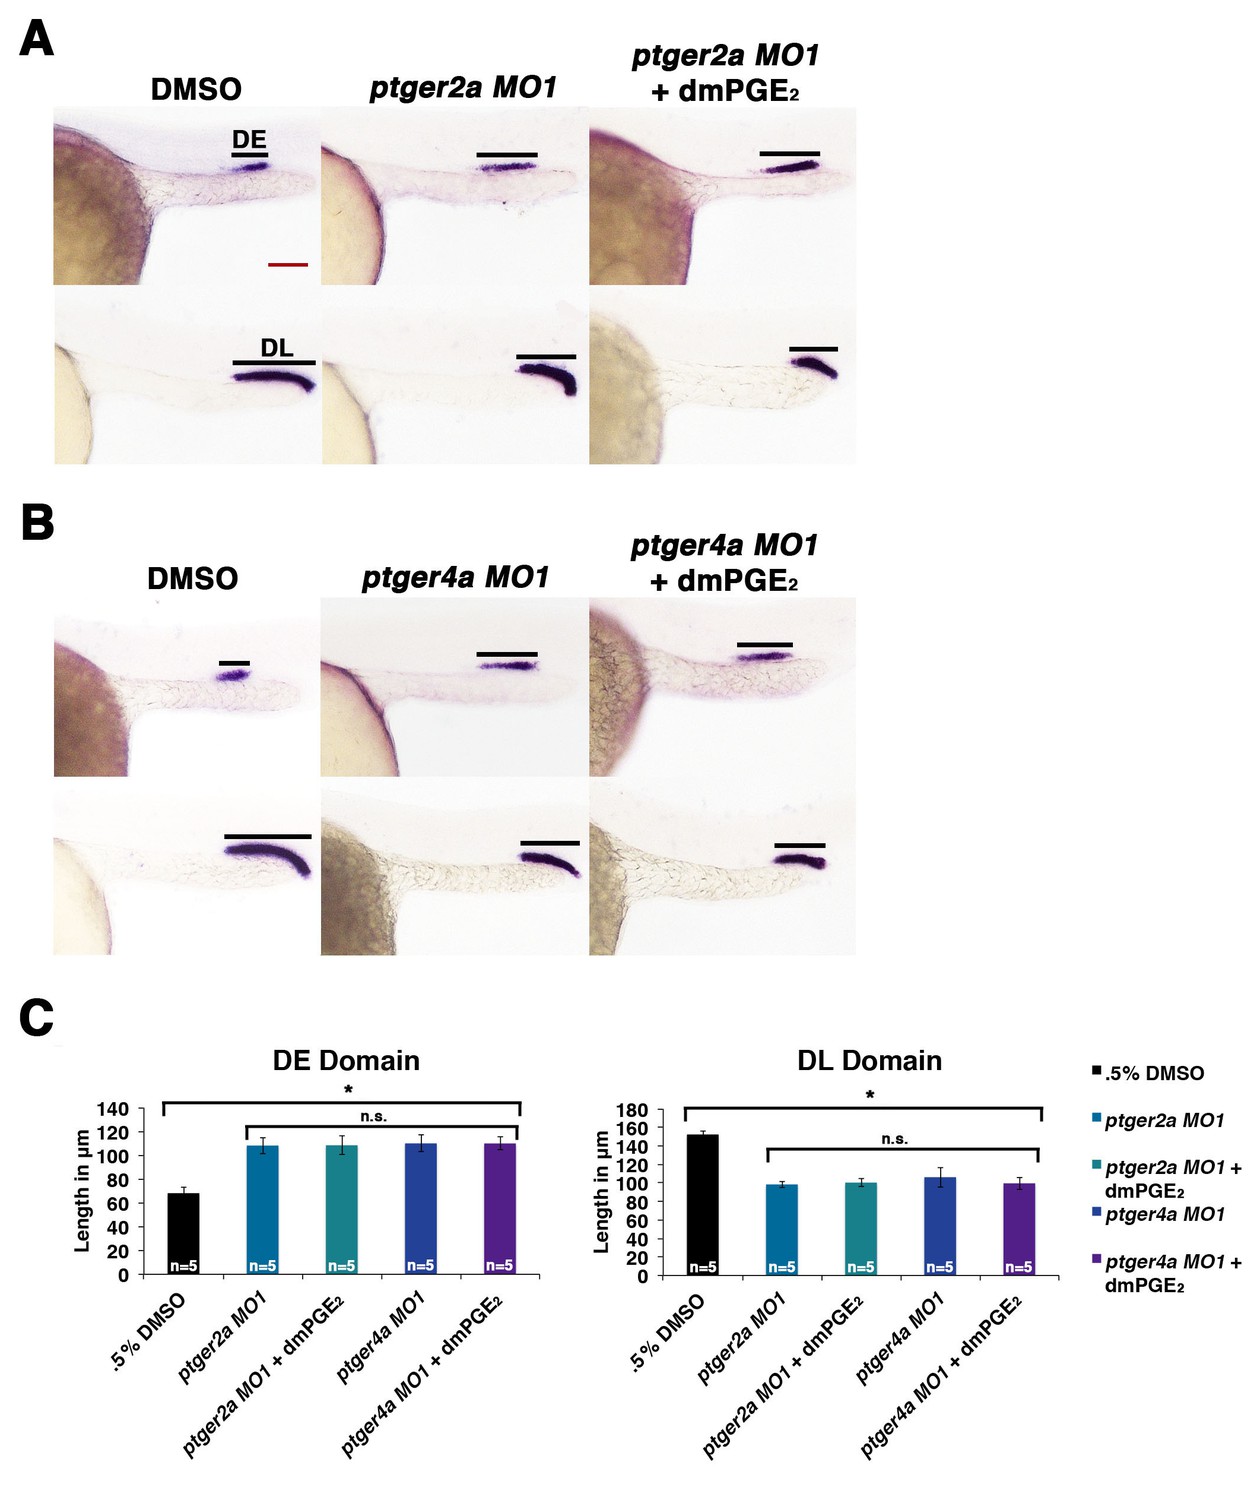
Exogenous dmPGE2 is incapable of rescuing distal cell fates in Ptger2a or Ptger4a deficient morphant embryos.
Embryos were microinjected with either (A) ptger2a MO1 or (B) ptger4a MO1 and treated with. 5% DMSO or 50 μM dmPGE2 from 4 hpf to 24 hpf. WISH was used to label the DE (slc12a1), and DL (slc12a3) (purple) and the somites (smyhc1) (red) at the 24 hpf stage. Black bars indicate segment gene expression domain. Red scale bar, 70 µm. (C) The DE and DL were measured in microns for each control and experimental group (n = 5 for each). Data are represented as ± SD, ANOVA used to compare samples, *p<0.01, where n.s. indicates not significant.
Figure 4—figure supplement 9
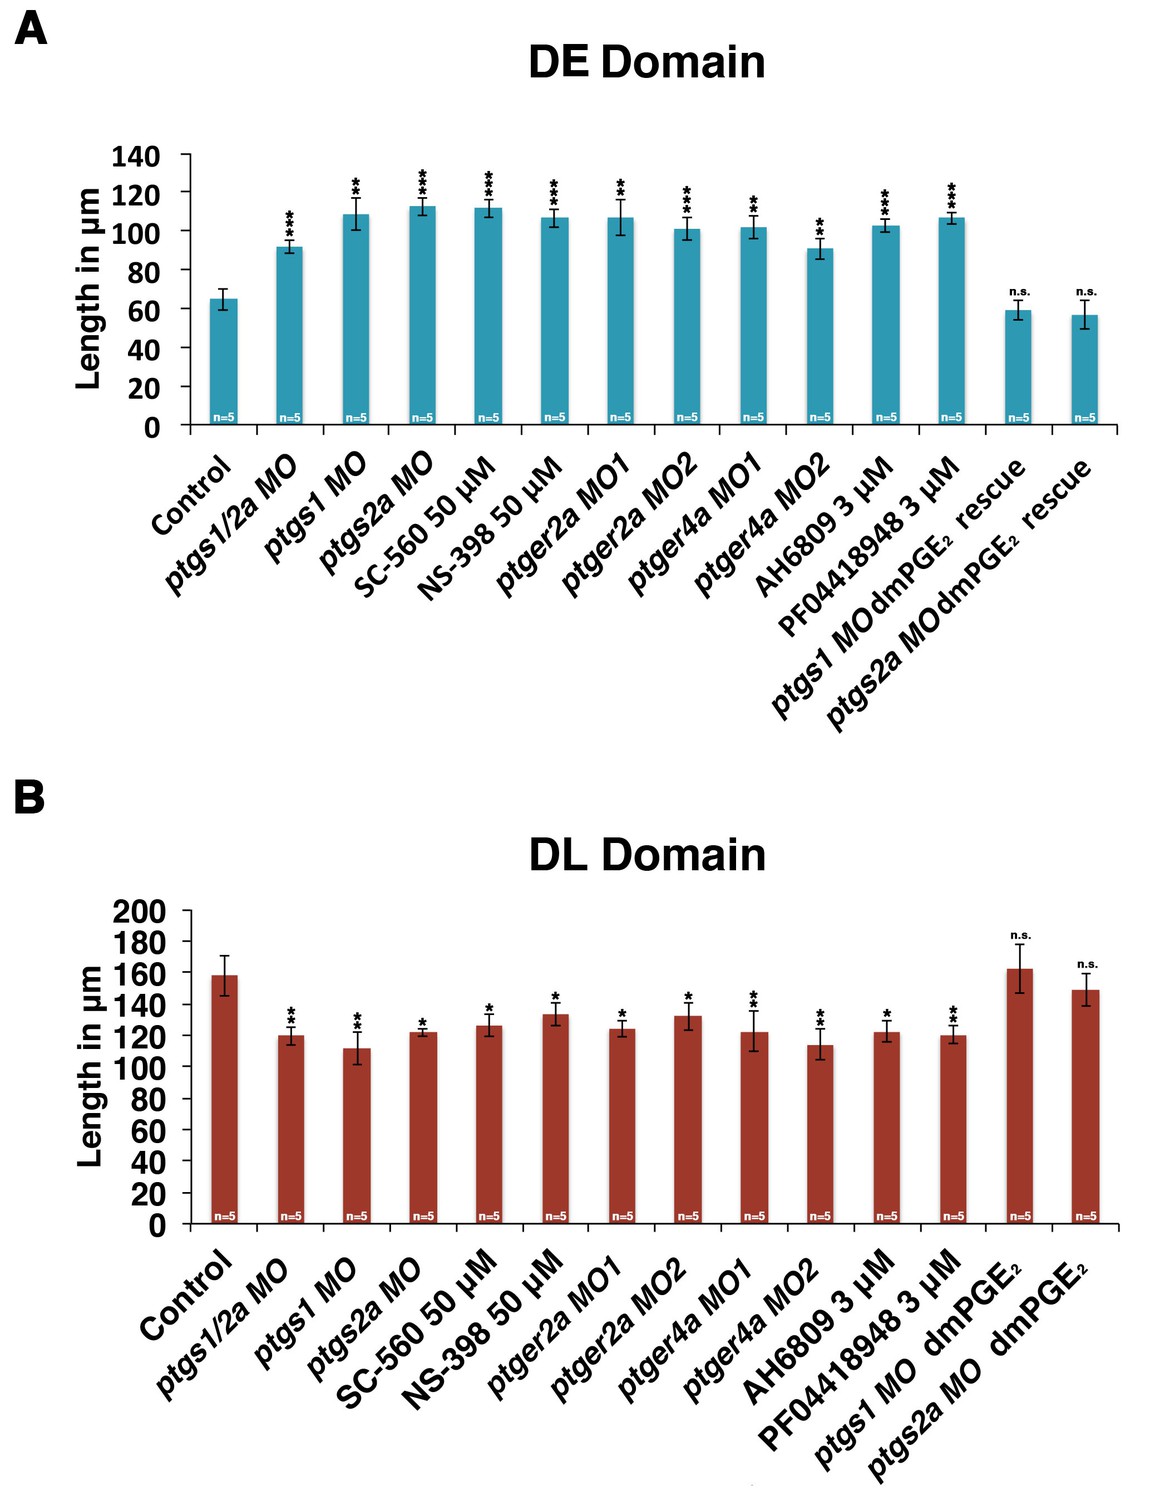
Inhibiting PGE2 production results in an expanded distal early domain at the expense of the distal late segment, which can be rescued by exogenous dmPGE2.
Embryos were microinjected with ptsgs1/2a MO, ptgs1 MO, ptgs2a MO, ptger2a MO1, ptger2a MO2, ptger4a MO1, and ptger4a MO2 and were allowed to develop until 24 hpf. Embryos were also microinjected with ptgs1 MO and ptgs2a MO and treated with 50 μM dmPGE2 from 4 hpf to 24 hpf. Embryos were also subjected to 50 μM SC-560, 50 μM NS-398, 3 μM AH6809, and 3 μM PF04418948 from 4 hpf to 24 hpf. The (A) DE (slc12a1) and (B) DL (slc12a3) domains were measured in microns following WISH (n = 5 for each control an dexperimental group) at the 24 hpf stage. Data are represented as ± SD significant by t test comparing each drug treatment to the corresponding DMSO control group, *p<0.05, **p<0.005, ***p<0.0005, ****p<0.00005, where n.s. indicates not significant.
Figure 4—figure supplement 10
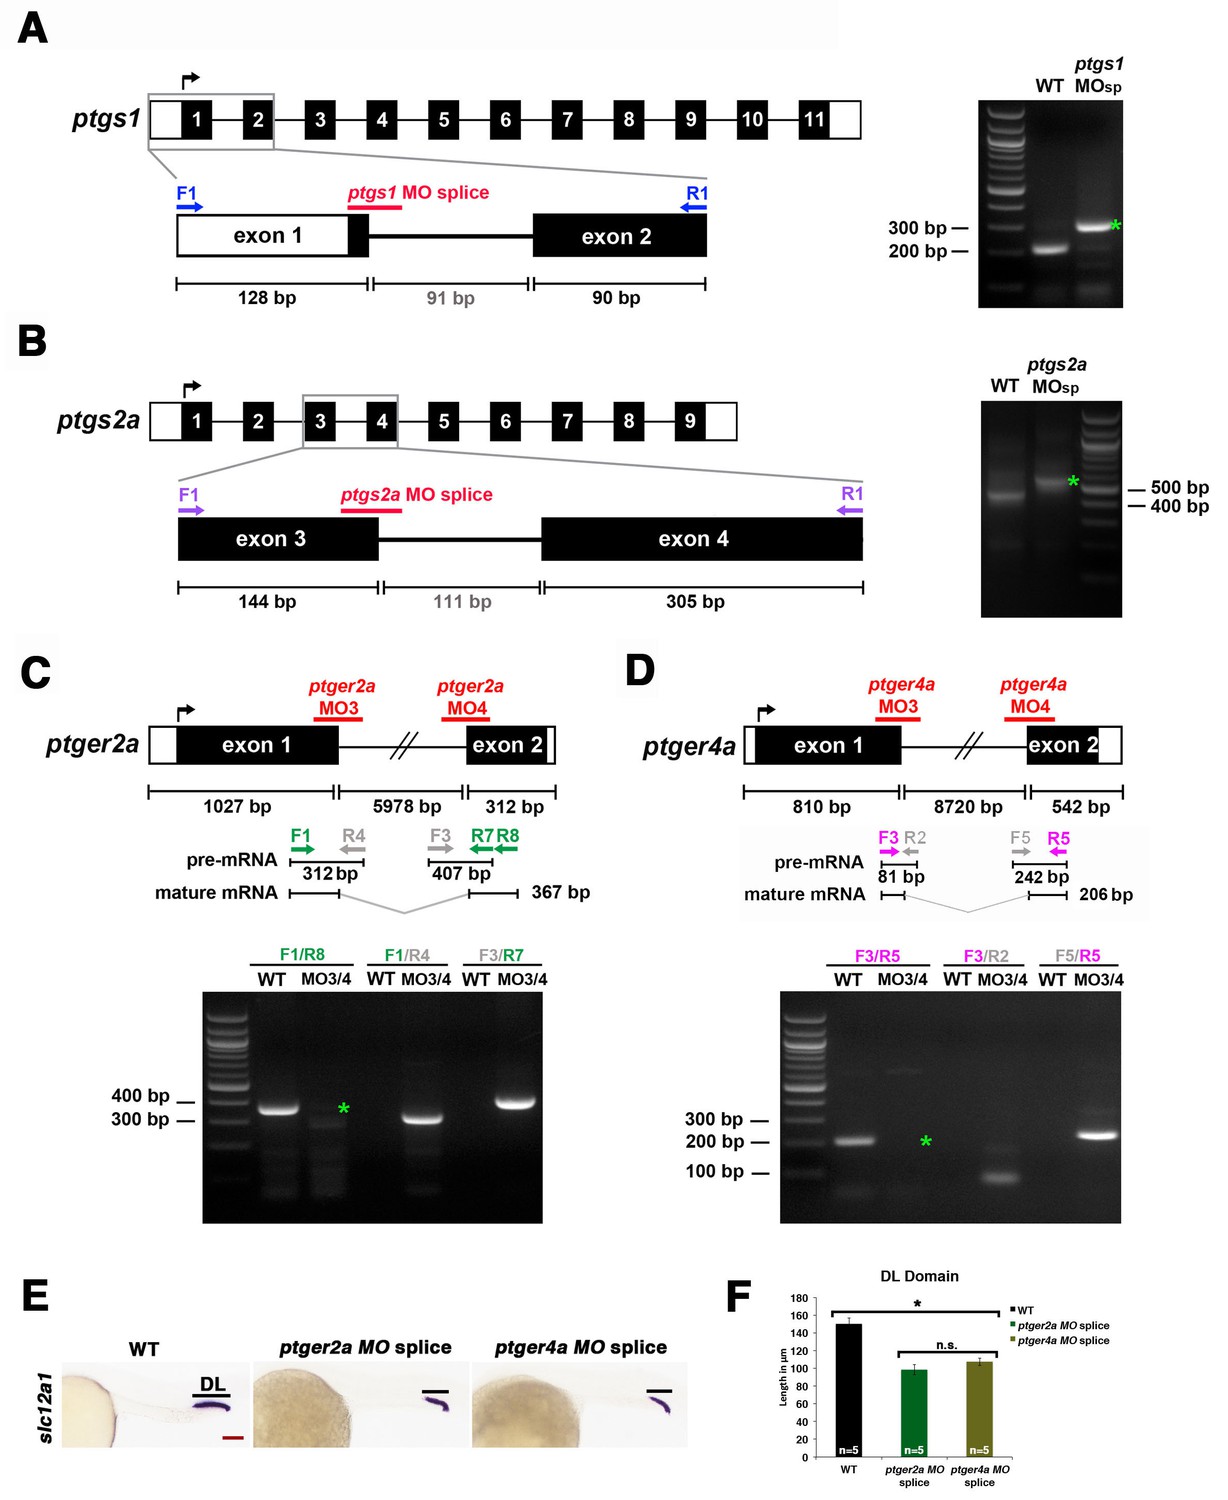
Validation of transcriptional changes using splice morpholinos to target ptgs1, ptgs2a, ptger2a, and ptger4a.
Embryos were microinjected with morpholino and allowed develop until 24 hpf, where their RNA was then harvested for RT-PCR. Schematics illustrate each genetic locus, with the location targeted by the MO(s) and primers used for transcriptional analysis on 2% agarose gels. (A) ptgs1 knockdown targeted the exon one splice donor site, and caused inclusion of the 91 bp intron 1–2 that encodes a premature stop codon in ptgs1 transcripts in morpholino-injected zebrafish. (B) ptgs2a knockdown targeted the exon three splice donor site, and caused inclusion of the 111 bp intron 3–4 that encodes a premature stop codon in ptgs2a transcripts in morpholino-injected zebrafish. (C) ptger2a knockdown as well as (D) ptger4a knockdown targeted the exon one splice donor and exon two splice acceptor site in ptger2a and ptger4a, respectively. Green asterisks in these gel images indicate the complete absence of the WT PCR product in the morphant samples. We were unable to PCR across the entire intron of either gene due to their sizes. However, in contrast to WT samples, we detected ptger2a and ptger4a transcripts that included intronic sequence in the respective morphant samples. In each case, inclusion of the intron is predicted to encode a truncated peptide. (E) Embryos were microinjected at the 1-cell stage with either ptger2a MO splice (MO3/MO4 combination) or the ptger4a MO splice (MO3/MO4 combination) and allowed to developed until 24 hpf, where WISH was used to stain for the DL (slc12a3) segment. Black bars indicate segment gene expression domain. Red scale bar, 70 µm. (F) The DL domain was measured in WT controls, ptger2a MO splice (MO3/MO4 combination) or the ptger4a MO splice (MO3/MO4 combination) in microns (n = 5 for each control and experimental group). Data are represented as ± SD, ANOVA used to compare samples, *p<0.01, where n.s. indicates not significant.
Figure 5 with 1 supplement
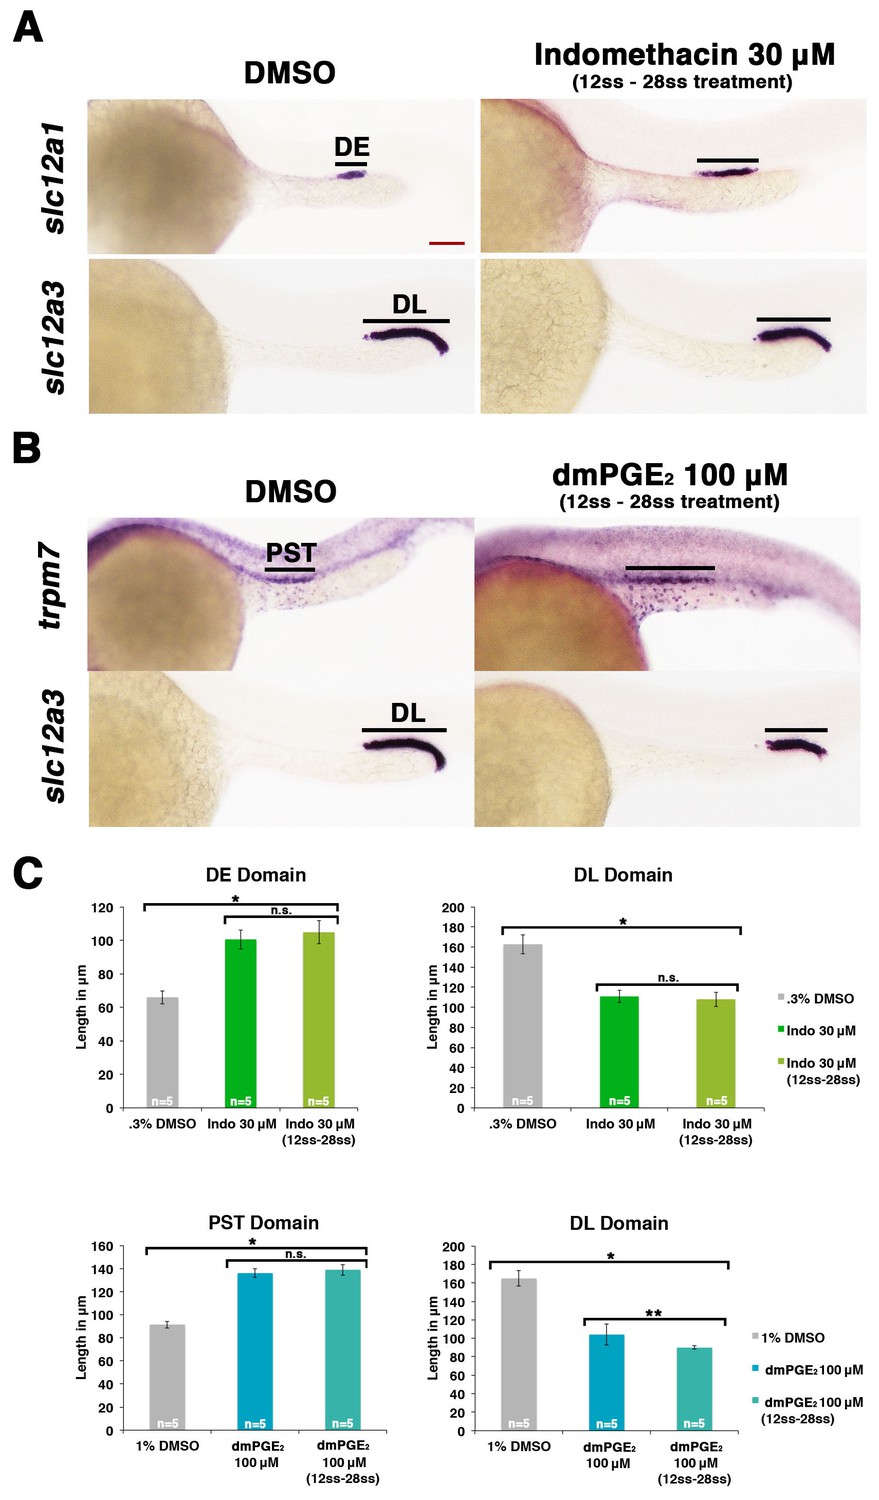
Prostaglandin signaling influences nephron patterning after gastrulation.
Embryos were treated with 0.3% DMSO or 1% DMSO vehicle control, (A) 30 μM indomethacin, or (B) 100 μM dmPGE2 from the 12 ss to the 28 ss and stained for the PST (trpm7), DE (slc12a1), and DL (slc12a3) (purple) using WISH at the 28 ss stage. Black bars indicate segment gene expression domain. Red scale bar, 70 µm. (C) The PST, DE, and DL domains were measured in microns (n = 5 for each control and experimental group). Data are represented as ± SD, ANOVA used to compare samples, *p<0.01, **p<0.05, where n.s. indicates not significant.
Figure 5—figure supplement 1
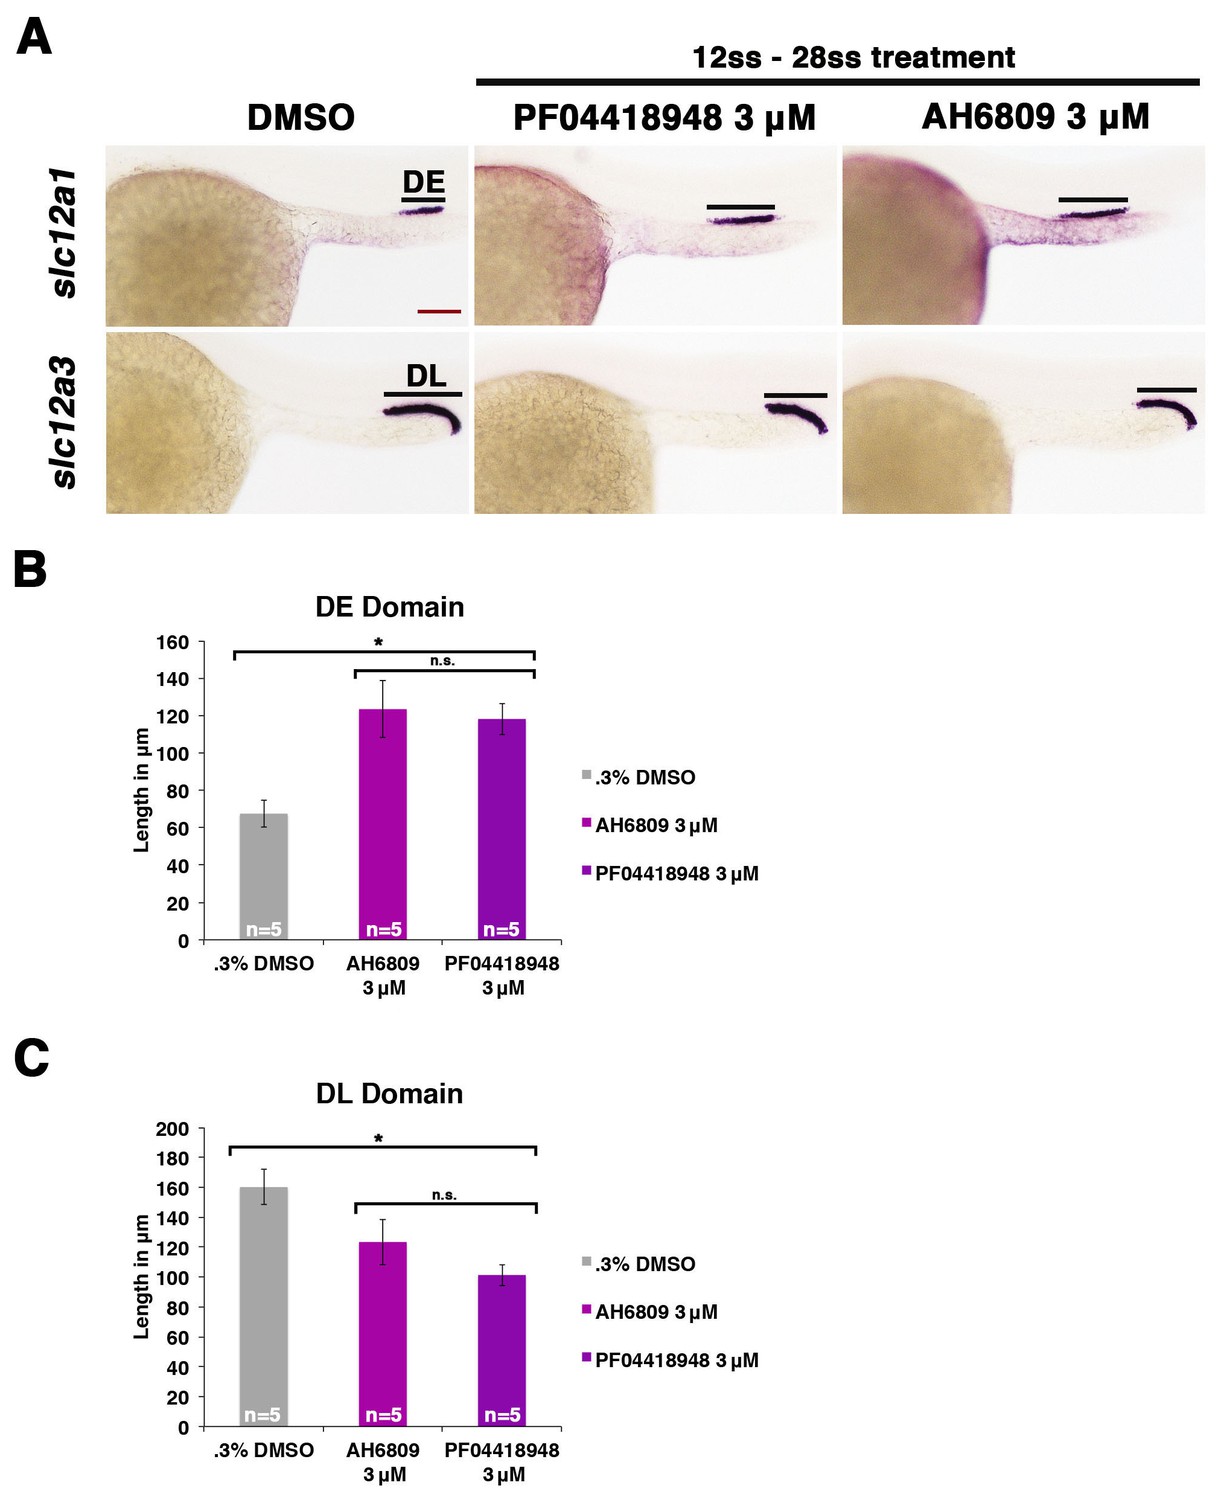
Inhibiting Ptger2a after gastrulation induces an expansion of the distal early and a restriction of the distal late segment.
(A) Embryos were treated with 0.3% DMSO, 3 μM AH6809, or 3 μM PF04418948 from the 12 ss to the 24 hpf, then fixed and stained for the DE (slc12a1) and DL (slc12a3) using WISH at the 24 hpf stage. Black bars indicate segment gene expression domain. Red scale bar, 70 µm. The (B) DE and (C) DL domains were measured in microns (n = 5 for each control and experimental group). Data are represented as ± SD, ANOVA used to compare samples, *p<0.01, where n.s. indicates not significant.
Figure 6 with 1 supplement
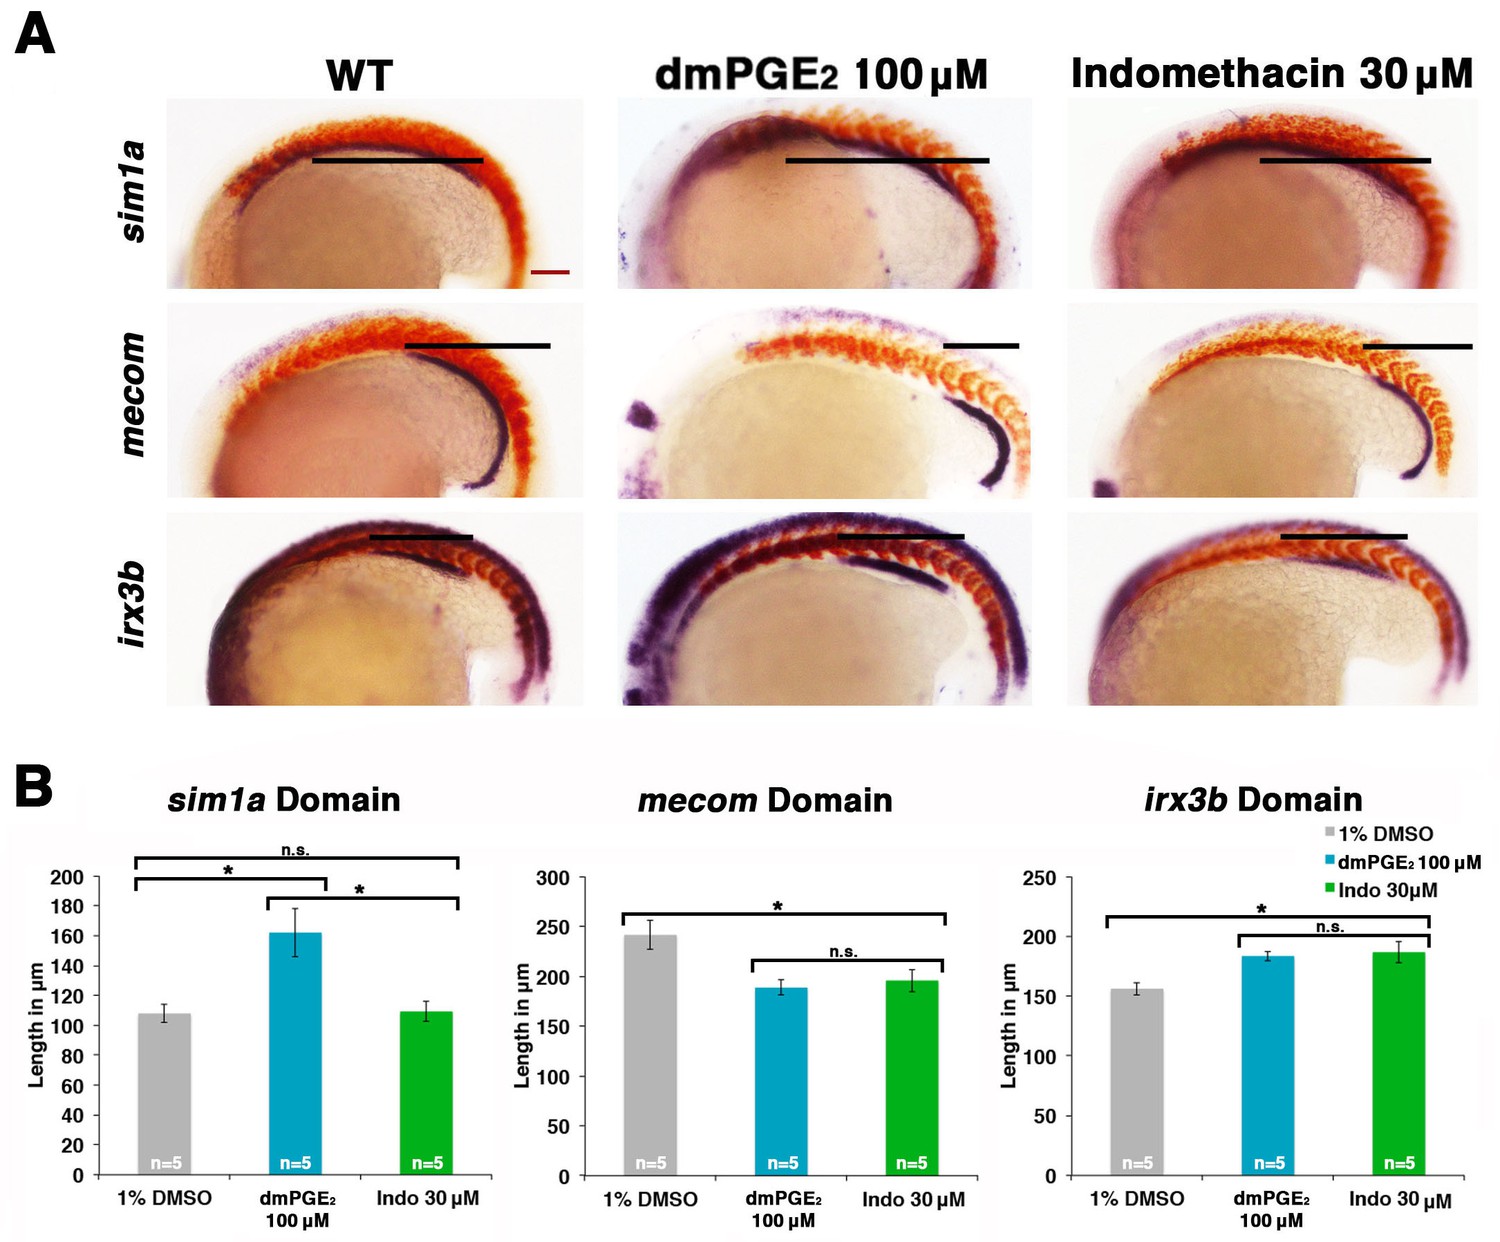
Prostaglandin signaling modulates key nephrogenesis transcription factors.
(A) Embryos were treated with a 1% DMSO control, dmPGE2 at 100 μM, or indomethacin at 30 μM from 4 hpf to the 20 ss. WISH was used to stain for the transcription factors sim1a, mecom, and irx3b (purple) and the somites (red) at the 20 ss stage. Black bars indicate segment gene expression domain. Red scale bar, 70 µm. (B) The sim1a, mecom and irx3b domains were measured in microns (n = 5 for each control and experimental group). Data are represented as ± SD, ANOVA used to compare samples, *p<0.01, where n.s. indicates not significant.
Figure 6—figure supplement 1
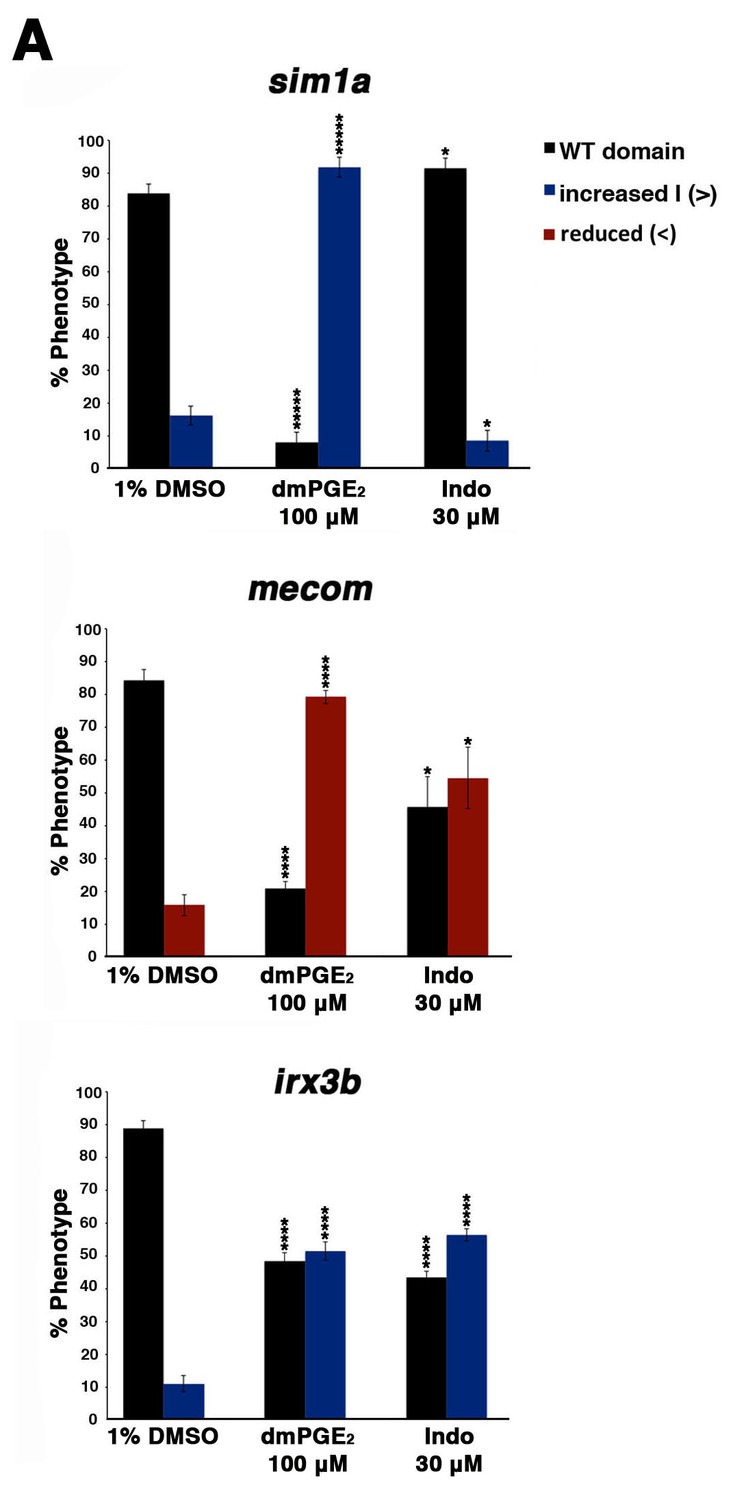
Prostaglandin signaling alters the expression of transcription factors necessary for normal patterning of the nephron.
(A) Embryos were treated with 1% DMSO, 100 μM dmPGE2, and 30 μM indomethacin from 4 hpf to the 20 ss and then stained for sim1a, mecom, and irx3b using WISH. Embryos were categorized into phenotypes using the 1% DMSO treated embryo domains as a reference point, along with juxtaposed somites, to determine changes in expression. At least 15 embryos were used for each control and experimental group. Data are represented as ± SD significant by t test comparing each drug treatment to the corresponding DMSO control group, *p<0.05, ****p<0.00005, *****p<0.000005, where n.s. indicates not significant.
Figure 7 with 2 supplements
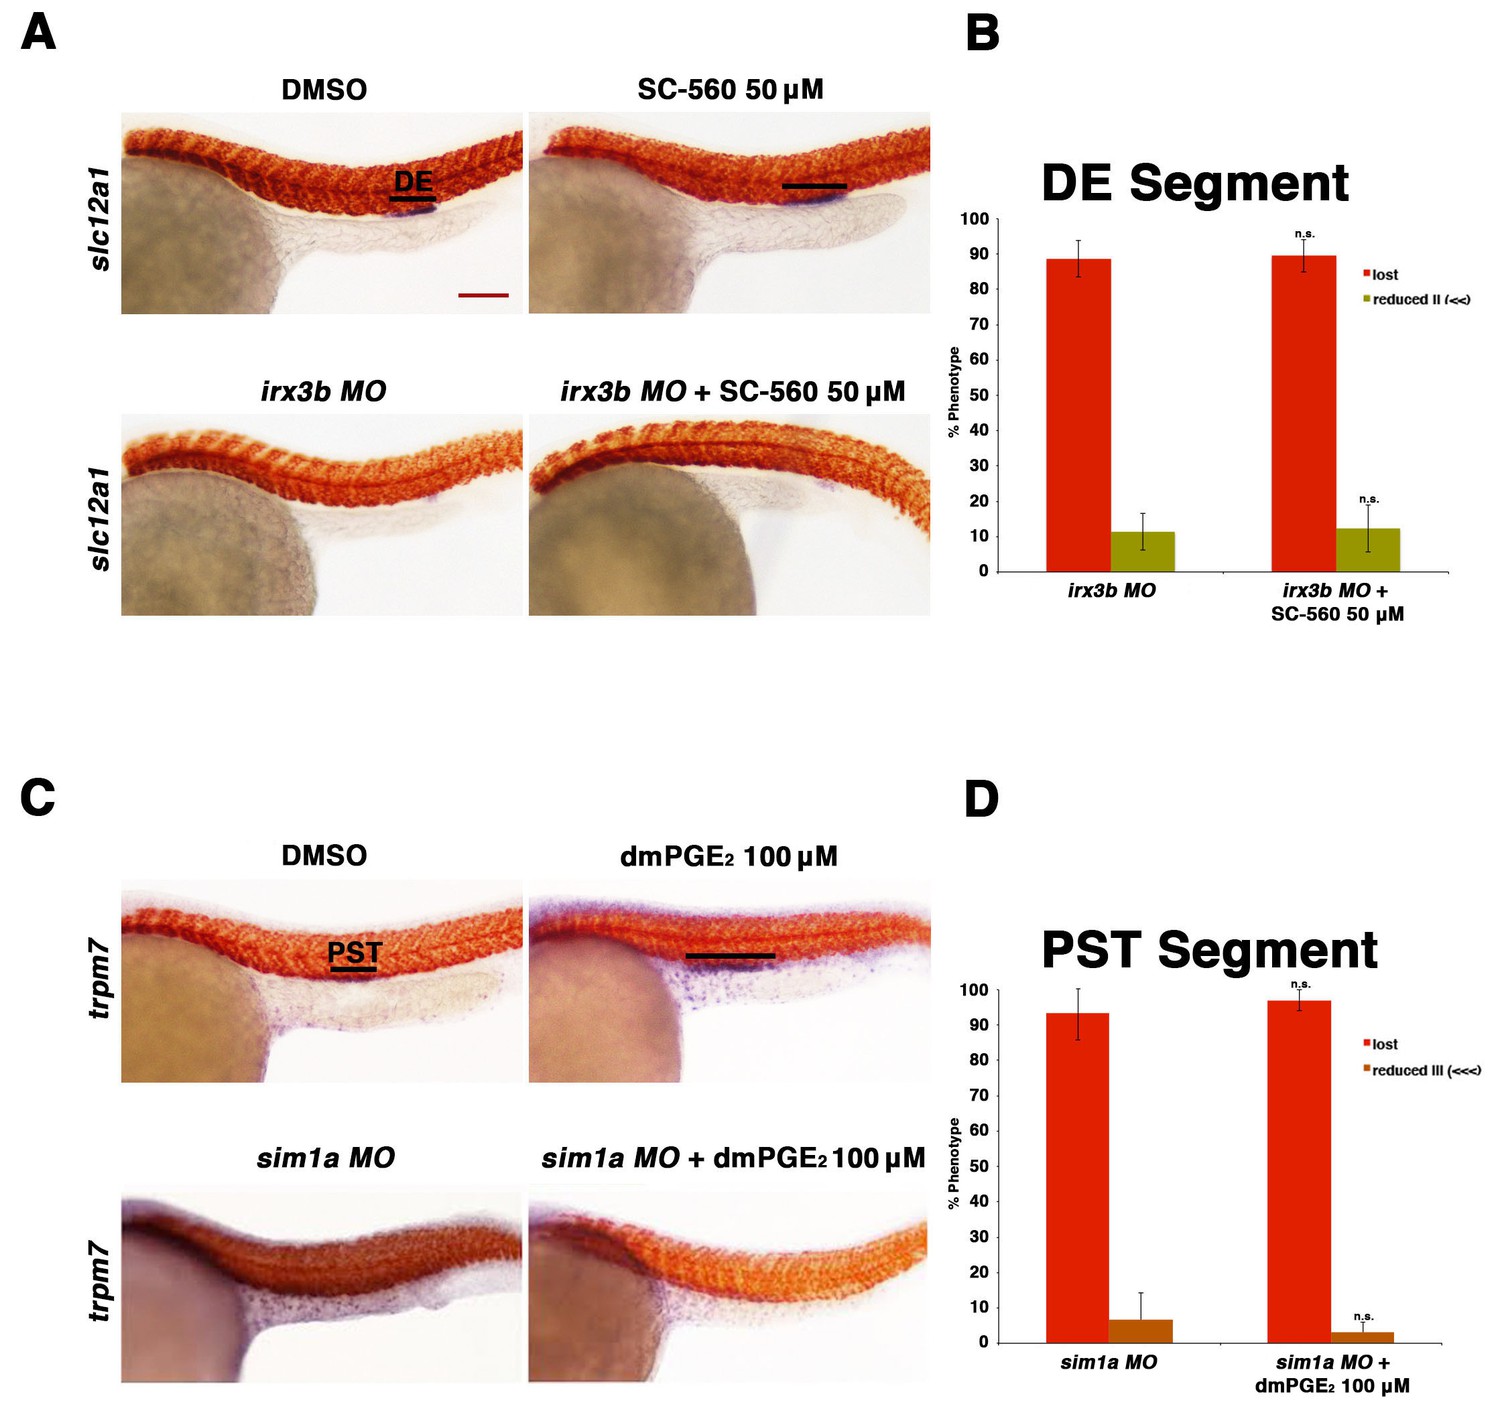
Prostaglandin signaling acts upstream of the transcription factors sim1a and irx3b.
(A) Embryos were microinjected with the irx3b MO and treated with 0.5% DMSO or 50 µM SC-560 from 4 hpf to 24 hpf and stained for the DE using WISH. WT control embryos were also treated with 0.5% DMSO and 50 µM SC-560. (B) The DE (slc12a1) (purple) was stained for using WISH and quantified in triplicate, with at least 20 embryos per control and experimental group, by observing for the presence of the DE segment at the 24 hpf stage. Black bars indicate segment gene expression domain. Red scale bar, 70 µm. (C) Embryos were microinjected with the sim1a MO then treated with either 1% DMSO or 100 µM dmPGE2 from 4 hpf to 24 hpf. 1% DMSO and 100 µM dmPGE2 was also applied to WT control embryos from 4 hpf to 24 hpf. The PST (purple) and somites (red) were then stained for using WISH. (D) Quantification was undertaken in triplicate based on the presence of a PST or lack thereof, with at least 20 embryos per control and experimental group. Data are represented as ± SD, with t tests comparing each drug treatment to the corresponding DMSO control group, where n.s. indicates not significant.
Figure 7—figure supplement 1
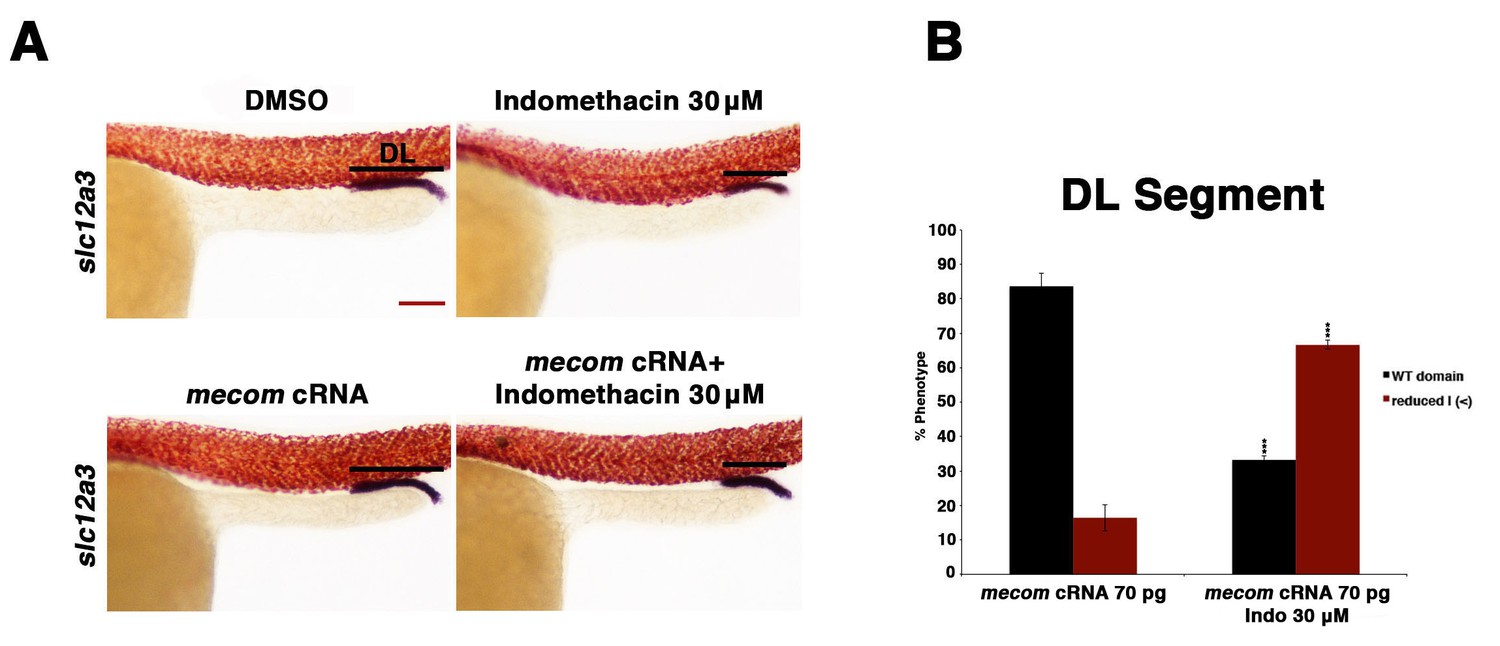
Overexpression of mecom cRNA failed to rescue the distal late segment in indomethacin treated embryos.
(A) Embryos were microinjected with 70 pg of mecom cRNA then treated with either 0.3% DMSO or 30 µM indomethacin from 4 hpf to 24 hpf. Embryos were then stained for the DL (slc12a3) (purple) and the somites (red) using WISH at the 24 hpf stage. Black bars indicate segment gene expression domain. Red scale bar, 70 µm. (B) The DL was quantified in triplicate with at least 20 embryos per control and experimental group by categorizing embryos into phenotypes determined by somites parallel to segment expression. Data are represented as ± SD, significant by t test comparing each drug treatment to the corresponding DMSO control group, ***p<0.0005.
Figure 7—figure supplement 2
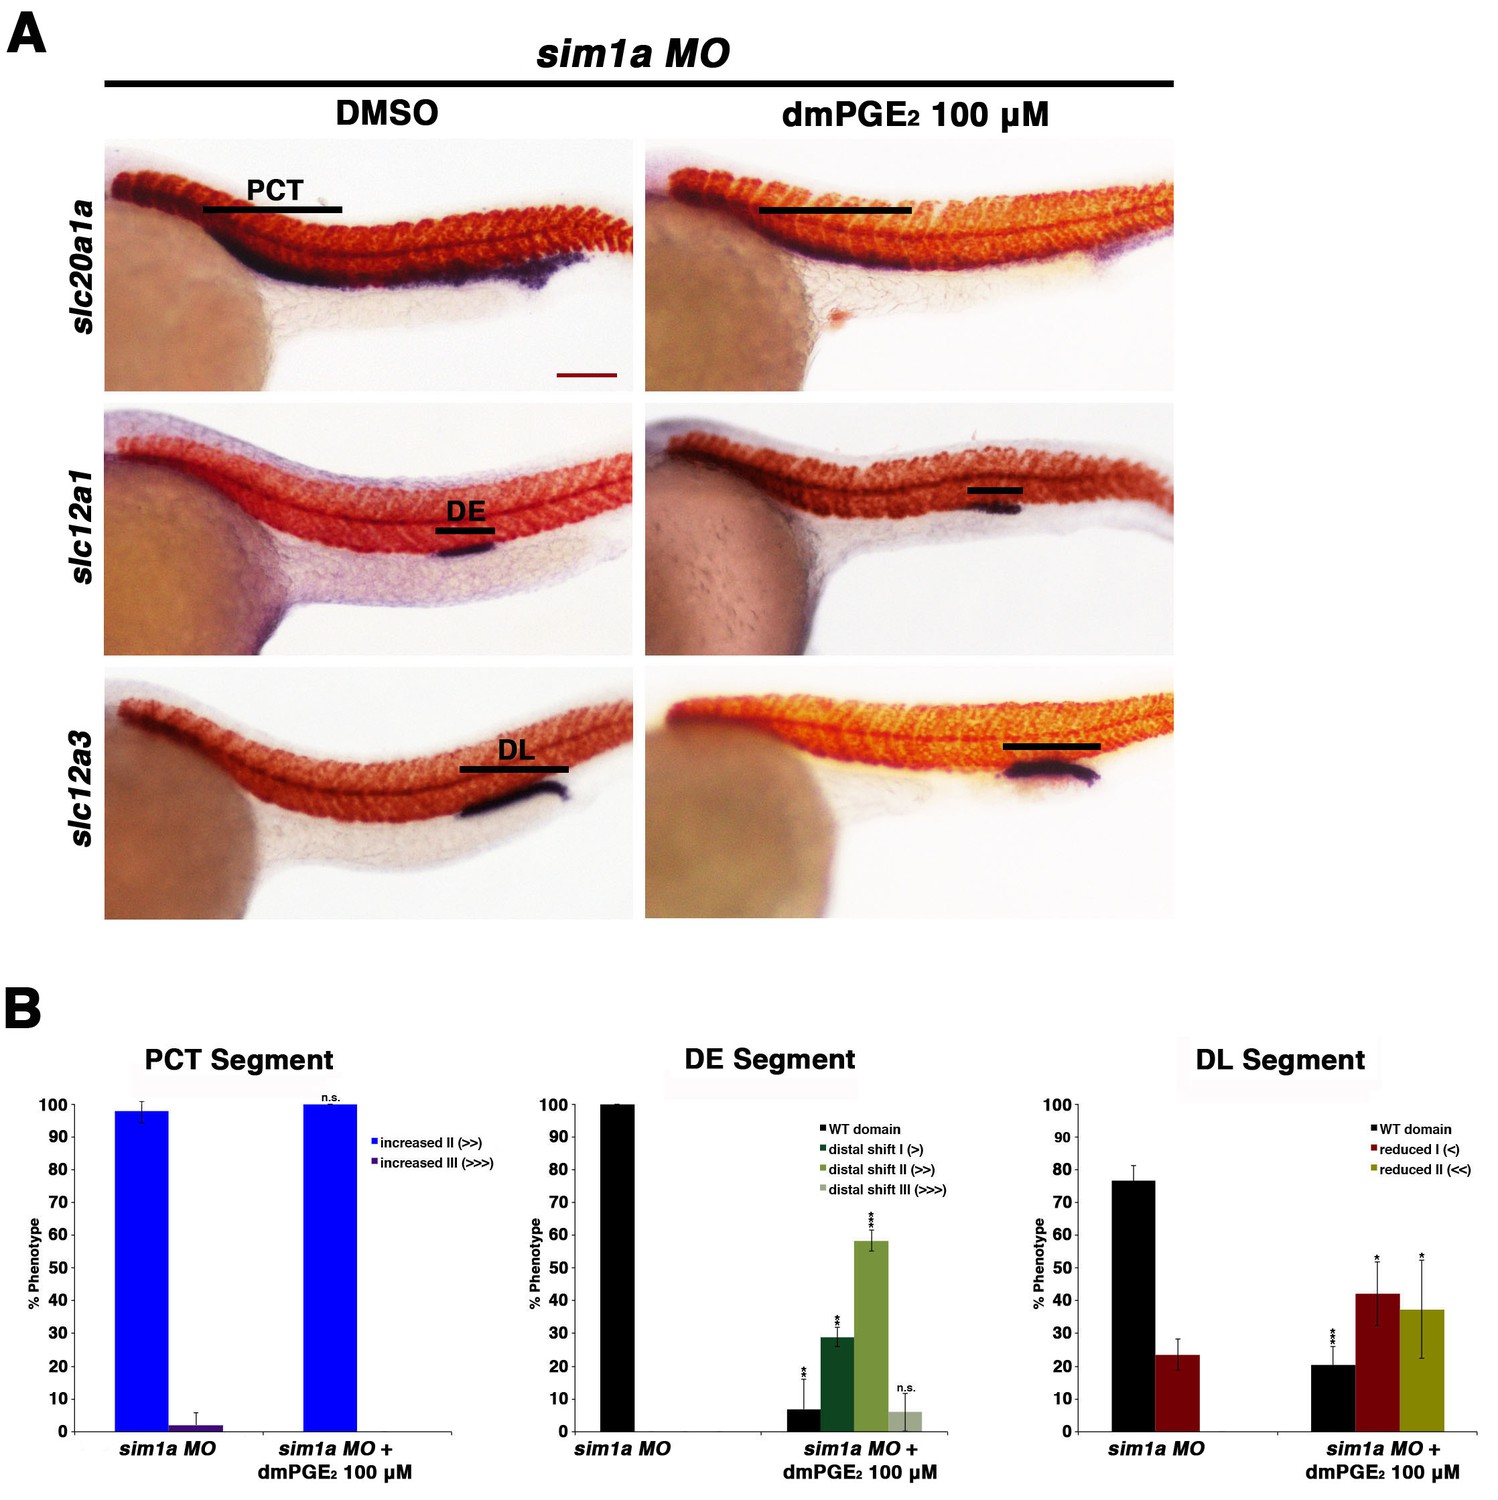
Prostaglandin treatment shifts the distal early and restricts the distal late in sim1a morphants.
(A) Embryos were microinjected with the sim1a MO and treated with 100 µM dmPGE2 or 1% DMSO from 4 hpf to 24 hpf. WISH was then used to label for the PCT (slc20a1a), DE (slc12a1), and DL (slc12a3) (purple) and the somites (smyhc1) (red) at the 24 hpf stage. Black bars indicate segment gene expression domain. Red scale bar, 70 µm. (B) Segments were quantified in triplicate with at least 20 embryos per control and experimental group. Data are represented as ± SD, significant by t test comparing each drug treatment to the corresponding DMSO control group, *p<0.05, **p<0.005, ***p<0.0005, where n.s. indicates not significant.
Figure 8
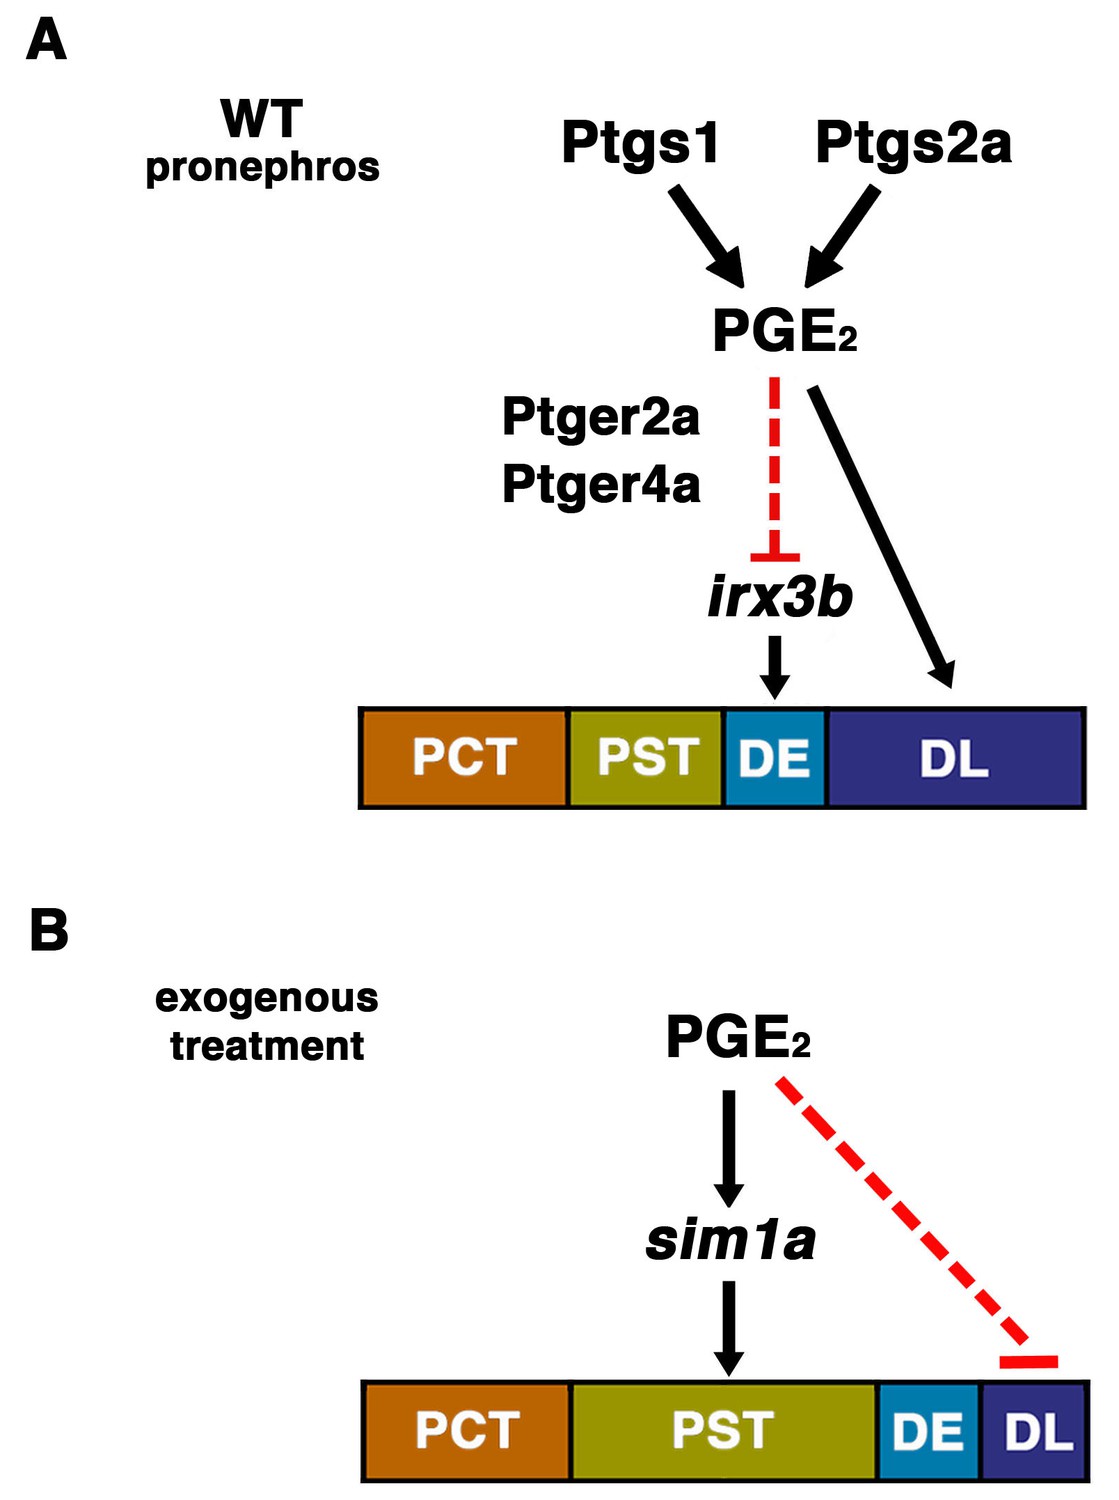
The role of prostaglandin signaling during zebrafish nephrogenesis.
(A) PGE2 is generated by the Ptgs1 and Ptgs2a enzymes, which interact with the Ptger2a and Ptger4a receptors to define the boundaries of the DE by negatively regulating the domain of irx3b expression and promoting DL identity. (B) Exogenous prostaglandin treatment promotes PST identity, partly by regulating sim1a expression, and these alterations occur at the expense of the DL segment. Not depicted: exogenous PGE2 is also associated with an increased irx3b domain, which correlates with the shifted posterior location of the DE in the context of PST expansion. Further, in both (A) and (B), the mecom expression domain is reduced in length, which is likely part of the mechanism underlying the DL segment size reduction in these cases.
Download links
A two-part list of links to download the article, or parts of the article, in various formats.
Downloads (link to download the article as PDF)
Open citations (links to open the citations from this article in various online reference manager services)
Cite this article (links to download the citations from this article in formats compatible with various reference manager tools)
Prostaglandin signaling regulates nephron segment patterning of renal progenitors during zebrafish kidney development
eLife 5:e17551.
https://doi.org/10.7554/eLife.17551


