Replication Study: Coadministration of a tumor-penetrating peptide enhances the efficacy of cancer drugs
- Northwestern University, United States
Figures
Figure 1 with 1 supplement

Tissue specific DOX accumulation.
Mice bearing orthotopic 22Rv1 human prostate tumors were intravenously injected with a mixture of PBS, 10 mg/kg DOX and PBS (DOX + PBS), or 10 mg/kg DOX and 4 µmol/kg of iRGD (DOX + iRGD). One hr later tissues were harvested and DOX was quantified by spectrophotometry using absorbance at 490 nm. Tissues from DOX + PBS and DOX + iRGD treated mice [n=4 for both conditions] were examined for DOX accumulation using matched tissues from mice injected with PBS [n=2] as the blank reference samples. DOX accumulation for each tissue was normalized to the mean absorbance of that same tissue type treated with 10 mg/kg DOX and PBS. Means reported and error bars represent s.e.m. Unpaired two-tailed Student's t-test between DOX + PBS and DOX + iRGD for prostate tumor tissue; t(6) = 0.352, p=0.737, with a priori alpha level = 0.05. Additional details for this experiment can be found at https://osf.io/d4zeg/.
Figure 1—figure supplement 1
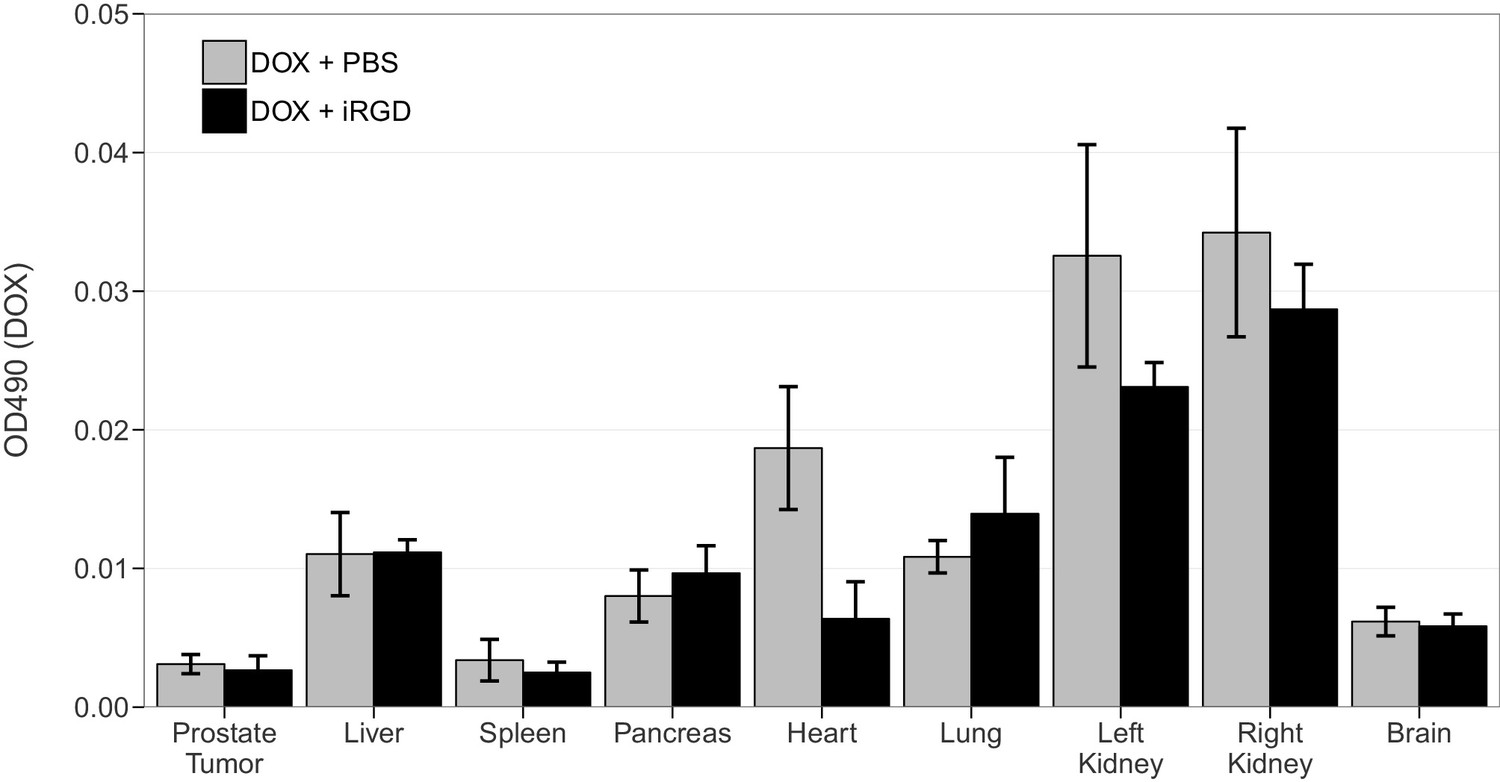
This is the same experiment as in Figure 1, but with the OD490 readings plotted for each condition instead of the OD490 relative to DOX + PBS for each tissue.
Mice bearing orthotopic 22Rv1 human prostate tumors were intravenously injected with a mixture of 10 mg/kg DOX and PBS (DOX + PBS), or 10 mg/kg DOX and 4 µmol/kg of iRGD (DOX + iRGD). One hr later tissues were harvested and DOX was quantified by spectrophotometry using absorbance at 490 nm. Means reported and error bars represent s.e.m. Number of mice per condition (n=4). Additional details for this experiment can be found at https://osf.io/d4zeg/.
Figure 2
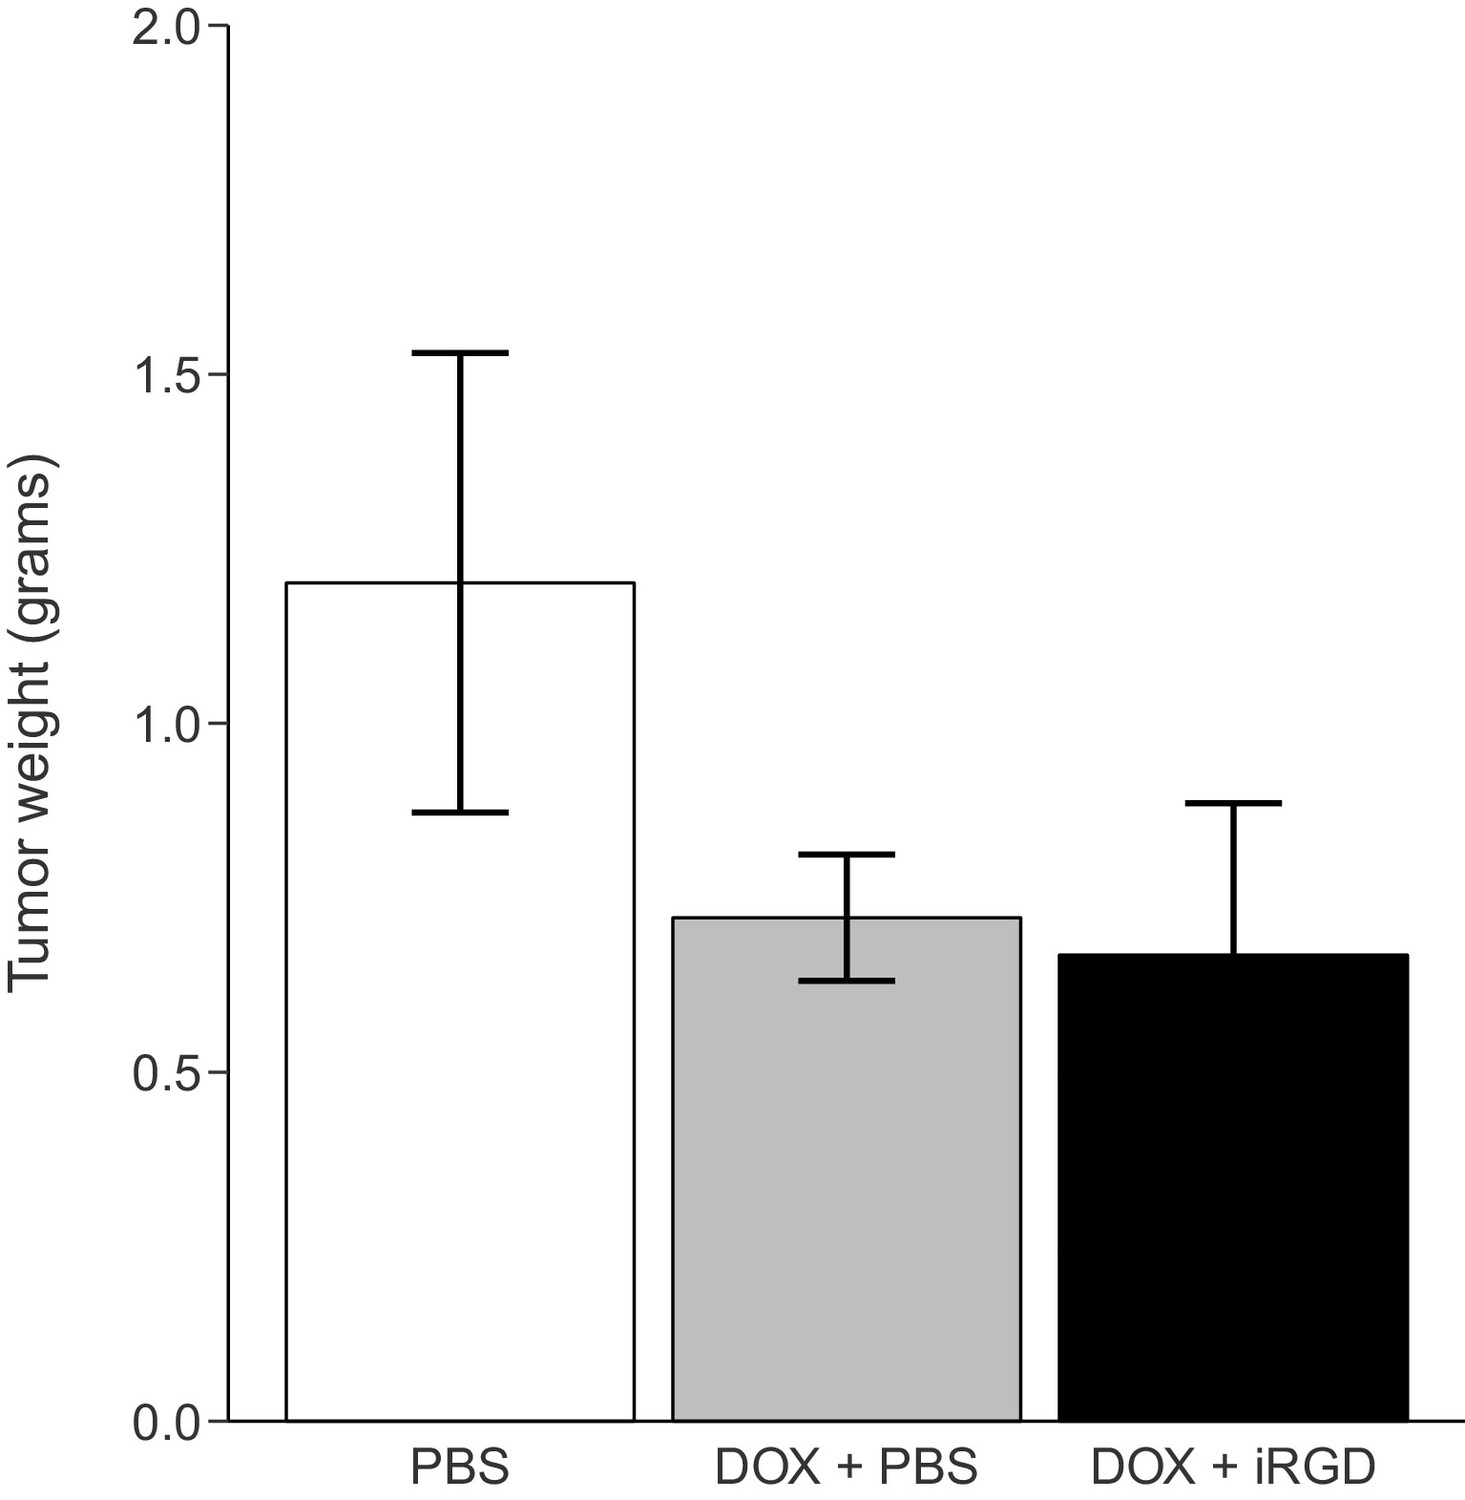
Tumor weight following treatment.
Mice harboring orthotopic 22Rv1 human prostate tumors were intravenously injected with PBS alone (PBS), 1 mg/kg DOX and PBS (DOX + PBS), or 1 mg/kg DOX and 4 µmol/kg iRGD (DOX + iRGD). Mice were treated every other day for 24 days and 1 hr after the last treatment tumors were harvested and weighed. Means reported and error bars represent s.e.m. Number of mice per condition (n=7; n=21 mice total). One-way ANOVA on tumor weights of all groups; F(2, 18) = 1.58, p=0.233. Two-tailed Welch's t-test between DOX + PBS and DOX + iRGD; t(8.01) = 0.227, p=0.826, with a priori alpha level = 0.05. Additional details for this experiment can be found at https://osf.io/kwh39/.
Figure 3 with 1 supplement
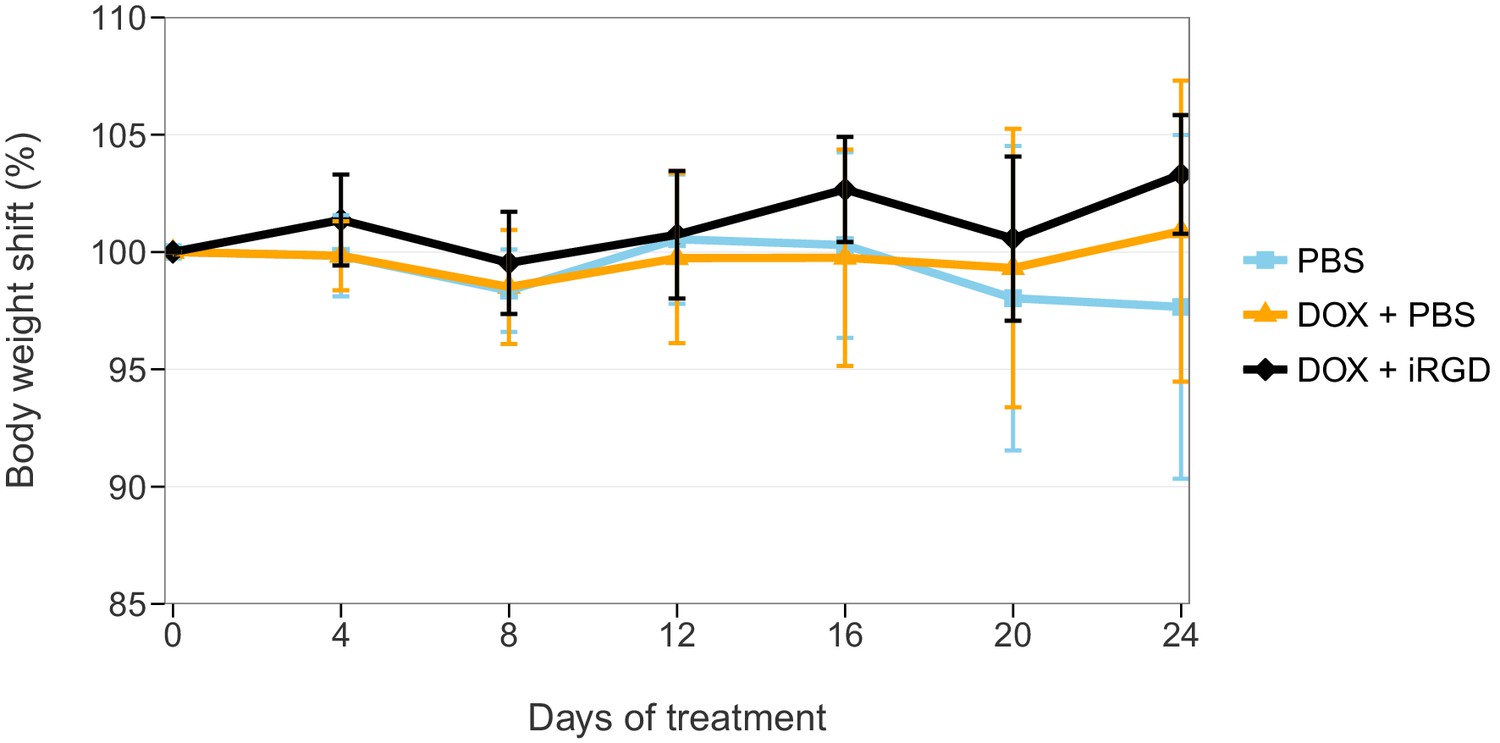
Body weight shift of mice during treatment.
Mice bearing orthotopic 22Rv1 human prostate tumors were intravenously injected with PBS alone (PBS), 1 mg/kg DOX and PBS (DOX + PBS), or 1 mg/kg DOX and 4 µmol/kg of iRGD (DOX + iRGD). Mice were treated every other day for 24 days with total body weight measured every four days during the treatment. On day 0 body weight was considered 100% for each animal. Means reported and error bars represent SD. Number of mice per condition (n=7; n=21 mice total). One-way ANOVA on percent body weight shift of all groups on day 24; F(2, 18) = 1.666, p=0.217. Additional details for this experiment can be found at https://osf.io/kwh39/.
Figure 3—figure supplement 1
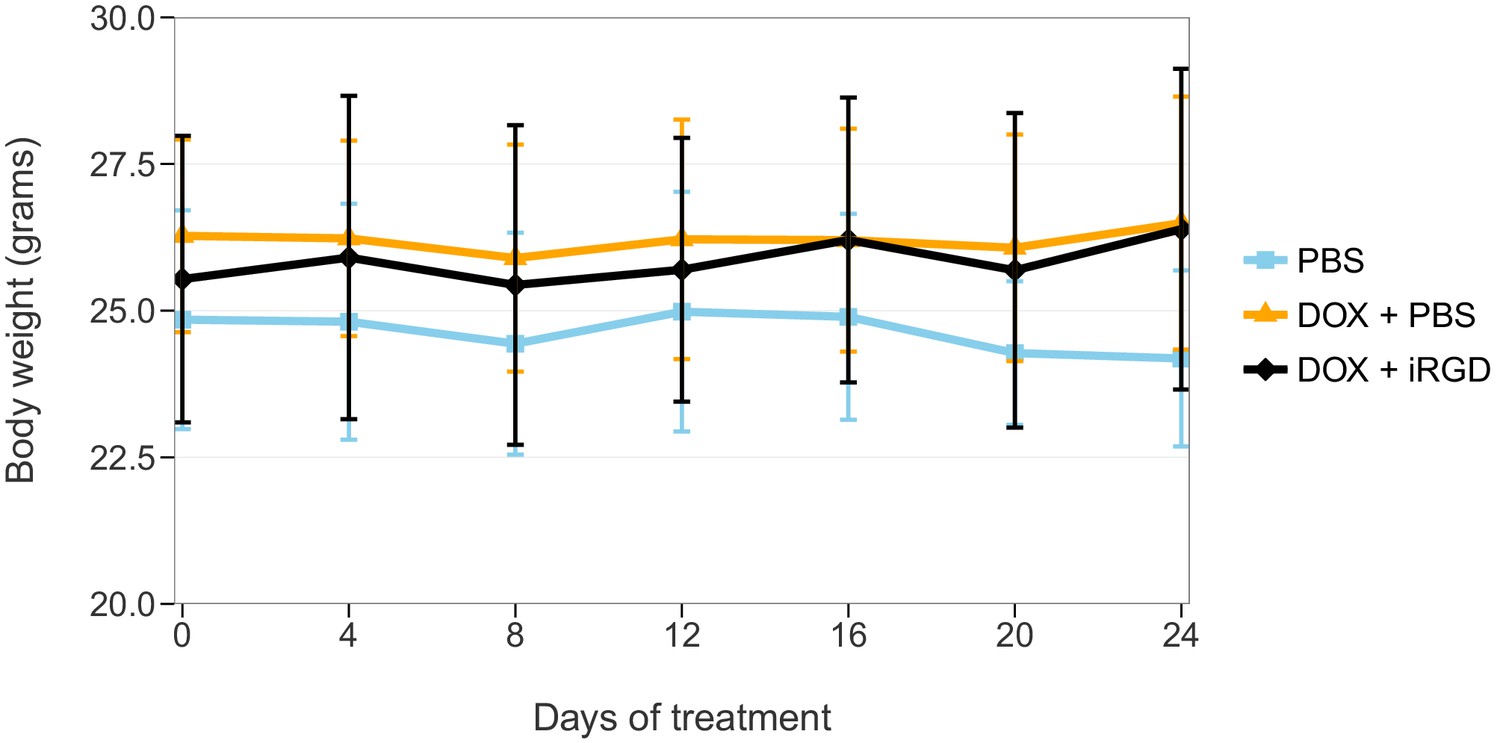
Total body weight during treatment.
This is the same experiment as in Figure 3, but with the mouse weights plotted for each condition instead of body weight shift. Mice bearing orthotopic 22Rv1 human prostate tumors were intravenously injected with PBS alone (PBS), 1 mg/kg DOX and PBS (DOX + PBS), or 1 mg/kg DOX and 4 µmol/kg of iRGD (DOX + iRGD). Mice were treated every other day for 24 days with total body weight measured every four days during the treatment. Means reported and error bars represent SD. Number of mice per condition (n=7; n=21 mice total). One-way ANOVA on area under the curve (AUC) of body weight over the entire curve of all groups; F(2, 18) = 1.072, p=0.363. Additional details for this experiment can be found at https://osf.io/kwh39/.
Figure 4 with 1 supplement
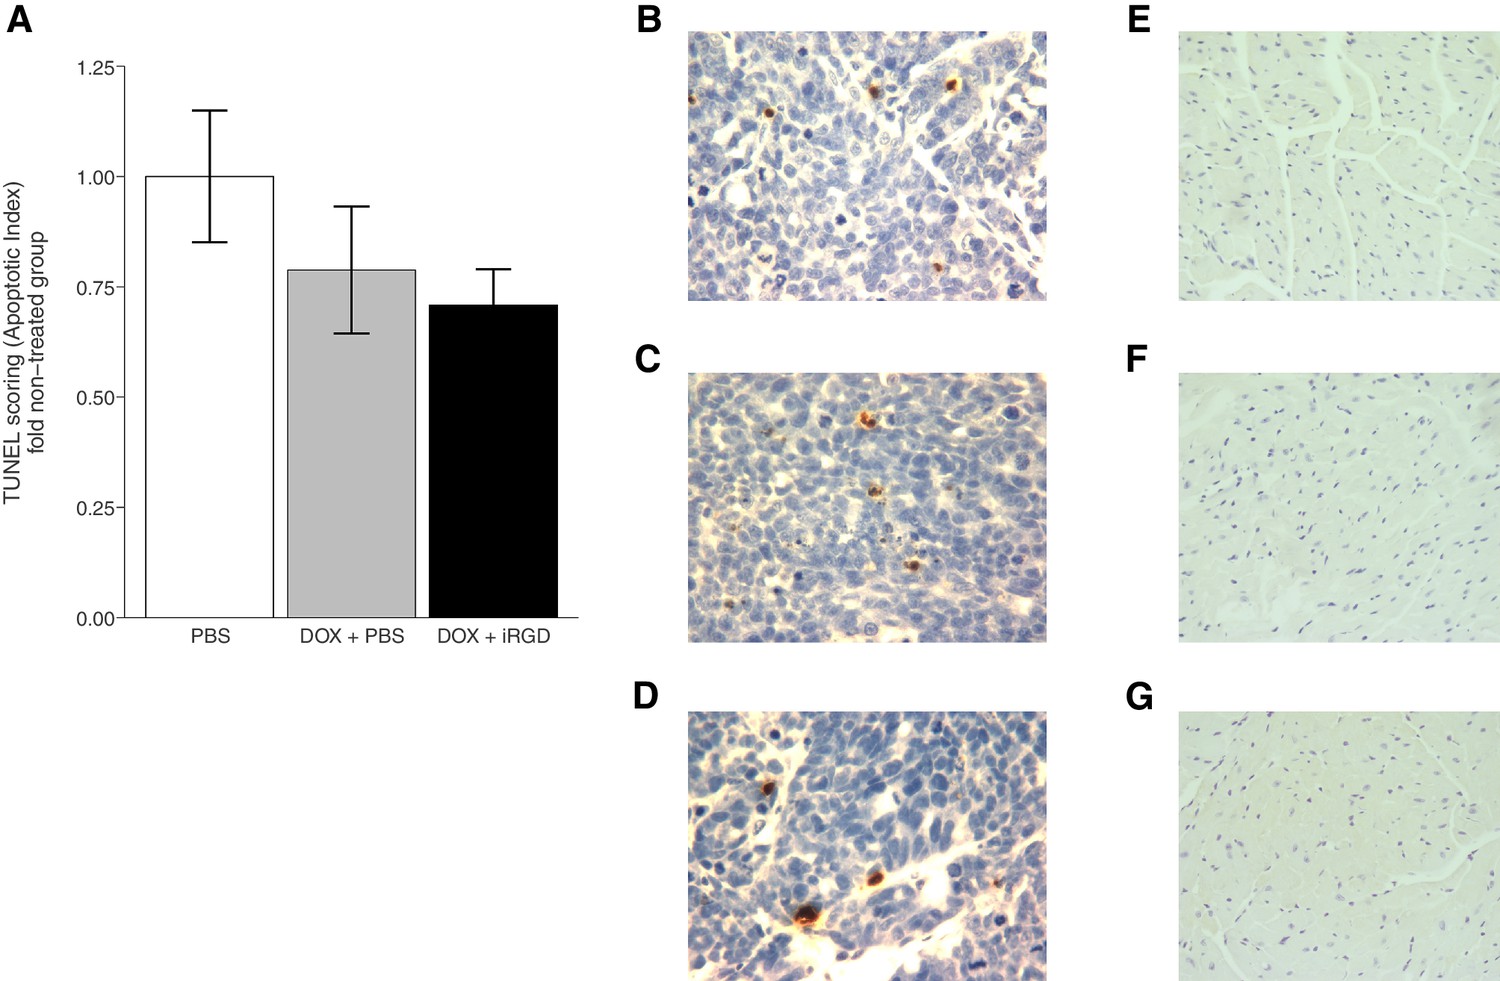
TUNEL staining of mouse tissues.
Mice bearing orthotopic 22Rv1 human prostate tumors were intravenously injected with PBS alone (PBS), 1 mg/kg DOX and PBS (DOX + PBS), or 1 mg/kg DOX and 4 µmol/kg of iRGD (DOX + iRGD). TUNEL staining was performed on tumor and heart sections of each animal. (A) Boxplot of mean apoptotic index calculated from TUNEL stained tumor sections. TUNEL scores were normalized to the average score of tumors from PBS treated mice. Means reported and error bars represent s.e.m. Number of mice per condition (n=6; n=18 mice total). One-way ANOVA on apoptotic index of all groups; F(2, 15) = 1.378, p=0.282. Planned contrast between DOX + PBS and DOX + iRGD; t(15) = 0.435, p=0.670 with a priori alpha level = 0.05. Representative images of TUNEL staining of tumor sections from PBS (B), DOX + PBS (C), or DOX + iRGD (D) treated mice. Representative images of TUNEL staining of heart sections from PBS (E), DOX + PBS (F), or DOX + iRGD (G) treated mice. Additional details for this experiment can be found at https://osf.io/7eynw/.
Figure 4—figure supplement 1
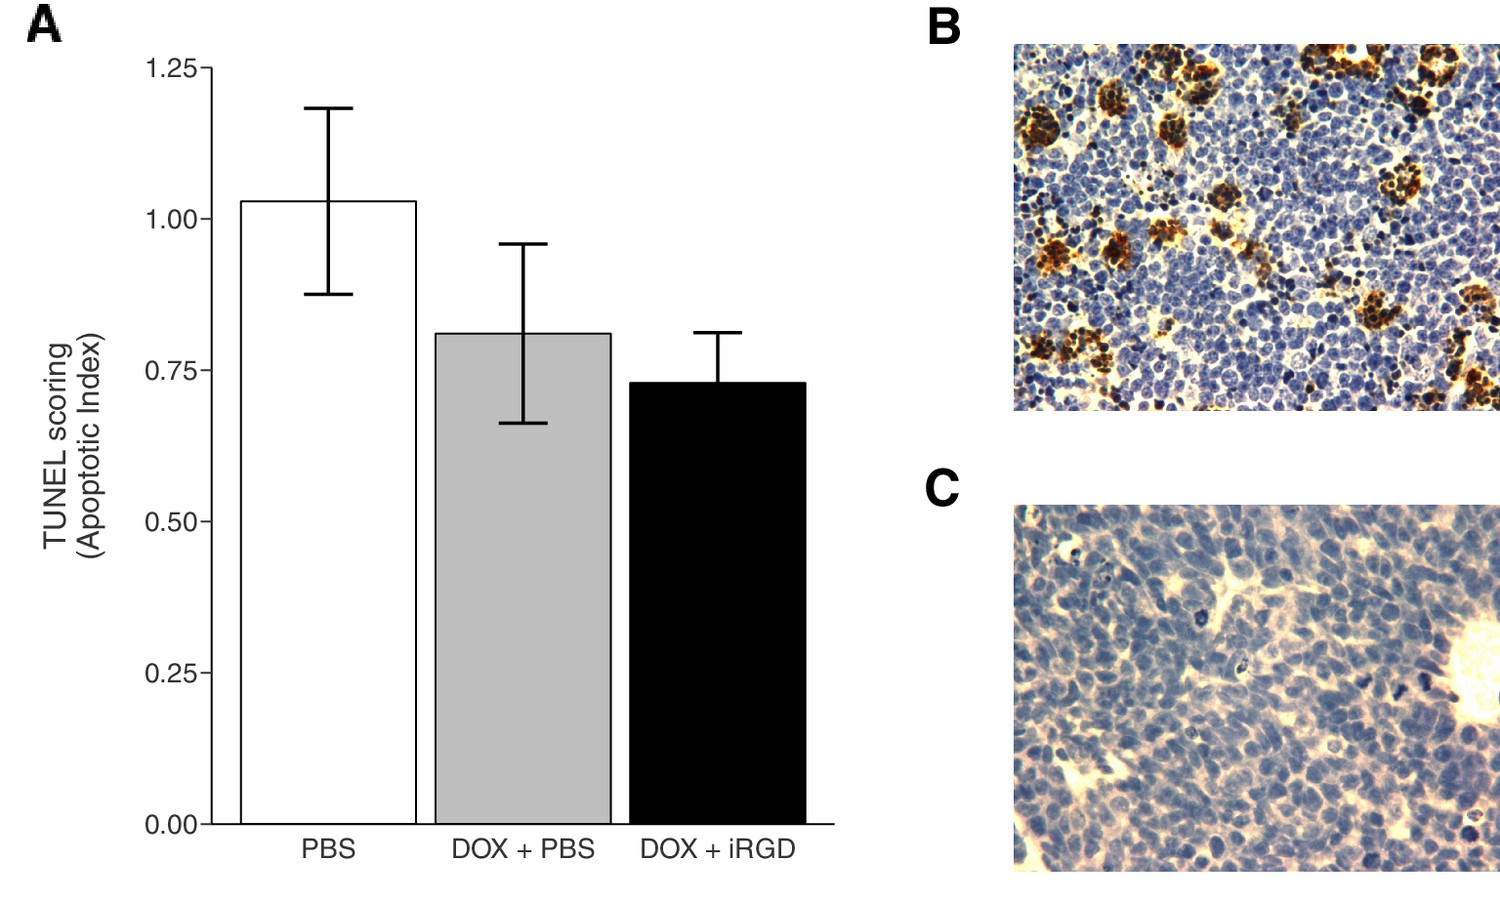
This is the same experiment as in Figure 4, but with the apoptotic index plotted for each condition instead of the apoptotic index relative to PBS treated tumors.
Mice bearing orthotopic 22Rv1 human prostate tumors that were intravenously injected with PBS alone (PBS), 1 mg/kg DOX and PBS (DOX + PBS), or 1 mg/kg DOX and 4 µmol/kg of iRGD (DOX + iRGD). (A) Boxplot of mean apoptotic index calculated from TUNEL stained tumor sections. Means reported and error bars represent s.e.m. Number of mice per condition (n=6; n=18 mice total). (B) Representative image of positive control staining. Positive controls are thymus from C57BL/6J mice injected with 10 mg/kg dexamethasone that were processed in parallel to the tumor and heart sections. (C) Representative image of negative control staining. Negative controls are a slice taken from each tumor and processed in parallel to the test tissue, but without the TUNEL reagent. Image shown is from a DOX + iRGD treated tumor. Additional details for this experiment can be found at https://osf.io/7eynw/.
Figure 5
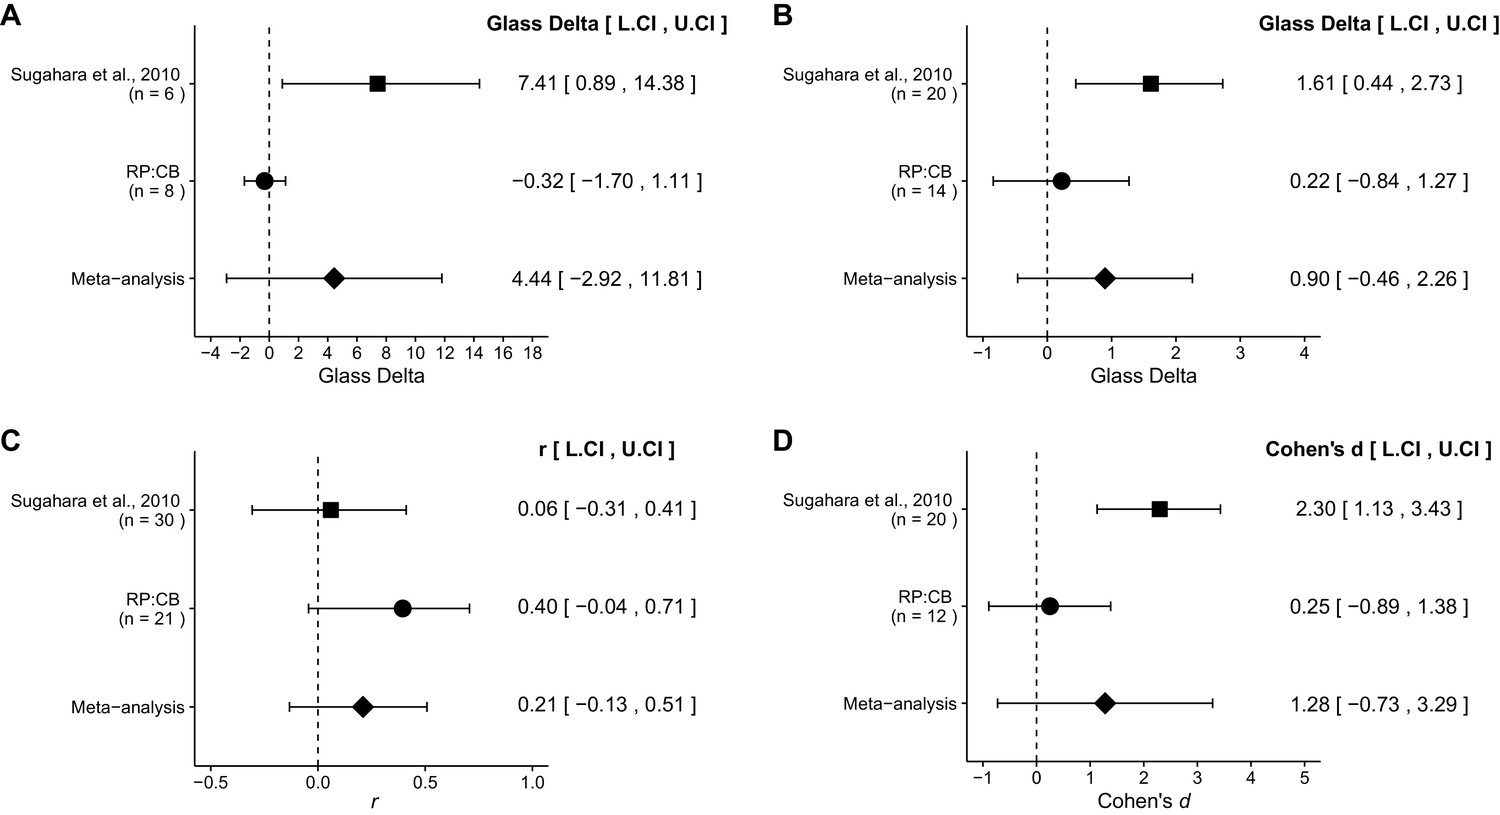
Meta-analyses of each effect.
Effect size and 95% confidence interval are presented for Sugahara et al. (2010), this replication attempt (RP:CB), and a random effects meta-analysis to combine the two effects. Sample sizes used in Sugahara et al. (2010) and this replication attempt are reported under the study name. (A) Dox accumulation in tumor tissue of mice treated with 10 mg/kg DOX alone or 10 mg/kg DOX and 4 µmol/kg iRGD (meta-analysis p=0.237). (B) Tumor weight of mice treated with 1 mg/kg DOX or 1 mg/kg DOX and 4 µmol/kg iRGD (meta-analysis p=0.195). (C) Body weight shift of mice treated with PBS, 1 mg/kg DOX and PBS, or 1 mg/kg DOX and 4 µmol/kg iRGD (meta-analysis p=0.229). (D) TUNEL staining from mice treated with 1 mg/kg DOX or 1 mg/kg DOX and 4 µmol/kg iRGD (meta-analysis p=0.211). Additional details for these meta-analyses can be found at https://osf.io/ymxaz/.
Download links
A two-part list of links to download the article, or parts of the article, in various formats.
Downloads (link to download the article as PDF)
Open citations (links to open the citations from this article in various online reference manager services)
Cite this article (links to download the citations from this article in formats compatible with various reference manager tools)
Replication Study: Coadministration of a tumor-penetrating peptide enhances the efficacy of cancer drugs
eLife 6:e17584.
https://doi.org/10.7554/eLife.17584


