Dissecting the pre-placodal transcriptome to reveal presumptive direct targets of Six1 and Eya1 in cranial placodes
- National University of Ireland, Ireland
Figures
Figure 1
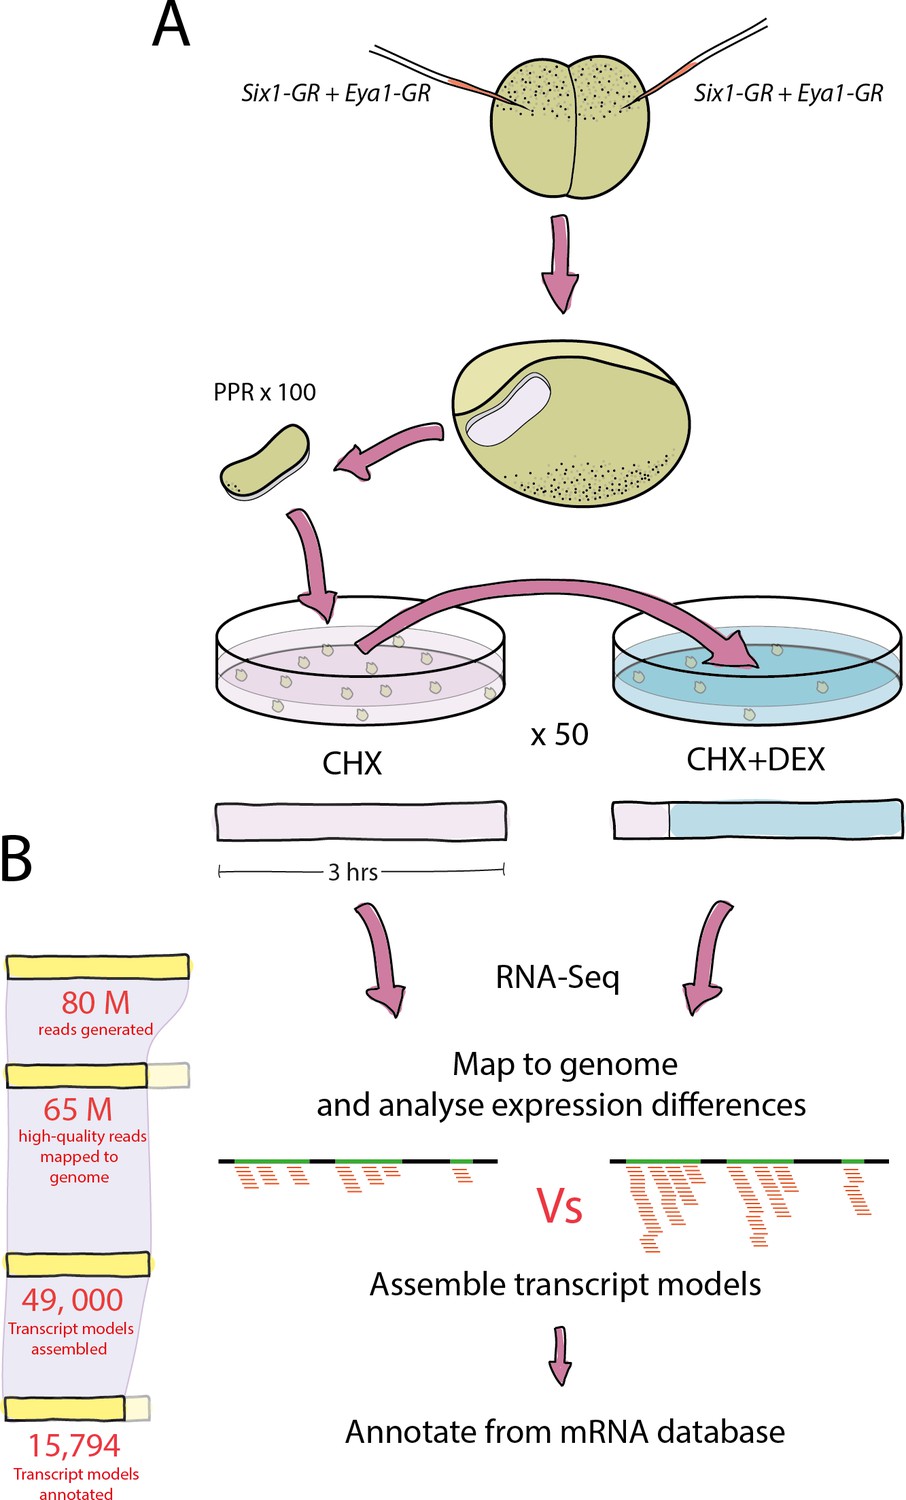
Experimental pipeline and overview of bioinformatic analysis.
(A) Both blastomeres of two-cell stage embryos were injected with Six1-GR, Eya1-GR or Six1-GR+Eya1-GR and explants were cut from pre-placodal ectoderm. Explants were incubated in CHX for 30 min before being split into two groups; 50% were kept in CHX for 2.5 hr and 50% were transferred to CHX+DEX for 2.5 hr. RNA was extracted from both treatment groups and submitted to RNA-Sequencing. (B) On average, 80 million reads were generated in sequencing for each treatment group, and 65 million quality-trimmed reads were successfully mapped to the Xenopus genome. An average of 49,000 transcript models were assembled, of which 80% (39,000) were successfully annotated against a Xenopus mRNA database. Annotated transcript models were then filtered to condense duplicate annotations into 15,794 uniquely annotated transcript models, and differential expression analysis was then performed using CHX treated explants as a control for those treated with CHX+DEX.
Figure 2
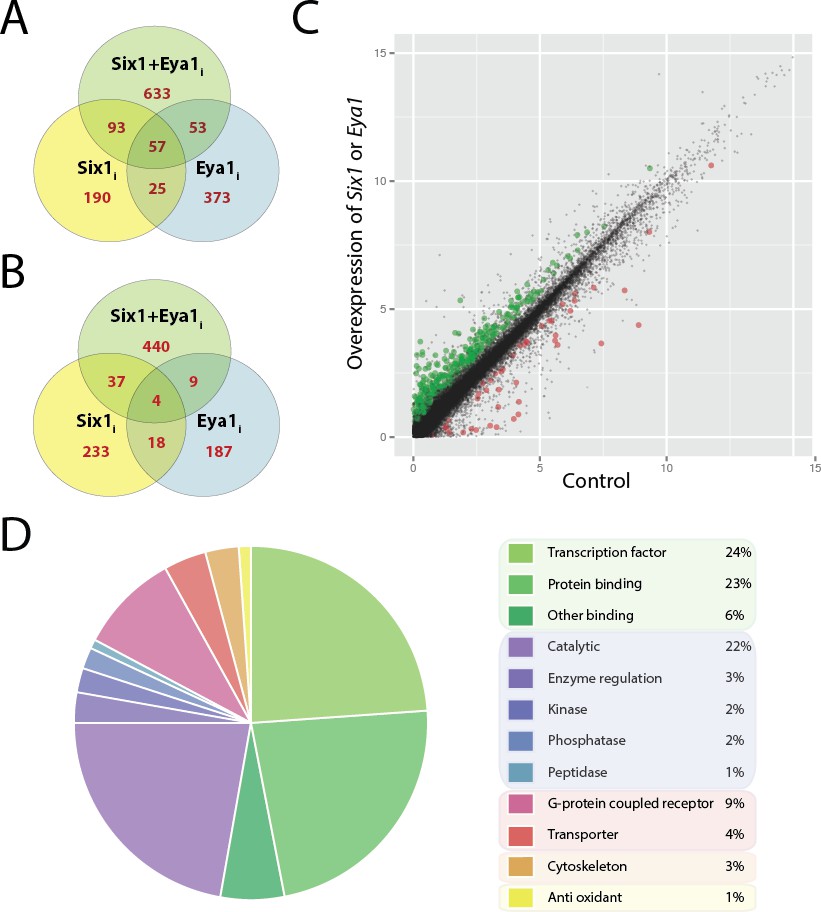
Differentially expressed genes after overexpression of Six1 and Eya1 in the PPE.
Plots A and B show number of genes differentially regulated after overexpression of Six1 alone (Six1i; yellow), Eya1 alone (Eya1i; blue) or Six1 and Eya1 combined (Six1+Eya1i; green). Each Venn diagram shows the number of genes (red) unique for each treatment group or shared between them. (A) Number of genes up-regulated and (B) down-regulated after injection with Six1, Eya1 or Six1+Eya1. (C) The merged analysis resulted in hundreds of significantly differentially expressed genes in the PPE data set. Plot shows log2 transformed (FPKM+1) values after overexpression of Six1 or Eya1 (combination of all treatment groups; Six1+Eya1m). Green points represent significantly (q<0.05) up-regulated genes and red points show significantly down-regulated genes. Plot D shows the enrichment of molecular function terms after overexpression of Six1 or Eya1 based on significantly differentially expressed genes from the merged data set (Six1+Eya1m; Supplementary file 3, Table 5). The area of the pie represents the total number of functional terms contained in the analysis, with each slice representing the percentage of genes against this total. Molecular functions shown can be broadly divided into five categories: Green slices are related to binding functions (53%); purple/blue represents enzyme activity (30%); pink/red shows transmembrane proteins (13%); orange cytoskeleton (3%) and yellow anti-oxidant (1%).
Figure 3 with 1 supplement
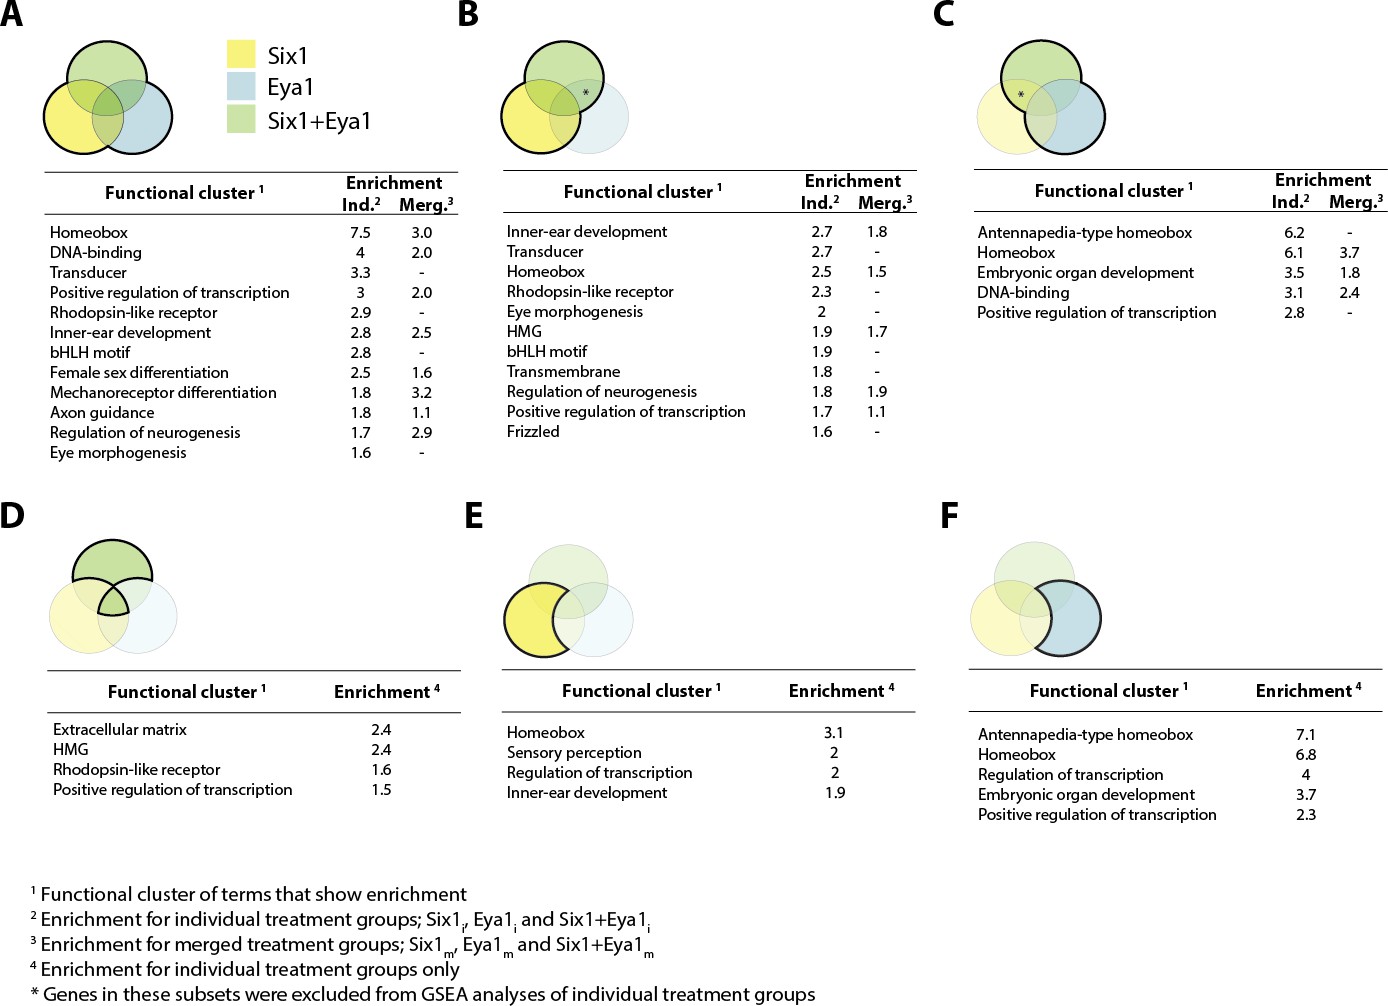
Gene set enrichment analysis (GSEA) showing enriched clusters of functional terms for up-regulated genes in different treatment groups.
In each case, treatment groups considered are highlighted and outlined in bold in the accompanying Venn diagram. Yellow colouring indicates Six1 treatment; blue shows Eya1 and green Six1+Eya1. Enrichment scores ≥1.5 are reported for individual treatment groups (Ind.) and, where available, ≥0.5 for merged treatment groups (Merg.). (A) Up-regulated genes from all treatment groups included in analysis; (B) Six1 overexpression only; (C) Eya1 overexpression only. (D) Genes differentially expressed after overexpression of both Six1 and Eya1; (E) exclusively after Six1 overexpression; (F) exclusively after Eya1 overexpression.
Figure 3—figure supplement 1

Gene set enrichment analysis (GSEA) showing enriched clusters of functional terms for down-regulated genes in different treatment groups.
In each case, treatment groups considered are highlighted and outlined in bold in the accompanying Venn diagram. Yellow colouring indicates Six1 treatment; blue shows Eya1 and green Six1+Eya1. Enrichment scores ≥1.5 are reported for individual treatment groups (Ind.) and, where available, ≥0.5 for merged treatment groups (Merg.). (A) Down-regulated genes from all treatment groups included in analysis; (B) Six1 overexpression only; (C) Eya1 overexpression only. (D) Genes differentially expressed after overexpression of both Six1 and Eya1; (E) exclusively after Six1 overexpression.
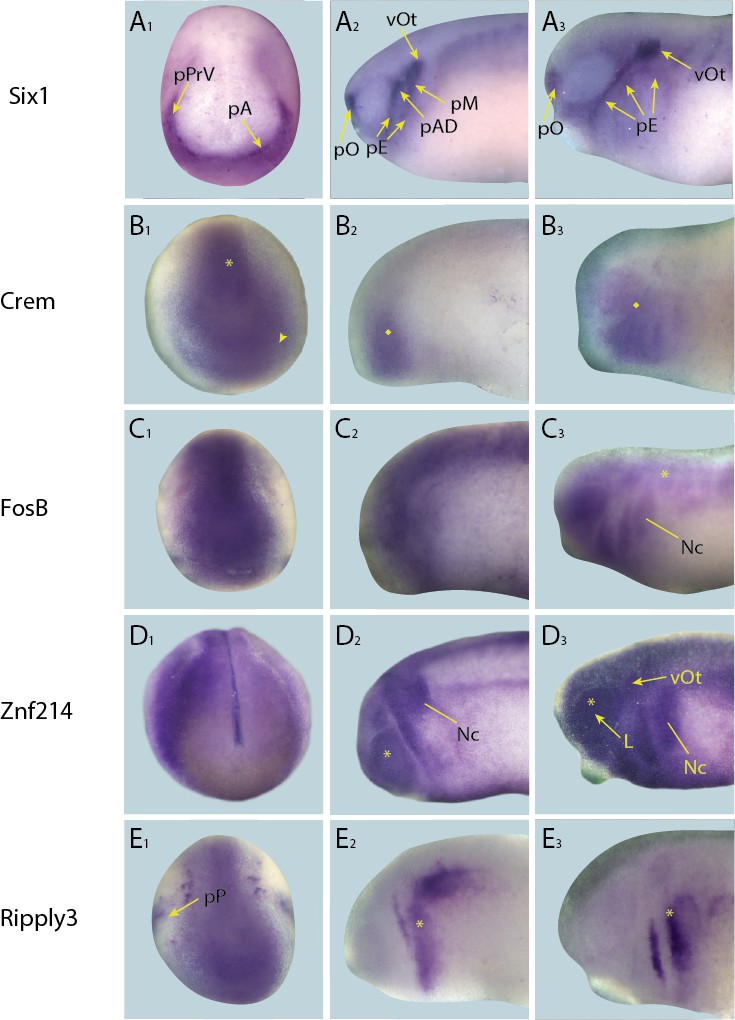
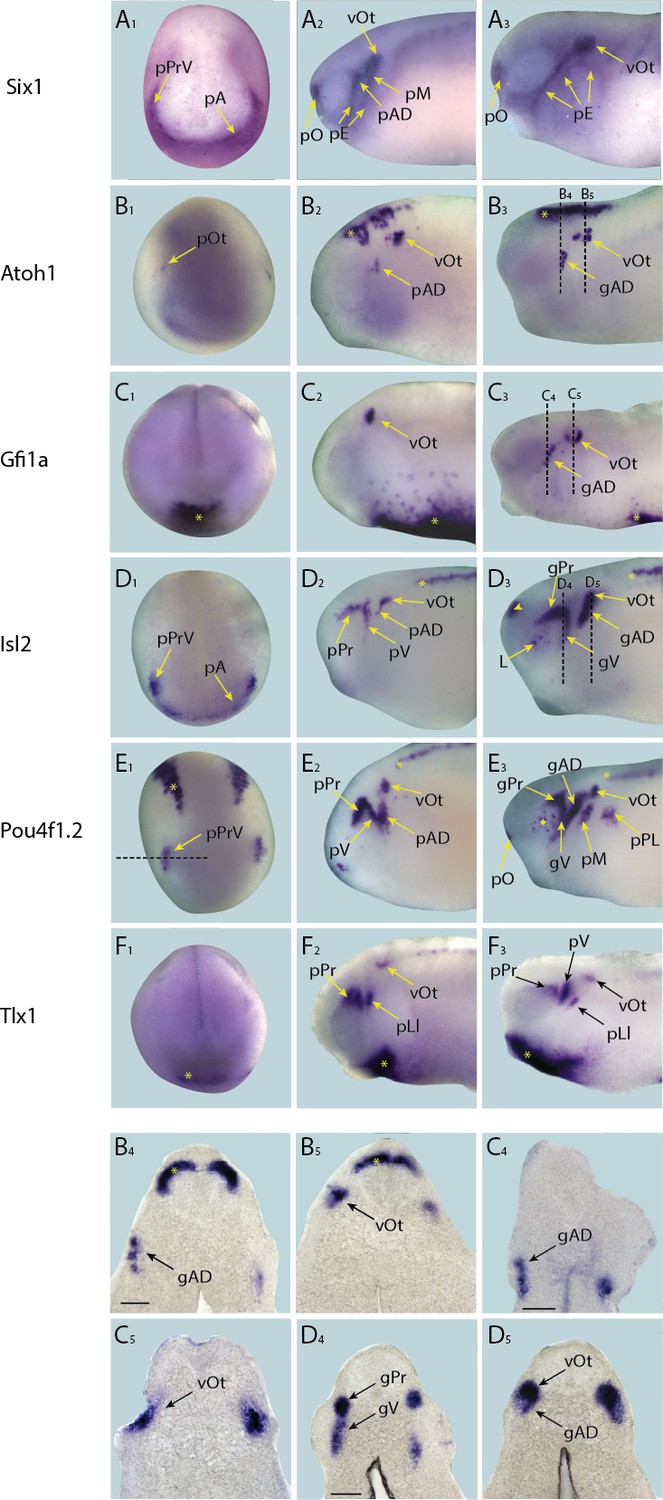
Figure 4 with 5 supplements

Expression of selected presumptive direct targets of Six1/Eya1 in whole-mount Xenopus embryos.
Genes expressed at neural plate stages (stages 14–18) are shown in panels A–L, and those only expressed at later stages are shown at mid/late tail bud stage (stages 28–32) in panels M–T. Several of the genes surveyed (Lhx5, Pou3f2b, Tbx15, Tbx6, Emx1.2 and Sim1 (A–D, M and N), were not expressed in the PPE, nor any placodal derivatives in later stages. Instead, such genes were expressed in the adjacent neural folds (Lhx5, Pou3f2b and Tbx15), ectoderm (Tbx6), or in the forebrain at later stages (Emx1.2). Several other genes were expressed broadly across the cranial ectoderm, at least partially overlapping with the PPE at neural plate stages (Ripply3, Crem, FosB and Znf214; E,O–Q), some of which are also maintained in placodal derivatives such as Znf214 in the otic vesicle (Q). The remaining genes (F–L, R–T) are expressed in parts of the PPE and maintained in some placodes (Hes2, Hes8, Hes9, Mab21l2b, Sox21, Isl2, Pou4f1.2, and Tlx1) or are expressed in a subset of placodes only (Atoh1, Gfi1a) (see Figure 4—figure supplements 1–4 for additional stages). Yellow arrows mark placodal expression. Arrowheads mark non-placodal expression. Abbreviations: pA: anterior placodal region; pAD: anterior lateral line placode; pE: epibranchial placode; pL: lens placode; L: lens; pM: middle lateral line placode; pO: olfactory placode; pP: posterior placodal region; pPrV: profundal/trigenimal placodes; vOt: otic vesicle. Plots U and V show qPCR after Six1 or Eya1 overexpression. Log2 fold change values were calculated from qPCR data obtained after overexpression of Six1-GR (U) or Eya1-GR (V) in placodal explants and are shown next to corresponding fold change values obtained from the RNA-Seq data. In all cases shown, qPCR values broadly corroborate those from the RNA-Seq data - showing up-regulation of target genes after either Six1 or Eya1 overexpression. Vertical error bars show the standard deviation of the mean of biological triplicates.
Figure 4—figure supplement 1

Expression of targets not expressed in placodes in whole-mount Xenopus embryos.
Expression dynamics for each target are shown across a range of developmental stages: A1–F1 show expression in neural plate stage embryos, A2–F2 show early tail bud stage embryos and A3–F3 show late tail bud stage embryos. (A) Expression of PPE marker gene Six1 is shown as reference for placodal domains (for details see Pandur and Moody, 2000; Schlosser and Ahrens, 2004). (B) Emx1.2 is expressed broadly in the neural plate in neural plate stages (B1), and becomes restricted to the forebrain in late tail bud stages (B3; asterisk). (C) Lhx5 is expressed in the forebrain at all developmental stages (C1–C3; asterisk), and at early and late tail bud stages Lhx5 is also expressed in the hindbrain and spinal cord (C3; arrowhead). (D) Pou3f2b is expressed in the neural plate and developing neural tube (D1; asterisk) at neural plate stages. Expression in the brain and spinal cord is maintained during early and late tail bud stages (D2 and D3 ; arrowhead and asterisk, respectively). (E) Tbx15 is expressed in a restricted domain of the anterolateral neural folds in neural plate stages (E1; asterisk). At tail bud stages expression is prominent in somites (E2 and E3; arrowhead) and migrating neural crest cells of the hyoid and first branchial neural crest streams (Nc). Both of these expression domains are maintained into late tail bud stages (E3 and E4). E4 shows section at the level indicated in E3 (dotted line). Bar in E4: 100 μm. (F) Throughout all developmental stages (F1–F3) Tbx6 is expressed strongly in the posterior paraxial and lateral plate mesoderm (F1 and F2; asterisk) with weaker expression in the pharyngeal arches (F2; arrowhead). Subsequently, it’s expressed in somites, as indicated by a diamond in F2. Abbreviations: pA: anterior placodal region; pAD: anterior lateral line placode; pE: epibranchial placode; pM: middle lateral line placode; pO: olfactory placode; vOt: otic vesicle; pPrV: profundal/trigeminal placodes.
Figure 4—figure supplement 2
Expression of targets that broadly overlap with PPE in whole-mount Xenopus embryos.
Expression dynamics for each target are shown across a range of developmental stages: A1–E1 show expression in neural plate stage embryos, A2–E2 show early tail bud stage embryos and A3–E3 show late tail bud stage embryos. (A) Expression of PPE marker gene Six1 is shown as reference for placodal domains (for details see Pandur and Moody, 2000; Schlosser and Ahrens, 2004). (B) Crem is initially expressed broadly in paraxial mesoderm (B1; asterisk) and cranial ectoderm (B1; arrowhead) at neural plate stages and in pharyngeal arches and overlying ectoderm at early and late tail bud stages (B2 and B3 ; diamond). (C) FosB is expressed in a broad pattern across the cranial ectoderm and trunk mesoderm at both neural fold and early tail bud stages (C1 and C2). At late tail bud stages expression is maintained in cranial ectoderm as well as becoming apparent in the migrating neural crest cells (Nc) and weakly in the somites (C3; arrowhead). (D) Znf214 is expressed broadly across the ectoderm at all developmental stages (D1–D3). At both early and late tail bud stages there is expression in the migrating neural crest cells (Nc) as well as in the retina (D2 and D3; asterisk), and in late tail bud stages Znf214 is expressed in the otic vesicle and lens. (E) Ripply3 is expressed broadly in the posterior placodal region at neural fold stages (E1). At both early and late tail bud stages expression is confined to posterior cranial ectoderm (E2 and E3; asterisk). Yellow arrows mark placodal expression. Abbreviations: pA: anterior placodal region; pAD: anterior lateral line placode; pE: epibranchial placode; L: lens; pM: middle lateral line placode; pO: olfactory placode; vOt: otic vesicle; pP: posterior placodal region; pPrV: profundal/trigeminal placodes.
Figure 4—figure supplement 3

Expression of targets with dynamic/transient expression pattern in placodes in whole-mount Xenopus embryos.
Expression dynamics for each target are shown across a range of developmental stages: A1–E1 show expression in neural plate stage embryos, A2–E2 show early tail bud stage embryos and A3–E3 show late tail bud stage embryos. (A) Expression of PPE marker gene Six1 is shown as reference for placodal domains (for details see Pandur and Moody, 2000; Schlosser and Ahrens, 2004). (B) Hes2 is expressed very strongly in a broad region corresponding to the posterior placodal domain including the prospective otic and lateral line placodes, as well as weakly in a scattered subset of neuroectodermal cells (B1; asterisk) at neural plate stages (see Figure 4—figure supplement 5 for section). Expression is later restricted to the otic vesicle and a new expression domain becomes established in the developing retina at early and late tail bud stages (B2 and B3; arrowhead). (C) During neural plate stages (C1), Hes8 is expressed in the developing profundal and trigeminal placodes as well as in the anterior placodal region, the anterior neural plate (C1 ; asterisk) and the primary neurons (motor neurons, intermediary neurons and sensory neurons) of the posterior neural plate (C1; arrowheads; see Figure 4— figure supplement 5 for section). In early tail bud stages (C2) trigeminal expression is lost and replaced by expression in the otic vesicle, as well as lateral line, epibranchial and olfactory placodes. Throughout late tail bud stages (C3), expression is maintained in these regions and the brain (C3; cross) and is initiated in the retina (C3; diamond). (D) During neural plate stages (D1), Hes9 is expressed in the developing profundal and trigeminal placodes as well as in the anterior placodal region, the anterior neural plate (D1; asterisk) and the primary neurons (motor neurons, intermediary neurons and sensory neurons) of the posterior neural plate (D1; arrowheads; see Figure 4—figure supplement 5 for section). In early tail bud stages (D2) trigeminal expression is lost but expression is apparent in the olfactory placodes, as well as in the otic and lateral line placodes and retina (D2; diamond). In late tail bud stages (D3) Hes9 is expressed broadly thoughout the brain (D3 ; cross), and is maintained in the lateral line and olfactory placodes as well as the otic vesicle. (E) During neural plate stages (E1), Mab21l2b is expressed in the prospective lens placode, as well as in the eye field (prospective retina) of the forebrain (E1; asterisk) and the prospective midbrain (E1; arrowhead). At early tail bud stages expression in the lens and midbrain is maintained and its expression becomes apparent in the hindbrain (E2; diamond). In late tail bud stages Mab21l2b is additionally prominently expressed in migrating neural crest cells (E3 ; Nc). (F) During neural plate stages Sox21 is expressed broadly throughout the anterior neural plate (F1; asterisk). At early tail bud stages (F2), this expression becomes confined to the forebrain (asterisk in F2) and midbrain-hindbrain boundary (arrowhead in F2) and is maintained into late tail bud stages, (F3). In late tail bud stages, Sox21 is also expressed in the olfactory placode, otic vesicle and becomes up-regulated in the hindbrain (F3; diamond). Yellow arrows mark placodal expression. Dotted lines in B1–D1 indicate levels of sections shown in Figure 4—figure supplement 5. Abbreviations: pA: anterior placodal region; pAD: anterior lateral line placode; pE: epibranchial placode; pLl: lateral line placodes; L: lens; pL: lens placode; pM: middle lateral line placode; pO: olfactory placode; vOt: otic vesicle; pP: posterior placodal region; pPrV: profundal/trigeminal placodes.
Figure 4—figure supplement 4
Expression of targets with persistent expression in placodes in whole-mount Xenopus embryos.
Expression dynamics for each target are shown across a range of developmental stages: A1–F1 show expression in neural plate stage embryos, A2–F2 show early tail bud stage embryos and A3–F3 show late tail bud stage embryos. B4–D4 and B5 –D5 shows sections at level indicated in B3–D3, respectively (dotted lines). (A) Expression of PPE marker gene Six1 is shown as reference for placodal domains (for details see Pandur and Moody, 2000; Schlosser and Ahrens, 2004). (B) Atoh1 is initially expressed at very low levels in presumptive otic placodes at neural plate stages (B1). This expression becomes more pronounced in the otic vesicle at early tail bud stages (B2) concomitant with the initiation of expression in lateral line ganglia and strong expression in the hindbrain (B2; asterisk). Expression becomes more pronounced in all three regions at late tail bud stages (B3 –B5). (C) Gfi1a is expressed at high levels in haematopoietic cells during neural plate stages (C1; asterisk). At early tail bud stages (C2) expression becomes more pronounced and diffuse, and expression is also initiated in the otic vesicle. At late tail bud stages Gfi1a is expressed in lateral line placodes as well as otic vesicles as the haematopoietic expression begins to subside (C3–C5). (D) During neural plate stages Isl2 is expressed in the profundal and trigeminal placodes and in the anterior placodal region along the anterior edge of the neural plate (D1). At early tail bud stages Isl2 expression is maintained in the profundal and trigeminal placodes/ganglia as well as in otic and lateral line placodes/ganglia and primary neurons in the spinal cord (D2; asterisk). Expression is maintained in cranial ganglia at late tail bud stages (D3–D5) and becomes apparent in the forebrain and lens (D3; arrowhead). (E) During neural plate stages Pou4f1.2 is expressed in the profundal and trigeminal placodes as well as in a stripe of primary sensory neurons (E1; asterisk; see Figure 4—figure supplement 5 for section). In early tail bud stages (E2) expression in the profundal/trigeminal placodes/ganglia and primary neurons is maintained, and expression in the otic and lateral line placodes is strengthened. Expression is maintained in all domains as well as in the cranial ganglia derived from placodes into late tail bud stages when expression becomes up-regulated in the retina (E3; diamond). Dotted line in E1 indicates the level of section shown in Figure 4— figure supplement 5. (F) Tlx1 is expressed in the presumptive ventral visceral arches at neural plate stages (F1; asterisk). This is maintained into early and late tail bud stages (F2 and F3), which also exhibit prominent expression in the profundal/trigeminal placodes and ganglia and the otic vesicle. Yellow and black arrows mark placodal expression. Bar in B4, C4 and D4: 100 μm (also for B5, C5 and D5, respectively). Abbreviations: pA: anterior placodal region; pAD: anterior lateral line placode; gAD: ganglion of the anterodorsal lateral line nerve; pE: epibranchial placode; pLl: lateral line placodes; L: lens; pL: lens placode; pM: middle lateral line placode; pO: olfactory placode; vOt: otic vesicle; pOt: presumptive otic placode; pPr: profundal placode; pP: posterior placodal region; pPL: posterior lateral line placode; pPrV: profundal/trigeminal placodes; pV: trigeminal placode; gV: ganglion of the trigeminal nerve.
Figure 4—figure supplement 5

Expression of selected targets in pre-placodal ectoderm (PPE) in sections through neural plate stage Xenopus embryos.
Neural crest and (NC) and neural plate (NP) domains are indicated. (A–D): Hes2 (A), Hes8 (B), Hes9 (C) and Pou4f1.2 (D) are all expressed in parts of the PPE (for level of sections see Figure 4 —figure supplements 3 and 4). While the exact boundaries of NC and NP cannot be determined in these sections, comparisons with sections through embryos stained by double in-situ-hybridisation for the PPE marker Six1 and the NP marker Sox3 (E) or Six1 and the NC marker FoxD3 (F) indicate that expression of each of these target genes is largely confined to the PPE although some overlap with the lateral NC region cannot be ruled out (E and F modified from Schlosser and Ahrens, 2004; Figure 6). Bar in A: 100 μm (also for B–F).
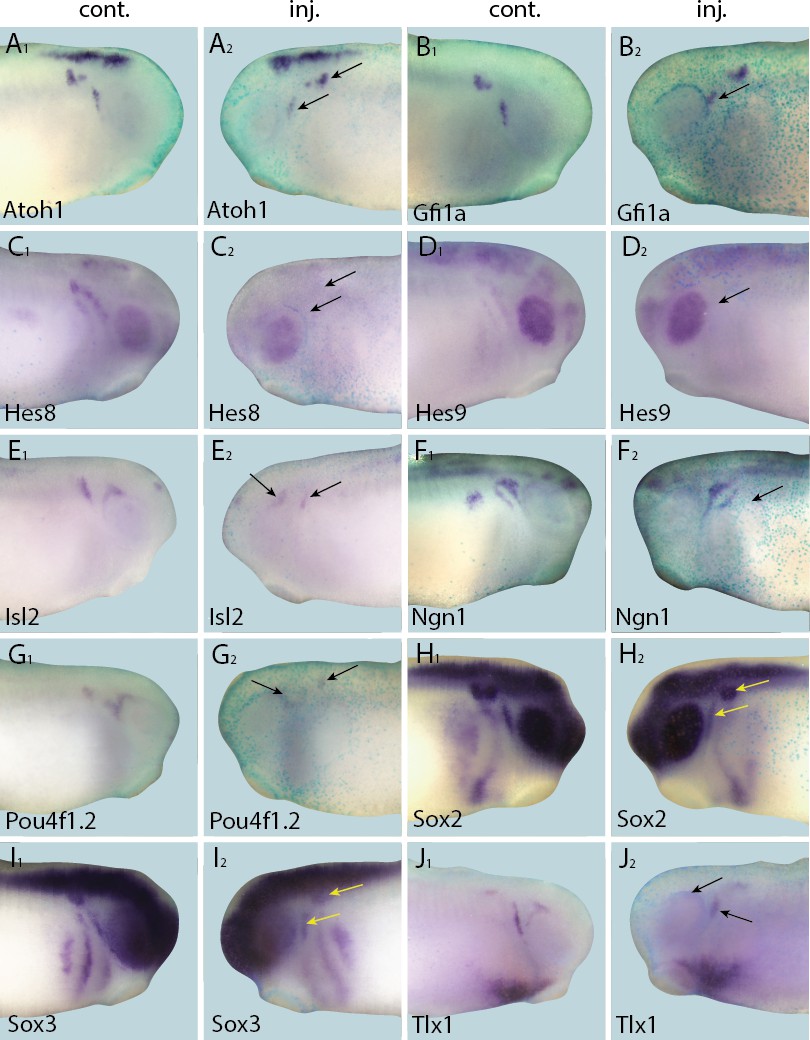
Figure 5 with 2 supplements
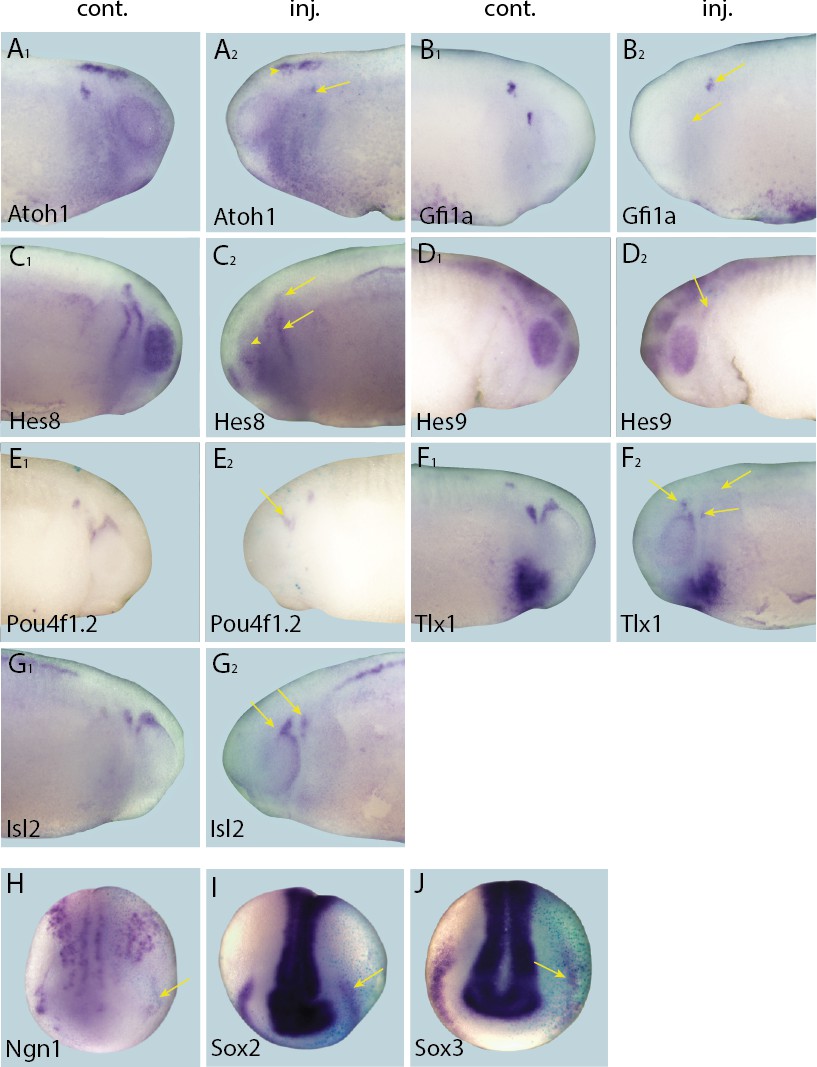
Effects of Eya1 knockdown on target genes.
Tail bud (A–G) and neural plate (H–I) stage embryos after unilateral injection of Eya1-MO1+2. In each case, lacZ was co-injected as a lineage tracer and panels A1–G1 show the control (un-injected) side and A2–G2 show the injected side (lacZ staining out of frame in most specimens). The injected side is positioned to the right in H–J, as marked by blue lacZ staining. Arrows and arrowheads mark reductions in marker gene expression in placodal and non-placodal derivatives, respectively.
Figure 5—figure supplement 1

Effects of Six1 knockdown on target genes.
Tail bud stage (A–G) and neural plate stage (H–J) embryos after unilateral injection of Six1-MO1+2. In each case, lacZ was co-injected as a lineage tracer and panels A1–G1 show the control (un-injected) side and A2–G2 show the injected side. The injected side is positioned to the right in H–J, as marked by blue lacZ staining (lacZ staining out of frame in some specimens). Arrows mark reductions in marker gene expression in placodal derivatives, and asterisks indicate increased expression.
Figure 5—figure supplement 2

Repression of Six1 target genes by Six1-EnR injection.
Tail bud stage (A–C) and neural plate stage (D–I) embryos after unilateral injection of Six1-EnR. In each case, lacZ was co-injected as a lineage tracer and panels A1–C1 show the control (un-injected) side and A2–C2 show the injected side. The injected side is positioned to the right in D–I, as marked by blue lacZ staining (lacZ staining out of frame in some specimens). Arrows mark reductions in marker gene expression in placodal derivatives, and asterisks indicate increased expression.
Figure 6
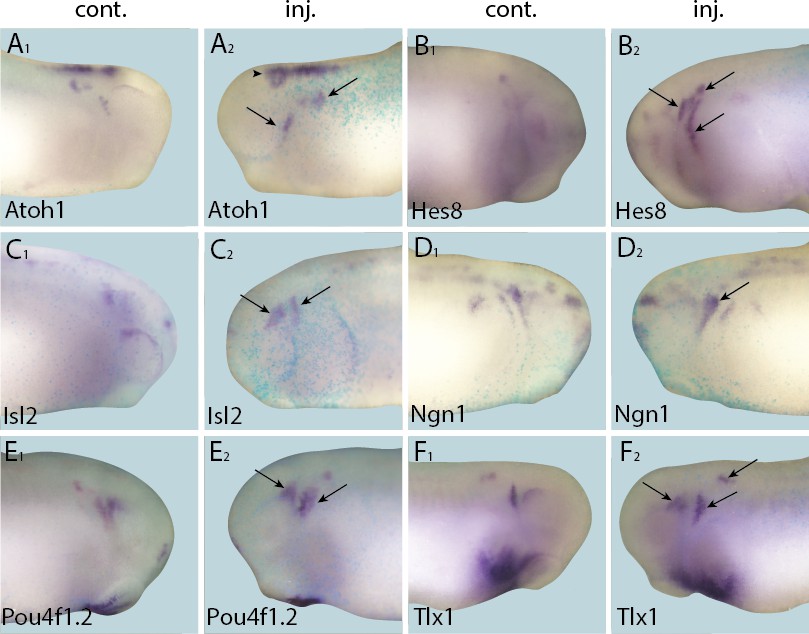
Up-regulation of target gene expression domains after overexpression of Six1.
Tail bud stage embryos (A–F) after unilateral injection of Six1-GR and DEX induction at neural plate stage (16–18). In each case, lacZ was co-injected as a lineage tracer and panels A1–F1 show the control (un-injected) side and A2–F2 show the injected side. Arrows and arrowheads mark expansions in marker gene expression in placodal and non-placodal derivatives, respectively.
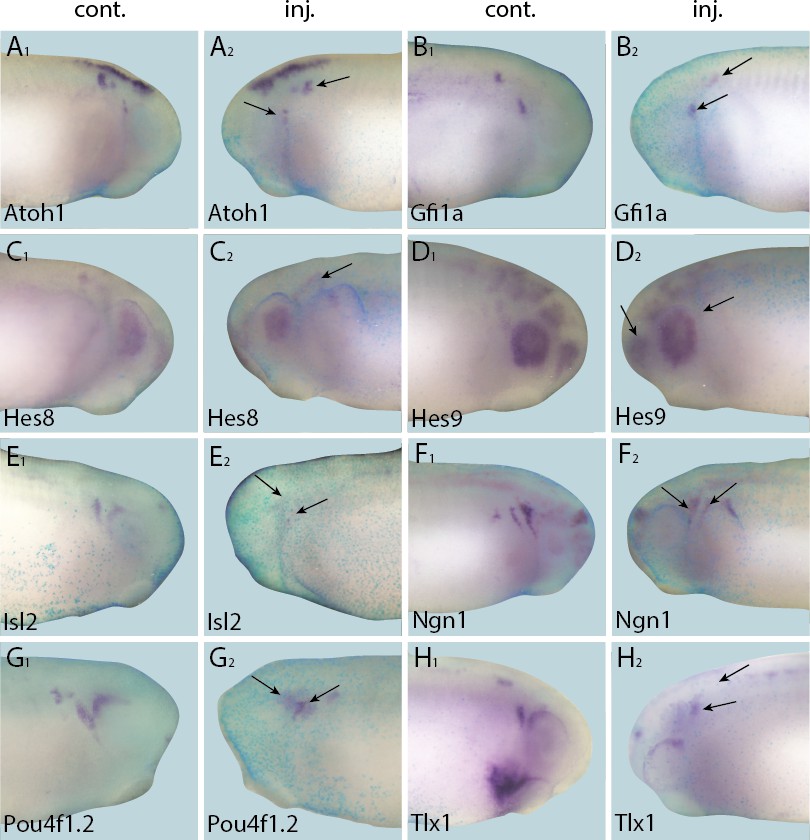
Figure 7

Up-regulation of target gene expression domains after overexpression of Eya1.
Tail bud stage embryos (A–G) after unilateral injection of Eya1-GR and DEX induction at neural plate stage (16–18). In each case, lacZ was co-injected as a lineage tracer and panels A1–G1 show the control (un-injected) side and A2–G2 show the injected side. Arrows and arrowheads mark expansions in marker gene expression in placodal and non-placodal derivatives, respectively.
Figure 8
Down-regulation of target gene expression domains after overexpression of Six1.
Tail bud stage embryos (A–H) after unilateral injection of Six1-GR and DEX induction at neural plate stage (16–18). In each case, lacZ was co-injected as a lineage tracer and panels A1–H1 show the control (un-injected) side and A2–H2 show the injected side. Arrows mark reductions in marker gene expression in placodal derivatives.
Figure 9
Down-regulation of target gene expression domains after overexpression of Eya1.
Tail bud stage embryos (A–J) after unilateral injection of Eya1-GR and DEX induction at neural plate stage (16–18). In each case, lacZ was co-injected as a lineage tracer and panels A1–J1 show the control (un-injected) side and A2–J2 show the injected side. Arrows mark reductions in marker gene expression in placodal derivatives.
Figure 10
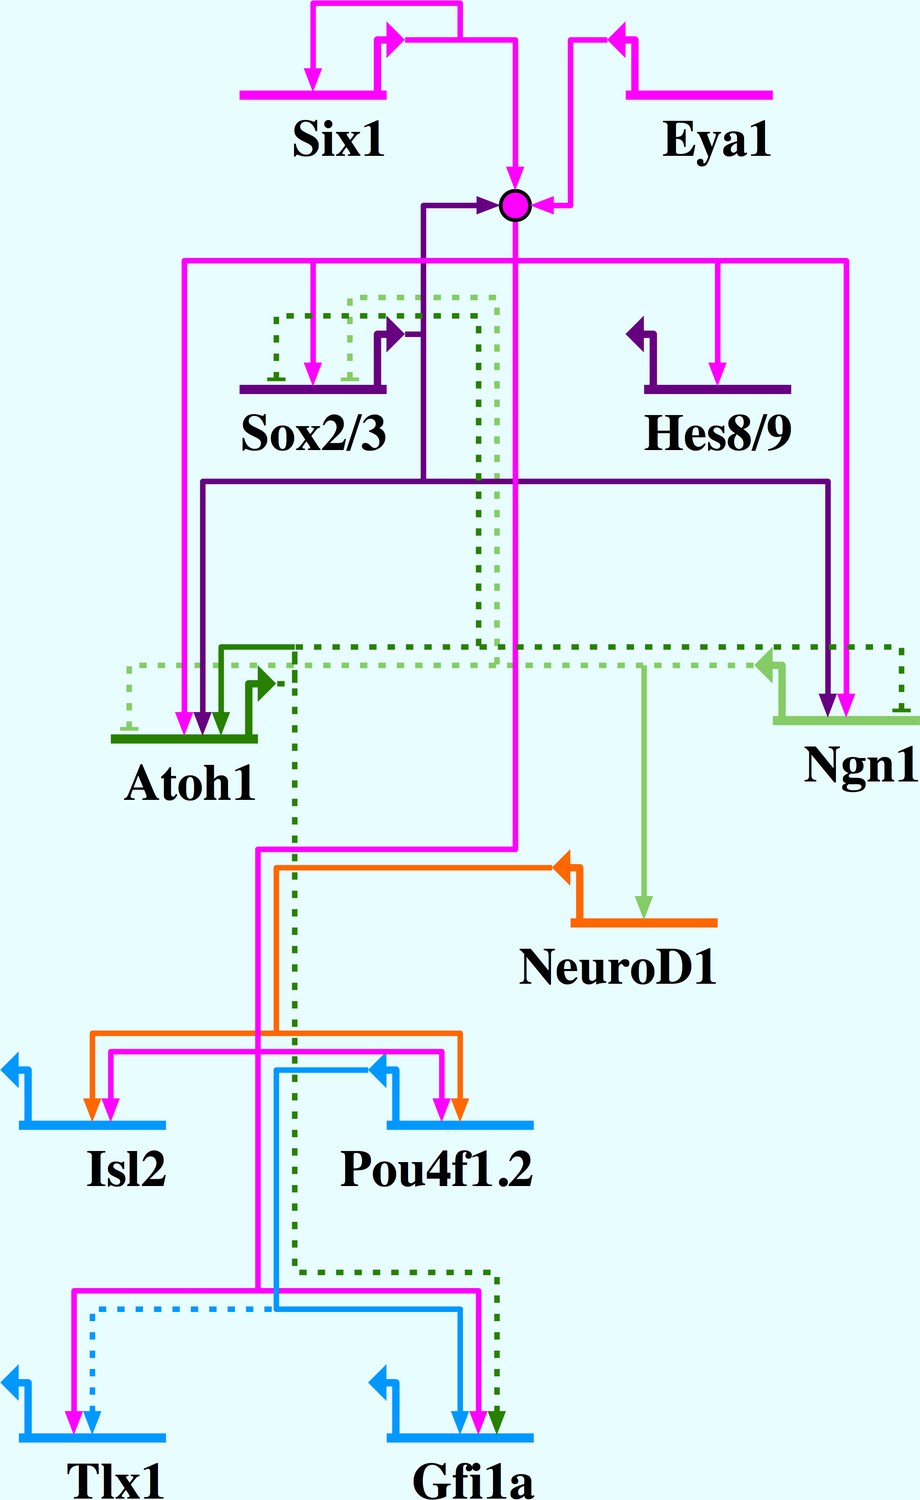
Network summary for Six1/Eya1-activated gene regulation in the PPE.
Six1/Eya1 act to promote neuronal differentiation, by activation of pro-neural genes (Ngn1, Atoh1), as well as progenitor state maintenance, by activation of genes such as SoxB1 and Hes genes. Arrows indicate direct (solid line) and indirect (dotted line) activation; barred lines show direct (solid line) and indirect (dotted line) repression. Evidence for interactions: Six1 positively autoregulates (Sato et al., 2012); Six1/Eya1 directly activate Sox2, Sox3, Hes8, Hes9, Ngn1, Atoh1, Isl2, Pou4f1.2, Tlx1 and Gfi1a (this study); Sox2 synergises with Six1/Eya1 (Ahmed et al., 2012b, 2012a); Sox2 directly activates Atoh1 (Ahmed et al., 2012a) and Ngn1 (Cimadamore et al., 2011); Atoh1 and Ngn1 indirectly repress each other (Gowan et al., 2001); Ngn1 indirectly represses Sox2 (Evsen et al., 2013); Ngn1 directly activates NeuroD1 (Seo et al., 2007); Atoh1 positively autoregulates (Helms et al., 2000); Atoh1 indirectly represses Sox2 (Neves et al., 2012) and activates Gfi1 (Wallis et al., 2003); NeuroD1 directly activates Pou4f1.2 (Hutcheson and Vetter, 2001) and Isl1 (Lee et al., 1995); Pou4f1.2 directly activates Gfi1 (Hertzano et al., 2004) and indirectly activates Tlx1 (Hutcheson and Vetter, 2001).
Tables
Table 1
Genes with at least two-fold up-regulation in at least two out of three individual treatment groups (Six1i; Eya1i; Six1+Eya1i).
| Annotation* | Accession | Six1 FC† | Eya1 FC‡ | Six1+Eya1 FC§ | |
|---|---|---|---|---|---|
| Chromosome unknown open reading frame | XM_002938866.2 | 6.2 | - | 7.9 | |
| cDNA clone IMAGE:7022272 | BC094950.1 | 5.6 | 5.1 | 7.5 | |
| X. laevis cyclin Dx (ccndx) | NP_001087887.1 | 7.5 | - | 5.2 | |
| Calcitonin gene-related peptide-like | XM_002941675.2 | 7 | - | 3 | |
| X. laevis tripartite motif containing 63, E3 ubiquitin protein ligase (trim63) | NM_001093214.1 | 5.3 | 3.6 | 6.3 | |
| ATP-sensitive inward rectifier potassium channel 11-like | XM_004916278.1 | 5.1 | - | 6.1 | |
| Leucine rich repeat containing 52 (lrrc52) | XM_002933773.2 | 6.1 | - | 2.8 | |
| # | SIX homeobox 2 (six2) | NM_001100275.1 | 5 | 3.5 | 5.9 |
| Potassium voltage-gated channel shaker-related subfamily member 2 (kcna2) | XM_004910736.1 | 5.1 | - | 4.9 | |
| Butyrophilin subfamily 2 member A1 (btn2a1) | NM_001094508.1 | - | 1.2 | 4.9 | |
| Glutathione peroxidase 2 (gpx2) | NM_001256315.1 | - | 2.5 | 4.8 | |
| # | X. laevis for Xsox17-alpha protein | AJ001730.1 | 3.6 | 2.6 | 4.8 |
| X. laevis ectodysplasin A receptor (edar) | NM_001087047.1 | 2.8 | 2.5 | 4.7 | |
| Uncharacterized (LOC101734405) | XM_004918247.1 | 4.4 | 0.8 | 3.5 | |
| Glutathione peroxidase 2 (gpx2) | NM_001256315.1 | 3.4 | 2.1 | 4.4 | |
| X. laevis cytochrome P450, family 2, subfamily D, polypeptide 6 (cyp2d6) | NM_001093574.1 | 1.1 | - | 4.4 | |
| Calcium/calmodulin-dependent protein kinase kinase 2beta (camkk2) | XM_002937701.2 | 4.4 | 2.6 | 3.5 | |
| Cytochrome P450 family 26 subfamily B polypeptide 1 (cyp26b1) | NM_001079187.2 | 3.3 | 4 | 4.3 | |
| Troponin I type 1 (skeletal, slow) | BC061268 | 1.8 | - | 4.3 | |
| 72 kDa inositol polyphosphate 5-phosphatase-like (LOC101734556) | XM_004916572.1 | - | 4.2 | 1.3 | |
| Chemokine (C-X-C motif) receptor 7 (cxcr7) | NM_001030434.1 | 3 | 2.8 | 4.1 | |
| # | X. laevis xSox17 alpha 2 | AB052691.1 | 1.7 | 1.4 | 4 |
| Espin (espn) transcript variant X3 | XM_004916193.1 | - | 2.1 | 4 | |
| B-cell CLL/lymphoma 11B (zinc finger protein) (bcl11b) | XM_004917116.1 | - | 1.9 | 4 | |
| C-X-C motif chemokine 10-like | XM_002940578.2 | 1.9 | 4 | 3.5 | |
| X. laevis hedgehog-interacting protein | BC046952.1 | - | 2.7 | 4 | |
| X-linked inhibitor of apoptosis (xiap) | NM_001030412.1 | 4 | 3.1 | 2.3 | |
| X. laevis uncharacterized (LOC496300) | NM_001095458.1 | 1.4 | 3.9 | 1.1 | |
| X. laevis RDC1 like protein | BC098974.1 | 3.6 | 2.1 | 3.9 | |
| X. laevis for frizzled 4 protein (fz4 gene) | AJ251750.1 | 1.3 | 0.6 | 3.8 | |
| Espin (espn) transcript variant X1 | XM_002933856.2 | 3.1 | 2.7 | 3.7 | |
| Paired box 1 (pax1) transcript variant X1 | JQ929179.1 | - | 3 | 3.7 | |
| Potassium voltage-gated channel subfamily F member 1 (kcnf1) | NM_001102926.1 | 3.6 | - | 2.1 | |
| Echinoderm microtubule-associated protein-like 1-like | XM_004917169.1 | - | 3.6 | 2.8 | |
| Leucine rich adaptor protein 1-like (lurap1l) | XM_002940127.2 | 3.6 | 1.4 | 2.4 | |
| Sine oculis binding protein homolog (Drosophila) | BC154687.1 | 2.7 | 1.6 | 3.4 | |
| RNA-directed DNA polymerase homolog | XM_004916122.1 | 3.4 | - | 2.1 | |
| Kinesin family member 3C (kif3c) transcript variant X1 | XM_004914940.1 | 1.4 | 0.8 | 3.4 | |
| Anoctamin 2 (ano2) | XM_002932297.2 | 2.2 | 1.3 | 3.4 | |
| X. laevis natriuretic peptide C (nppc) | NM_001112924.1 | 2.1 | - | 3.3 | |
| Uncharacterized (LOC101734952) | XM_004916172.1 | 2.5 | - | 3.3 | |
| Poly (ADP-ribose) polymerase 14-like (LOC101731378) | XM_004920062.1 | 3.1 | - | 3.3 | |
| Protocadherin-11 X-linked-like (LOC100493938) | XM_004916890.1 | - | 3.2 | 1.4 | |
| Uncharacterized (LOC101733225) | XM_004919937.1 | 2.5 | 3.2 | 1.6 | |
| Calcium channel voltage-dependent beta 4 subunit (cacnb4) | NM_001142151.1 | 3.1 | - | 1.9 | |
| F-box protein 32 (fbxo32) transcript variant X1 | XM_002941397.2 | 1.8 | - | 3.1 | |
| cDNA clone TEgg026p17 | CR761997.2 | 3 | 2.6 | - | |
| X. laevis transforming growth factor beta-induced (tgfbi) | NM_001095238.1 | 1.3 | - | 3 | |
| Mucin-2-like (LOC100494747) | XM_002936043.2 | 3 | 2 | 1.7 | |
| X. laevis uncharacterized protein (MGC68450) | NM_001089841.1 | 2.2 | - | 2.8 | |
| X. laevis neuregulin alpha-1 | AF076618.1 | 1.4 | 0.8 | 2.7 | |
| Potassium voltage-gated channel Isk-related (kcne1) | XM_004912135.1 | 2.2 | 1.5 | 2.7 | |
| Olfactory receptor 5G3-like (LOC100492086) | XM_002942220.1 | 1.9 | - | 2.7 | |
| Alpha-kinase 2 (alpk2) | XM_004910401.1 | 1.1 | 2.2 | 2.7 | |
| X. laevis arginyl amino peptidase (amino peptidase B) b (rnpep-b) | NM_001092079.1 | - | 2.7 | 1.7 | |
| # | X. laevis SRY-box containing protein (Sox1) | EF672727.1 | - | 2.6 | 2.1 |
| Copine II (cpne2) transcript variant X1 | XM_004913481.1 | 1 | 1.2 | 2.6 | |
| X. laevis hemoglobin, gamma A (hbg1) | NM_001096347 | 1.2 | - | 2.6 | |
| KIAA0895 protein (kiaa0895) | NM_001114073.1 | 1.6 | 2.6 | - | |
| # | X. laevis empty spiracles homeobox 1gene 2 (emx1.2) | NM_001093430.1 | 2.6 | 1.9 | 1.1 |
| Homeobox B8 (hoxb8) transcript variant X1 | XM_002938021.2 | 1.1 | 2.5 | - | |
| Monocyte to macrophage differentiation-associated (mmd) | XM_004918560.1 | - | 1.2 | 2.5 | |
| X. laevis uncharacterized (LOC100036933) | NM_001097704.1 | 1.5 | 1.5 | 2.5 | |
| Finished cDNA clone TNeu143f19 | CR760056.2 | 2.2 | 2.5 | - | |
| Chromosome unknown open reading frame C2orf80 | XM_002937119.2 | 1.4 | 2.1 | 2.4 | |
| # | Single-minded homolog 1 (sim1) transcript variant X2 | XM_004914545.1 | - | 1.4 | 2.4 |
| Transmembrane protein 2-like (LOC100491930) | XM_002932255.2 | 2.4 | 1.9 | 1.3 | |
| PX domain containing 1 (pxdc1) | NM_001130262.1 | 1.4 | - | 2.4 | |
| Aldehyde dehydrogenase 1 family member L2 (aldh1l2) | XM_002938070.2 | 0.9 | 1.3 | 2.3 | |
| Uncharacterized (LOC100490228) | XM_002942932.2 | 1.8 | - | 2.3 | |
| Beta-1 3-galactosyltransferase 2-like (LOC101732799) | XM_004918863.1 | 1.6 | 2.3 | - | |
| Alpha-2 3-sialyltransferase ST3Gal V (st3gal5) | FN550108.1 | 1.8 | - | 2.3 | |
| X. laevis uncharacterized protein (MGC64538) | NM_001086337.1 | - | 1.6 | 2.3 | |
| Transmembrane channel-like protein 7-like (LOC100493700) | XM_002932222.2 | 1.4 | 0.9 | 2.3 | |
| Kinase insert domain receptor (a type III receptor tyrosine kinase) (kdr) | XM_002934669.2 | 1.9 | 0.9 | 2.3 | |
| Serine/threonine kinase 32A (stk32a) | XM_002936707.2 | 1.3 | 2.2 | - | |
| Pancreatic lipase-related protein 2 (pnliprp2) | NM_001089647.1 | 2.1 | 0.7 | 2.2 | |
| X. laevis nephrin (NPHS1) | AY902238.1 | - | 2.2 | 1.1 | |
| Poly (ADP-ribose) polymerase 14-like (LOC100485144) | XM_002943546.2 | 2 | 2.2 | 1.2 | |
| Frizzled family receptor 4 (fzd4) | XM_002936543.2 | 1.4 | 0.7 | 2.1 | |
| Neuropeptide Y receptor Y2 (npy2r) | XM_004911153.1 | 2.1 | - | 1.6 | |
| Deoxyribonuclease gamma-like (LOC100497175) | XM_002938386.2 | 1.8 | 2.1 | 2 | |
| X. laevis dehydrogenase/reductase (SDR family) member 11 (dhrs11) | NM_001094963.1 | - | 1.5 | 2.1 | |
| X. laevis gamma-glutamyl hydrolase (ggh) | NM_001092691.1 | 2.1 | 1.3 | 2 | |
| Opsin-3-like | XM_002932623.2 | 1 | 1.2 | 2 | |
| X. laevis transmembrane protein 56 (tmem56-b) | NM_001086447.1 | - | 1.1 | 2 | |
| X. laevis pyruvate dehyrogenase phosphatase catalytic subunit 1 (pdp1) | NM_001094221.1 | 1.5 | 2 | 1 | |
| ArfGAP with SH3 domain ankyrin repeat and PH domain 3 (asap3) | XM_002939360.2 | 1.7 | - | 1.9 | |
| # | Early growth response 3 (egr3) | XM_002932703.2 | 1.6 | 0.8 | 1.9 |
| # | POU class 4 homeobox 1 (pou4f1.2) | NM_001097307.1 | 1.3 | 1 | 1.9 |
| Activin beta B subunit | S61773.1 | - | 1.7 | 1.8 | |
| Monocyte to macrophage differentiation-associated (mmd) | XM_002937811.2 | 1.7 | 1.1 | 1.8 | |
| X. laevis ribosomal protein S2e | BC130122.1 | - | 1.8 | 1.7 | |
| X. laevis ras homolog family member V (rhov) | NM_001128659.1 | 1.2 | 0.8 | 1.6 | |
| X. laevis adenomatosis polyposis coli down-regulated 1 (apcdd1) | NM_001094109.1 | 1.2 | 1 | 1.6 | |
| # | X. laevis zinc finger protein 214 (znf214) | NM_001097042.1 | 1.2 | 0.8 | 1.5 |
| X. laevis cdc25Ba | AB363840.1 | 1.2 | - | 1.5 | |
| X. laevis apelin (apln-a) | NM_001097924.1 | 0.9 | 1.3 | 1.5 | |
| Suppressor of cytokine signaling 2 (socs2) | NM_001095760.1 | - | 1.1 | 1.5 | |
| # | cAMP responsive element modulator (crem) | XM_002935162.2 | - | 1.4 | 1.5 |
| X. laevis clone IMAGE:4684003 | BC042305.1 | 1.4 | - | 1.2 | |
| # | X. laevis ets-2a proto-oncogene | BC133183.1 | 1.3 | 1 | 1.4 |
| X. laevis similar to envoplakin | BC045116.1 | 1.4 | 1.4 | - | |
| Ras homolog family member V (rhov) | NM_001095566.1 | 1.4 | 1 | 1.2 | |
| Samd9l protein (samd9l) | XM_002943522.2 | - | 1.2 | 1.3 | |
| Flocculation protein FLO11-like (LOC100490389) | XM_002942555.2 | 1.2 | - | 1.3 | |
| c-Jun-amino-terminal kinase-interacting protein 4-like (LOC100493724) | XM_002939963.2 | 1.1 | - | 1.2 | |
| X. laevis Dickkopf-1 (Xdkk-1) | AF030434.1 | 1 | 1.2 | 1.1 | |
| X. laevis ectoderm neural cortex related-3 (Encr-3) | AY216793.1 | 1.1 | 0.8 | 1.2 | |
| Uncharacterized (LOC101730819) | XM_004915204.1 | 0.9 | 1.1 | 1.2 | |
| # | X. laevis LIM class homeodomain protein | BC084744.1 | 1.1 | 0.7 | 1.1 |
| Ceramide kinase-like (cerkl) | XM_002932015.2 | 1.4 | 1.3 | 2 | |
| Mannosyl (alpha-1 3-)-glycoprotein beta-1 4-N-acetylglucosaminyltransferase (mgat4b) | NM_001091975.1 | 2 | - | 1.8 | |
| Fibroblast growth factor 19 (fgf19) | NM_001142825.1 | - | 2 | 1.5 | |
| # | F-box protein 41 (fbxo41) | NM_001079043.1 | 1.3 | 0.6 | 2 |
| Avidin-like (LOC100487365) | XM_002939983.2 | 2 | 1.6 | - | |
| Four and a half LIM domains 2 (fhl2) | NM_001126761.1 | - | 1.1 | 1.9 | |
| Metalloprotease TIKI1-like (LOC100491951) | XM_002936336.2 | 1.1 | 1.4 | 1.9 | |
| X. laevis Kazal-type serine peptidase inhibitor domain 1 (kazald1) | NM_001092073.1 | 1.6 | 1.1 | 1.9 | |
| Uncharacterized (LOC101734664) | XM_004910525.1 | 1.2 | 0.6 | 1.9 | |
| X. laevis similar to calsequestrin 2 (cardiac muscle) | BC097545.1 | 1.8 | 1.5 | 1.9 | |
| X. laevis COMM domain containing 3 (commd3) | NM_001095386.1 | 1.1 | 1.9 | 0.6 | |
| X. laevis alcohol dehydrogenase iron containing1 (adhfe1) | NM_001127802.1 | - | 1.9 | 1.2 | |
| X. laevis ectonucleoside triphosphate diphosphohydrolase 1 (entpd1) | NM_001092268.1 | 1.8 | 0.6 | 1.3 | |
| # | Protein fosB-like transcript variant X2 | XM_004916957.1 | - | 1.7 | 1.4 |
| Tocopherol (alpha) transfer protein (ttpa) | NM_001008184.1 | - | 1.7 | 1.6 | |
| X. laevis tetratricopeptide repeat domain 39B (ttc39b) | NM_001094701.1 | 1.1 | - | 1.7 | |
| # | X. laevis Tbx6 (Tbx6) | DQ355794.1 | 1.4 | 1.7 | 1 |
| X. laevis uncharacterized (LOC100036989) | NM_001097746.1 | - | 1.3 | 1.7 | |
| X. laevis cDNA clone IMAGE:6947552 | BC093552.1 | 1.3 | 1.7 | - | |
| B-cell CLL/lymphoma 10 (bcl10) | NM_001015777.2 | 1.7 | - | 1.2 | |
| Uncharacterized (LOC100494710) | XM_002939048.2 | 1.4 | 1.6 | - | |
| X. laevis keratin 17 (krt17) | NM_001094941.1 | - | 1.2 | 1.6 | |
| Membrane metallo-endopeptidase-like 1 (mmel1) | NM_001127095.1 | 0.9 | 1.1 | 1.6 | |
| Putative methyltransferase KIAA1456 homolog | XM_002934674.2 | 1.1 | - | 1.6 | |
| Phospholipase Cdelta 3 (plcd3) | XM_002935518.2 | 1.1 | 1.5 | 1.6 | |
| IdnK gluconokinase homolog (E. coli) (idnk) | NM_001126592.1 | 1.4 | 0.9 | 1.5 | |
| Uncharacterized (LOC100486093) transcript variant X2 | XM_002939117.2 | 1.5 | - | 1.5 | |
| X. laevis similar to calsequestrin 2 (cardiac muscle) | BC041283.1 | 1.1 | - | 1.5 | |
| Piwi-like RNA-mediated gene silencing 2 (piwil2) | NM_001112999.1 | 1.1 | - | 1.5 | |
| Zinc finger and BTB domain containing 20 (zbtb20) | XM_002939649.2 | 1.4 | - | 1.1 | |
| # | V-maf musculoaponeurotic fibrosarcoma oncogene homolog A (mafa) | NM_001032304.1 | 1.4 | 0.9 | 1.1 |
| X. laevis uncharacterized protein (MGC81120) | NM_001091225.1 | 1.4 | 0.9 | 1.3 | |
| # | Single-minded homolog 1 (Drosophila) (sim1) transcript variant X3 | XM_004914546.1 | 1.1 | 1.3 | 1.2 |
| Xenopus laevis alpha-2-macroglobulin-like 1 (a2ml1) | NM_001135077.1 | 1.1 | - | 1.1 | |
| X. laevis chromogranin A (parathyroid secretory protein 1) (chga) | NM_001094724.1 | 1.6 | 1.4 | 2.2 | |
| X. laevis lipaseendothelial (lipg) | NM_001090061.1 | 1.2 | 1.3 | 0.6 | |
| G protein-coupled receptor 56 (gpr56) | XM_002931653.2 | 1.7 | - | 1.6 | |
| X. laevis family with sequence similarity 101member B (fam101b) | NM_001093870.1 | 1.5 | 0.8 | 1.5 | |
| X. laevis CD81 protein (cd81-a) | NM_001086613.1 | 0.7 | 1.1 | 1.9 | |
| X. laevis calbindin D28k | BC170542.1 | 2.2 | - | 3.1 | |
| X. laevis ATPaseNa+/K+ transportingbeta 1 polypeptide (atp1b1) | NM_001086759.1 | 1.2 | 1 | 1.7 | |
| X. laevis 7-transmembrane receptor frizzled-1 | AF231711.1 | 1.4 | 1 | 2 | |
| X. laevis prostaglandin reductase 2 (ptgr2) | NM_001079334.1 | 1.4 | 1.5 | - | |
| X. laevis TGF-beta2 for transforming growth factor-beta2 | X51817.1 | 1.3 | - | 1.1 | |
| # | SRY (sex determining region Y)-box 2 (sox2) | NM_213704.3 | 1.1 | 1.3 | 1.9 |
| # | X. laevis for enhancer of split related 9 (esr9 gene) | AJ009282.1 | 1.7 | 1.6 | - |
| X. laevis mal T-cell differentiation protein (mal) | NM_001086577.1 | - | 1.2 | 1.4 | |
| Transmembrane proteaseserine 13 (tmprss13) | XM_002932904.2 | 1.5 | 1.1 | 1.9 | |
| X. laevis Ras-related associated with diabetes (rrad) | NM_001092750.1 | 8 | 4.6 | 4.2 | |
| Integrin beta 4 (itgb4) transcript variant X1 | XM_002939974.2 | 1.4 | - | 2.2 | |
| Xenopus (Silurana) tropicalis FERM domain containing 4A (frmd4a) | XM_002935243.2 | 1.1 | 0.6 | 1.3 | |
| X. laevis complement factor I (cfi-a) | NM_001085952.1 | 1.4 | 1.2 | 1.6 | |
| # | X. laevis SIX homeobox 1 (six1) | NP_001082027.1 | 1.4 | 1.2 | 2.3 |
| FH2 domain-containing protein 1-like (LOC100496216) | XM_002934907.2 | 1.9 | 0.9 | 1.9 | |
| # | X. laevis mab-21-like 2 (mab21l2-b) | NM_001096770.1 | - | 2.8 | 2.9 |
| X. laevis regulator of cell cycle (rgcc) | NM_001093976.1 | 1.3 | 1.1 | 1.7 | |
| X. laevis Cep63 | FJ464988.1 | - | 1.4 | 2.3 | |
| X. laevis CD81 antigen (target of anti proliferative antibody 1) | BC041217.1 | 1.7 | 1.1 | 2 | |
| Transmembrane serine protease 9 | BC087611.1 | 1.1 | 1.1 | 1.2 | |
| # | X. laevis POU class 3 homeobox 2 (pou3f2-b) | NM_001096751.1 | 3 | 2.3 | 2.9 |
| G protein-coupled receptor 153 (gpr153) | NM_001128052.1 | 2.5 | 1.1 | 1.5 | |
| # | X. laevis Myoblast determination protein 1 homolog A | BC041190.1 | 3.5 | 2.7 | 4.7 |
| # | T-cell leukemia homeobox 1 (tlx1) transcript variant 1 | XM_002936768.2 | 2.6 | 2.3 | 2.6 |
| X. laevis neurotrophin 3 (ntf3) | NM_001092740.1 | 1.4 | 1.5 | 1.9 | |
| X. laevis p21 GTPase-associated kinase 1 (PAK1) | AF000239.1 | 1.2 | - | 2.1 | |
| # | X. laevis hairy and enhancer of split 9, gene 1 (hes9.1-b) | NP_001089097.1 | 1.8 | 1.5 | 1.6 |
| X. laevis tetraspanin 1 (tspan1) | NM_001095473.1 | 1.2 | 0.7 | 1.3 | |
| X. laevis uncharacterized protein (MGC83079) | NM_001091250.1 | 2 | 1.5 | - | |
| X. laevis cDNA clone IMAGE:5085355 | BC073731.1 | 1.3 | - | 1.4 | |
| Family with sequence similarity 198member A (fam198a) | XM_002937853.2 | 1.7 | 0.7 | 1.3 | |
| Progestin and adipoQ receptor family member IX (paqr9) | XM_004914351.1 | 1.7 | - | 1.2 | |
| # | Hairy and enhancer of split 8 (hes8) | XM_002933849.2 | 2.8 | 1.7 | 3.6 |
| X. laevis p21 GTPase-associated kinase 1 | BC081113.1 | 1.3 | 0.8 | 1.7 | |
| Finished cDNA clone TNeu008g03 | CR761907.2 | 1.2 | 1.1 | 0.7 | |
| WD repeat domain 27 (wdr27) | XM_002931515.2 | 1.2 | 2.2 | 1.1 | |
| # | Growth factor independent 1 transcription repressor (gfi1) | XM_002933803.2 | 1.8 | 1.8 | 3.2 |
| Protein phosphatase 2 regulatory subunit B'beta (ppp2r5b) | NM_001100279.1 | 2.4 | 1.4 | 4.2 | |
| Ornithine decarboxylase antizyme 2 (oaz2), transcript variant 2 | NP_001106583.2 | 1.8 | - | 1.5 | |
| X. laevis fast troponin T (TNNT3) | AY114144.1 | - | 1.1 | 1.5 | |
| # | X. laevis xRipply3 for xRipply3 protein | AB455086.1 | 0.9 | 1.1 | 2 |
| RAS-like family 11member B (rasl11b) | NM_001015774.1 | - | 1.2 | 1.4 | |
| X. laevis for thimet oligopeptidase | BC070748.1 | 3.8 | - | 2 | |
| X. laevis fibroblast growth factor 3 (fgf3) | NM_001008153.1 | 2 | 1.2 | 2 | |
| X. laevis cDNA clone IMAGE:8332229 | BC155363.1 | 1.5 | 0.9 | 1.4 | |
| Proline rich 15 (prr15) | XM_002933381.2 | 1.6 | - | 1.3 | |
| Integrin beta 6 (itgb6) | NM_001097306.1 | 2.3 | 0.6 | 2.8 | |
| # | Xenopus laevis empty spiracles homeobox 1, gene 2 (emx1.2) | NM_001093430.1 | 2.6 | 1.4 | 2.1 |
| X. laevis p21-activated kinase (PAK1) | AF169794.1 | 1.4 | 1.8 | 2.6 | |
| # | ISL LIM homeobox 2 (isl2) | NM_001166041.1 | 1.5 | - | 1.7 |
| # | Atonal homolog 1 (Drosophila) (atoh1) | XM_004911085.1 | 0.9 | 1.1 | 1.5 |
| Ectodysplasin A receptor (edar) | NM_001087047.1 | 4.3 | - | 3.3 | |
| X. laevis degr03 | DQ096846.1 | 2.1 | 2.2 | 2 | |
| Calcyphosine (caps) | NM_001097320.1 | - | 1.4 | 3.7 | |
| X. laevis kiaa0930 | NM_001086221.1 | 1.5 | 1 | 1.6 | |
| Putative N-acetyltransferase 16-like (LOC100490742) | XM_002943189.1 | 2.1 | 1 | 1.7 | |
| # | T-box 15 (tbx15) | XM_002940981.2 | 2 | 1 | 1.8 |
| # | SRY (sex determining region Y)-box 1 (sox1) | NM_001080996.1 | 0.6 | 1.5 | 1.2 |
| Cytochrome P450 family 2 subfamily C polypeptide 18 (cyp2c18) | NM_001091776.1 | 2.1 | 1.4 | 1.6 | |
| X. laevis calcitonin receptor-like (calcrl) | NM_001086737.1 | 1.1 | 0.8 | 1.6 | |
| X. laevis claudin 3 (cldn3) | NM_001005709.1 | 2.1 | 1.3 | 1.5 | |
| Atlastin GTPase 1 (atl1) | NM_001078754.1 | 1.8 | 2 | 1.7 | |
| Rho GTPase activating protein 9 (arhgap9), transcript variant X2 | XM_012957829 | 1.8 | 1.2 | 3.4 | |
| # | X. laevis Hes2 | BC084134.1 | 1.7 | 0.9 | 1.3 |
| X. laevis U3 snRNA | X07318.1 | 1 | 2.8 | 1.1 | |
| Uncharacterized (LOC101732195) | XM_004912378.1 | 2 | - | 1.5 | |
| Tumor necrosis factor receptor superfamilymember 21 (tnfrsf21) | NM_001079136.1 | 1.1 | 0.8 | 1.2 | |
| X. laevis arginase 3 | U08408.1 | - | 1.3 | 1.8 | |
| ChaC cation transport regulator homolog 1 (chac1) | XM_002939546.2 | 1.2 | 1.3 | 1.5 | |
| X. laevis DIRAS familyGTP-binding RAS-like 3 (diras3) | NM_001095243.1 | 0.8 | 1.7 | 1.4 | |
| X. laevis DnaJ (Hsp40) homolog subfamily C member 27 (dnajc27-b) | NM_001095422.1 | 1.1 | 0.8 | 1.1 |
-
* Genes are ranked by FC value, using the highest FC in each of the three treatment groups. Genes included must have FC ≥ 1 in at least two out of the three treatment groups as well as showing at least a two-fold difference in FC to the un-injected control (not shown). Corresponding values ≥0.5 are shown for all treatments.
-
† Log2 Fold change values after Six1-GR overexpression.
-
‡ Log2 Fold change values after Eya1-GR overexpression.
-
§ Log2 Fold change values after Six1-GR+Eya1-GR overexpression.
-
# Denotes transcription factors with at least a two-fold change in at least two treatment groups selected for further analysis.
Table 2
Transcription factors and co-factors selected for characterisation by in-situ-hybridisation ranked by FC value in individual treatment.
| Annotation | Gene | Accession | Individual | Merged | ||||
|---|---|---|---|---|---|---|---|---|
| Six1* | Eya1† | Six1+Eya1‡ | Six1§ | Eya1# | Six1+Eya1¶ | |||
| SIX homeobox 2 (Six2) | Six2 | NM_001100275.1 | 5 | 3.5 | 5.9 | 5.4** | 5** | 4.9** |
| X. laevis for Xsox17-alpha protein | Sox17 | AJ001730.1 | 3.6 | 2.6 | 4.8 | 4.4** | 3.3** | 3.5** |
| X. laevis Myoblast determination protein 1 homolog A | MyoD1 | BC041190.1 | 3.5 | 2.7 | 4.7 | 4.1** | 4.2** | 3.9** |
| Hairy and enhancer of split 8 (Hes8) | Hes8 | XM_002933849.2 | 2.8 | 1.7 | 3.6 | 3.2** | 3.2** | 3.1** |
| Growth factor independent 1 transcription repressor (Gfi1) | Gfi1a | XM_002933803.2 | 1.8 | 1.8 | 3.2 | 2.4** | 2.6** | 4.1** |
| X. laevis POU class 3 homeobox 2 (Pou3f2-b) | Pou3f2b | NM_001096751.1 | 3 | 2.3 | 2.9 | 3** | 2.6** | 2.7** |
| X. laevis Mab-21-like 2 (Mab21l2-b) | Mab21l2b | NM_001096770.1 | - | 2.8 | 2.9 | - | - | - |
| T-cell leukemia homeobox 1 (Tlx1) transcript variant 1 | Tlx1 | XM_002936768.2 | 2.6 | 2.3 | 2.6 | 2.4** | 2.4** | 2.4** |
| X. laevis empty spiracles homeobox 1 gene 2 (Emx1.2) | Emx1.2 | NM_001093430.1 | 2.6 | 1.9 | 1.1 | - | - | 1.7** |
| X. laevis SRY-box containing protein (Sox1) | Sox1 | EF672727.1 | - | 2.6 | 2.1 | - | 2** | - |
| Single-minded homolog 1 (Sim1) transcript variant X2 | Sim1 | XM_004914545.1 | - | 1.4 | 2.4 | - | - | - |
| X. laevis SIX homeobox 1 (Six1) | Six1 | AF279254.1 | 1.4 | 1.2 | 2.3 | 1.9** | 1.6** | 1.6** |
| F-box protein 41 (Fbxo41) | Fbxo41 | NM_001079043.1 | 1.3 | 0.6 | 2 | - | - | - |
| T-box 15 (Tbx15) | Tbx15 | XM_002940981.2 | 2 | 1 | 1.8 | 2** | 1.4** | 1.7** |
| X. laevis xRipply3 for xRipply3 protein | Ripply3 | AB455086.1 | 0.9 | 1.1 | 2 | 1.6** | 1.4** | 1.3** |
| Early growth response 3 (Egr3) | Egr3 | XM_002932703.2 | 1.6 | 0.8 | 1.9 | 1.7** | 1.3** | 1.9** |
| SRY (sex determining region Y)-box 2 (Sox2) | Sox2 | NM_213704.3 | 1.1 | 1.3 | 1.9 | 1.6** | 1.6** | 1.5** |
| POU class 4 homeobox 1 (Pou4f1.2) | Pou4f1.2 | NM_001097307.1 | 1.3 | 1 | 1.9 | 1.6** | 1.5** | 1.5** |
| X. laevis for enhancer of split related 9 (Esr9 gene) | Hes9.1a | AJ009282.1 | 1.7 | 1.6 | - | - | - | - |
| ISL LIM homeobox 2 (Isl2) | Isl2 | NM_001166041.1 | 1.5 | - | 1.7 | 1.6** | 1.1** | 1.4** |
| X. laevis Tbx6 (Tbx6) | Tbx6 | DQ355794.1 | 1.4 | 1.7 | 1 | - | - | - |
| Protein FosB-like transcript variant X2 | FosB | XM_004916957.1 | - | 1.7 | 1.4 | - | 1.4** | 1.2** |
| X. laevis Hes2 | Hes2 | BC084134.1 | 1.7 | 0.9 | 1.3 | - | - | - |
| cAMP responsive element modulator (Crem) | Crem | XM_002935162.2 | - | 1.4 | 1.5 | - | 1.4** | 1.2** |
| X. laevis zinc finger protein 214 (Znf214) | Znf214 | NM_001097042.1 | 1.2 | 0.8 | 1.5 | 1.2** | 5.9** | 5.8** |
| Xenopus laevis SRY (sex determining region Y)-box 21 (Sox21) | Sox21 | NM_001172213.1 | 1.2 | 0.6 | 1.5 | 1.4** | 1.2** | 1.2** |
| Atonal homolog 1 (Drosophila) (Atoh1) | Atoh1 | XM_004911085.1 | 0.9 | 1.1 | 1.5 | 1 | 1 | 1 |
| X. laevis Ets-2a proto-oncogene | Ets2a | BC133183.1 | 1.3 | 1 | 1.4 | 1.3** | 1.2** | 1.2** |
| V-maf musculoaponeurotic fibrosarcoma oncogene homolog A (Mafa) | Mafa | NM_001032304.1 | 1.4 | 0.9 | 1.1 | 1.9** | - | 1.8** |
| X. laevis LIM class homeodomain protein | Lhx5 | BC084744.1 | 1.1 | - | 1.1 | - | - | - |
| Xenopus (Silurana) tropicalis neurogenin 1 (Neurog1) | Ngn1 | NM_001123423.1 | 0.8 | 0.9 | 0.8 | 0.8 | 0.8 | 0.8** |
| Xenopus laevis SOX3 protein | Sox3 | BC072222.1 | 0.5 | - | 0.9 | 0.7 | 0.7 | 0.6 |
-
*Log2 fold change values after Six1 overexpression (Six1i).
-
† Log2 fold change values after Eya1 overexpression (Eya1i).
-
‡ Log2 fold change values after Six1+Eya1 overexpression (Six1+ Eya1i).
-
§ Log2 fold change values after overexpression of Six1 or Six1+Eya1 (Six1m).
-
# Log2 fold change values after overexpression of Eya1 or Six1+Eya1 (Eya1m).
-
¶ Log2 fold change values after overexpression of Six1 or Eya1 or Six1+Eya1 (Six1+Eya1m).
-
** Denotes statistically supported data (q < 0.05).
Table 3
Changes in marker gene expression in the placodes after injection of various constructs.
| Injection | Six1-MO* | Eya1-MO* | Six1-EnR | Eya1-mmMO | Six1-GR§ | Eya1-GR§ | |
|---|---|---|---|---|---|---|---|
| Phenotype | % | % | % | % | % | % | |
| (n) | (n) | (n) | (n) | (n) | (n) | ||
| Atoh1 | Reduced | 77** | 90‡ | 94 | 10 | 26 | 42 |
| (26) | (20) | (18) | (21) | (19) | (12) | ||
| Increased | 0 | 0 | 0 | 0 | 35 | 42 | |
| (26) | (20) | (18) | (21) | (17) | (12) | ||
| Gfi1a | Reduced | 82† | 67† | 69 | 31 | 57 | 36 |
| (27) | (17) | (16) | (26) | (14) | (14) | ||
| Increased | 0 | 0 | 0 | 0 | 7 | 43 | |
| (27) | (17) | (16) | (26) | (14) | (14) | ||
| Hes8 | Reduced | 74‡ | 83‡ | 70 | 17 | 60 | 57 |
| (35) | (35) | (46) | (24) | (40) | (56) | ||
| Increased | 0 | 0 | 24 | 0 | 15 | 29 | |
| (35) | (35) | (46) | (24) | (40) | (56) | ||
| Hes9 | Reduced | 73‡ | 76‡ | 84 | 11 | 75 | 29 |
| (45) | (33) | (38) | (27) | (12) | (29) | ||
| Increased | 0 | 0 | 8 | 0 | 0 | 0 | |
| (45) | (33) | (38) | (27) | (12) | (29) | ||
| Isl2 | Reduced | 66† | 100‡ | nd | 27 | 50 | 24 |
| (38) | (17) | nd | (22) | (18) | (17) | ||
| Increased | 6 | 0 | nd | 0 | 31 | 41 | |
| (38) | (17) | nd | (22) | (16) | (17) | ||
| Ngn1 | Reduced | 65‡ | 49† | 84 | 17 | 17 | 36 |
| (51) | (43) | (31) | (24) | (30) | (59) | ||
| Increased | 0 | 16 | 6 | 4 | 23 | 41 | |
| (51) | (43) | (31) | (24) | (30) | (59) | ||
| Pou4f1.2 | Reduced | 67‡ | 63† | 71 | 16 | 47 | 81 |
| (48) | (30) | (35) | (19) | (15) | (37) | ||
| Increased | 0 | 0 | 0 | 0 | 13 | 0 | |
| (48) | (30) | (35) | (19) | (15) | (37) | ||
| Sox2 | Reduced | 74‡ | 78‡ | 87 | 6 | 90 | 48 |
| (19) | (18) | (30) | (16) | (21) | (33) | ||
| Increased | 0 | 0 | 23# | 0 | 0 | 12 | |
| (19) | (18) | (30) | (16) | (21) | (33) | ||
| Sox3 | Reduced | 68‡ | 54† | 39 | 9 | 49 | 40 |
| (25) | (26) | (31) | (22) | (25) | (23) | ||
| Increased | 0 | 0 | 71# | 0 | 16 | 17 | |
| (25) | (26) | (31) | (22) | (25) | (23) | ||
| Tlx1 | Reduced | 84† | 91‡ | 100 | 33 | 40 | 7 |
| (31) | (32) | (13) | (15) | (10) | (15) | ||
| Increased | 6 | 0 | 0 | 0 | 40 | 73 | |
| (31) | (32) | (13) | (15) | (10) | (15) |
-
* Significant differences (Fisher’s exact test);
-
† p<0.05,
-
‡ p<0.001) to Eya1-mmMO injections are indicated.
-
§ Dexamethasone treatment from stages 16–18 on.
-
# Expression ectopic in epidermis.
-
n: Number of embryos analysed at both neural plate (stage 14–16) and tail bud (stage 21–26) stage.
-
nd: Not determined.
Additional files
-
Supplementary file 1
Top 1000 expressed genes (by FPKM) in the placodal transcriptome.
- https://doi.org/10.7554/eLife.17666.024
-
Supplementary file 2
Tables of differentially expressed genes after overexpression of Six1-GR, Eya1-GR or Six1-GR+Eya1-GR: Individual treatment groups.
Table 1: Genes with at least two-fold up-regulation after injection of Six1-GR and treatment with CHX + DEX. Table 2: Genes with at least two-fold up-regulation after injection of Eya1-GR and treatment with CHX + DEX. Table 3: Genes with at least two-fold up-regulation after injection of Six1-GR+Eya1-GR and treatment with CHX + DEX. Table 4: Genes with at least two-fold down-regulation after injection of Six1-GR and treatment with CHX + DEX. Table 5: Genes with at least two-fold down-regulation after injection of Eya1-GR and treatment with CHX + DEX. Table 6: Genes with at least two-fold down-regulation after injection of Six1-GR+Eya1-GR and treatment with CHX + DEX.
- https://doi.org/10.7554/eLife.17666.025
-
Supplementary file 3
Tables of differentially expressed genes after overexpression of Six1-GR, Eya1-GR or Six1-GR+Eya1-GR: Merged treatment groups.
Table 1: Genes with at least two-fold up-regulation after injection of Six1-GR or Six1-GR+Eya1-GR and treatment with CHX + DEX. Table 2: Genes with at least two-fold up-regulation after injection of Eya1-GR or Six1-GR+Eya1-GR and treatment with CHX + DEX. Table 3: Genes with at least two-fold up-regulation after injection of Six1-GR or Eya1-GR or Six1-GR+Eya1-GR and treatment with CHX + DEX. Table 4: Genes with at least two-fold down-regulation after injection of Six1-GR or Six1-GR+Eya1-GR and treatment with CHX + DEX. Table 5: Genes with at least two-fold down-regulation after injection of Eya1-GR or Six1-GR+Eya1-GR and treatment with CHX + DEX. Table 6: Genes with at least two-fold down-regulation after injection of Six1-GR or Eya1-GR or Six1-GR+Eya1-GR and treatment with CHX + DEX.
- https://doi.org/10.7554/eLife.17666.026
-
Supplementary file 4
Primer sequences with modifications.
- https://doi.org/10.7554/eLife.17666.027
Download links
A two-part list of links to download the article, or parts of the article, in various formats.
Downloads (link to download the article as PDF)
Open citations (links to open the citations from this article in various online reference manager services)
Cite this article (links to download the citations from this article in formats compatible with various reference manager tools)
Dissecting the pre-placodal transcriptome to reveal presumptive direct targets of Six1 and Eya1 in cranial placodes
eLife 5:e17666.
https://doi.org/10.7554/eLife.17666


