Synchronous beta rhythms of frontoparietal networks support only behaviorally relevant representations
- Massachusetts Institute of Technology, United States
- University of California at Davis, United States
Figures
Figure 1 with 1 supplement

The task design.
(A) The trial started when the animal held a bar and maintained visual fixation on the red central dot for 1 s. During fixation, in order to help the animal re-calibrate the Above/Below categorization boundary after the last trial, the 2 hemi-boundaries were also displayed. The sample stimulus appeared either above or below the horizontal meridian. To reduce the possibility of perceptual binding between the sample stimulus and the horizontal boundaries, there was a brief, 200 ms time gap between the two displays (pre-sample epoch). After the post-sample delay epoch, 2 hemi-boundaries were displayed at new locations, according to a CW (as shown) or CCW shift. The animal had to adjust the decision criterion based on the location of the new boundaries. When a test stimulus appeared, it had to be compared to the sample stimulus in a boundary-referenced, rather than a retinotopic, spatial frame. If a non-match, the first test would be followed by a second test, always a match to the sample category. Until display of a match test, the animal had to maintain visual fixation and contact with the bar. Upon a match test display, the animal had to release the bar for liquid reward. (B) Sample stimuli could appear randomly at any one of the 144 locations shown (top), with equal probability in the category Above or Below (DVA: degrees of visual angle). Test stimuli (equal probability for categories above and below the new boundaries) could appear at any one of the 624 locations shown (bottom). The continuous red horizontal lines in the test space indicate the position of hemi-boundaries after CW shift, and the dashed lines (dashed only for illustration) indicate the CCW shift. Each trial would test one of 89,856 possible sample-test combinations, equally distributed between match and non-match types. After the boundary shift, the Above/Below categories spanned a visual area that overlapped with the corresponding area of the pre-shift categories by 50%. (C) The probability to categorize a sample stimulus as ‘Above', 'Below', 'Left’, or 'Right’, by spatial location. The animals would choose Left or Right with equal probability, because the Left/Right dimension was task-irrelevant. See also Figure 1—figure supplement 1.
Figure 1—figure supplement 1
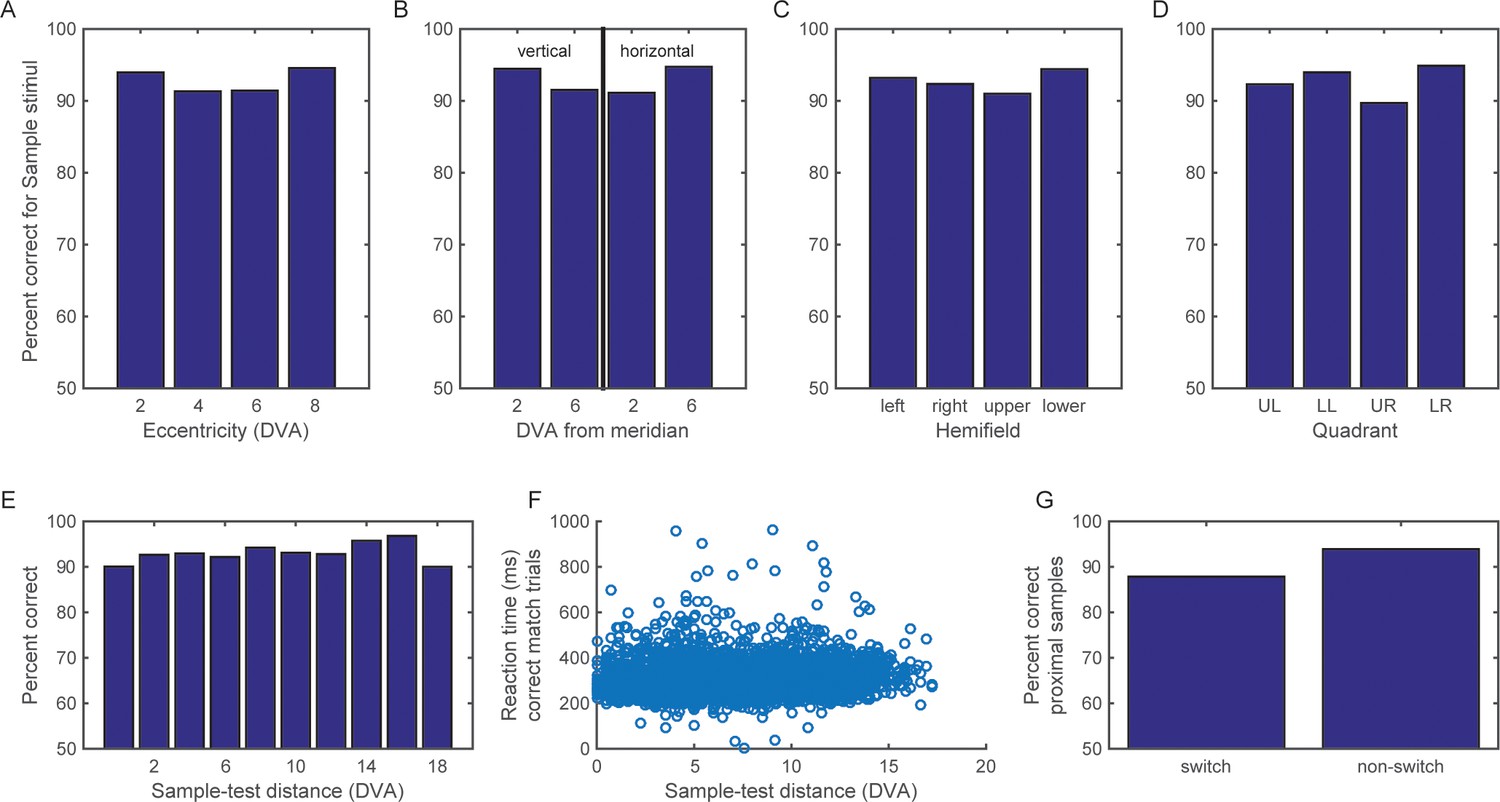
Performance on the categorization task.
The animals’ performance on the categorization task remained above 85% correct, regardless of the eccentricity of the sample stimuli (A), their distance from the vertical and horizontal meridians (B), the horizontal or vertical hemifield of their display (C), or the visual quadrant (D). Both the monkeys’ accuracy (E) and reaction time (F) were similar across a range of distance between the sample and test stimuli. (G) For those samples that were proximal to the boundary (at y = 2 or −2 degrees), accuracy remained above 85% even when they flipped to the other side of the new category boundaries (as in the example shown in Figure 1A).
Figure 2 with 3 supplements
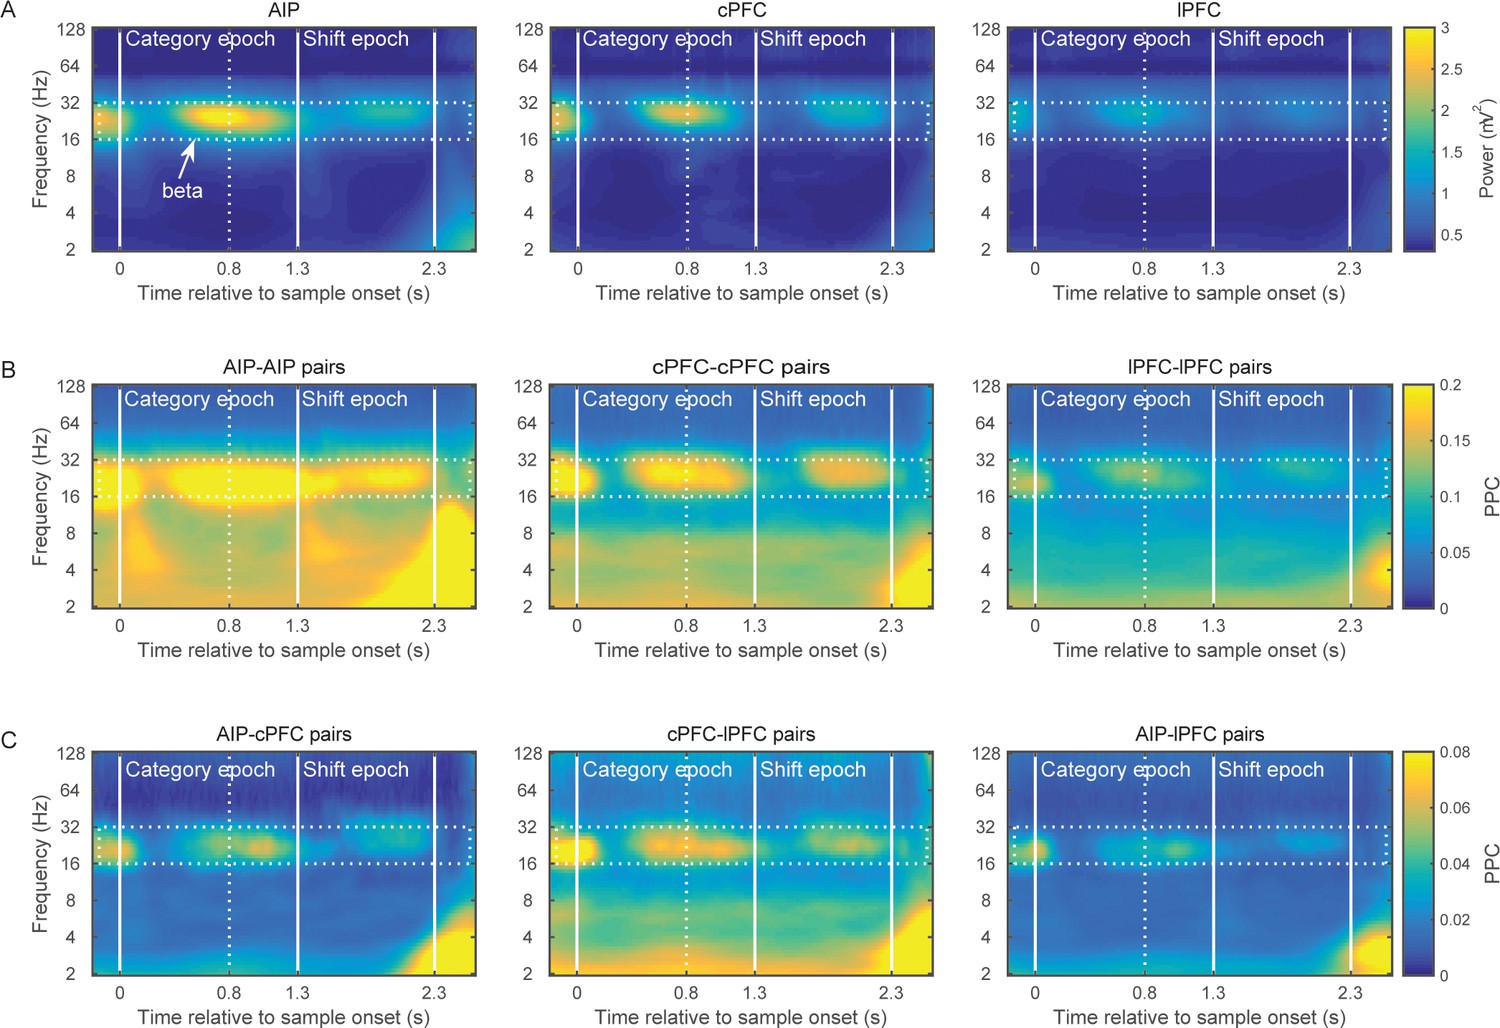
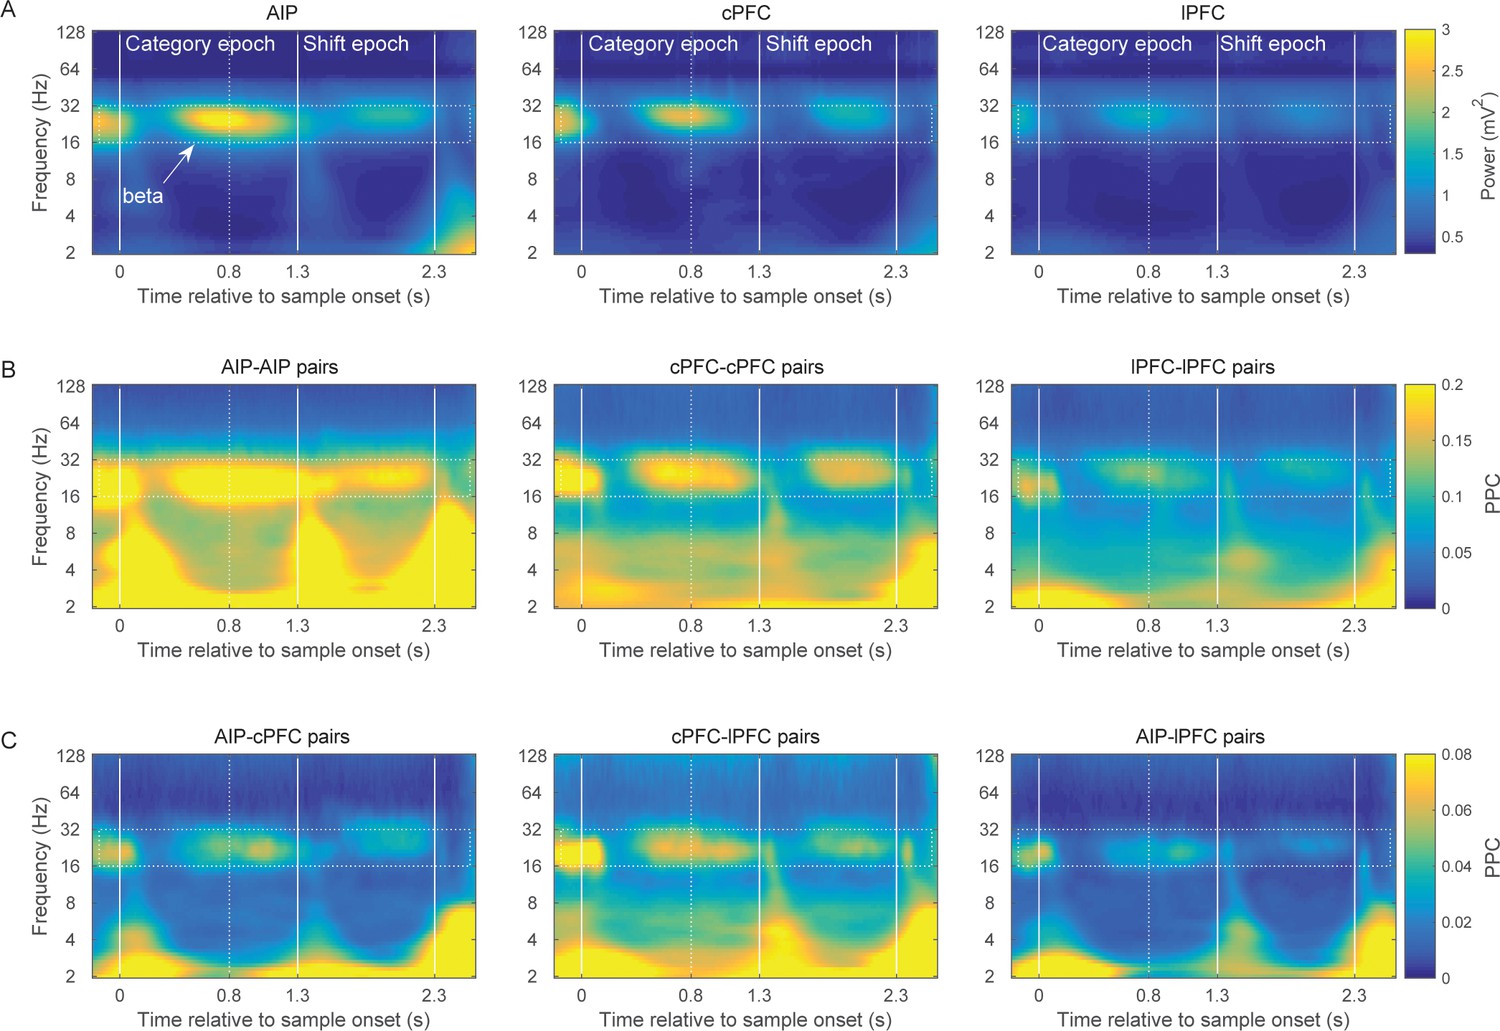
Brain rhythms of the frontoparietal network.
(A) Average power (mV2) of the LFPs recorded from AIP (left), cPFC (middle), and lPFC (right) electrodes in time-frequency space. Strong oscillations are seen at the beta band (16–32 Hz; dotted rectangle in all panels) in all three areas. For these analyses, the evoked component has been removed from the LFPs, and the power has been normalized to 1/f. Spectral analyses were performed at six octaves (2–128 Hz), at a 0.1 octave resolution (i.e., 10 frequency bins per octave). Vertical white lines demarcate the Category and Shift epochs, and dashed white lines indicate the end of sample display. (B) Strong synchrony (Pairwise Phase Consistency) of beta-band oscillations (16–32 Hz) is observed across pairs of electrodes within AIP (left), cPFC (middle) and lPFC (right). (C) As also seen with power (A) and intrinsic synchrony in the three areas (B), strong synchrony of beta-band rhythms is also seen in the extrinsic pairs of electrodes across the three areas: AIP-cPFC (left), cPFC-lPFC (middle), and AIP-lPFC (right). Recording sites appear in Figure 2—figure supplement 1. The corresponding figure before removal of the evoked component appears in Figure 2—figure supplement 3 and the cross-area synchrony for match vs. non-match trials appears in Figure 2—figure supplement 2.
Figure 2—figure supplement 1
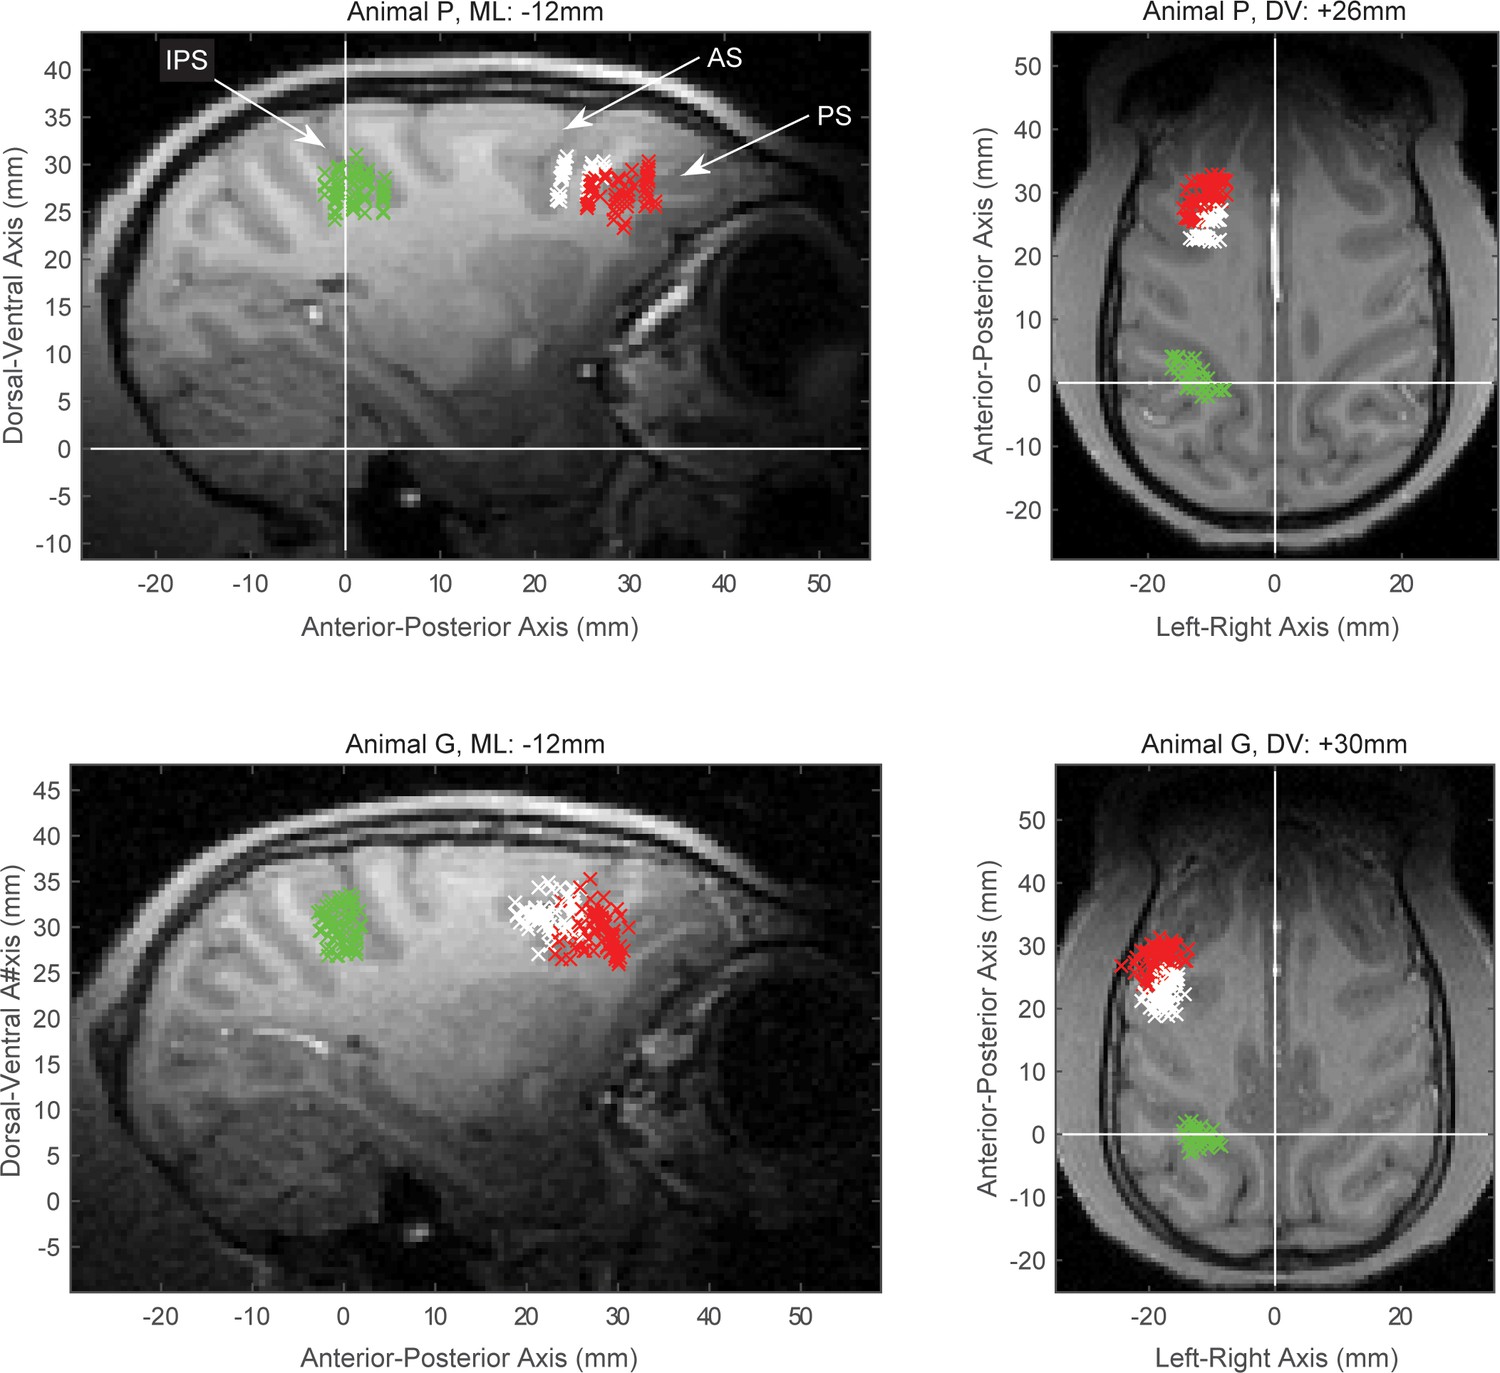
Electrophysiological recording sites.
The MRI-guided recording sites, projected to a single sagittal (left) and a single horizontal (right) slice from animal P (top) and animal G (bottom). The intraparietal sulcus (IPS), arcuate sulcus (AS) and principal sulcus (PS) are indicated on the top left panel. The data from posterior parietal recordings came from the anterior intraparietal area, located on the rostral lateral bank of IPS (area AIP, green marks). Data from prefrontal recordings were distinguished between the sites around the AS (area 8A, white marks), which we label as caudal PFC (cPFC) in the text, and the area around the PS (red marks), which included areas 46 and 45 and we label as lateral PFC (lPFC) in the text.
Figure 2—figure supplement 2
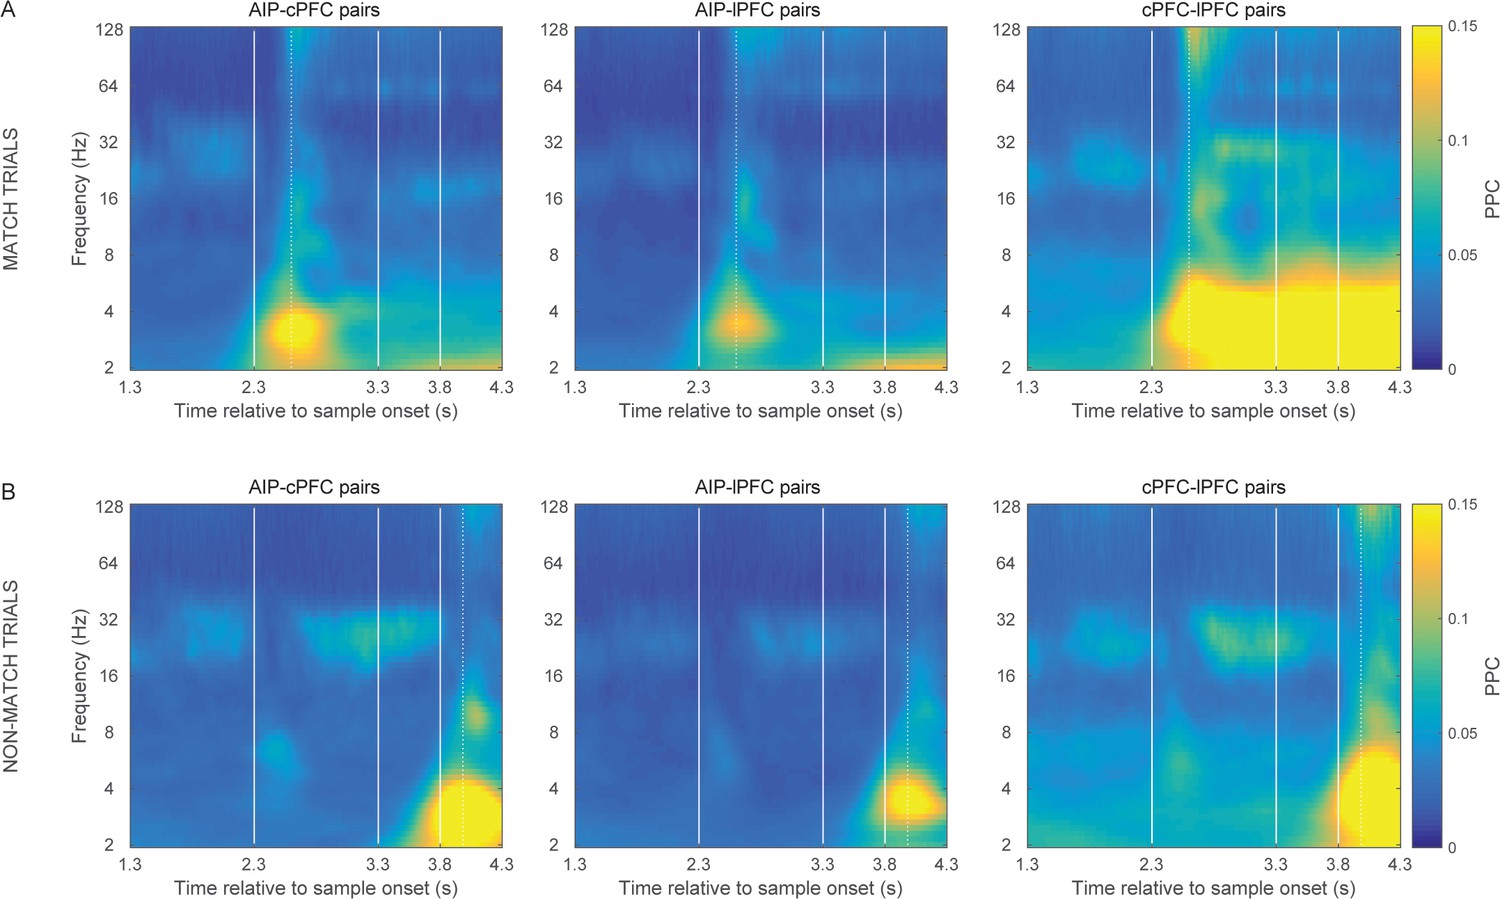
Match vs.non-match trials.
Frontoparietal synchrony following the Shift epoch separately for match (A) and non-match trials (B). Strong synchrony of low frequency rhythms was observed upon presentation of the test stimulus that matched the sample category (at 2.3 s following sample onset for match trials and at 3.8 s for non-match trials). This effect may be related to the bar-release motor movement, the oculomotor movement that typically follows the release from required visual fixation, or the reward. Vertical lines demarcate the onset of the test stimulus display (2.3 s), the delay interval following (at 3.3 s), and the onset of the second test at non-match trials (3.8 s). Dotted vertical lines mark the average reaction time in match (299.06 ms) and non-match trials (181.86 ms), relative to the display onset of the corresponding match test stimulus.
Figure 2—figure supplement 3
Power and synchrony of LFPs before removal of the evoked component.
The results are very similar to those of Figure 2, except for some stimulus-locked effects at low frequencies.
Figure 3
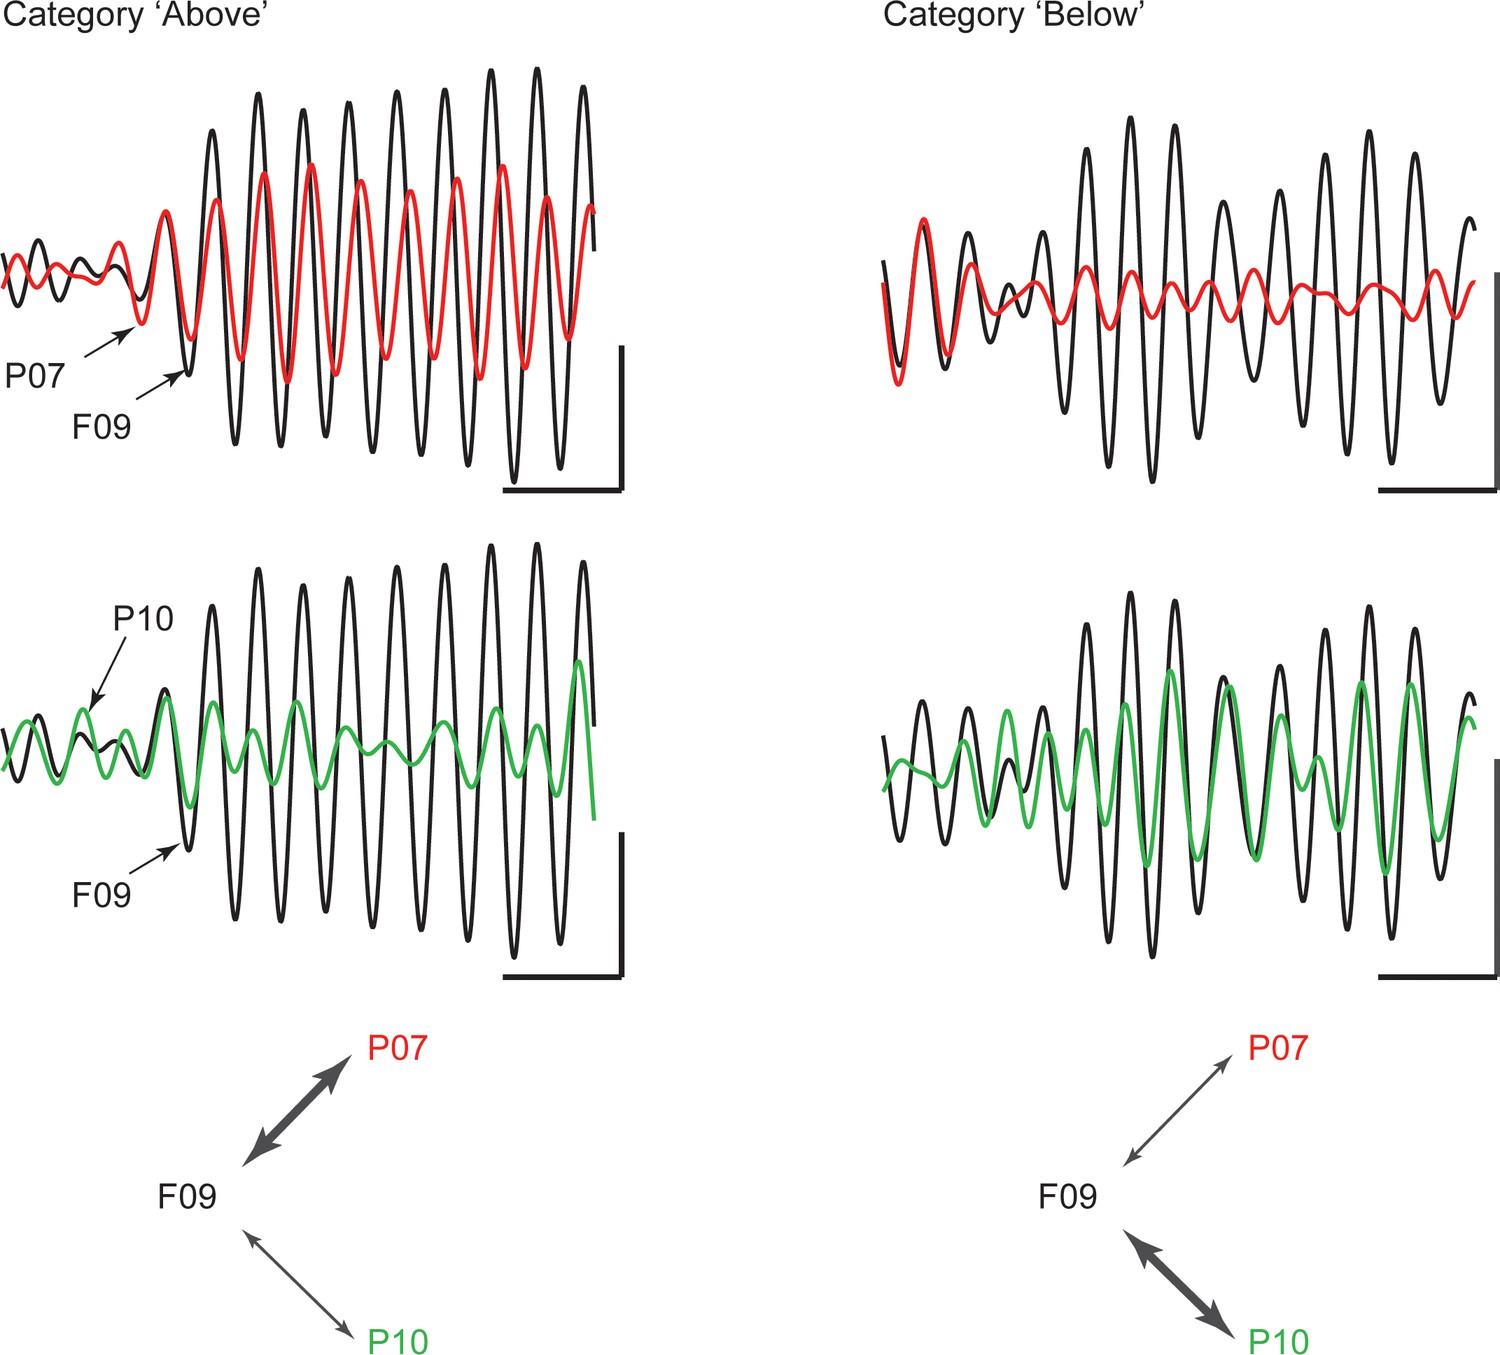
Example traces of beta rhythms with category-selective synchrony.
During a trial of category Above (left), a cPFC electrode (F09; black trace) displays stronger phase and amplitude coupling with one AIP electrode (P07; red) than with another (P10; green). The strength of coupling among the same electrodes is reversed during a trial of category Below (right). The cPFC electrode now couples more weakly with the P07 than with the P10 electrode. Scale bars: 0.4 mV and 100 ms.
Figure 4 with 3 supplements

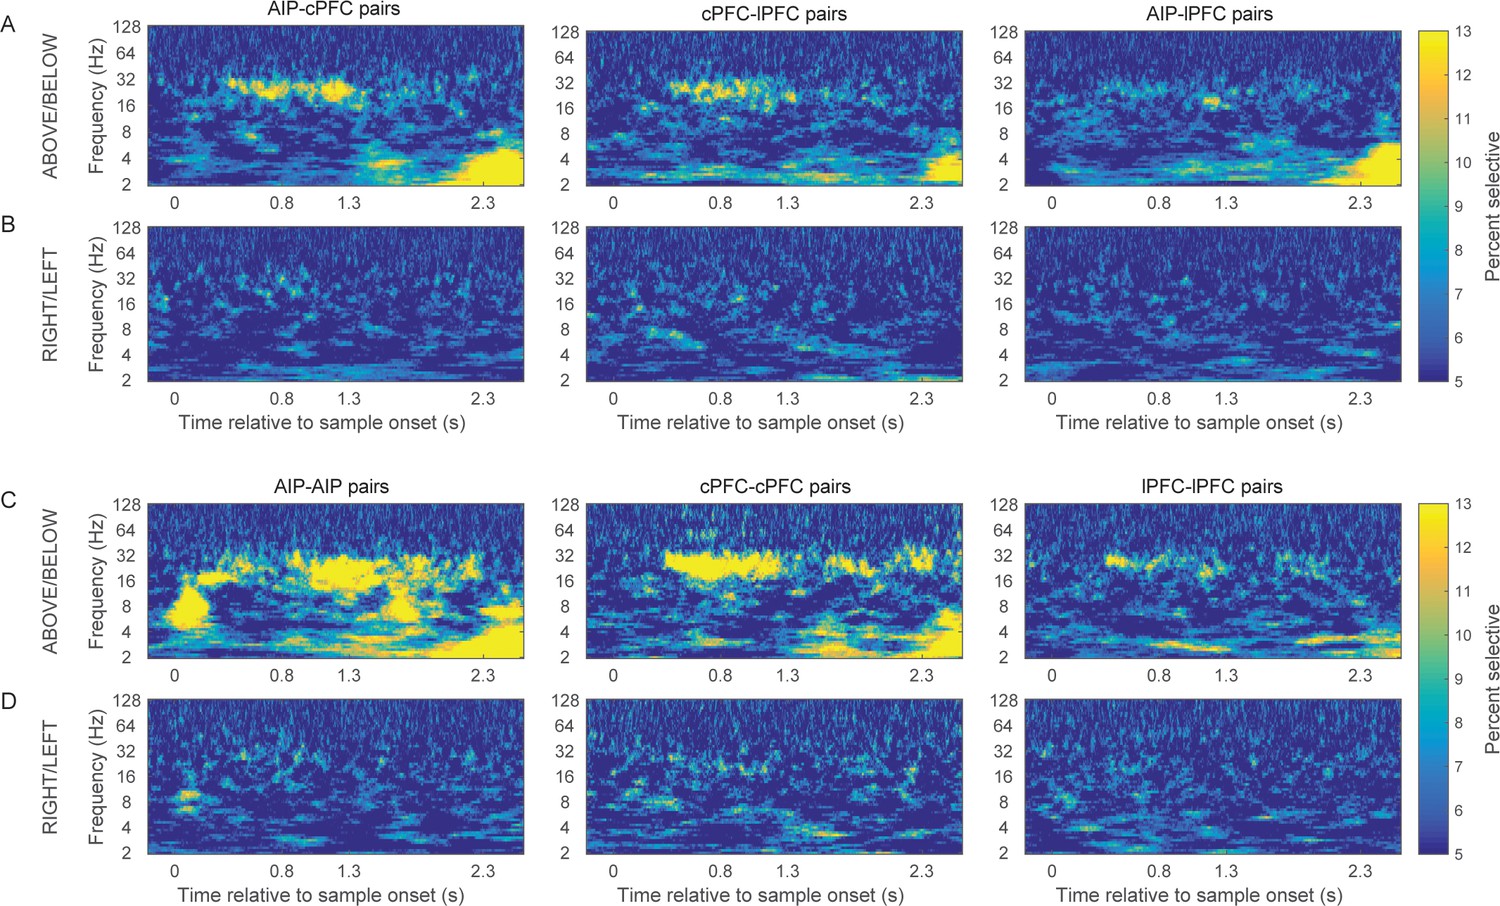
Category-selective synchrony of frontoparietal rhythms.
(A) and (B) Population average of PPC selectivity of all simultaneously recorded pairs of AIP and cPFC (left), cPFC and lPFC (middle), lPFC and AIP (right) electrodes along the task-relevant, Above/Below, dimension (A) and task-irrelevant, Right/Left, dimension (B). (C) and (D) PPC selectivity of intrinsic pairs of electrodes within AIP (left), cPFC (middle) and lPFC (right) along the Above/Below (C) and Right/Left (D) dimensions. In all panels, contours identify regions of time-frequency space with statistically significant population selectivity. Similar time-frequency dependent patterns were seen in the percent of sites with significantly selective synchrony (see Figure 4—figure supplement 1). The time-frequency dynamics of PPC were similar for both the Above and Below categories (see Figure 4—figure supplement 2).
Figure 4—figure supplement 1
Prevalence of category-selective synchrony of frontoparietal rhythms.
Same as Figure 4, but for the percent of pairs of electrodes with statistically significant category selectivity in PPC.
Figure 4—figure supplement 2
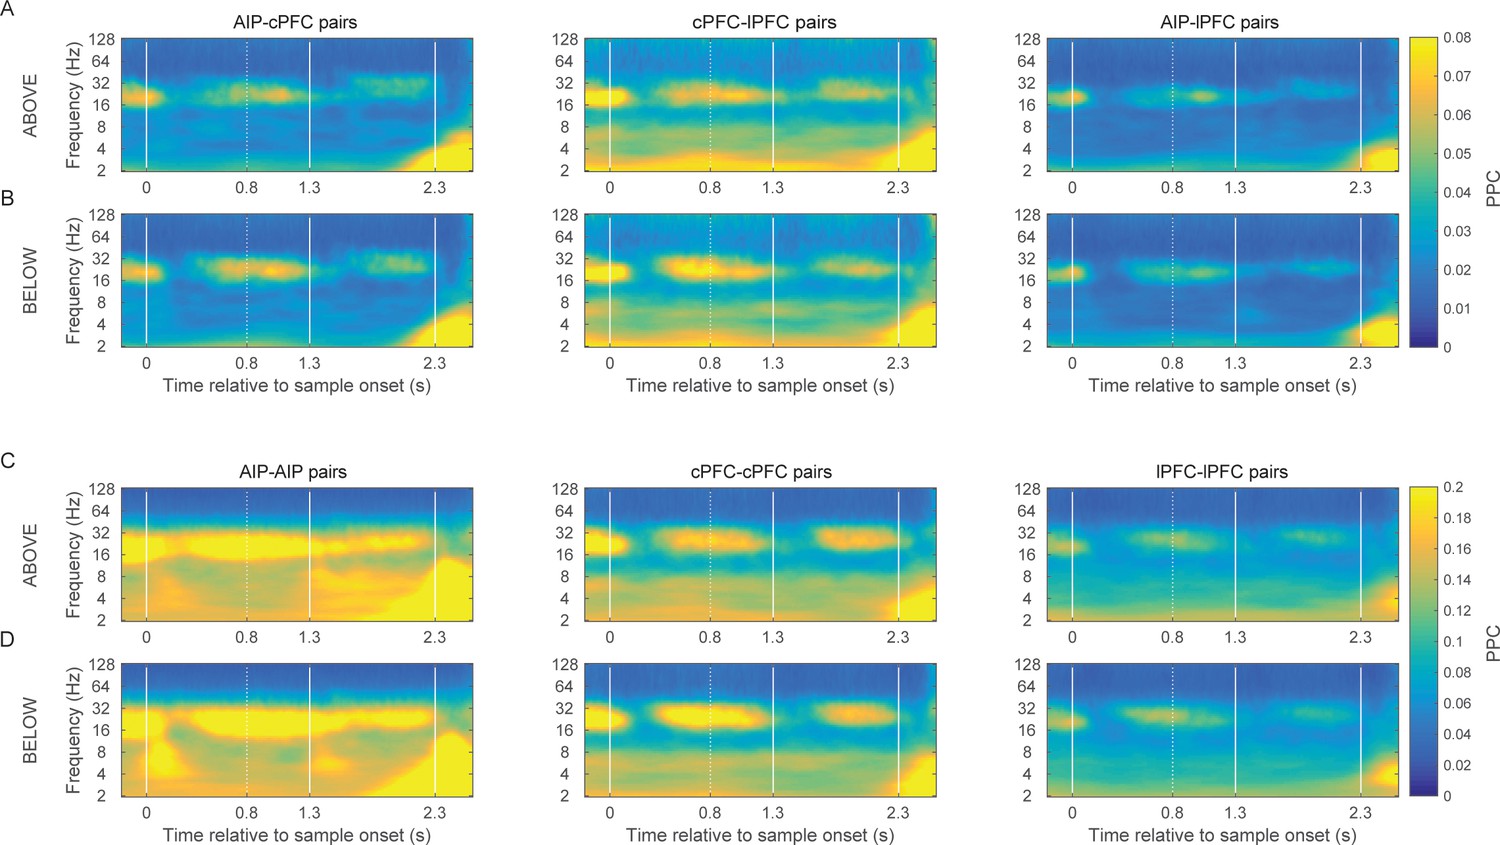
Category-specific synchrony of oscillations in the frontoparietal network.
The time-frequency dynamics of synchrony are very similar for both the Above and the Below categories in the between-area pairs of electrodes (A and B) as well as the within-area pairs of electrodes (C and D).
Figure 4—figure supplement 3
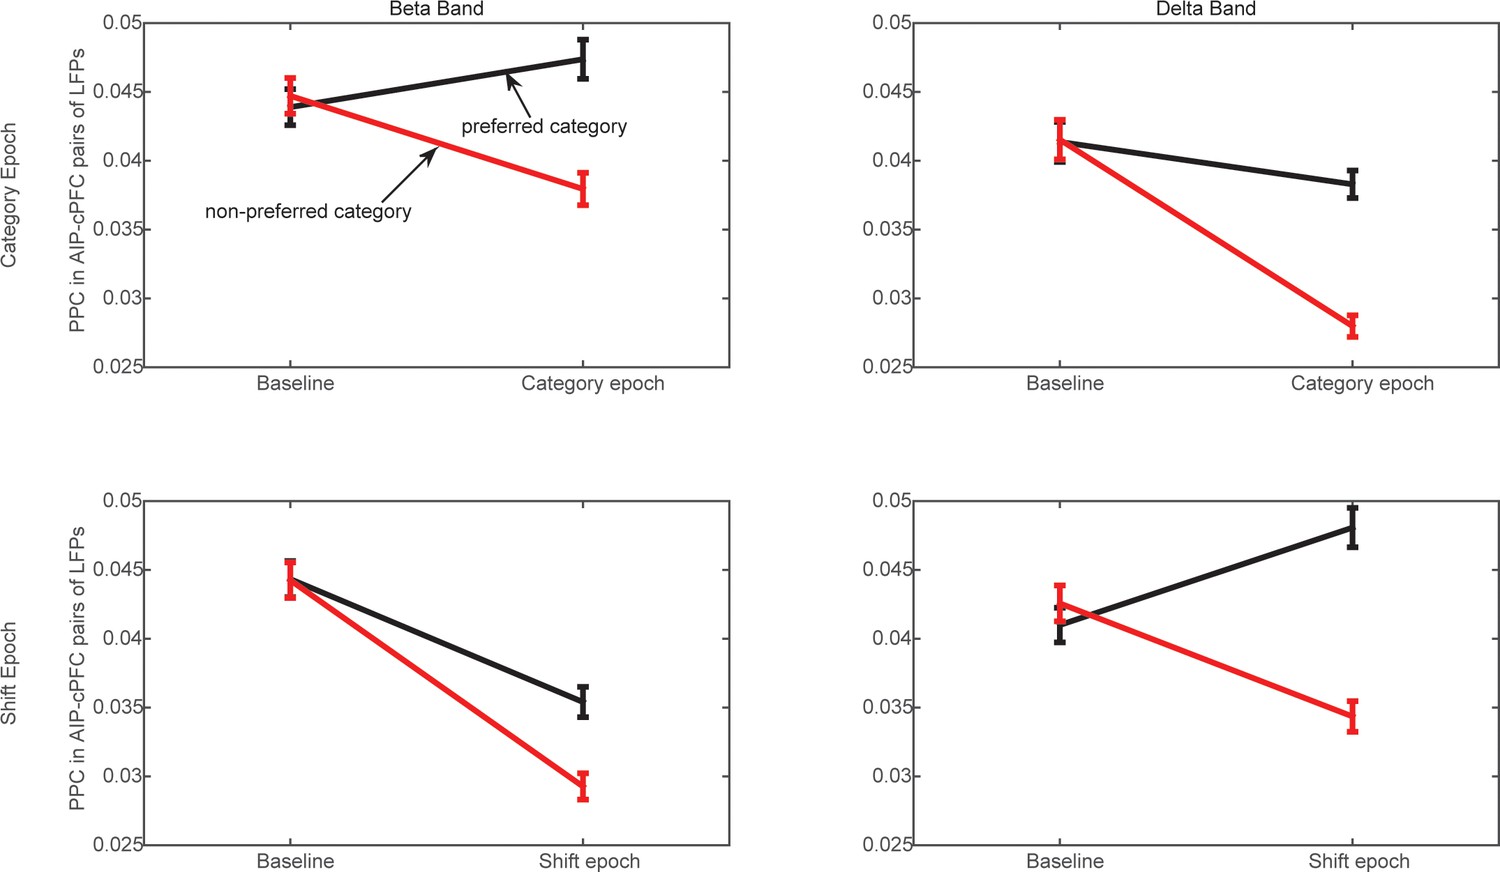
Frontoparietal synchrony for preferred/non-preferred categories vs. pre-trial baseline.
Average PPC between AIP and cPFC electrodes in the beta band (left) and the delta band (right) during the Category epoch (top) and the Shift epoch (bottom), during the pre-trial baseline and the corresponding trial epoch. Black lines correspond to trials of the preferred category (Above or Below), and red lines correspond to trials of the non-preferred category. Each comparison to baseline was statistically significant (p<0.001; 2-tailed t-test for paired samples).
Figure 5
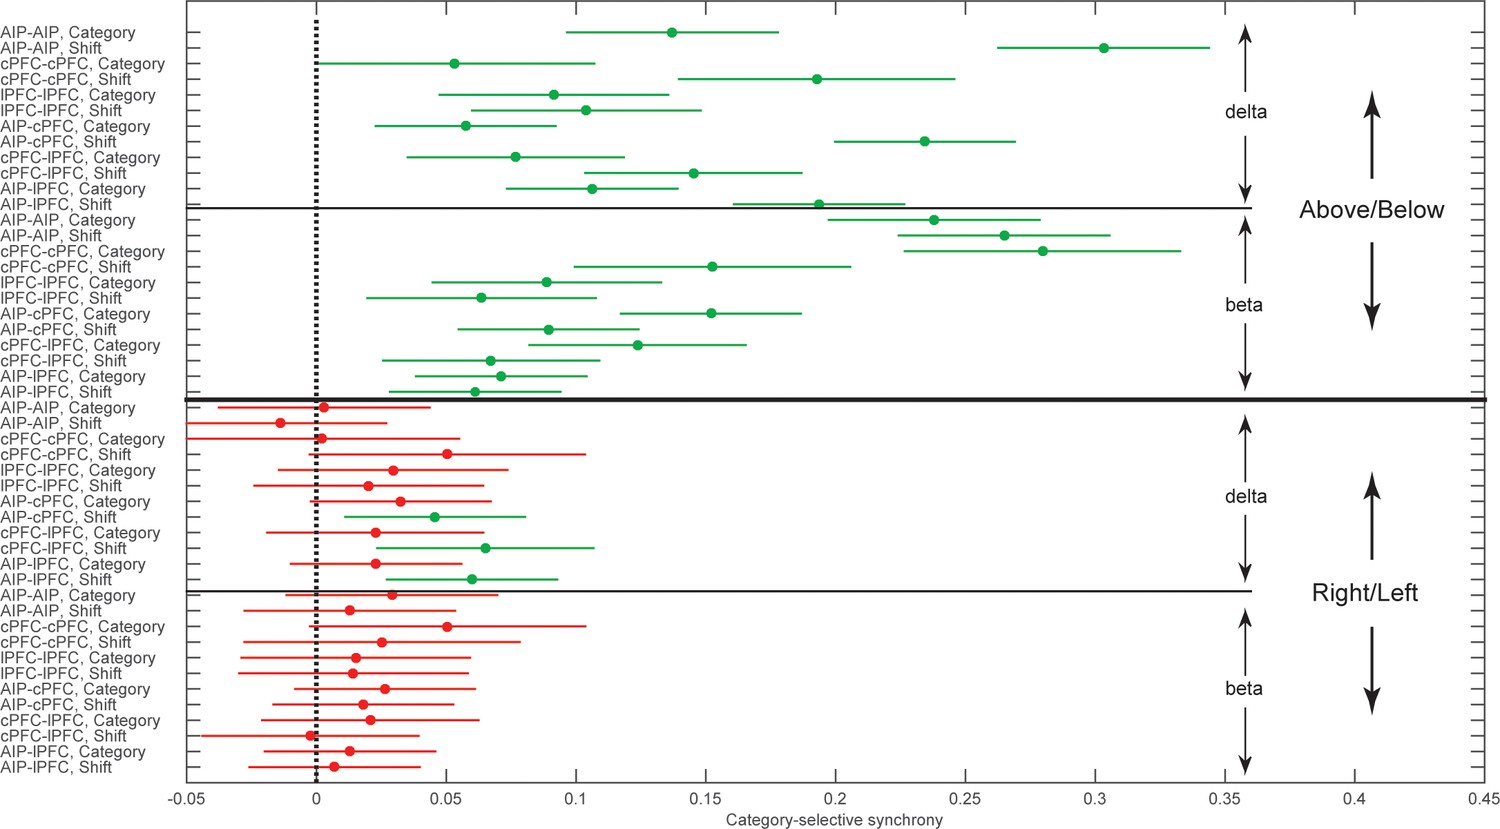
Group averages of category-selective synchrony of LFPs.
Filled dots represent group averages and horizontal lines the 95% confidence intervals (CI) after correction for multiple comparisons. The upper half of the graph illustrates selectivity for the task-relevant category boundary (Above/Below) and the lower half the selectivity for the task-irrelevant, Right/Left boundary. Within each boundary, the upper halves show the category-selective synchrony of delta rhythms and the lower halves the selective synchrony of beta rhythms. Within each quadrant of the graph, the rows correspond to the 2 trial epochs (Category and Shift) for each of the six combinations of the areas studied. Groups with no overlapping confidence intervals are significantly different (e.g., the Above/Below selectivity of AIP-AIP delta in the Shift epoch is significantly greater than the selectivity of most other groups). Category selectivity is significantly greater than zero (dashed vertical line) in all groups with green markers, and not significantly different from zero in groups with red markers (i.e., depending on whether a CI includes zero). Synchrony of beta rhythms displays significant selectivity for the Above/Below but not for the Right/Left boundary. In turn, synchrony of delta rhythms displays significant Above/Below selectivity, while Right/Left selectivity is area and epoch-dependent. The data of the figure can also be seen in Figure 5—source data 1 .
-
Figure 5—source data 1
Group averages (and SEM) for the post-hoc comparisons plotted in Figure 5.
- https://doi.org/10.7554/eLife.17822.015
Figure 6 with 2 supplements

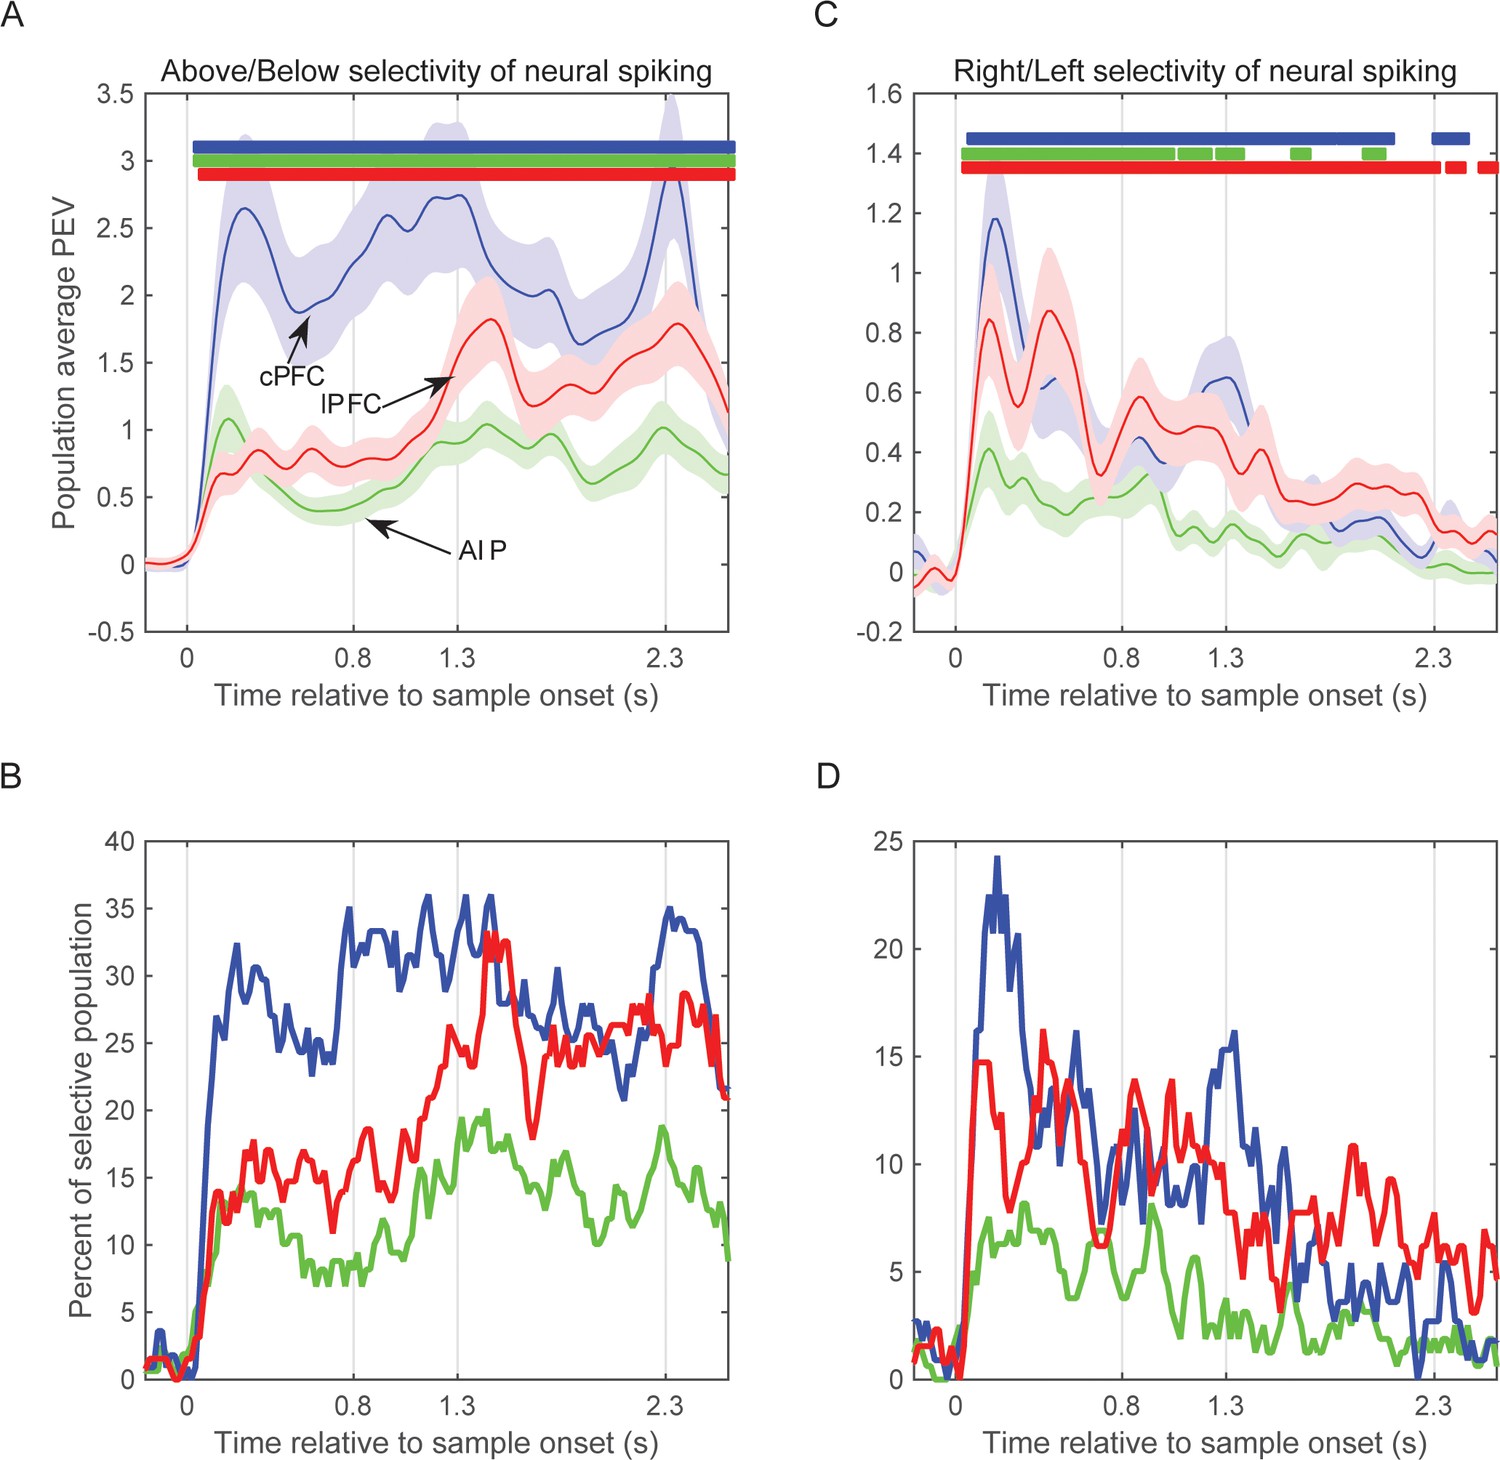
Selectivity of neural spiking activity.
(A) Average selectivity (±SEM) of neural spiking for the task-relevant category of sample location (Above/Below) in each of the three neural populations as a function of time from sample onset. Horizontal bars indicate time bins of significant selectivity (p<0.05 lasting for at least 100 ms) in the corresponding populations (blue: cPFC; green: AIP; red: lPFC). (B) Percent of each population with significant selectivity (p<0.01) for the Above/Below categorization. (C) Same as A for the task-irrelevant dimension of sample location (Right/Left). (D) Same as B for the Right/Left dimension. Overall, all three populations showed stronger selectivity for Above/Below than for Right/Left (note difference in y scales between left and right panels), and different time courses between Right/Left selectivity (which gradually decayed after sample display) and Above/Below selectivity (which tended to grow stronger after the end of sample display). The results are similar if selectivity is analyzed on the pooled spikes from all neurons isolated from each electrode (see Figure 6—figure supplement 1). Synchrony of LFP oscillations between two electrodes showed similar selectivity whether the corresponding spiking had the same or different category preferences (see Figure 6—figure supplement 2).
Figure 6—figure supplement 1
Selectivity of pooled multi-unit activity.
(A) Average selectivity (±SEM) of pooled neural spiking for the task-relevant category of sample location (Above/Below) in each of the three neural populations as a function of time from sample onset. Horizontal bars indicate time bins of significant selectivity (p<0.05 lasting at least 100 ms) in the corresponding populations (blue: cPFC; green: AIP; red: lPFC). (B) Percent of each population with significant selectivity (p<0.01) for the Above/Below categorization. (C) Same as A for the task-irrelevant dimension of sample location (Right/Left). (D) Same as B for the Right/Left dimension. Analyses of spiking selectivity result to similar patterns whether they are performed on a pooled spiking activity per electrode or on the spikes of individual neurons (Figure 6).
Figure 6—figure supplement 2
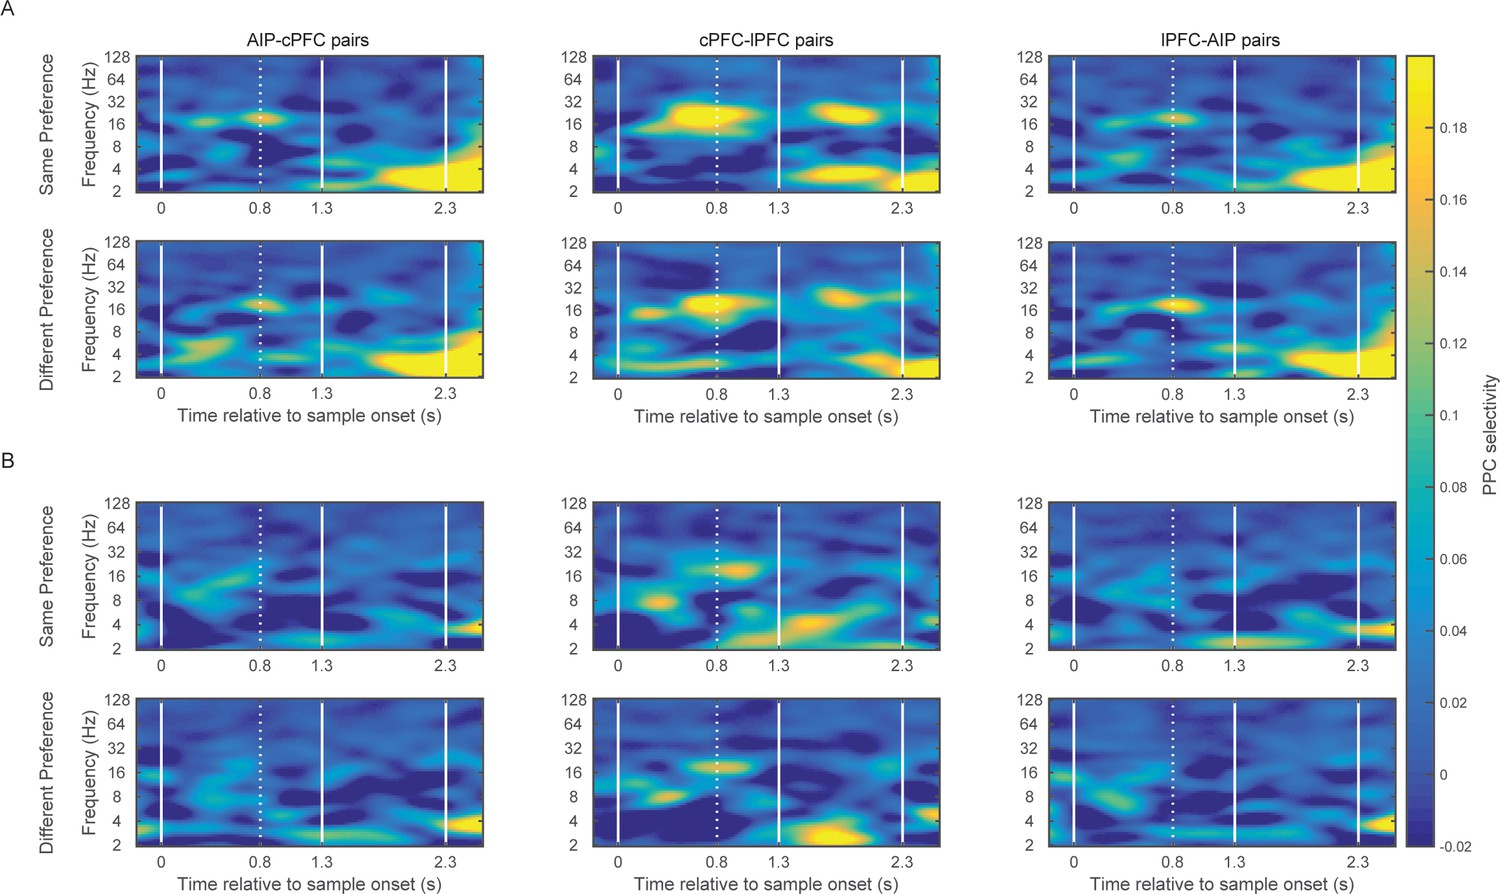
LFP synchrony in relation to individual site preference.
(A) Average PPC selectivity between pairs of electrodes in AIP, cPFC and lPFC that showed the same (top) or different (bottom) category preference in spiking activity along the Above/Below dimension. (B) The same for category preferences along the Right/Left dimension.
Figure 7 with 3 supplements
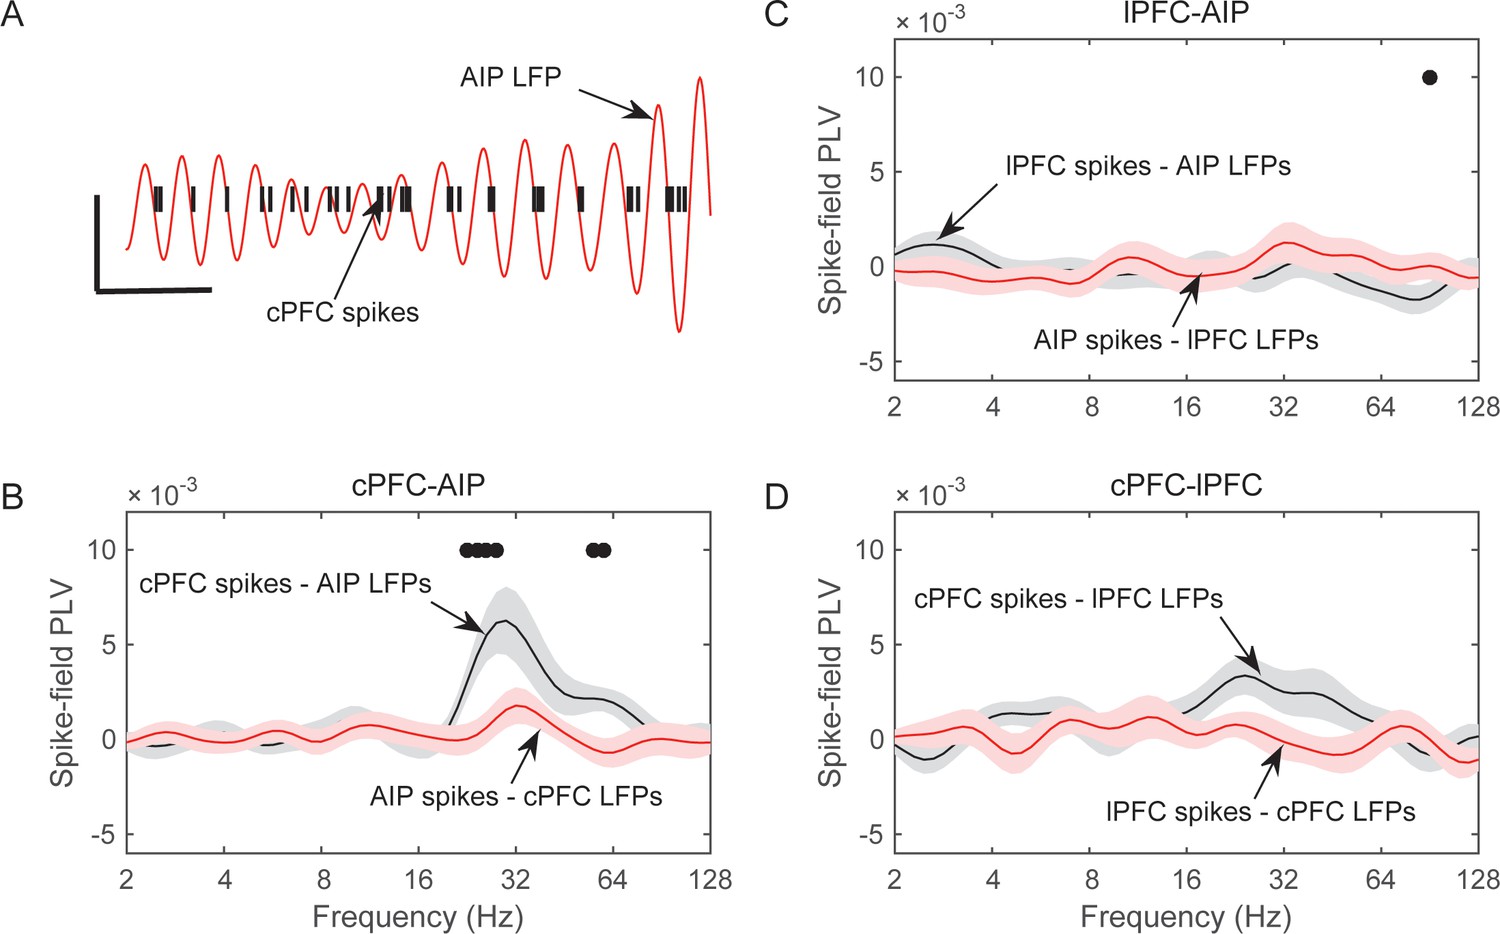
Frequency-dependent synchrony of spiking activity to LFPs during the Category epoch.
(A) Example LFP (red trace; passband filtered at 25–35 Hz) from an AIP electrode, simultaneously recorded with spiking activity from a cPFC electrode (black bars). Prefrontal spikes are phase-locked to the downstroke of the parietal LFP. Scale bars: 100 ms and 0.2 mV. (B) Average (±SEM) synchrony (PLV) between spikes in cPFC and LFPs in AIP (black trace), or the reverse (red trace) as a function of frequency, for pairs of electrodes with category-selective synchrony of beta oscillations (Figure 4). Dots indicate significantly different spike-field synchrony (p<0.05) between the two directions. (C) Same as in B, for pairs of electrodes between lPFC and AIP. (D) Same as in B and C, for pairs of electrodes between cPFC and lPFC. See also Figure 7—figure supplement 2 for spike-field synchrony during the Shift epoch, as well as spike-field synchrony between pairs of electrodes with category-selective delta synchrony. The asymmetry in cPFC-AIP vs. AIP-cPFC spike-LFP synchrony is stronger in the category Below than Above (see Figure 7—figure supplement 1).
Figure 7—figure supplement 1
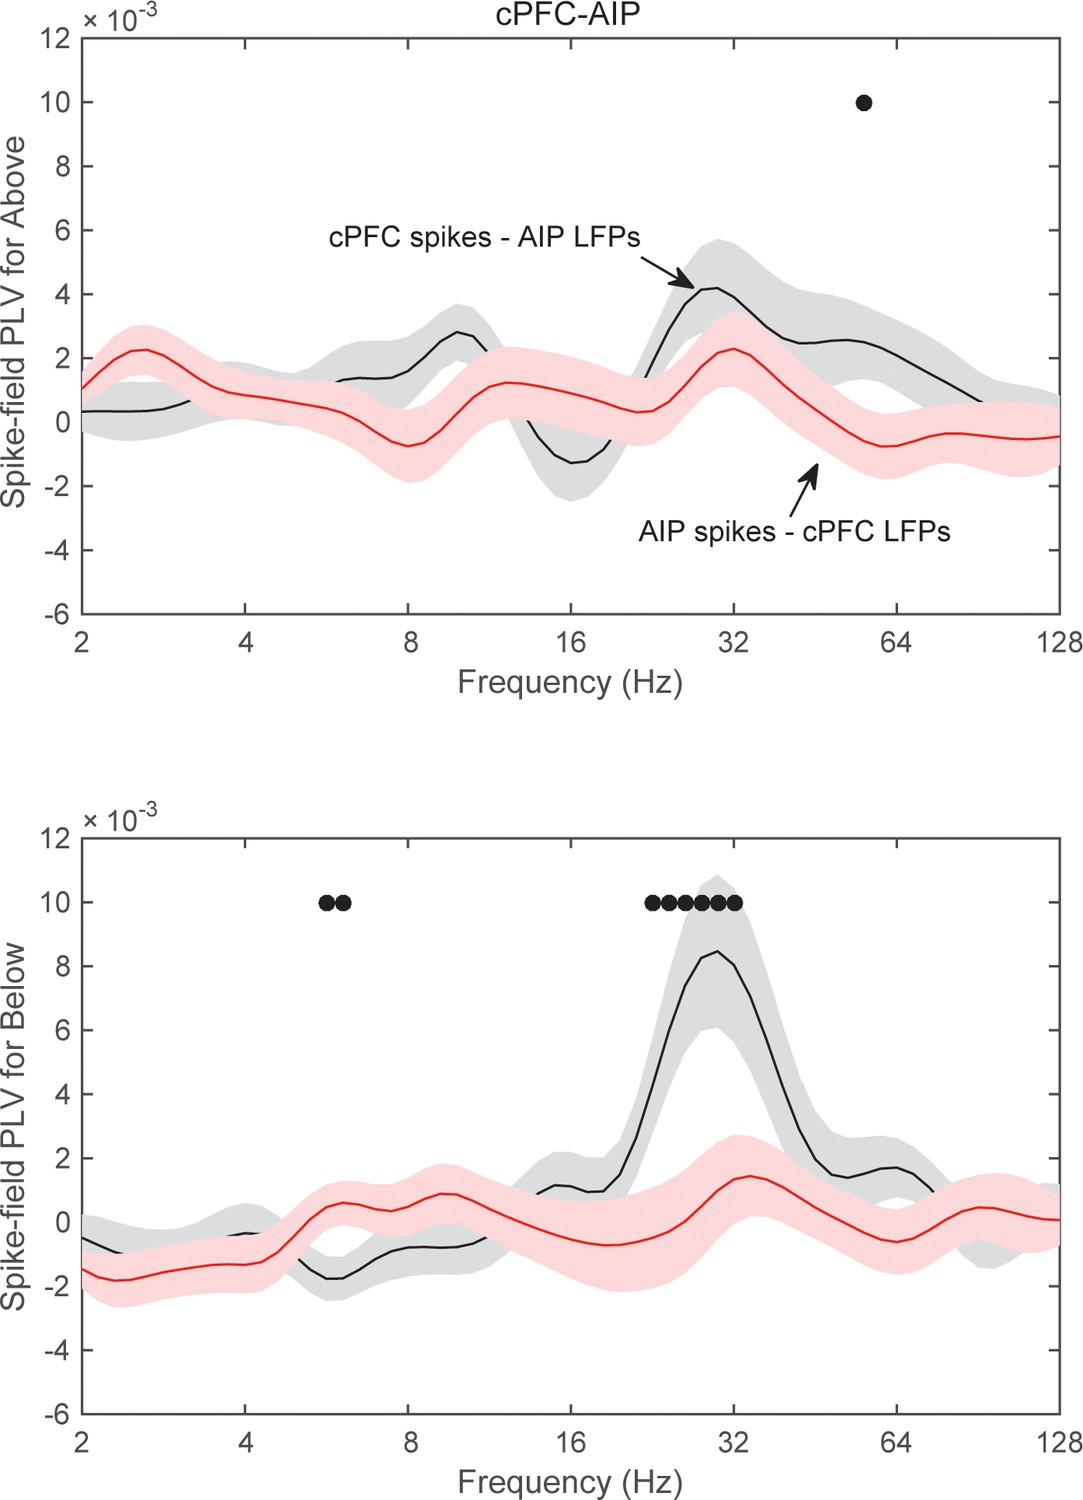
Category-specific spike-field synchrony between cPFC spikes and AIP LFPs.
Synchrony between cPFC spikes and AIP LFPs (black lines) or the reverse (red lines), separately for category Above (top) and Below (bottom panel).
Figure 7—figure supplement 2
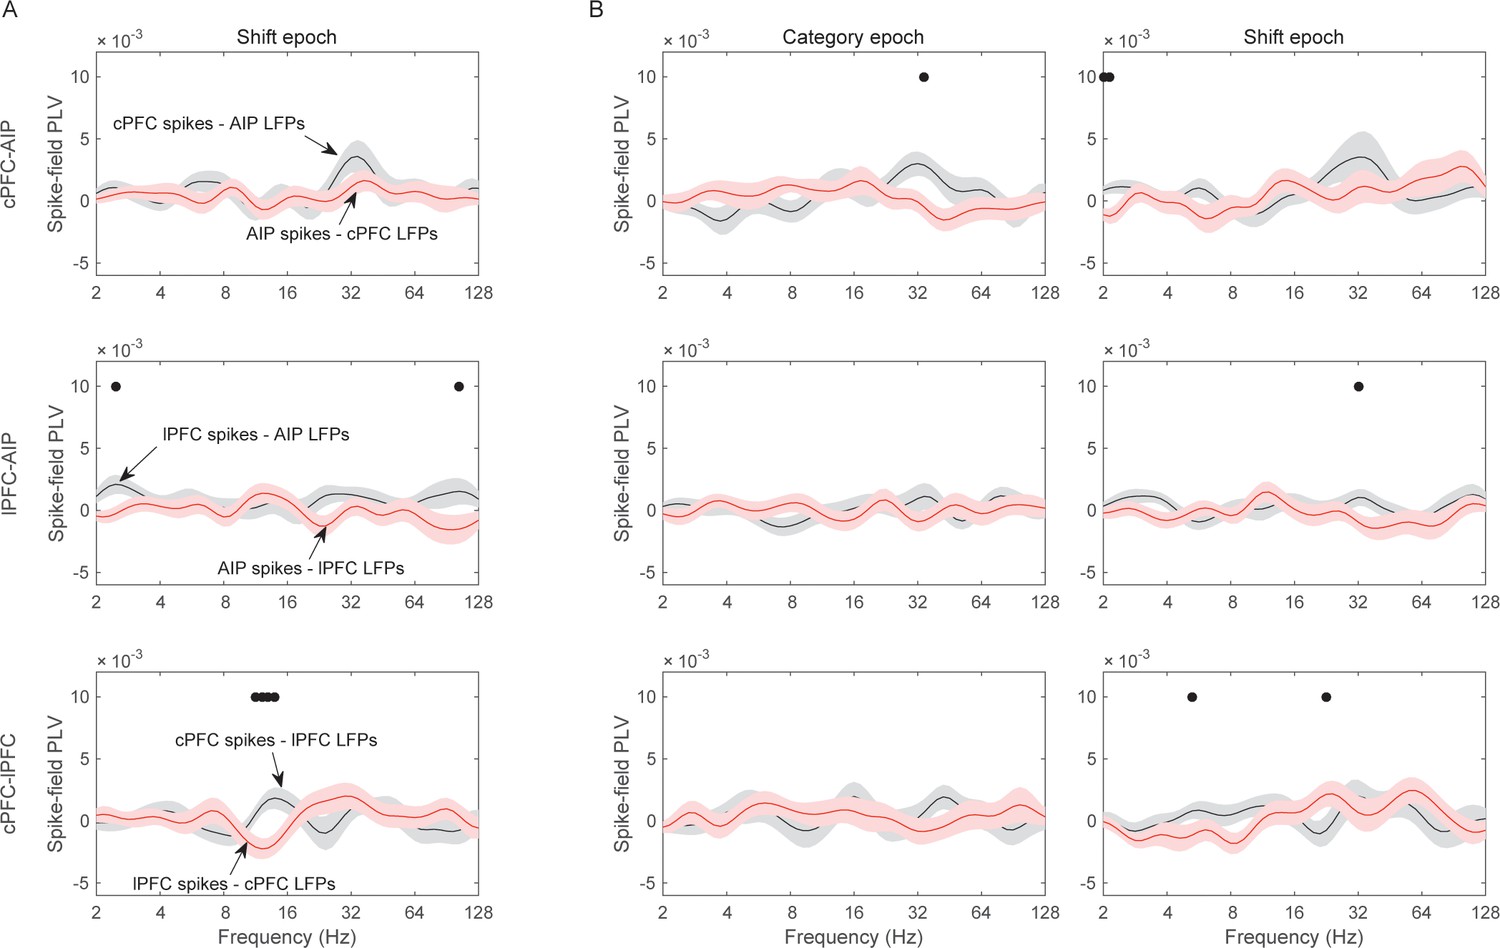
Spike-LFP synchrony.
Frequency-dependent average (±SEM) spike-field synchrony (PLV) between cPFC and AIP (top row of panels), between lPFC and AIP (middle row), and between cPFC and lPFC (bottom row). (A) Same as panels B–D of Figure 7, but for the Shift epoch. (B) Same analyses as (A) and Figure 7, but the pairs of electrodes were selected on the basis of their category-selective synchrony of delta, rather than beta, oscillations.
Figure 7—figure supplement 3
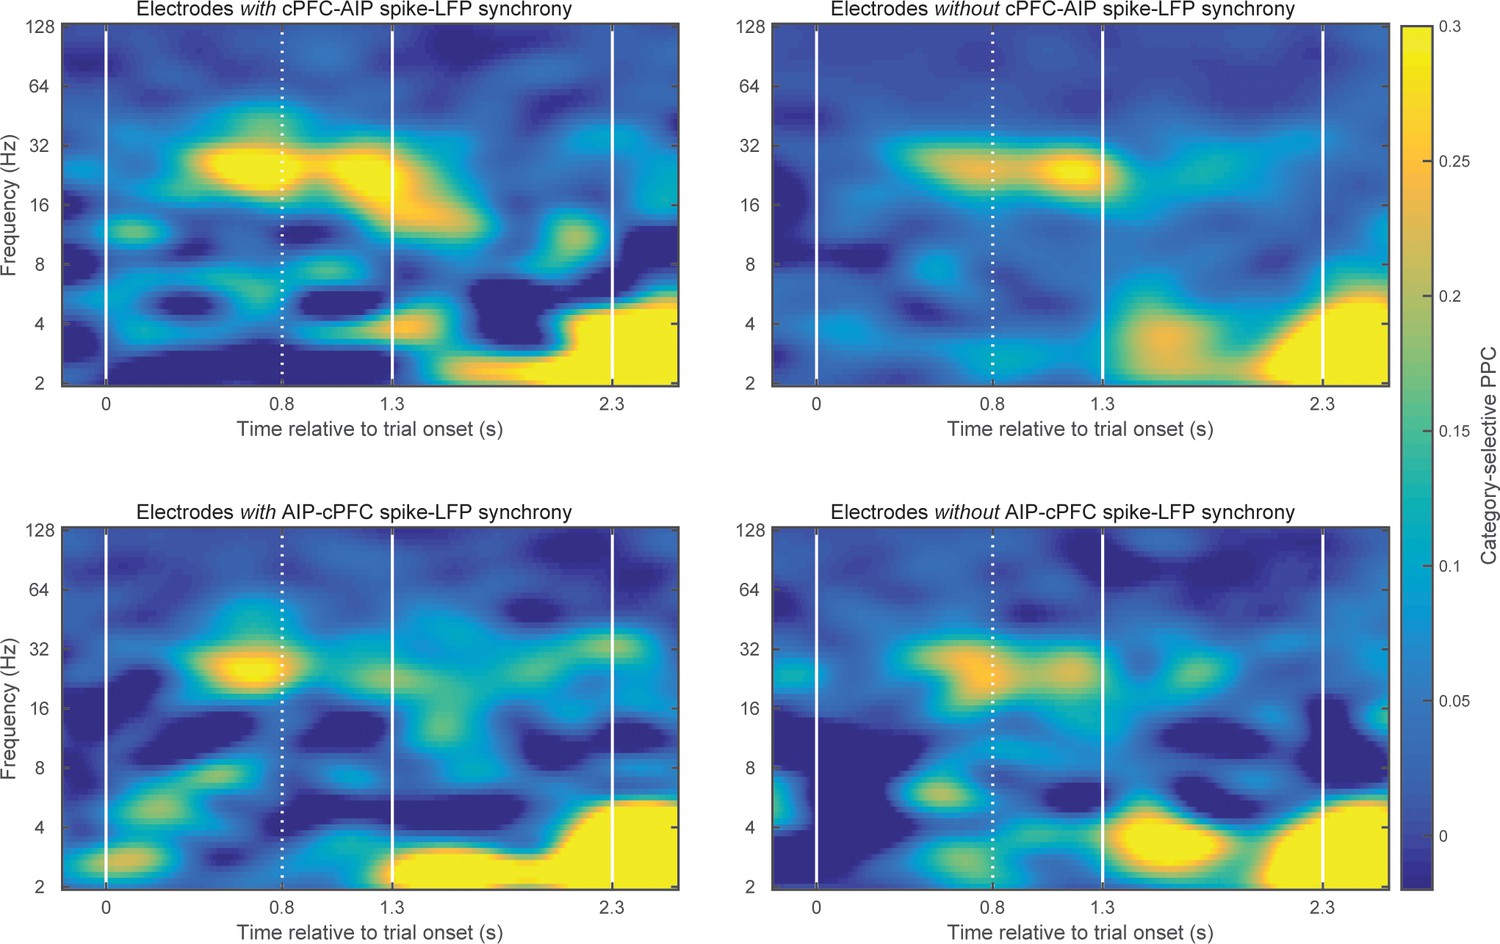
Category-selective synchrony between cPFC-AIP LFPs.
Only pairs of electrodes with strong (top 10%) spike-LFP synchrony (left panels) or without (bottom 10%) spike-LFP synchrony (right panels) were used in this analysis of Above/Below category selectivity between cPFC and AIP LFPs. Top panels show pairs of electrodes with spikes in cPFC and LFPs in AIP and bottom panels show the reverse. cPFC-AIP category selectivity of beta synchrony is more pronounced for electrodes that also have strong spike-LFP coupling than pairs of electrodes without spike-LFP coupling.
Figure 8 with 3 supplements
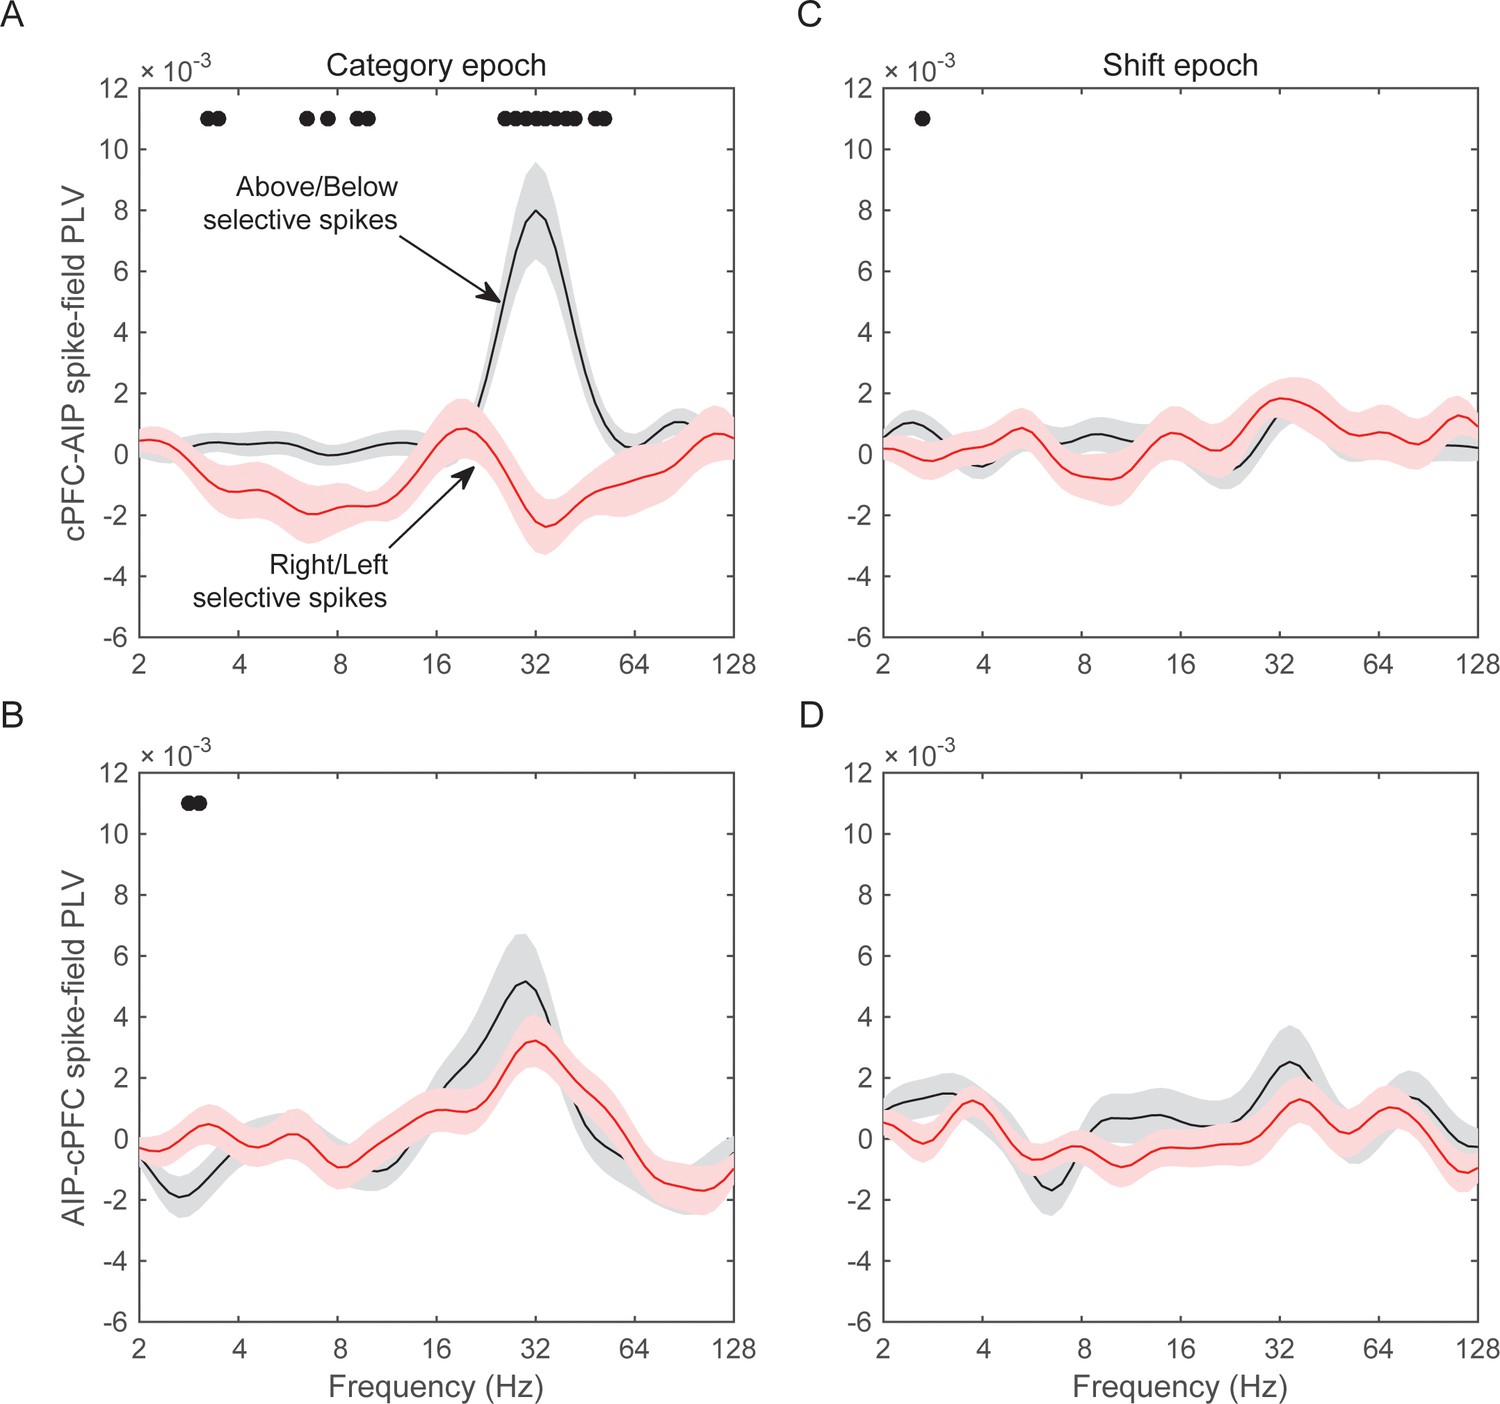
Spike-LFP synchrony for selective spiking.
(A) Average (± SEM) PLV between cPFC spikes and AIP LFPs as a function of frequency, separately for electrodes with strong Above/Below selectivity in their spiking (black trace) and electrodes with strong Right/Left selectivity in their spiking (red trace) during the Category epoch of the categorization trials. Dots mark frequencies of significant difference between the red and black traces (2-tailed t-test; p<0.05). (B) Same as (A), but in reverse direction: synchrony between AIP spikes and cPFC LFPs. (C) and (D) Same as (A) and (B) respectively, but for the Shift epoch of the categorization trials. The group statistics of the electrodes used in these analyses (electrodes at the top 10% of spiking selectivity) appear in Table 1. See also Figure 8—figure supplement 3 for the corresponding analyses on the other combinations of spike-LFPs. See Figure 8—figure supplement 2 for a comparison of spikes with vs. without Above/Below selectivity. Figure 8—figure supplement 1 illustrates cPFC-AIP spike-LFP synchrony separately for each category.
Figure 8—figure supplement 1
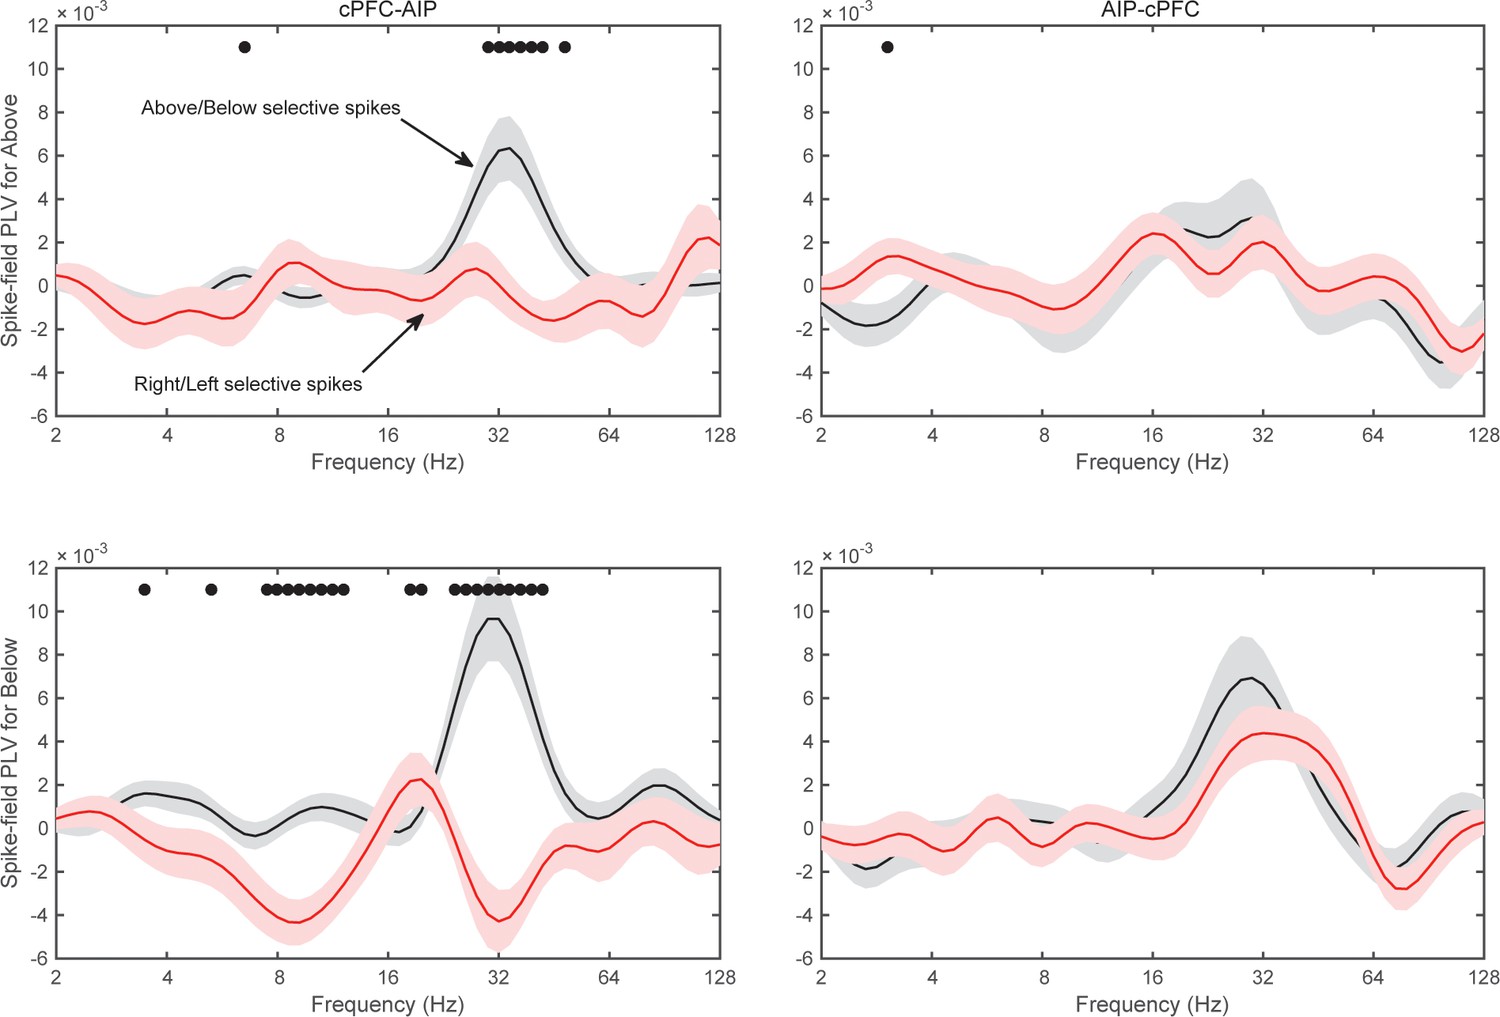
Spike-field synchrony of cPFC-AIP pairs separated by category.
Top panels for PLV evaluated from trials of category Above and bottom panels for trials of category Below. Left for spikes from cPFC and LFPs from AIP, and right panels for the reverse. For each of the categories, the dynamics of spike-LFP synchrony are similar to those in Figure 8.
Figure 8—figure supplement 2
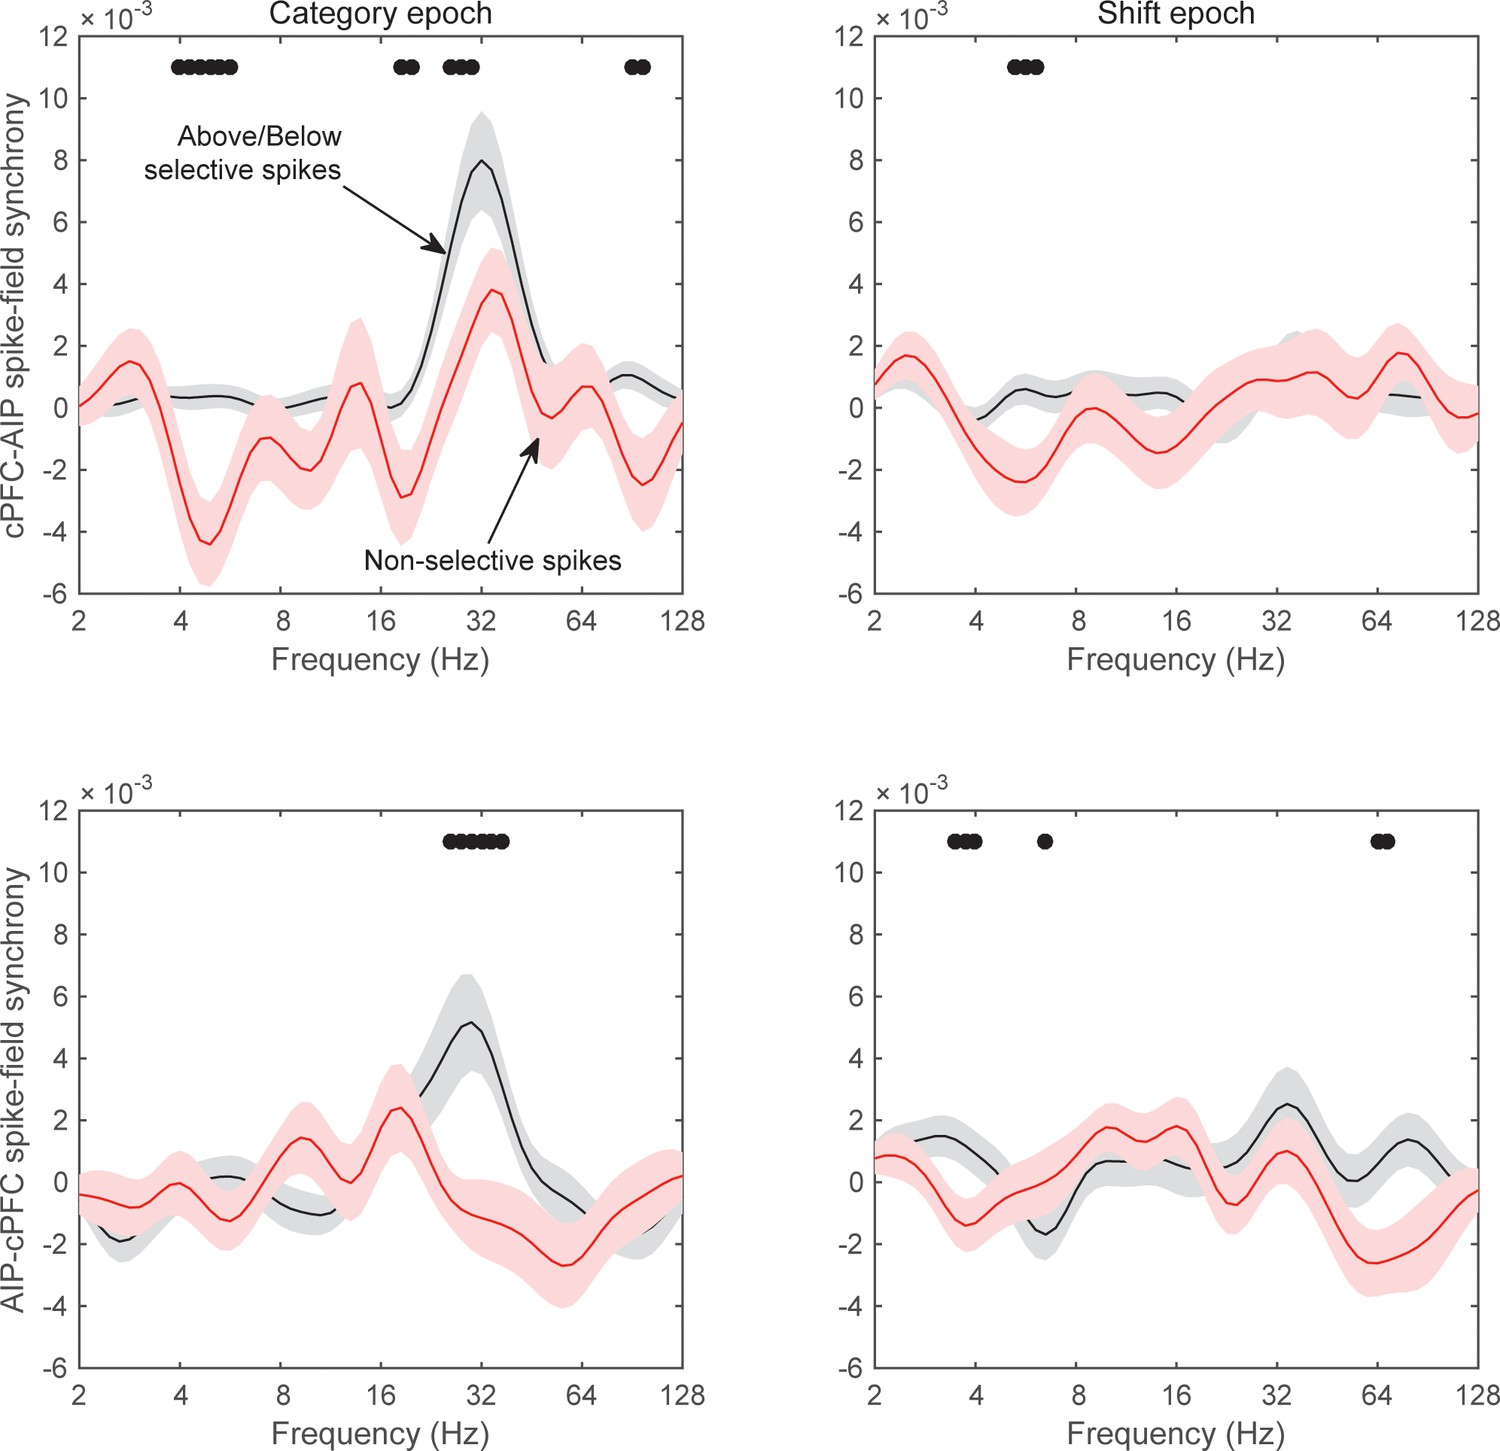
Spike-field synchrony for category-selective vs.non-selective spiking.
As in Figure 8, ‘Above/Below selective spikes’ (black line) refers to electrodes with the top 10% of spiking selectivity for Above/Below categories. ‘Non-selective spikes’ (red line) refers to electrodes with the bottom 10% of spiking selectivity for Above/Below categories.
Figure 8—figure supplement 3
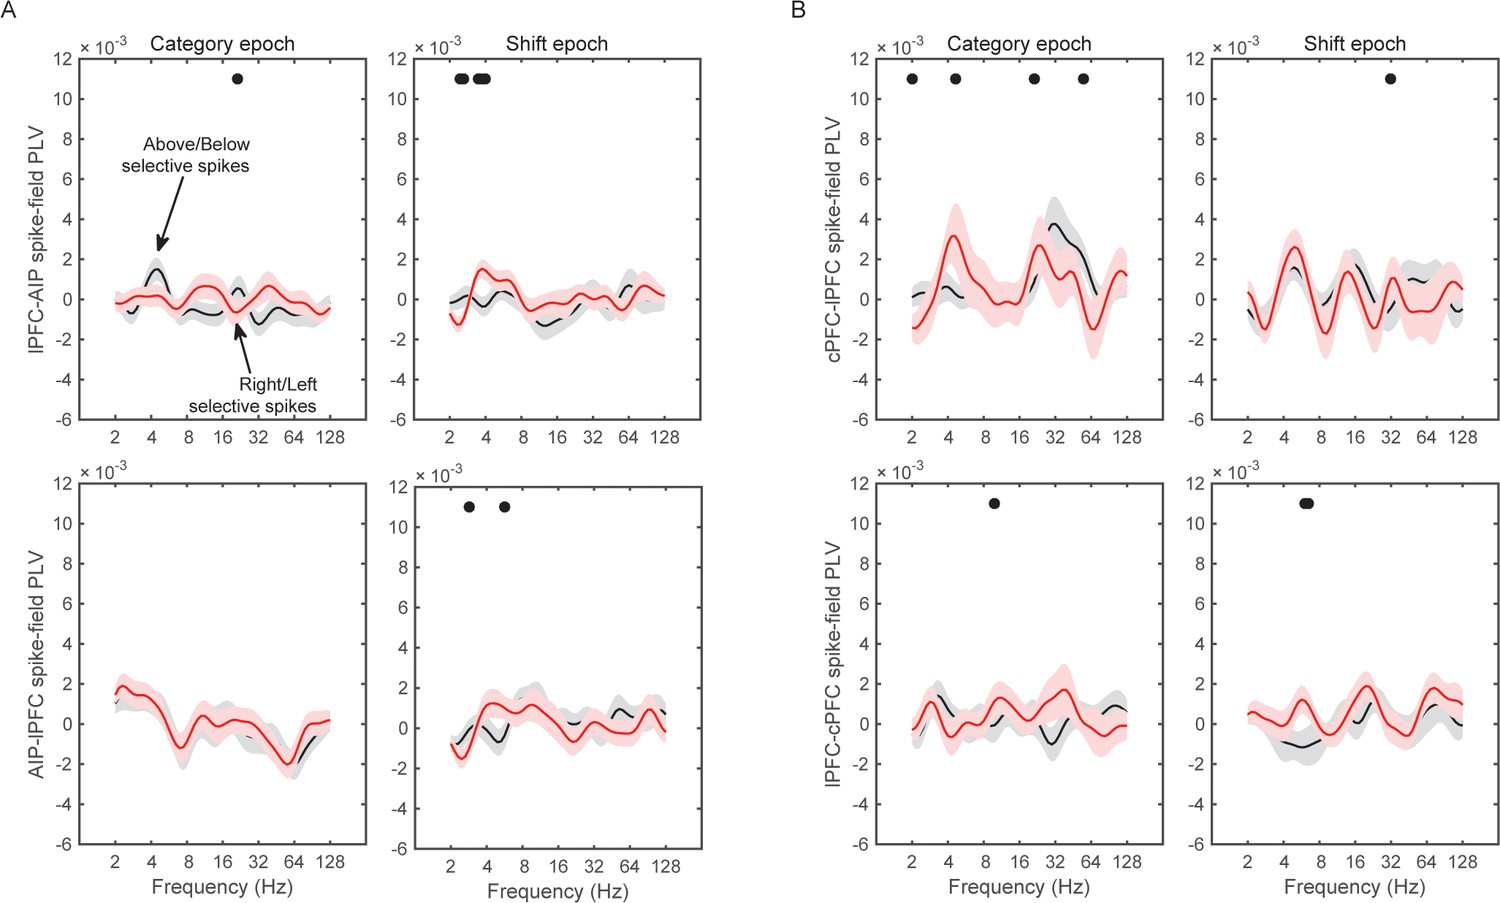
Spike-field synchrony for selective spikes.
Same analyses as in Figure 8, but for spikes in lPFC and LFPs in AIP (top panels in A), spikes in cPFC and LFPs in lPFC (top panels in B), and the respective reverse directions (bottom panels in A and B).
Figure 9
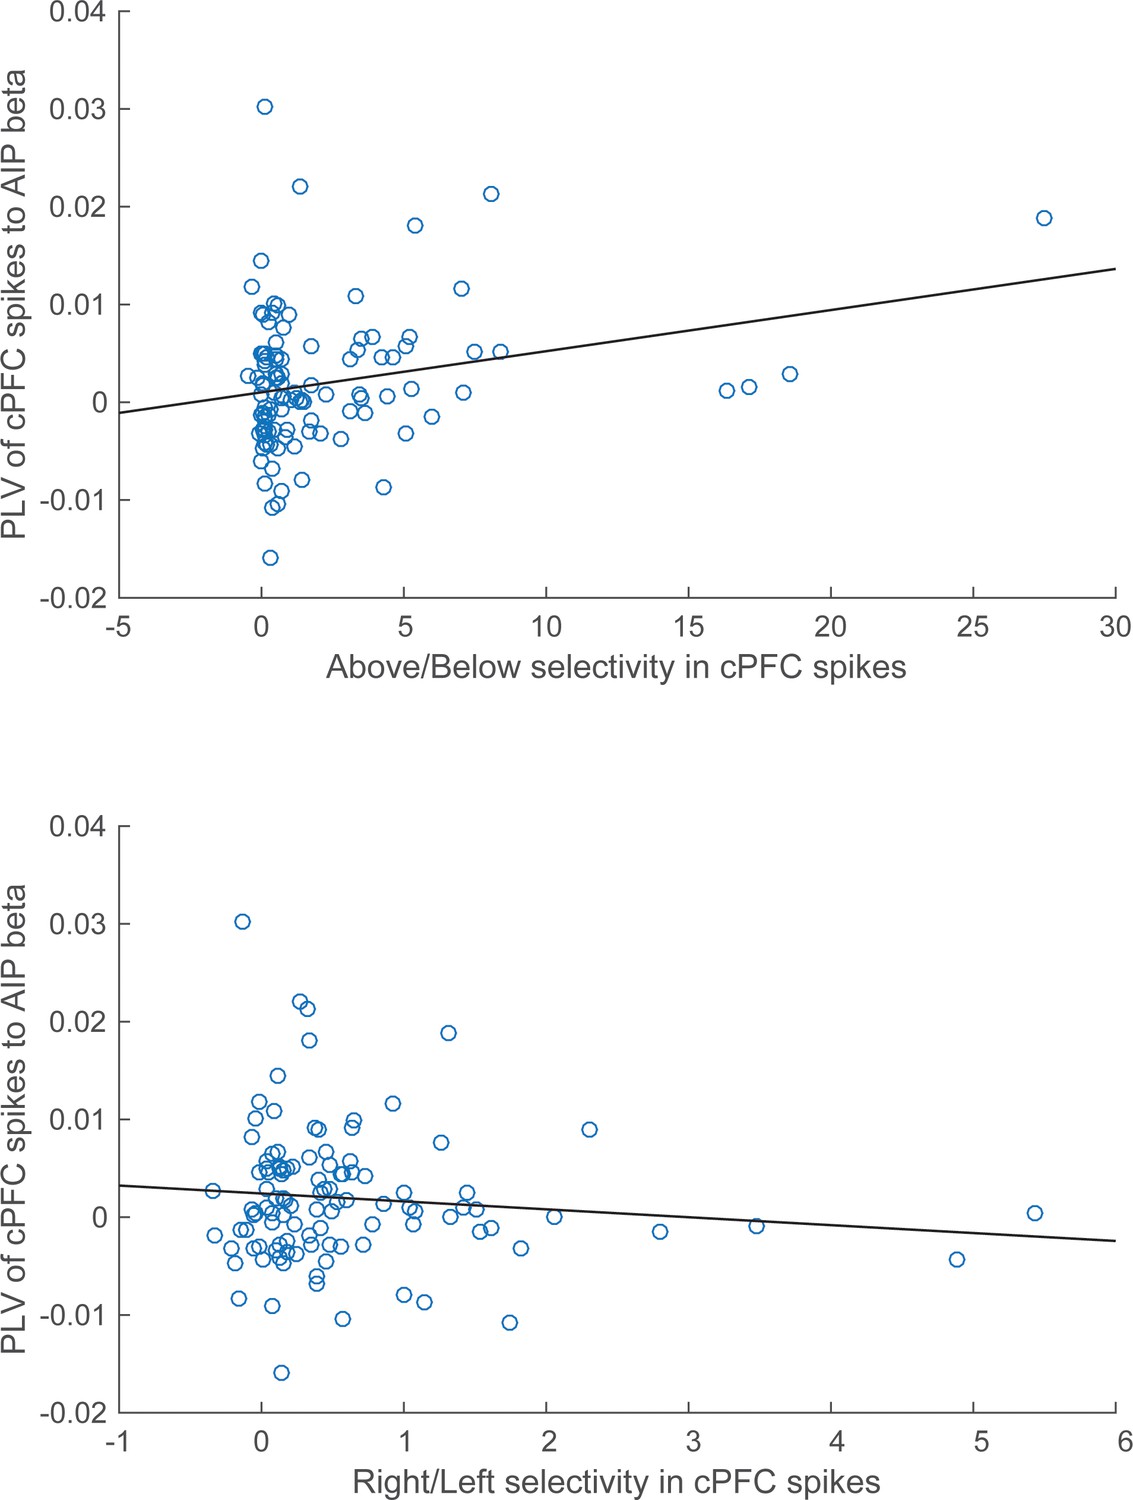
Correlation of spike-LFP synchrony with spiking selectivity.
Synchrony of cPFC spikes to AIP LFP beta-band oscillations, during the Category epoch. Above/Below selectivity in spiking (top) is positively correlated with the spike synchrony (averaged across all their electrode pairings) to parietal beta rhythms (r=0.25, p=0.009), whereas Right/Left selectivity (bottom) is not (r=−0.11, p=0.28).
Tables
Table 1
Electrodes with spiking at the top 10% of selectivity.
Neural population | cPFC | lPFC | AIP | ||
|---|---|---|---|---|---|
Above/Below selectivity | Category epoch | Mean | 11.74 | 3.57 | 3.96 |
SEM | 2.14 | 0.49 | 0.30 | ||
Shift epoch | Mean | 9.12 | 6.54 | 4.53 | |
SEM | 1.31 | 0.75 | 0.43 | ||
Right/Left selectivity | Category epoch | Mean | 2.69 | 3.26 | 1.64 |
SEM | 0.41 | 0.42 | 0.21 | ||
Shift epoch | Mean | 1.30 | 1.93 | 0.88 | |
SEM | 0.26 | 0.31 | 0.11 | ||
-
Average (±SEM) selectivity during the Category and Shift epochs for the Above/Below and Right/Left dimensions of sample location is provided for each neural population of the analyses in Figure 8.
Download links
A two-part list of links to download the article, or parts of the article, in various formats.
Downloads (link to download the article as PDF)
Open citations (links to open the citations from this article in various online reference manager services)
Cite this article (links to download the citations from this article in formats compatible with various reference manager tools)
Synchronous beta rhythms of frontoparietal networks support only behaviorally relevant representations
eLife 5:e17822.
https://doi.org/10.7554/eLife.17822


