Upregulation of neurovascular communication through filamin abrogation promotes ectopic periventricular neurogenesis
- Northwestern University Feinberg School of Medicine, United States
Figures
Figure 1 with 1 supplement
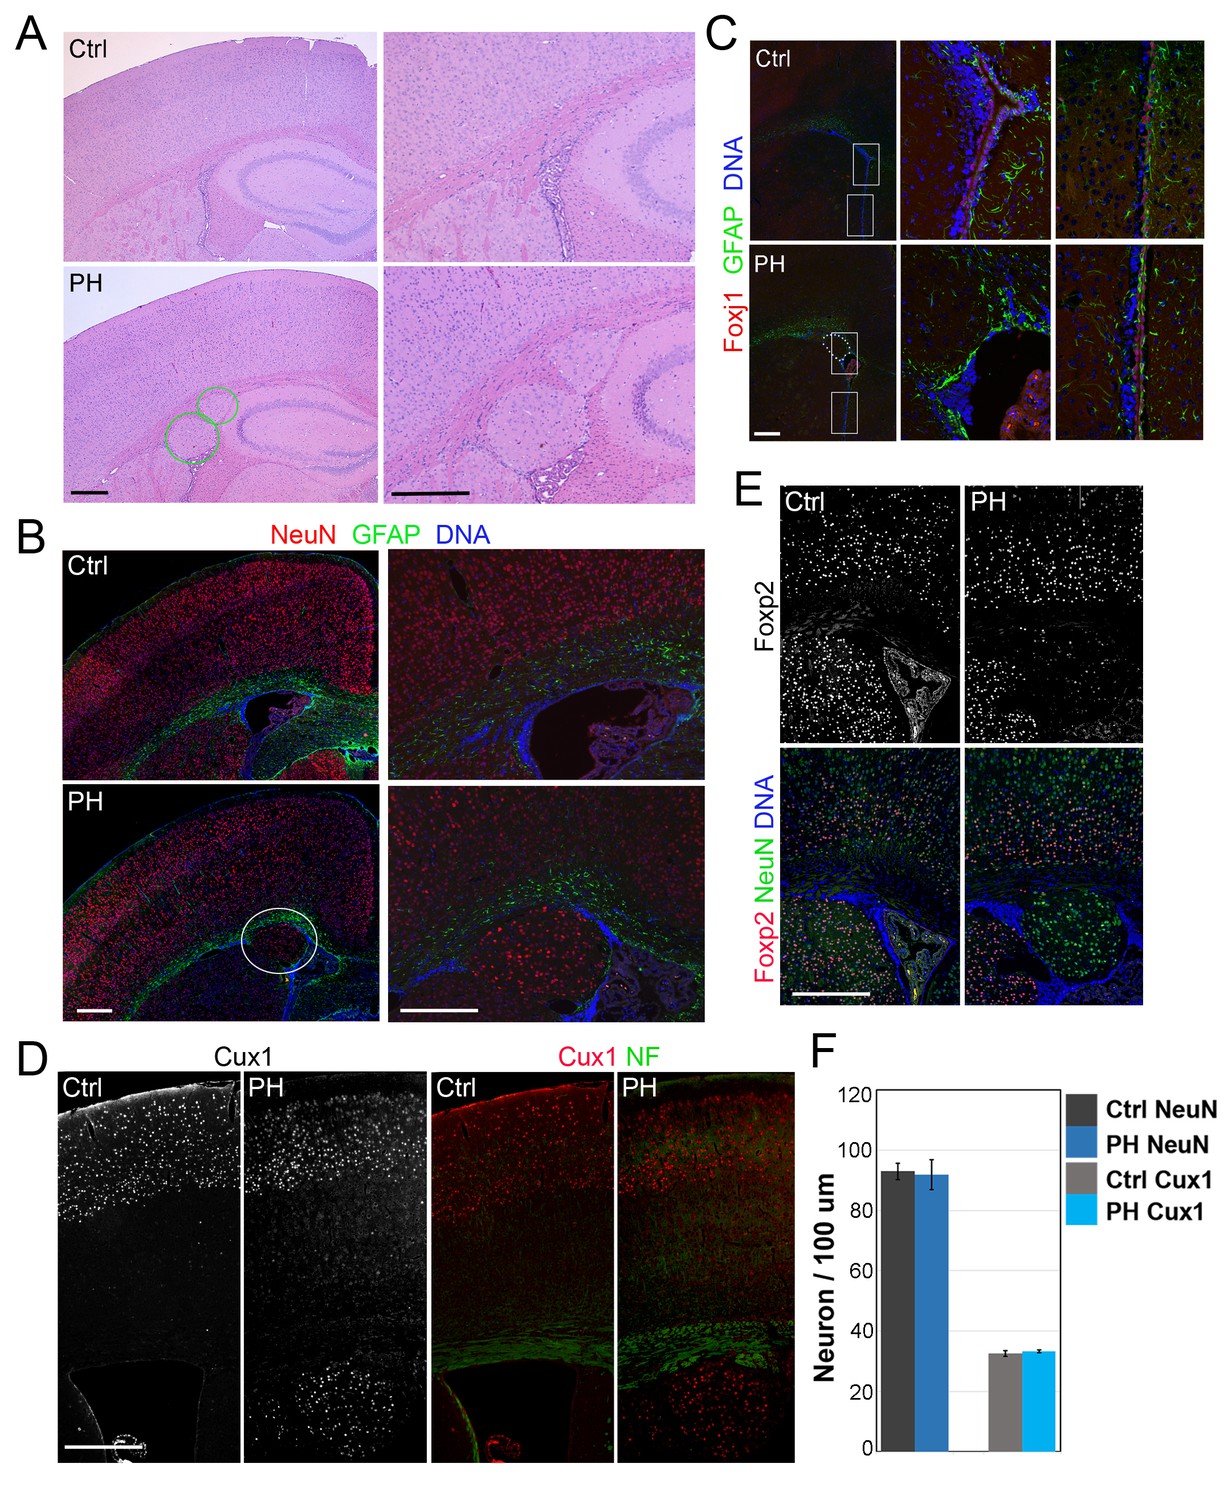
Loss of filamin resulted in Periventricular heterotopia without affecting neocortical neurons.
(A) H&E stained coronal brain sections from a control (Flnaflox/y Emx1Cre-;Flnb+/-,Ctrl) and a Flnaflox/y Emx1Cre+ ;Flnb-/- (PH) mouse at 2 month (P60). Periventricular heterotopia are indicated by circles; and shown by higher magnification views. (B) NeuN (red) and GFAP (green) double immunostained brain sections from a control and a Flnaflox/y Emx1Cre+ ; Flnb-/- (PH) mouse at weaning age (P23). Periventricular heterotopia are indicated by circles and are shown in higher magnification images. (C) FoxJ1 and GFAP double immunostained brain sections from a control and a Flnaflox/y Emx1Cre+ ;Flnb+/-(PH) mouse at weaning age. Higher magnifications of boxed areas shown on the right indicate that the loss of ependymal cells was specifically associated with the presence of periventricular heterotopia. (D) Cux1 and Neurofilament (NF) double immunostained cortical sections from a control and a Flnaflox/y Emx1Cre+ ;Flnb+/- (PH) mouse at weaning age. (E) Foxp2 and NeuN double immunostained cortical sections from a control and a Flnaflox/y Emx1Cre+ ;Flnb+/-(PH) mouse at weaning age. (F) Quantitative analysis of neurons in the neocortex of post weaning age control and FlncKO-NPC brains. All NeuN+ or Cux1+ cells between pial surface and white matter tracts were scored and normalized to the length of ventricular surface in the counted area. Data were obtained from brain sections of four pairs of control and FlncKO-NPC littermates and presented as Mean ± SD. No significant difference was found by Student’s t-test. Note the normal neocortical thickness and lamina organization in all brains with periventricular heterotopia. Bars: 500 μm.
Figure 1—figure supplement 1
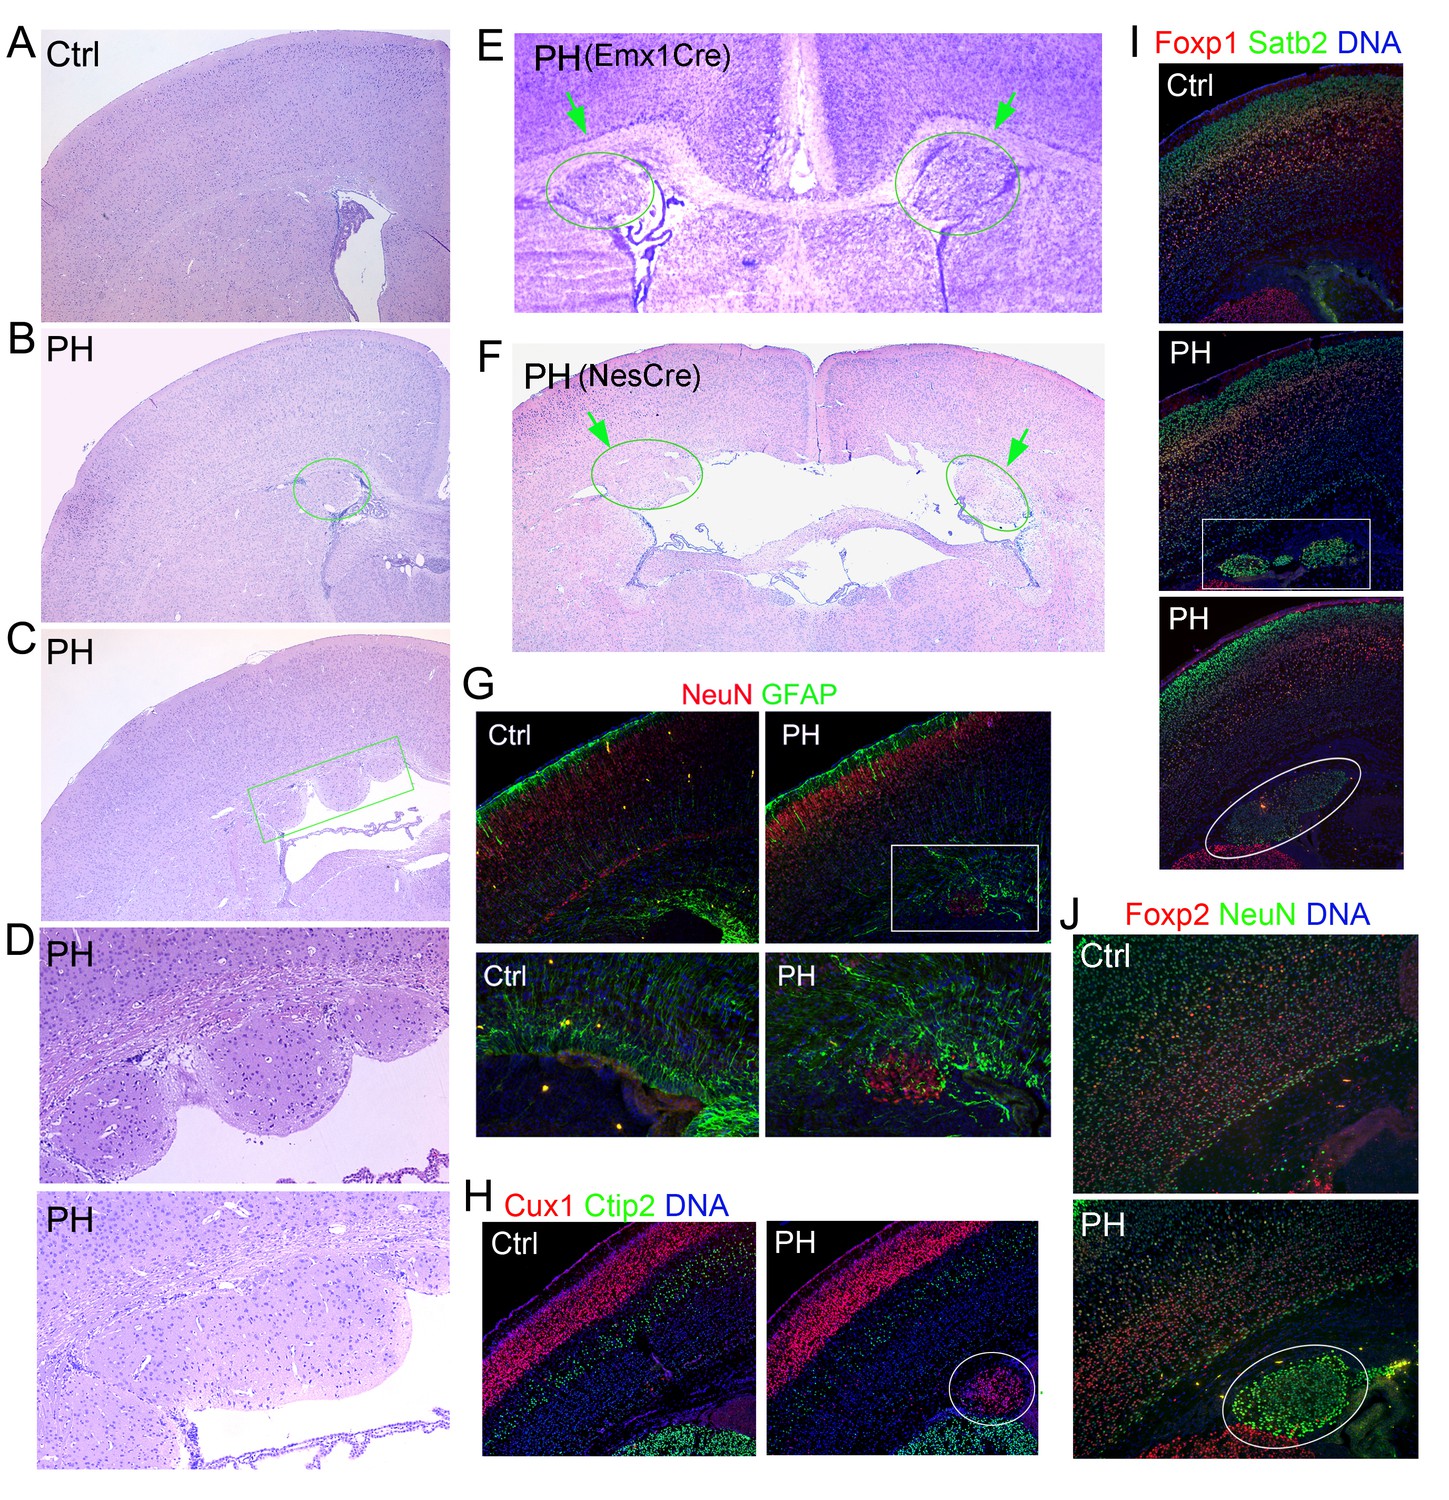
Undetectable neocortical aberration in PH-containing FlncKO-NPC brains.
(A–D) H&E stained coronal brain sections from control, Flnaflox/y Emx1Cre+ ;Flnb+/- (PH, B), and Flnaflox/y Emx1Cre+ ;Flnb-/- mice (PH, C) at weaning age. High magnification views of contiguous or isolated periventricular nodules in the mutant brains are included (PH, D). (E) Cresyl violet stained coronal brain section from Flnaflox/y Emx1Cre+ ;Flnb+/-(PH) mouse at P10, showing the presence of PH in both cerebral hemispheres. (F) H&E stained coronal brain section from a Flnaflox/y Nes8Cre+ ;Flnb-/- (PH) mouse at weaning age, showing the bilateral presence of PH, broken neural ependyma and hydrocephaly. (G) NeuN (red) and GFAP (green) double immunostained coronal brain sections from Flnaflox/y Emx1Cre+ ;Flnb+/- (PH) mice at P0, showing mixed neurons and glia in PH. (H, I) Cux1 (red) and Ctip2 (green), or Satb2 (green) and Foxp1 (red) double immunostained coronal brain sections from control and Flnaflox/y Emx1Cre+ ;Flnb+/- (PH) mouse at P4, showing the well laminated neocortex in PH-containing brains. (J) NeuN (green) and Foxp2 (red) double immunostained coronal brain sections from control and Flnaflox/y Emx1Cre ;Flnb /- (PH) mice at weaning, showing the rare presence of Foxp2+ neurons in PH. Nuclei DNA was stained with Hoechst 33,342 and shown in blue in all fluorescence images. Note that while hydrocephaly occurred in some PH brains and resulted in cortical thinning, we failed to detect significant aberration in neocortical structures of all PH brains analyzed.
Figure 2 with 1 supplement
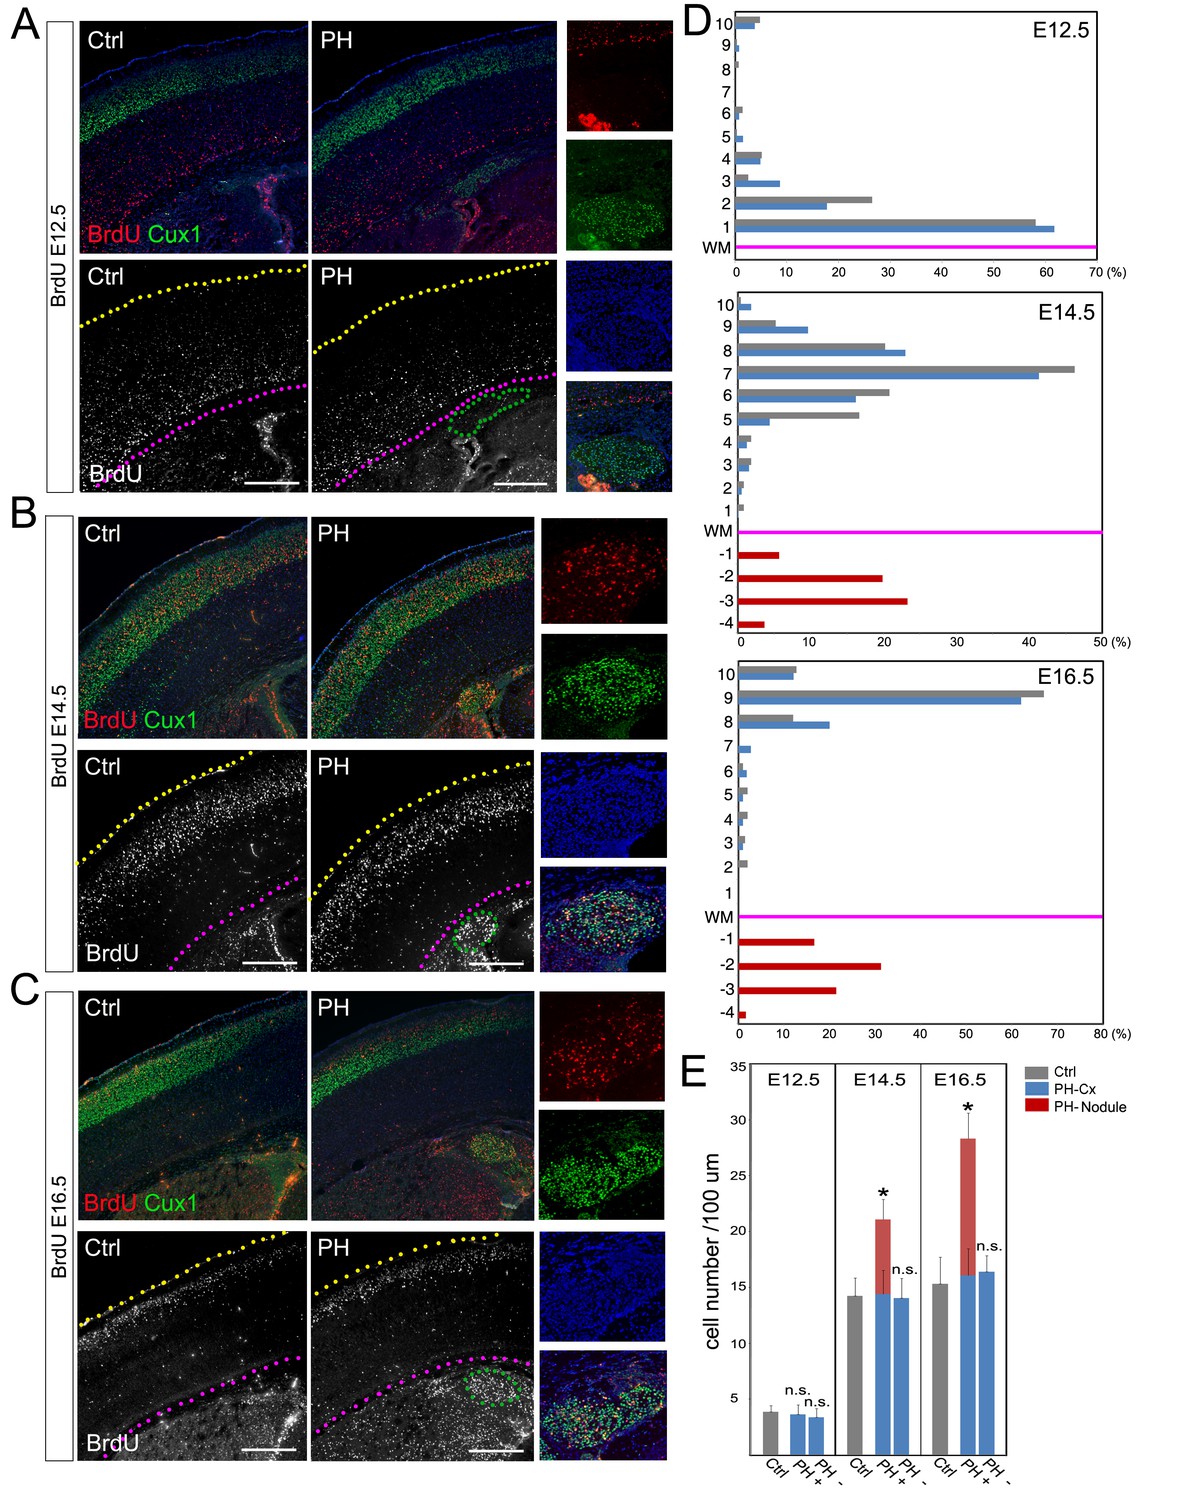
BrdU birth-dating study of cortical neuronal migration and neurogenesis.
(A–C) A single pulse of BrdU was given at E12.5, E14.5 or E16.5 to label cells undergoing terminal mitosis. Brain sections from at least three sets of BrdU labeled littermates were analyzed at P4 by double immunohistological staining using antibodies to BrdU (red) and Cux1 (green). PH nodules were identified by Cux1+ immunoreactivity beneath the white matter tract. The positions of pial surface and white matter tract are marked by yellow and pink dotted lines, respectively. High magnification views show the lack of BrdU+ neurons in PH born at E12.5 but abundant BrdU+ neurons in PH born at E14.5 and E16.5. (D) Quantitative analysis of the distribution of BrdU labeled neurons in the brain of FlncKO-NPC (PH) and their control (Ctrl) littermates. The neocortex of each brain section was divided into 10 equal layers from the pial surface to the white matter tract; the fraction of (%) of BrdU+ neurons in each layer was plotted to represent the relative distance of neuronal migration from the ventricular zone to the cortical plate. Each experiment was repeated with at least 3 litters; the result from a representative litter is presented. No significant difference in the distribution of cortical neurons was found between PH and Ctrl groups by Chi-square test. The number and distribution of BrdU+ neurons in PH (fractioned relatively to those in the neocortex) are also presented. (E) Quantitative analysis of neurons born at E12.5, E14.5 or E16.5 in filamin mutants (PH) and control brains. Cortical regions with and without the occurrence of PH in FlncKO-NPC brains were scored separately; the total number of BrdU+ neurons in the entire cortical wall along 100 micron of white matter tract was scored. Data were acquired from at least three independent litters and presented as Mean + SD; *p<0.001 by ANOVA. Nuclei DNA was stained with Hoechst 33,342 and shown in blue in all fluorescence images. Bars: 500 μm.
Figure 2—figure supplement 1
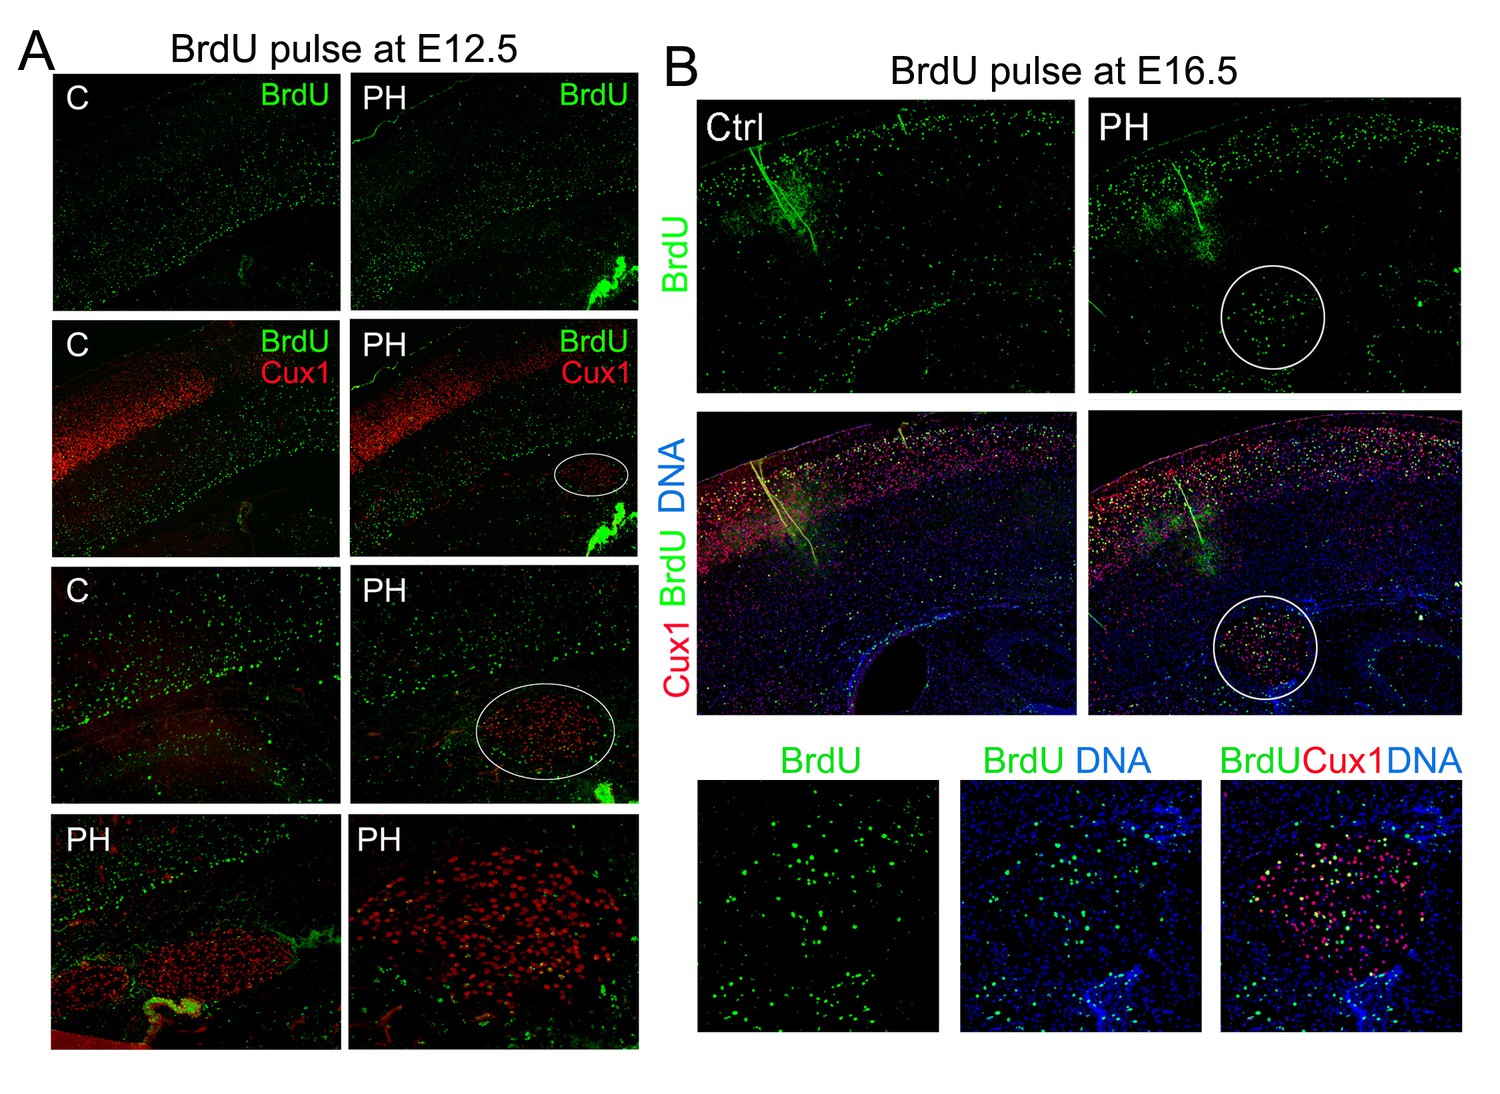
BrdU birth-dating studies of cortical neurogenesis and neuronal migration.
(A) Representative immunohisto-images from a BrdU birthdate study of neurons born at E12.5. A signal BrdU pulse was given at E12.5 and coronal brain sections from a Flnaflox Emx1Cre+ ;Flnb-/- (PH) and its Flnaflox Cre-;Flnb+/- littermate (Ctrl) were prepared at P10, and double immunostained by antibodies to BrdU (green) and Cux1 (red). Neurons born at E12.5 were identified by intense pan-nuclei BrdU signals. These neurons were found predominantly in deep cortical layers, but rarely in periventricular nodules. High magnification views show very low BrdU signals in PH. (B) Representative immunohisto-images from a BrdU birthdate study of neurons born at E16.5. A signal BrdU pulse was given at E16.5 and coronal brain sections from a Flnaflox Emx1Cre+ ; Flnb+/- (PH) and its Flnaflox Cre-;Flnb+/-littermate (Ctrl) were prepared at P22, and double immunostained by antibodies to BrdU (green) and Cux1 (red). Note the presence of BrdU+ neurons in both upper cortical layers and in periventricular nodules. High magnification views show the co-staining of Cux1 and BrdU in PH.
Figure 3 with 3 supplements
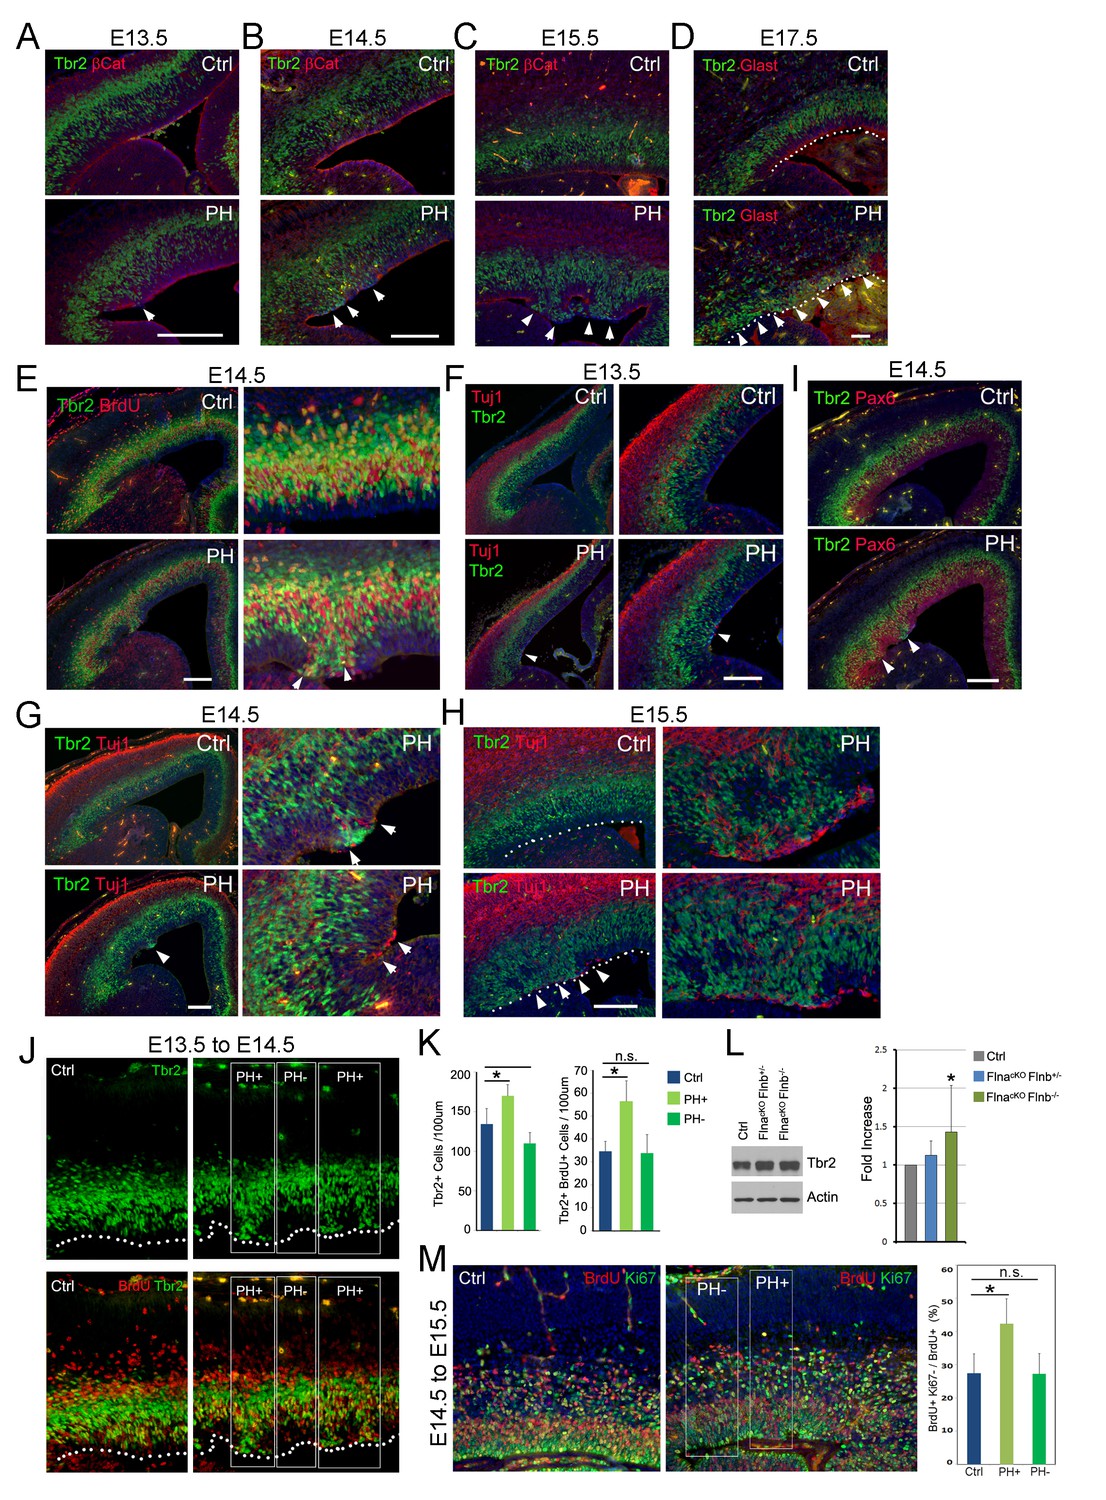
Coincidence of sporadic loss of RG adhesion with increased periventricular mislocalization, proliferation, and neurogenesis of IPs in FlncKO-NPC cortices.
(A–D) Tbr2 (green) and βCatenin or Glast (red) double immunostained cortical sections, showing the progressive yet sporadic loss of AJs and the apicalization of IPs in PH brains (indicated by arrows) from E13.5 to E17.5. The ventricular surface in D is marked by dotted lines. (E) Tbr2 and BrdU double immunostained cortical sections from BrdU transiently labeled embryos at E14.5. Arrows indicate proliferating Tbr2+ IPs at the ventricular surface. (F–H) Tbr2 (green) and Tuj1 (red) double immunostained cortical sections, showing the coincidence of IP apicalization of IPs and periventricular neuron production (indicated by arrows) in PH brains from E13.5 to E15.5. The ventricular surface in H is marked by dotted lines. (I) Tbr2 (green) and Pax6 (red) double immunostained cortical sections, showing regional disorganization of RGs and IPs in PH brain at E14.5. (J, K) Quantitative analysis of the number and transient amplification of IPs in control and FlncKO-NPC cortices. Embryos were pulse labeled with BrdU at E13.5 and analyzed for cells with Tbr2 and BrdU double immunolabeling at E14.5. Cells in regions showing apicalized IPs (PH+) were scored separately from adjacent regions where IPs retain the normal basal SVZ localization (PH-). Cell numbers were normalized by the length of ventricular surface (of 100 um). Data were acquired from three independent litters and are presented as Mean + SD; *: significantly increased Tbr2+ and Tbr2+;BrdU+ cells are detected specifically in PH+ regions (p<0.001). (L) Immunoblotting analysis of cortical Tbr2 protein levels. Data were acquired from more than three independent litters and are presented as Mean + SD; *: a significant increase was detected in the FlnacKO;Flnb-/- cortices (p<0.03). (M) Cell cycle exit profiles of control and FlnacKO;Flnb-/- cortical neural progenitors. Embryos were pulse labeled with BrdU at E14.5 and analyzed at E15.5 by double immunostaining of BrdU (red) and Ki67 (green). Cells that exit the cell cycle were identified as those that were positive for BrdU but negative for Ki67. Regions with apicalized BrdU+ cell (PH+) were scored separately from those with well-preserved progenitor domains in the same mutant brain (PH-). Data were acquired from three independent litters and are presented as Mean + SD; *: compared to controls, the fraction of cells that quitted the cell cycle is significantly higher in PH+ regions (p<0.001). Nuclei DNA was stained with Hoechst 33,342 and shown in blue in all fluorescent images. Bars: 100 μm.
Figure 3—figure supplement 1
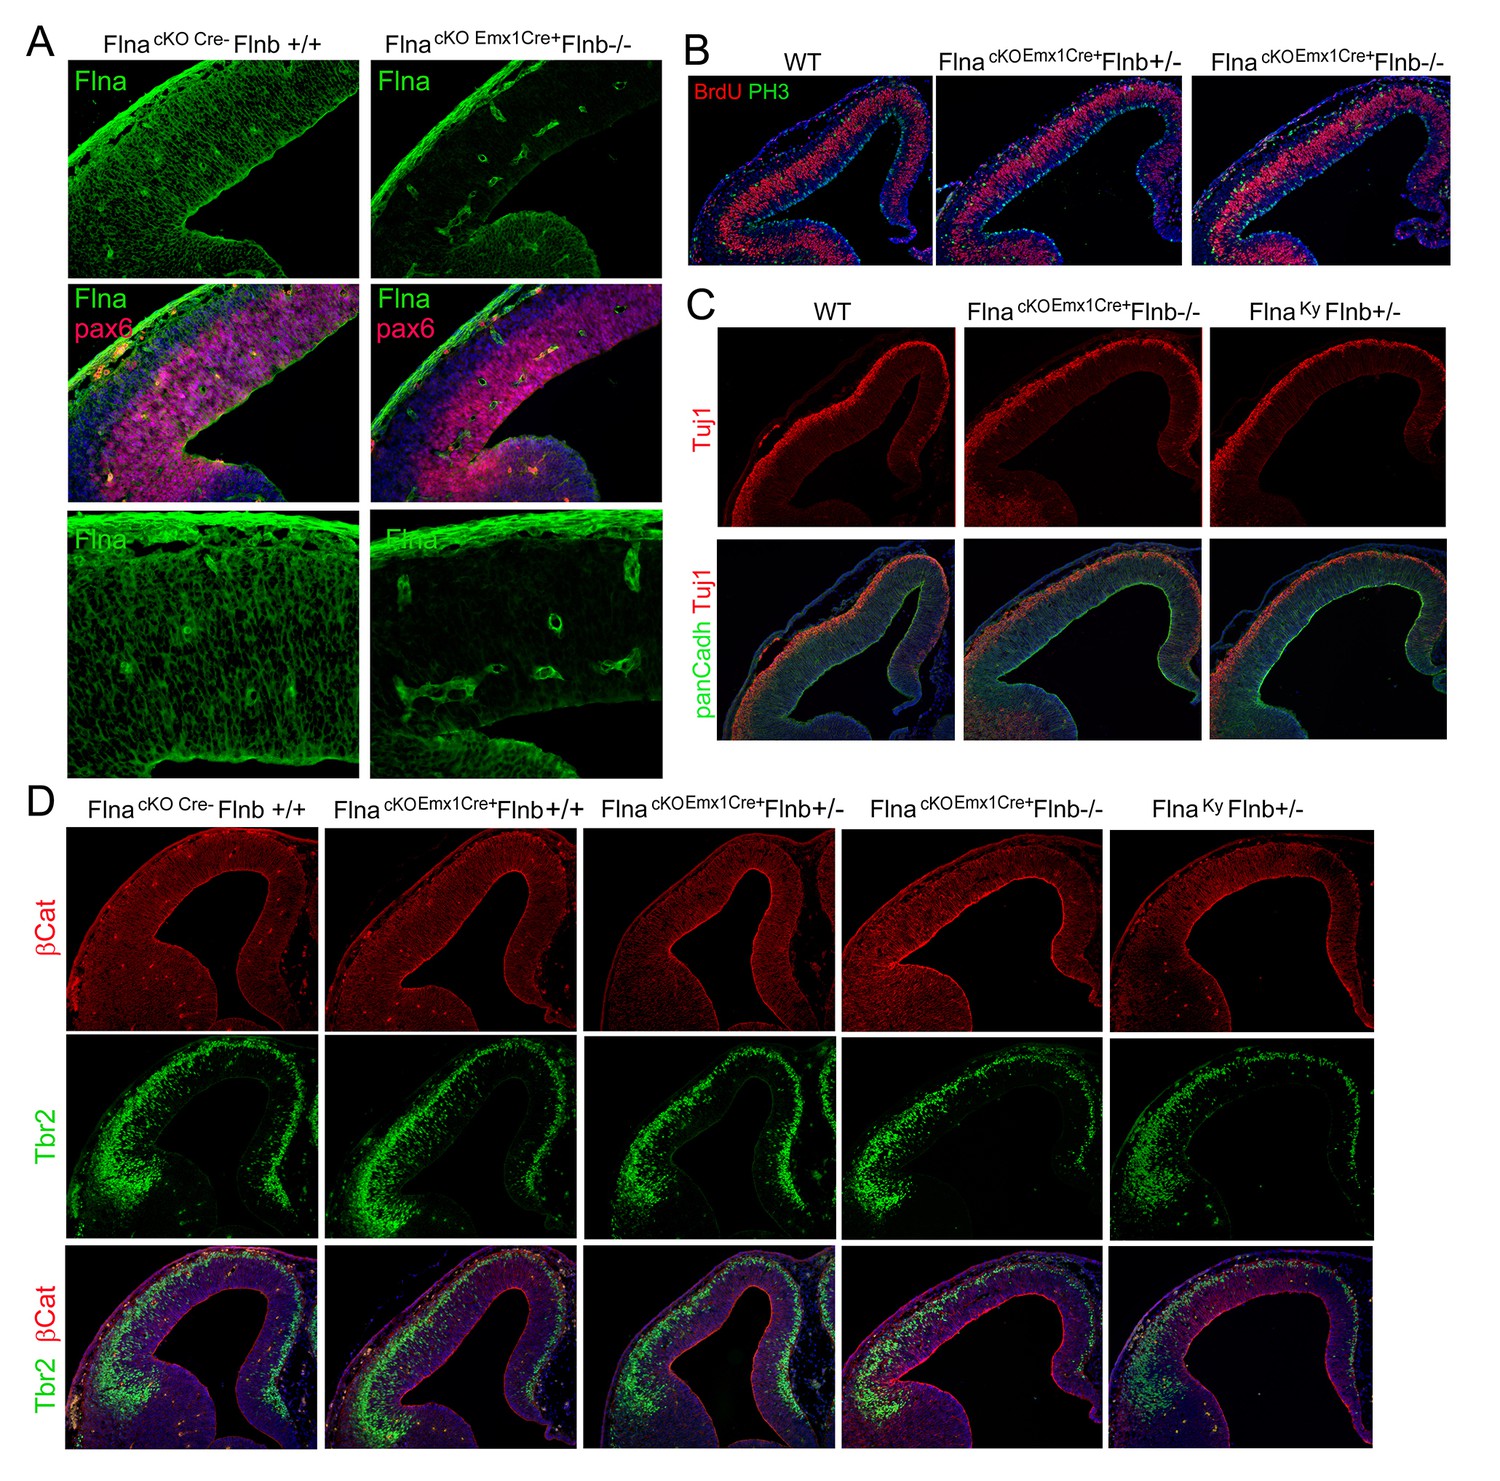
Effective Flna protein abrogation from NPCs lineages and lack of cortical structural impairment in all Flna-Flnb compound mutant brains at E12.5.
(A) Filamin A (green) and Pax6 (red) double immunohistological stained brain sections from a control and a Flnaflox Emx1Cre+ ;Flnb-/- embryo at E12.5, indicating the absence of filamin A in NPC-derived neural tissue. Note the high filamin A on blood vessels. (B) Double immunostaining of cortical sections from a Flnaflox Emx1Cre+ ;Flnb-/- and control embryos show normal number and distribution of both S-phase and M-phase NPCs at E12.5. S phase was identified by BrdU pulse labeling and immunostaining (red); M phase was identified by immunostaining with an antibody to phospho-Histone 3(PH3, green). (C) Double immunostaining with antibodies to panCadherin (green) and neuron marker Tuj1(red) showing normal RG adhesion, cortical histogenesis and neurogenesis in both Flnak/y;Flnb+/- and Flnaflox Emx1Cre+ ;Flnb-/- embryos at E12.5. (D) Double immunohistological staining with AJ marker β-Catenin (red) and IP marker Tbr2 (green), showing undisturbed NPC adhesion as well as normal production and localization of IPs in both Flnak/y;Flnb+/- and Flnaflox Emx1Cre+ ;Flnb-/- embryos at E12.5. No Flnak/y;Flnb-/- embryos were recovered at E12.5 due to early embryonic lethality. Nuclei DNA was stained with Hoechst 33,342 and shown in blue in all fluorescence images.
Figure 3—figure supplement 2
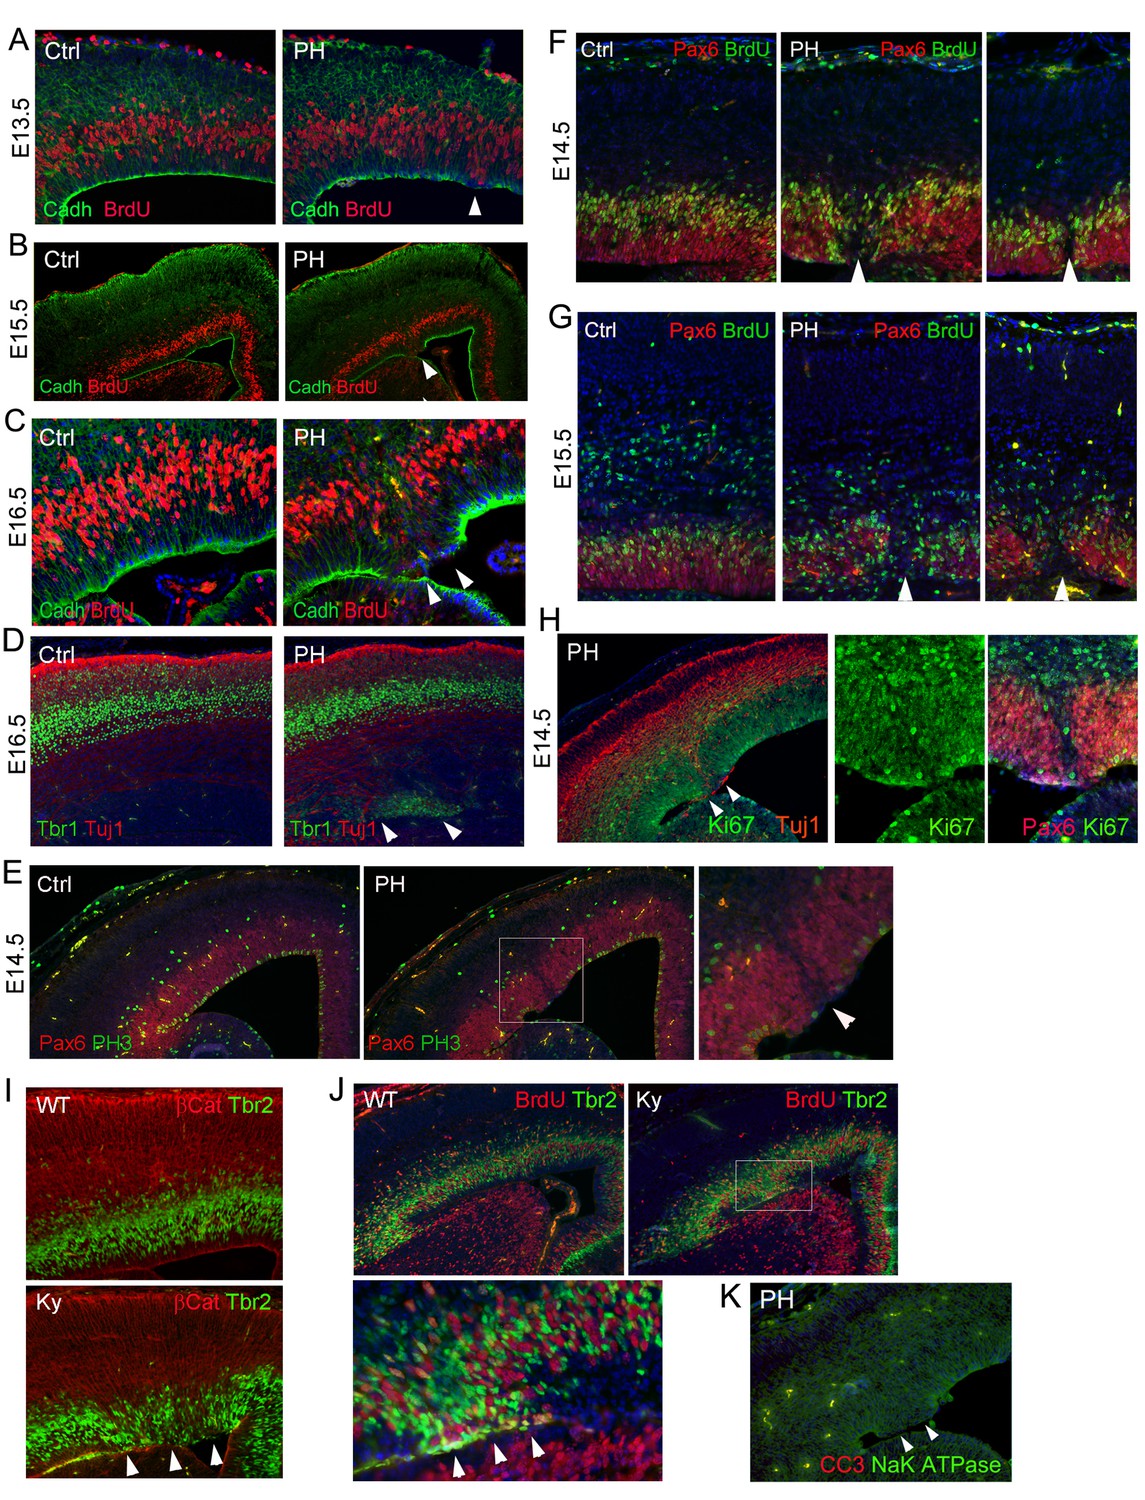
Ectopic division of IPs and presence of periventricular neurons without neocortical impairment or apoptosis in FlncKO-NPC and Flna null (FlnaKy) mutants.
(A–C) Double immunohistological analysis with antibodies to N-Cadherin (green) and BrdU (red) on cortical sections of Flnaflox Emx1Cre+ ;Flnb-/- (PH) and their control (Ctrl) littermates at E13.5, E15.5, and E16.5. Embryos were fixed 30 min after BrdU pulse labeling. Arrows indicate mislocalized S-phase nuclei adjacent to the ventricular surface where N-Cadherin signals were reduced. High magnification images of E16.5 also show the concurrence of ectopic S-phase nuclei with local loss of RG polarity and adhesion in the mutant. (D) Double immunohistological analysis with antibodies to Tbr1 (green) and Tuj1 (red) to reveal newborn neurons in a Flnaflox Emx1Cre+ ;Flnb-/- (PH) and its control (Ctrl) littermate at E16.5. Note the normal cortical distribution of Tbr1 and Tuj1 despite their periventricular appearance (indicated by arrows). (E) Double immunohistological analysis with antibodies to Pax6 (normally expressed by RGs, red) and M-phase marker (PH3, green) on control (Ctrl) and Flnaflox Emx1Cre+ ;Flnb-/-(PH) cortical sections at E14.5, showing reduced Pax6+ cells and their mitosis in affected regions. (F, G) Double immunohistological analysis with antibodies to Pax6 (red) and BrdU (green), showing the association of PH formation with loss of Pax6+ RGs (arrows) at E14.5 and E15.5, respectively. Embryos were fixed 30 min after BrdU pulse labeling. (H) Double immunohistological analysis of Flnaflox Emx1Cre+ ;Flnb-/- (PH) embryos at E14.5 with antibodies to Ki67 (green) and Tuj1 or Pax6 (red, as indicated on the image), showing a well-organized cortical plate despite ectopic periventricular neurogenesis. The figure also demonstrates the presence of Ki67+ cells in regions where RGs lost Pax6 expression. (I, J) Double immunohistological analysis with antibodies to Tbr2 (green) and βCatenin (red), or Tbr2(green) and BrdU (red) on cortical sections of a wild type and a Flna null (Ky) embryo at E15.5, showing the phenocopy of FlncKO-NPC and Flna null mutants. Embryos were fixed 30 min after BrdU pulse labeling. Arrows indicate ectopic Tbr2 IPs that incorporate BrdU at the ventricular surface and their correlation with loss of AJs in the mutant RGs. (K) Double immunohistological analysis with antibodies to cleaved caspase 3 (CC3, red) and Na-K ATPase (green) on a cortical section of a Flnaflox Emx1Cre+ ;Flnb-/- embryo at E14.5, showing the absence of apoptosis. Nuclei DNA was stained with Hoechst 33,342 and shown in blue in all fluorescence images.
Figure 3—figure supplement 3
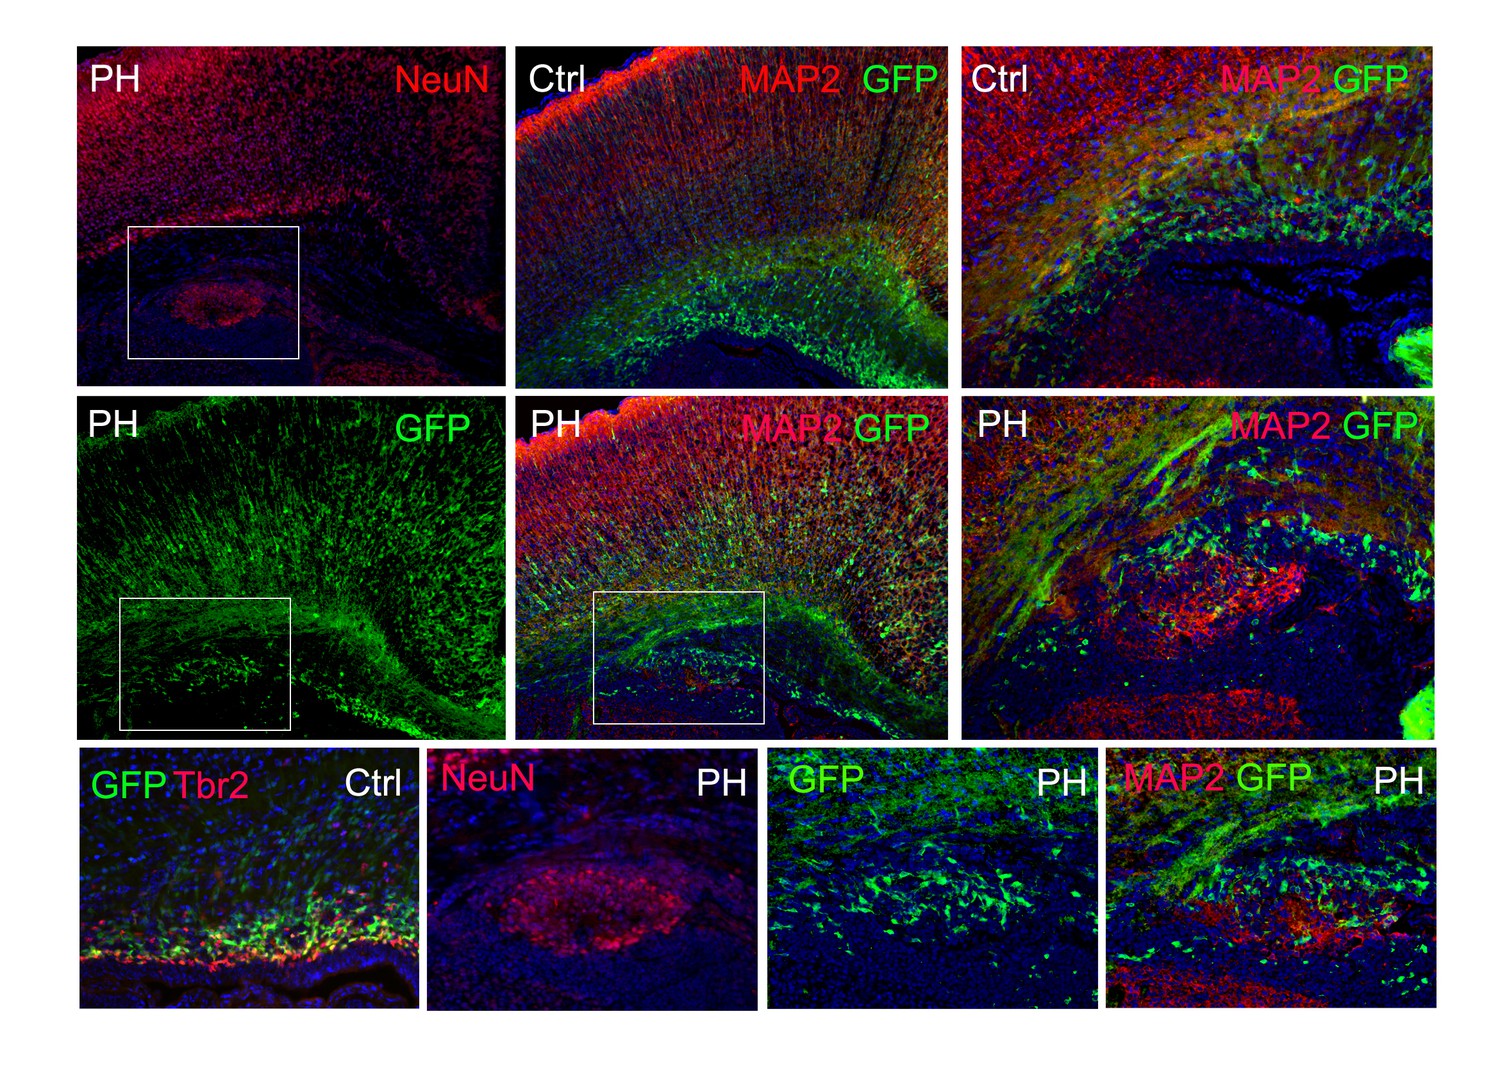
Immunohistological images of a Tbr2eGFP pseudo-lineage tracing study.
Tbr2 expressing IPs were marked by EGFP through crossing the FlncKO-NPC mice with the Tg(Eomes-EGFP) line. Due to the perdurance of EGFP, many newly generated daughter neurons from Tbr2+ IPs also express EGFP. In a Tg(Eomes-EGFP) :: FlnacKO Emx1Cre+ ;Flnb-/- brain at P0, PH was identified by periventricular NeuN or MAP2 immunosignals (red); the co-presence of EGFP+ cells (green) in PH is shown, demonstrating that neurons in PH were generated directly by mislocalized Tbr2+ IPs. Nuclei DNA was stained with Hoechst 33,342 and shown in blue in all fluorescence images.
Figure 4 with 1 supplement

Loss of multiple epithelial features of filamin mutant RGs.
(A) panCadherin (green) and BrdU (red) double immunostained cortical section of embryos fixed 30 min after a BrdU pulse at E14.5. (B) Apical junction complex marker Pals1 (green) and basal lateral marker NaK ATPase (red) double immunostained cortical sections at E14.5. (C) panCadherin (green) and tight junction marker ZO1 (red) double immunostained cortical sections at E14.5. (D) Tbr2 (green) and ZO1 (red) double immunostained cortical sections at E17.5. (E) βCatenin antibody (green) and F-actin (AlexaFluor 568 Phalloidin, red) stained cortical sections at E14.5. (F) The newborn neuron marker DCX (green) and F-actin (AlexaFluor 568 Phalloidin, red) double stained cortical sections at E14.5. (G) Pericentrin (marks the basal bodies at the apical side, green) and Glast (labels the basal processes of RGs, red) double immunostained cortical sections at E15.5. Note that the comprehensive loss of RGs’ polarity and junctional complexescortices was accompanied by reduced mechanical strength, resulting in protrusions wrapping around the adjacent RGs and the forming rosette-like structures in the PH brain (arrows). (H) Glast (red) and Tuj1 (green) double immunostained cortical sections at E15.5, showing rosettes were formed around ectopically produced periventricular neurons in the PH brains. (I) β−Catenin (red) and Tbr2 (green) double immunostained cortical sections at E15.5, showing that rosettes were formed around mislocalized IPs in the PH brains. (J, K) Triple or double immunostaining with antibodies to Glast, pericentrin, and metaphase progenitor marker phospho-vimentin 4A4 (colored as indicated on the image), which showed that loss of RG adhesion and polarity was associated with reduced RG mitosis at E15.5 in PH brains. In (A)-(F), regions with defective RGC-RGC apical adhesion, Tbr2+ IP apicalization and ectopic neurogenesis in FlncKO-NPC cortices are indicated be arrows. In (H)-(K), fully formed rosettes are indicated by arrows; partially formed rosettes are indicated by asterisks. Nuclei DNA was stained with Hoechst 33,342 and shown in blue in all fluorescence images.
Figure 4—figure supplement 1

Unremarkable change in the basal processes of RGs in regions affected by loss of filamin.
Pax6 (red) and RC2 (A, C) or Glast (B) (green) double immunostained control (Ctrl) and Flnaflox Emx1Cre+ ;Flnb-/- (PH) cortical sections show well-preserved basal RG scaffold despite the severe RG defects in the affected VZ caused by filamin loss, which is consistent with the absence of cortical plate (CP) defects in these mutants. Nuclei DNA was stained with Hoechst 33,342 and shown in blue in all fluorescence images.
Figure 5 with 1 supplement
Sustained EMT in RGs of FlncKO-NPC cortices and a direct role of FLNA in EMT regulation.
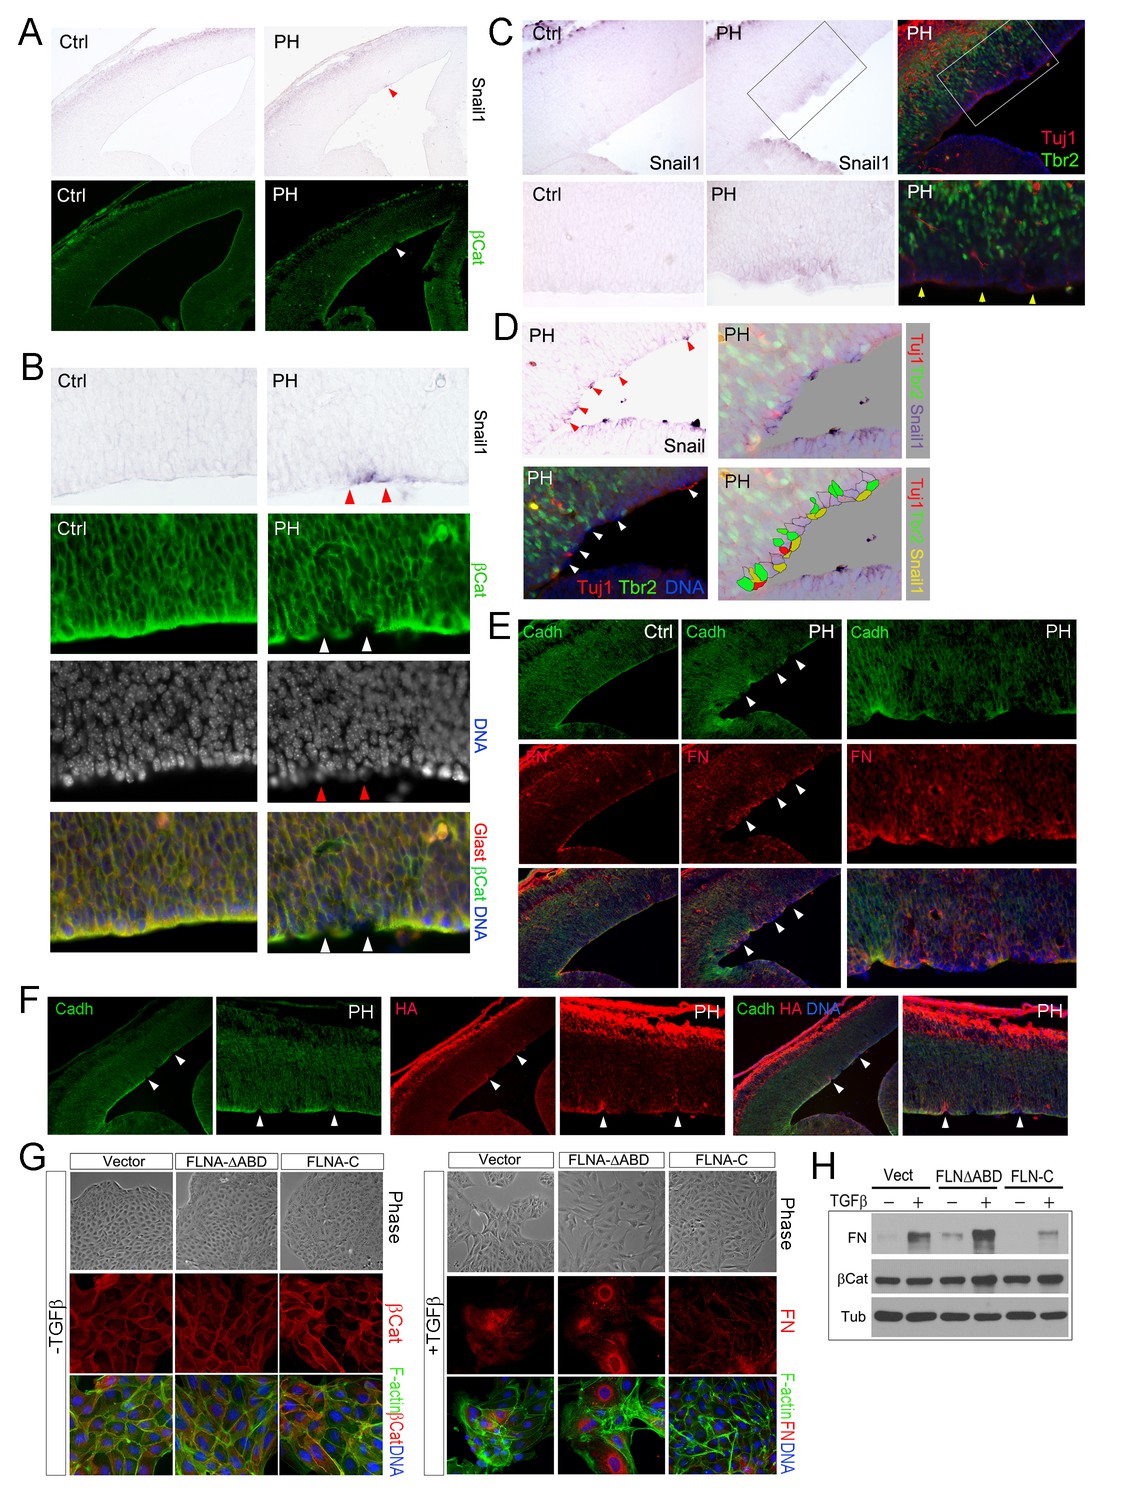
(A, B) In situ hybridization (ISH) and immunohistological analyses show the correlation of increased Snail1 expression with loss of apical β-Catenin in the cortical VZ of FlncKO-NPC embryos at E13.5. Tissue sections were subjected to ISH first; they were then co-immunostained by antibodies to β-Catenin (green) and Glast (red). Cells with high Snail1 and loss of apical β-Catenin are indicated by red and white arrows, respectively. (C, D) In situ hybridization and immunohistological analyses show the coincidence of cells with elevated Snail1, apicalized IPs, and ectopic neurons in filamin mutant VZ at E13.5. Tissue sections were subjected to ISH; photographed, then co- immunostained by antibodies to Tbr2 (green) and Tuj1 (red). Arrows indicate ectopic neurons along the ventricular surface. Overlaid images of Snail1 in situ hybridization and Tbr2, Tuj1 immunostaining are included to reveal the spatial relationship between Snail1high RGs, Tbr2+ IPs, and Tuj1+ neurons. (E) panCadherin (green) and Fibronectin (FN, red) double immunostained cortical sections at E14.5. Higher magnification images of the mutant VZ are included. (F) The coincidence of apical panCadherin (green) destabilization with increased hyaluronic acid (HA, red) in FlncKO-NPC cortices at E13.5. Regions with HA elevation were indicated by arrows. (G) Phase contrast and immunofluorescence images of MDCK cell lines stably transfected by vector, FLNA-ΔABD or FLNA-C, and cultured in the absence or presence of TGFβ for 6 days. β-Catenin (red) and F-actin (green) are used to view epithelial junctions before TGFβ induction, whereas Fibronectin (FN, red) and F-actin (green) are used to indicate mesenchymal cell like features after TGFβ induction. (H) Immunoblotting analysis of mesenchymal cell marker Fibronectin (FN) 6 days after TGFβ induction. Note that the total level of β-Catenin remained unaltered even though the cell-cell junctions were disintegrated following TGFβ induction. Nuclei DNA was stained with Hoechst 33,342 and shown in blue in all fluorescent images.
Figure 5—figure supplement 1
Increased EMT in FlncKO-NPC cortical tissue and a role of FLNA in EMT regulation.
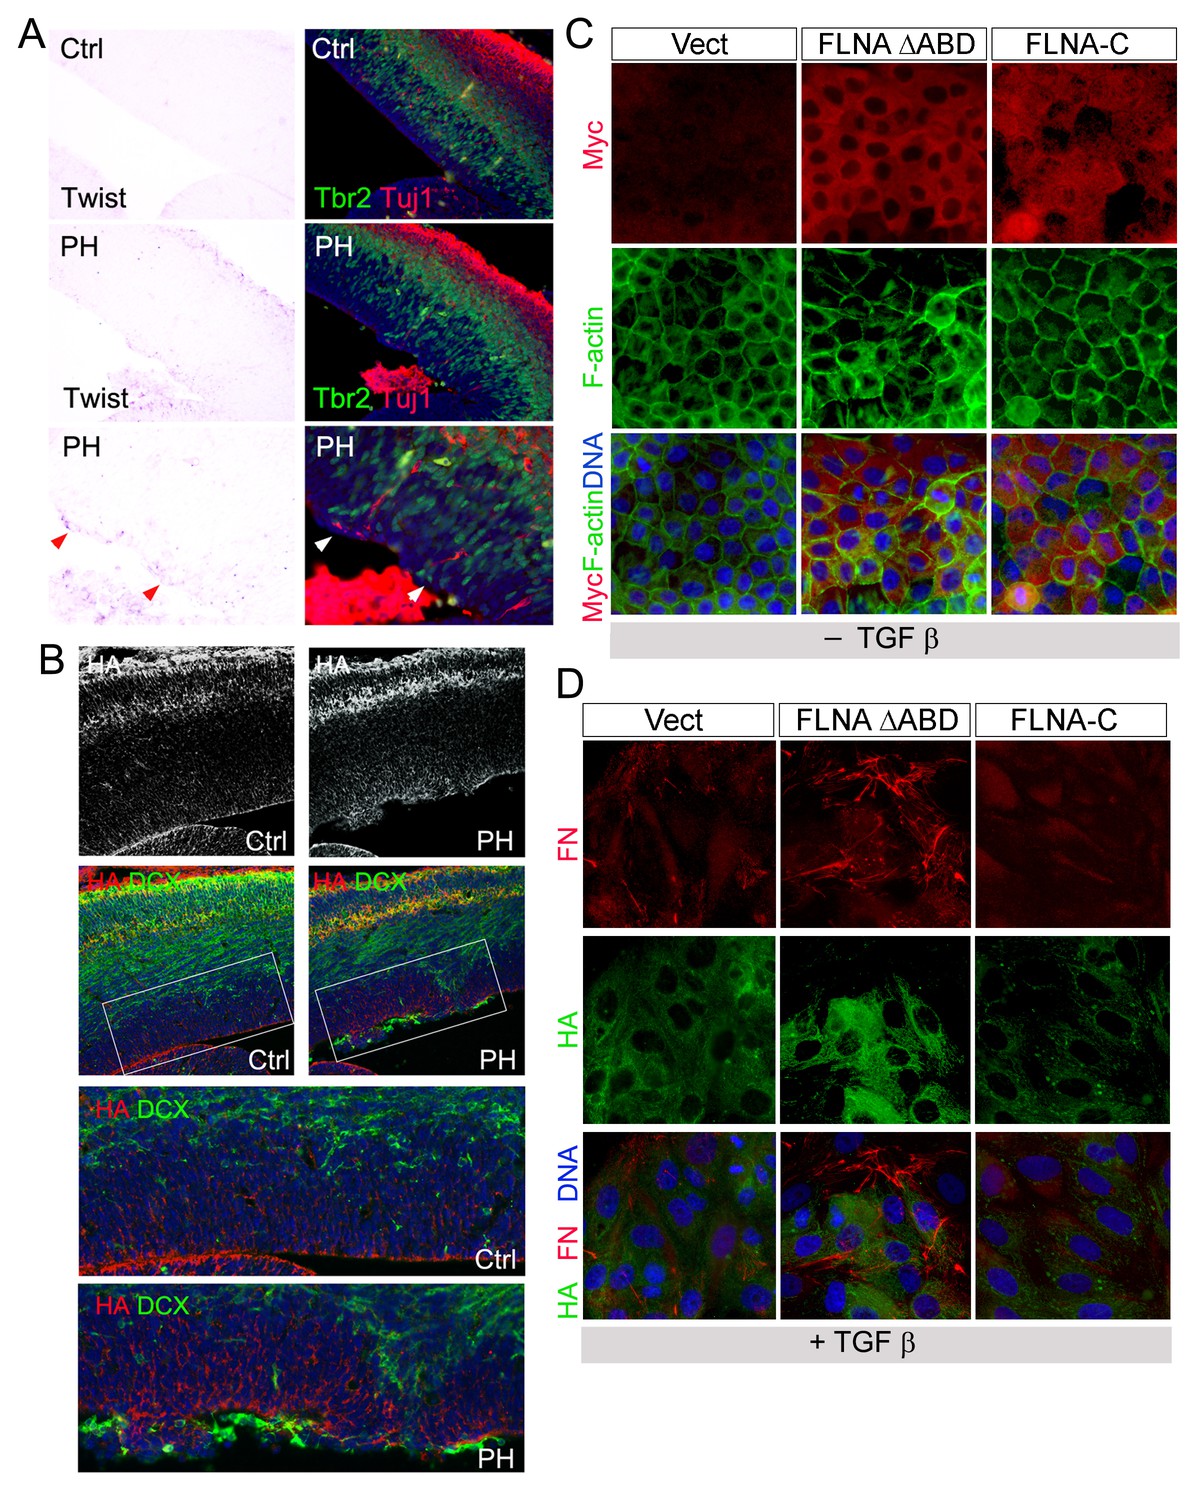
(A) Representative images of Twist1 ISH followed by immunohistological analyses at E13.5, showing the concurrent Twist1 elevation with ectopic IPs and neurons at the ventricular surface (arrows) in Flnaflox Emx1Cre+ ;Flnb-/- (PH) cortices. (B) The coincidence of elevated HA (red) with ectopic presence of neurons at the ventricular surface (labeled by DCX, green) in FlncKO-NPC (PH) cortical VZ at E15.5. (C) Immunofluorescence images of MDCK cell lines stably infected by retrovirus expressing Myc-tagged FLNA-ΔABD or Myc-tagged FLNA-C (red). F-actin was visualized by Alexa-Fluor 488. (D) Double immunofluorescence images of fibronectin (red) and hyaluronic acid (HA, green) expression in MDCK lines infected by FLNA-ΔABD, FLNA-C (red) or vector and cultured in TGFβ for 6 days.
Figure 6 with 3 supplements
Coincidence of neural and vascular phenotypes in FlncKO-NPC cortices.
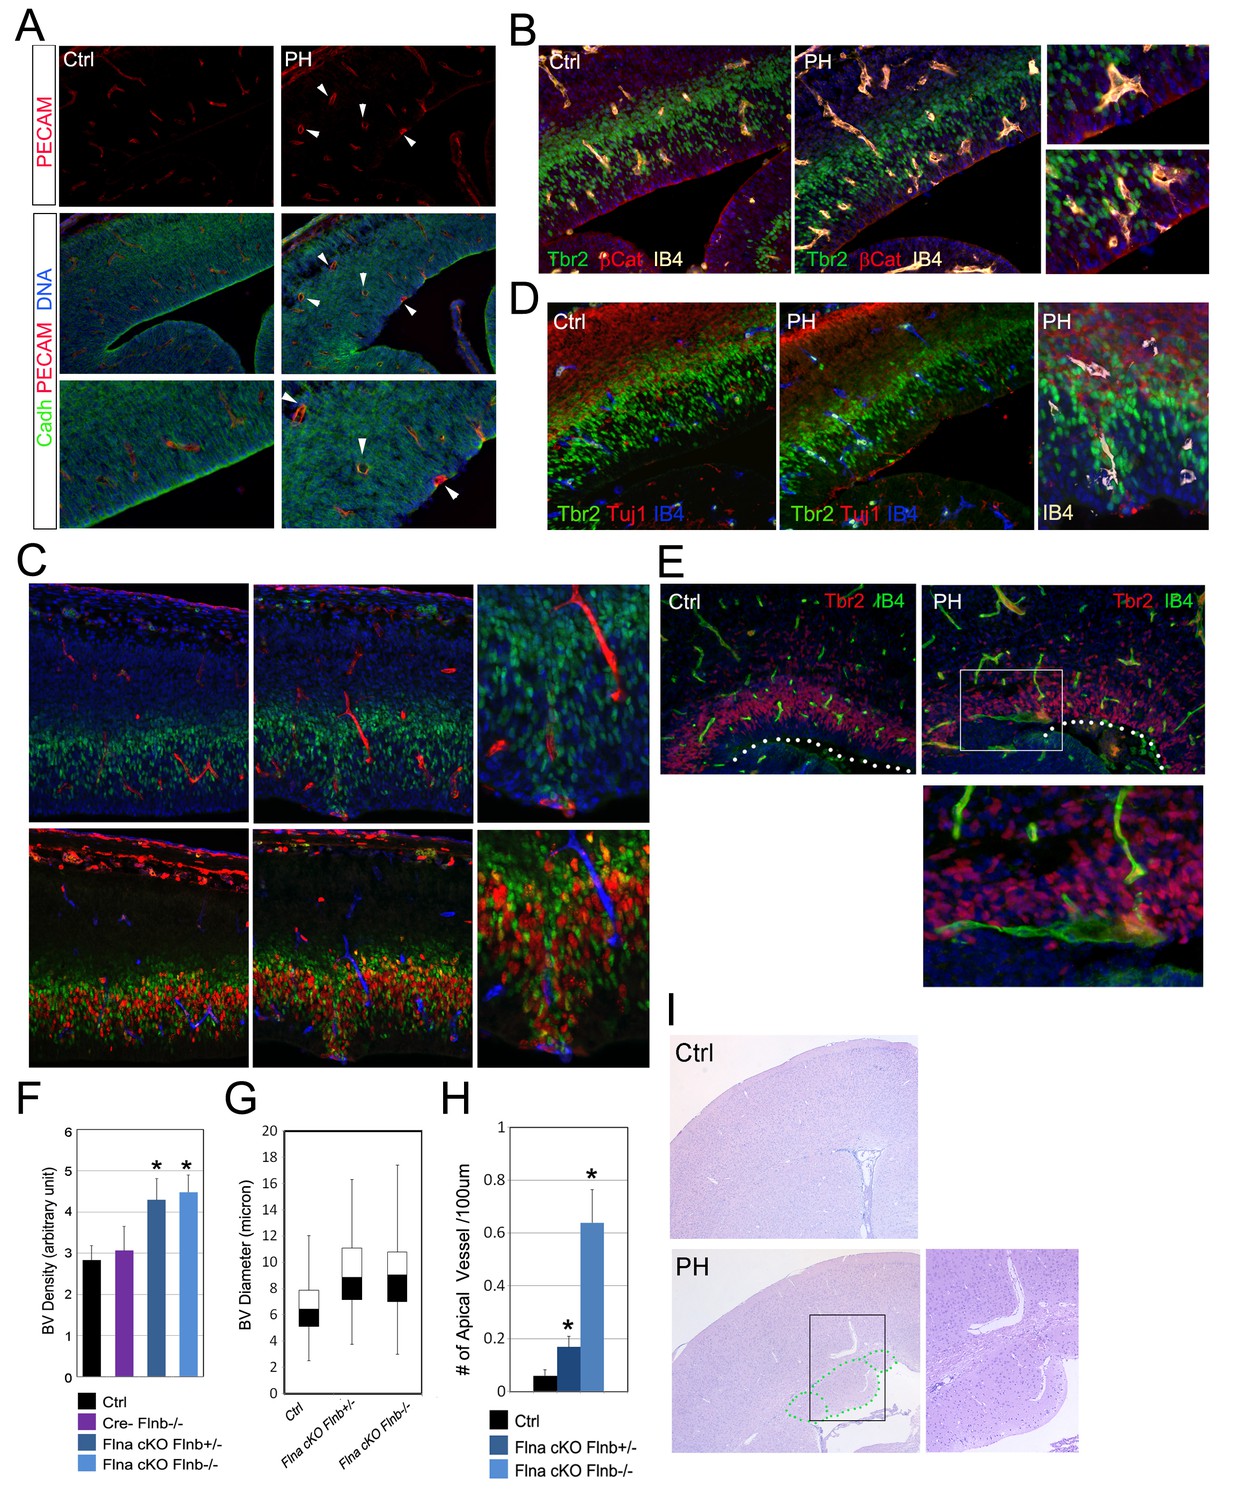
(A) PECAM (red) and pan-Cadherin (green) double immunostained cortical sections at E14.5. Arrows indicate enlarged periventicular blood vessels in FlncKO-NPC cortices. (B) β-Catenin (red), Tbr2 (green), and Biotin-IB4 (yellow) triple stained cortical sections of control and PH at E14.5. Higher magnification views show the intermingling of periventricular blood vessels with defective RGs and IPs in the mutant. (C) BrdU (red), Tbr2 (green), and Biotin-IB4 (red or blue as indicated) triple stained cortical sections of control and PH embryos at E15.5. Embryos were fixed 30 min after a BrdU pulse. Higher magnification views reveal the coincidence of periventricular blood vessels and proliferative IPs. (D) Tuj1 (red), Tbr2 (green), and Biotin-IB4 (blue or white as labeled) triple immunostained cortical sections at E14.5. A higher magnification image shows the spatial concurrence of aberrant blood vessels, apicalized IPs, and ectopic neurogenesis at the ventricular surface. (E) Tbr2 (red) and Biotin-IB4 (green) double stained cortical sections at E17.5. A higher magnification image shows the enlarged periventricular blood vessel in the mutant. The ventricular surface is indicated by dotted lines. (F) Quantification of vascular density at E14.5. Data are presented as Mean + SD from a minimum of 3 independent litters. *p<0.001. (G) Box and whisker plots of blood vessel diameter. Shown are medians, the 25th–75th percentiles (box), maximum and minimum values (whiskers) from 3 independent litters. (H) Quantification of periventricular (< 1-cell diameter from the ventricle) blood vessels per 100 μm ventricular line. Data are presented as Mean + SD from a minimum of 3 independent litters. *p<0.001. (I) H&E stained cortical sections from a control and a FlnacKO;Flnb + /-mutant at weaning, showing the coincidence of PH and aberrantly enlarged blood vessels.
Figure 6—figure supplement 1
Developmental cortical angiogenesis and IP-genesis.
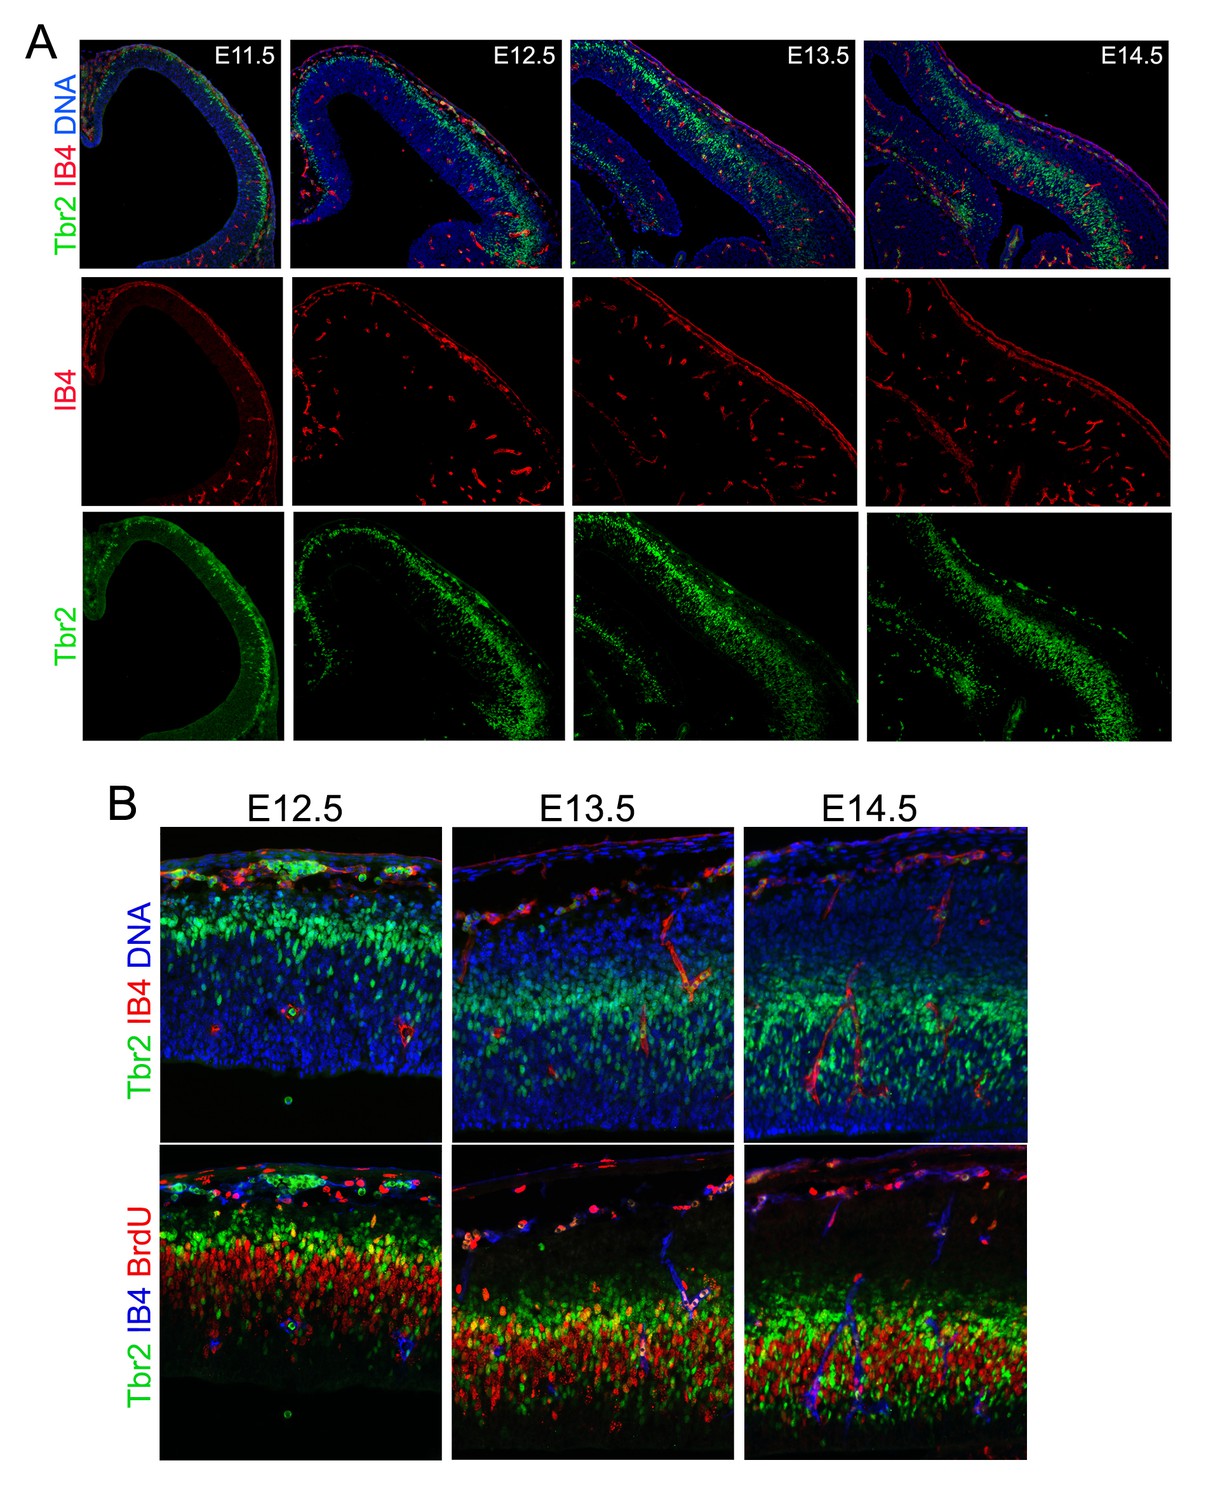
Double or triple immunohistological analysis of blood vessels (IB4), IPs (Tbr2), and cell proliferation (BrdU transient label) in the developing cerebral cortex from E11.5 to E14.5. Note that IPs start to localize and proliferate in the vicinity of blood vessels after E13.5.
Figure 6—figure supplement 2

Aberrant cerebral angiogenesis with PH-genesis was observed in FlncKO-NPC but not FlncKO-EC mutants.
(A) VE-Cadherin (red) and Tbr2 (green) double immunostained cortical sections from a control and its FlncKO-NPC (PH) littermate at E13.5. Note the spatial correlation of enlarged ectopic blood vessels with mislocalized IPs at the ventricular surface. (B) Double immunostained cortical sections from a FlncKO-NPC (PH) and its control littermate at E14.5 with biotinylated IB4 (green) and Tbr2, or BrdU (red) antibodies, showing the intermingling of aberrant blood vessels with apicalized IPs. Embryos were pulse labeled by BrdU. The dotted lines mark the ventricular surface. (C) Triple immunostained cortical sections from a control and its FlncKO-NPC (PH) littermate at E15.5 with IB4 (blue) and antibodies to beta-Catenin (red) and Tbr2 (green). (D) A double immunostained cortical section from an E15.5 FlncKO-NPC (PH) embryo with antibodies to PDGFβ (red, indicates vascular pericytes) and DCX (green, indicates new neurons). (E) Brain images of a control and a Flnaflox Nes8Cre+ ;Flnb-/- (PH) littermate at postnatal day 12, showing the bilateral hemorrhage of the PH brain. (F) Double stained E14.5 cortical sections with biotinylated IB4 (red) and the anti-Flna antibody (green), showing effective abrogation of Flna protein in ECs or neural tissues by Tie2Cre and Emx1Cre, respectively. (G) Quantification of vascular density in both FlncKO-NPC (Nes8 Cre)and FlncKO-EC cortices. Data are presented as Mean + SD from a minimum of 3 independent litters. *p<0.001. (G) Double immunohistological analysis of neural progenitors (BrdU 30 min pulse label, Tbr2 or β-Catenin, green) and blood vessels (IB4, red) in FlncKO-EC cortices. Nuclei DNA was stained with Hoechst 33,342 and shown in blue in all fluorescent images except (C).
Figure 6—figure supplement 3
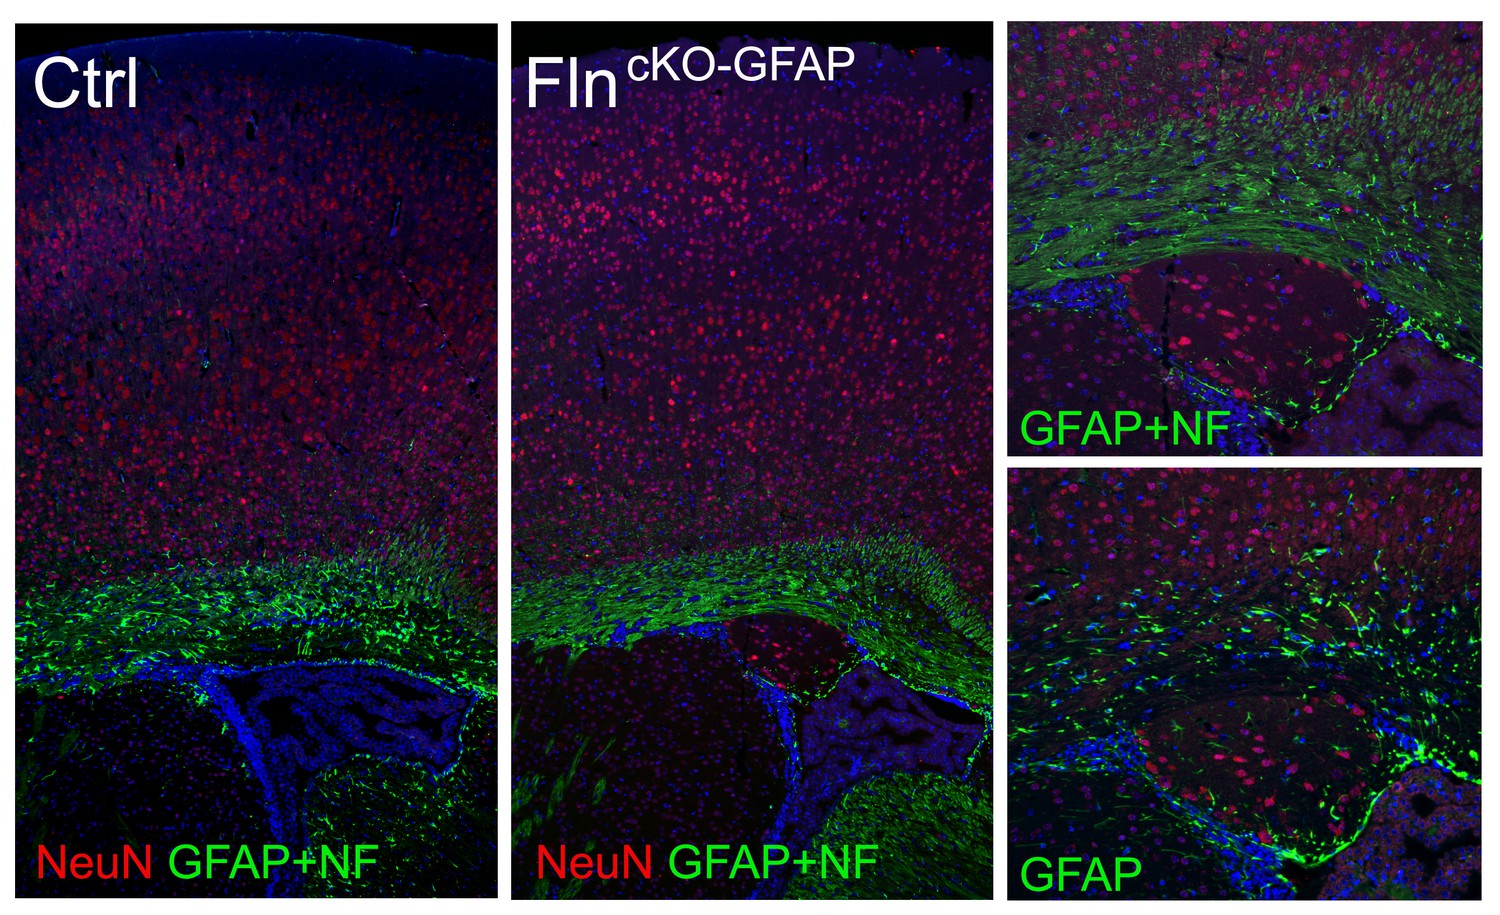
Conditional abrogating Flna by GFAP-Cre results in PH-like phenotype.
NeuN (red) and GFAP (or combined GFAP and neurofilament to better visualize white matter track, green) immunohistological images of coronal brain sections from a control (Ctrl, Flnaflox/y Cre-; FlnbWT ) and a Flnaflox/y GFAP-Cre+ ;Flnb-/- mutant littermate at P28, showing the presence of periventricular nodular neurons underneath the white matter track in the mutant. Nuclei DNA was stained with Hoechst 33,342 and shown in blue.
Figure 7
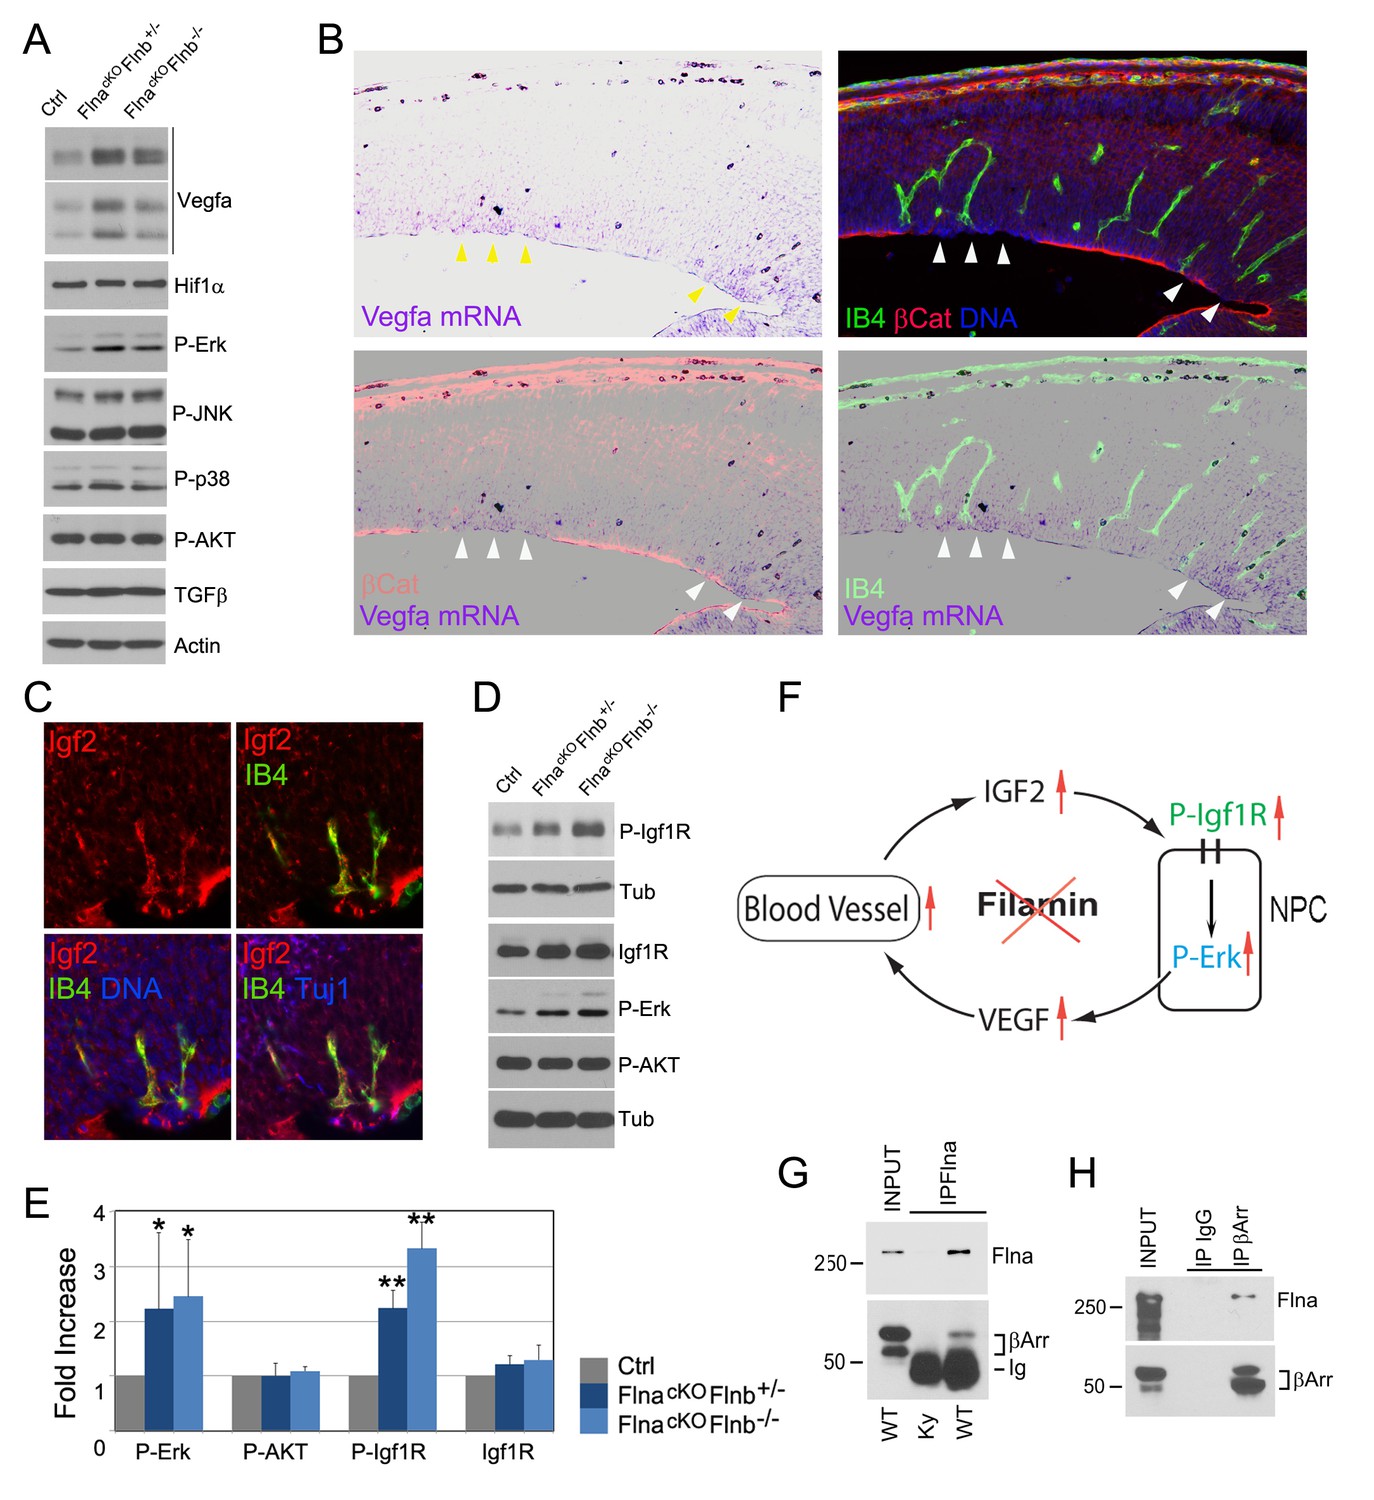
Loss of filamin function resulted in escalated Vegfa and Igf2 signaling (A, D) Immunoblotting analysis of cortical total protein extracts from E13.5 FlnacKO; Flnb+/-, FlnacKO; Flnb-/-mutants and their Cre- control littermate.
(B) Combined Vegfa mRNA in situ hybridization with IB4 and β-Catenin double immunohistological analyses on cortical sections of a Flnaflox Emx1 Cre+ ;Flnb-/- embryos at E14.5, revealing the spatial correlation of increased Vegfa expression with RG and antigenic anomalies (arrows). (C) Igf2 (red), IB4 (green), and Tuj1 (blue) triple stained cortical sections of a FlncKO-NPC embryo at E14.5, showing high Igf2 in periventricular blood vessels. (E) Quantitative analysis of elevated phospho-Erk (P-Erk) and phosphor-Igfr (P-Igf1R Y1161) in FlncKO-NPC cortical tissue at E13.5. Data are acquired from a minimum three litters and presented as Mean + SD; significantly increased phospho-Erk and phospho-Igf1R Y1161 are detected in both FlnacKO;Flnb-/- and FlnacKO; Flnb+/- cortices. **p<0.001; *p<0.05. (F) A diagram illustrating the positive feedback loop that escalated the neural progenitor and angiogenic phenotypes in FlncKO-NPC cortical tissue. (G) Co-immunoprecipitation of β-arrestin with Flna. Flna immunoprecipitation was performed with cortical tissue lysates of wild type and Flna null embryos followed by immunoblotting with anti- β-arrestin. (H) Co-immunoprecipitation of Flna with β-arrestin. β-arrestin immunoprecipitation was performed with cortical tissue lysates of wild type E13.5 embryos using rabbit IgG as the negative control. An Ig light chain specific antibody was used for immunoblotting detection of Flna and β-arrestin.
Download links
A two-part list of links to download the article, or parts of the article, in various formats.
Downloads (link to download the article as PDF)
Open citations (links to open the citations from this article in various online reference manager services)
Cite this article (links to download the citations from this article in formats compatible with various reference manager tools)
Upregulation of neurovascular communication through filamin abrogation promotes ectopic periventricular neurogenesis
eLife 5:e17823.
https://doi.org/10.7554/eLife.17823


