Valosin-containing protein (VCP/p97) inhibitors relieve Mitofusin-dependent mitochondrial defects due to VCP disease mutants
- UCLA David Geffen School of Medicine, University of California, United States
- California Institute of Technology, United States
Figures
Figure 1 with 3 supplements
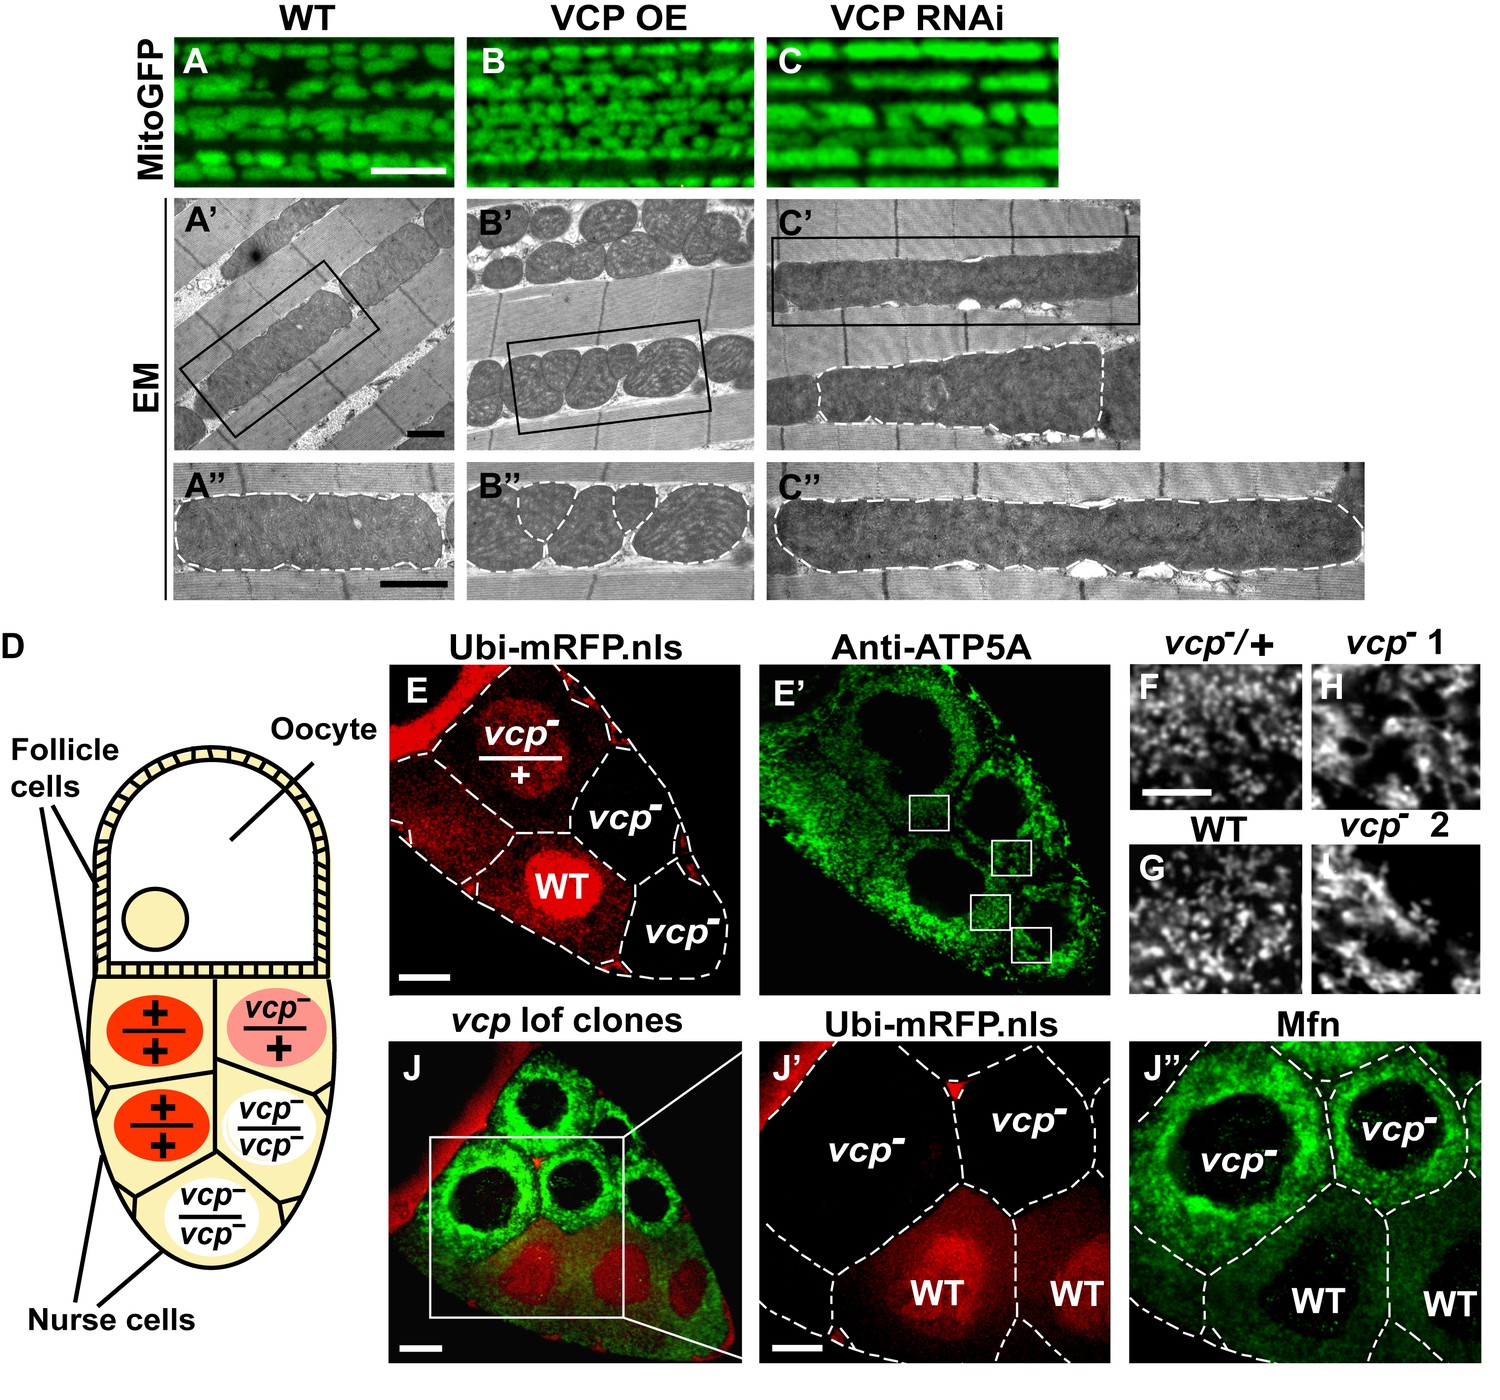
Endogenous VCP regulates mitochondrial fusion via negative regulation of Mfn protein levels.
(A–C) MitoGFP localization to mitochondria serves as a marker for healthy mitochondria and their morphology in the indirect flight muscle. VCP overexpression (VCP OE, B) results in small mitochondria compared to wildtype (WT) flies (A); VCP RNAi expression results in elongated mitochondria (C). Scale Bar: 5 µm. (A’–C’’) Electronic microscopic (EM) images show that VCP OE (B’–B’’) results in smaller mitochondria as compared with WT (A’–A’’). VCP RNAi generates elongated mitochondria with intact cristae (outlined with white dashed lines in C’ and C’’). (A’–C’) Lower magnification; (A’’–C’’) Higher magnification of mitochondria outlined with black solid lines in A’–C’. Scale bar: 1 µm. (D): Schematic diagram of nurse cell mosaic analysis in Drosophila female germline. A stage 10A egg chamber has three types of cells. The monolayer follicle cells coat the surface of the egg chamber; 15 nurse cells provide proteins and RNAs to the oocyte during oogenesis. Heat shock induction of mitotic recombination during larvae stages results in the creation of a mosaic pattern in the adult nurse cells. Ubi-mRFP.NLS (Red) is used as a clone marker. Wildtype (WT) cells are labeled with two copies of RFP, +/+; heterozygous mutant cells have one copy of RFP and one copy of vcp loss-of-function mutant, vcpK15502/+; homozygous mutant cells are RFP negative and have two copies of vcp loss-of-function mutant, vcpK15502/vcpK15502. (E): A stage 10A egg chamber with a mosaic pattern of nurse cells. Red signal is Ubi-mRFP.NLS. Scale bar: 20 µm. (E’) Anti-ATP5A antibody staining is used to visualize mitochondrial morphology in nurse cells. Scale bar: 20 µm. (F–I) Higher magnification view of mitochondrial morphology in E’ (outlined in white solid lines). Mitochondria appear as discrete and punctate structures in wildtype (G) and heterozygous vcp mutant cells (F), but becomes elongated and clumped in homozygous vcp loss-of-function mutant cells (H and I). Scale bar: 5 µm. (J) A stage 10B egg chamber with a mosaic pattern of nurse cells. Red signal is Ubi-mRFP.NLS; Green signal is anti-GFP staining of pCasper-Mfn-eGFP. Scale bar: 20 µm. (J’–J’’) Higher magnification of the egg chamber in J (outlined in white solid lines). Wildtype cells are RFP positive and homozygous vcp loss-of-function mutant cells are RFP negative (J’). pCasper-Mfn-eGFP levels significantly increase in homozygous vcp loss-of-function mutant cells (J’’). Scale bar: 10 µm.
Figure 1—figure supplement 1
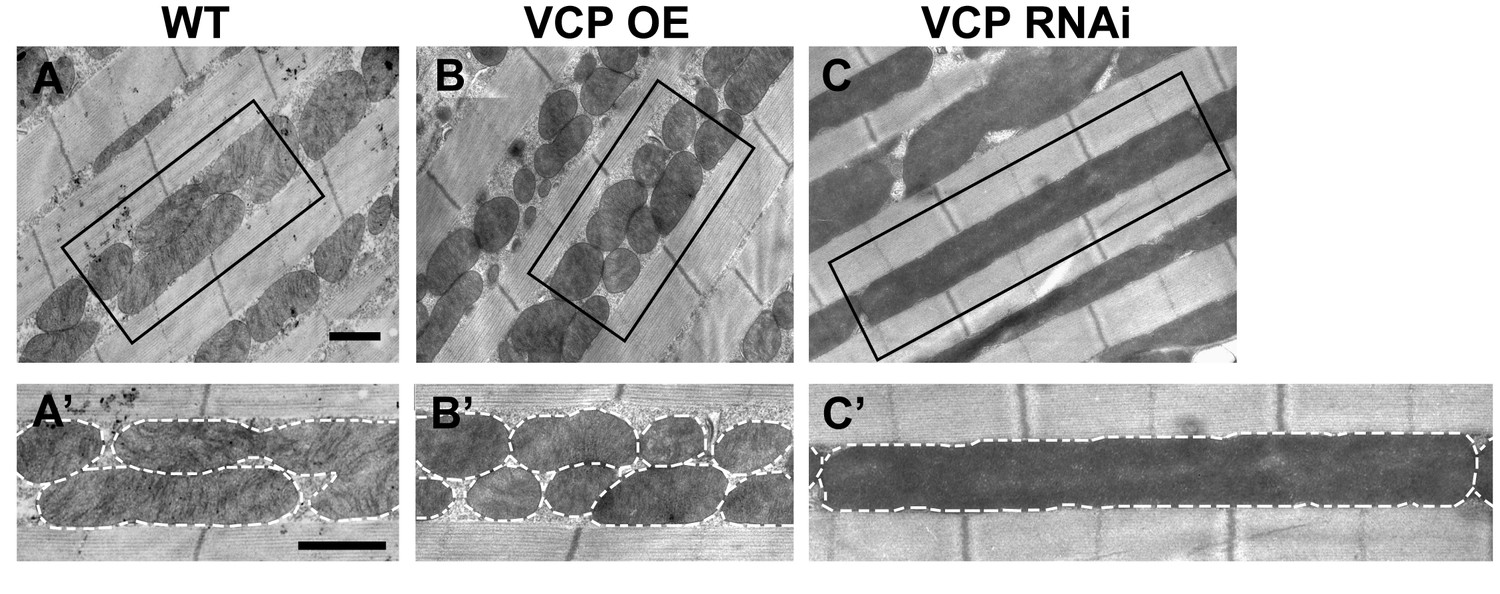
VCP overexpression leads to smaller mitochondria, while VCP RNAi leads to elongated mitochondria in 2-day-old indirect flight muscles.
(A–C’) EM shows that compared to WT (IFM-Gal4 control, A and A’), VCP WT has smaller mitochondria with intact cristae (B and B’). VCP RNAi results in mitochondrial elongation (C and C’) in 2-day-old flies. Scale bar: 1 µm.
Figure 1—figure supplement 2
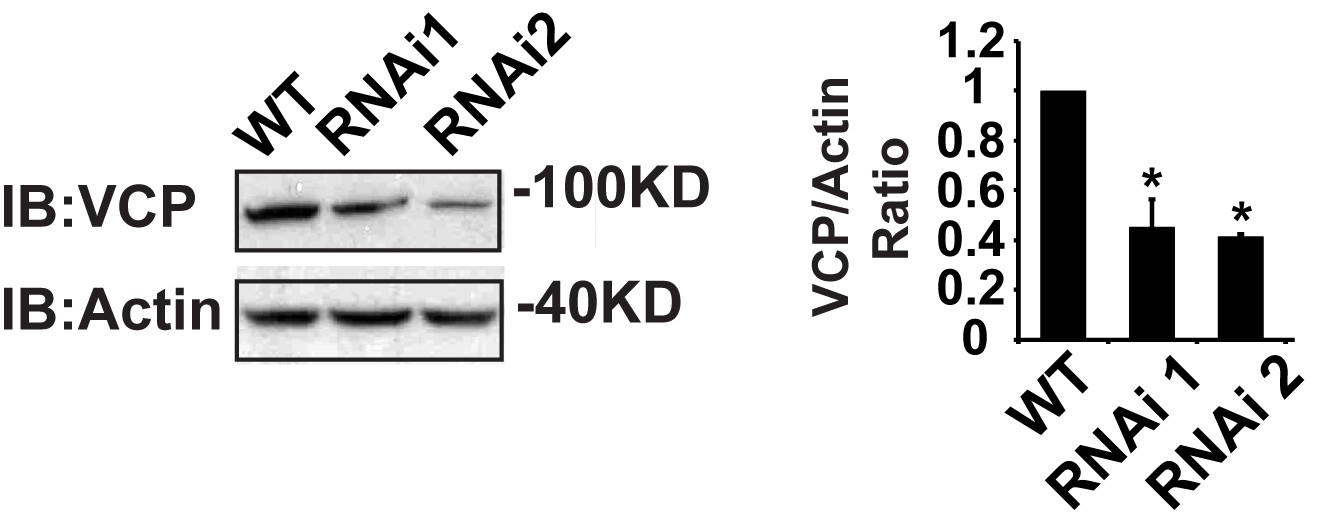
IFM-Gal4 driven UAS-VCP RNAi results in a significant decrease in VCP levels.
Expression of VCP RNAi line 1 and RNAi line 2 result in a decrease in VCP levels to 45.06 ± 11.17% (p=0.014) and 42.29 ± 1.12% (p=0.037) of those present in WT. Independent t test is used for statistical analysis, N = 3. Normalized VCP levels are shown as mean±½SD.
Figure 1—figure supplement 3
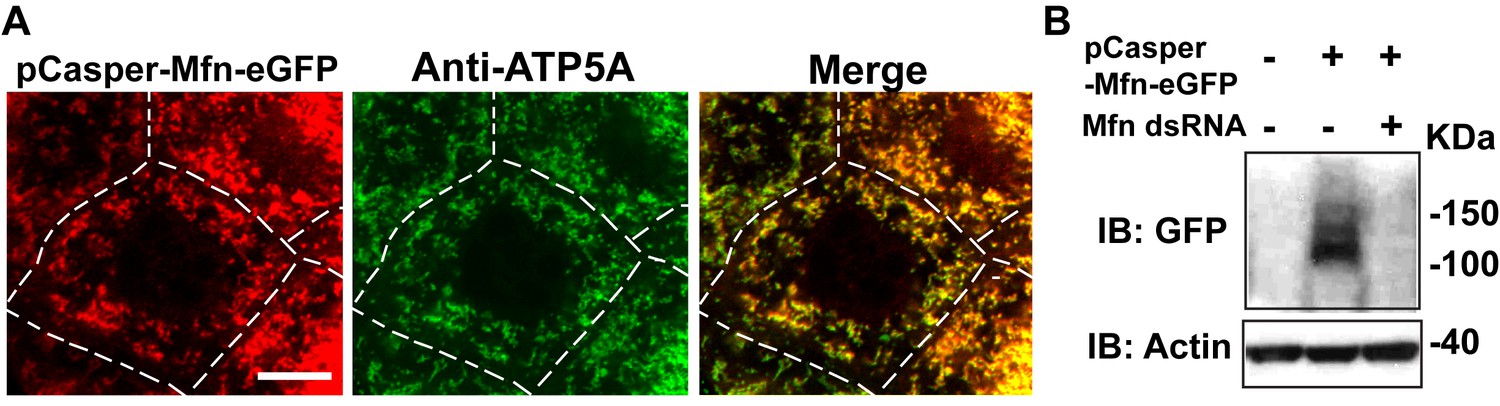
pCasper-Mfn-eGFP colocalizes with the mitochondria marker ATP5A, and is silenced by expression of dsRNA targeting endogenous Mfn.
(A) One nurse cell of a stage 10B egg chamber in transgenetic flies carrying the genomic rescue of Mfn (pCasper-Mfn-eGFP). The pCasper-Mfn-eGFP construct expresses Mfn-eGFP under the control of the endogenous Mfn promoter. GFP signal colocalizes with anti-ATP5A staining, indicating mitochondrial localization. Scale bar: 20 µm. (B) S2 cells were transfected with pCasper-Mfn-eGFP and blotted and probed with anti-GFP antibody. Mfn dsRNA treatment results in loss of Mfn-eGFP expression.
Figure 2
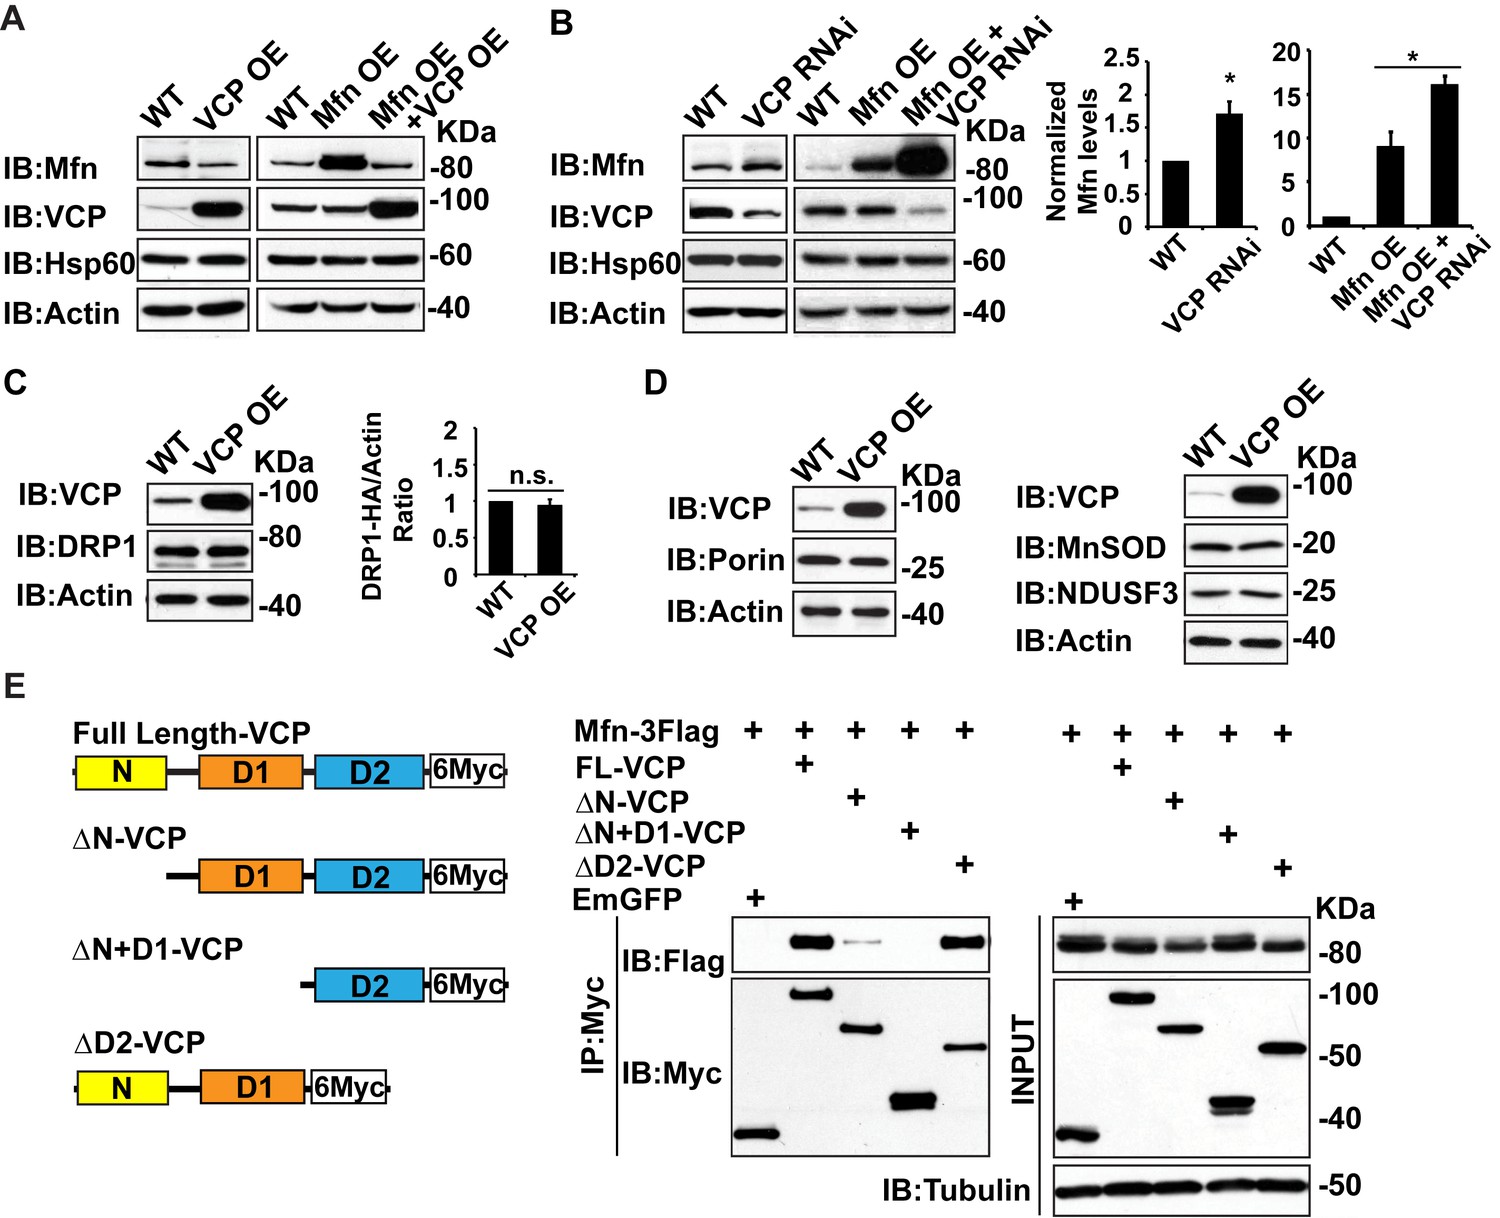
Mfn is a specific target of VCP.
(A) In fly thoraxes, VCP OE in wildtype (IFM-Gal4 control) and Mfn OE background results in a significant decrease in Mfn levels. Hsp60 was used as a mitochondria control; Actin was used as a loading control. (B) VCP RNAi leads to enhanced Mfn levels (1.72 ± 0.37 compared to wildtype, set as 1; p=0.021, independent t-test, N = 4). VCP RNAi results in accumulation of Mfn in the Mfn OE background (16.15 ± 0.85 as compared to Mfn OE alone, 9.02 ± 1.63, wildtype set as 1, p=0.0101, independent t test, N = 3). *p<0.05. Mfn levels are normalized with Hsp60 and are displayed as mean±½SD. (C) VCP OE also does not result in changes in the levels of the pro-fission protein DRP1 level (p=0.088, independent t test, N = 3). DRP1 was detected using an HA tagged genomic rescue transgene expressed under the control of the endogenous DRP1 promoter (pCasper-DRP1-HA). n.s.: no statistical difference. (D) Markers for various mitochondrial compartments, including Porin (outer membrane), MnSOD (matrix), and NDUSF3 (inner membrane) were not altered by VCP overexpression. (E) Schematic diagram of full length and truncated VCP forms used in protein interaction assays in S2 cells. Protein interactions are assayed between full length and truncated VCP forms and Mfn. N and D1 domains are essential domains for the VCP-Mfn interaction.
Figure 3 with 1 supplement
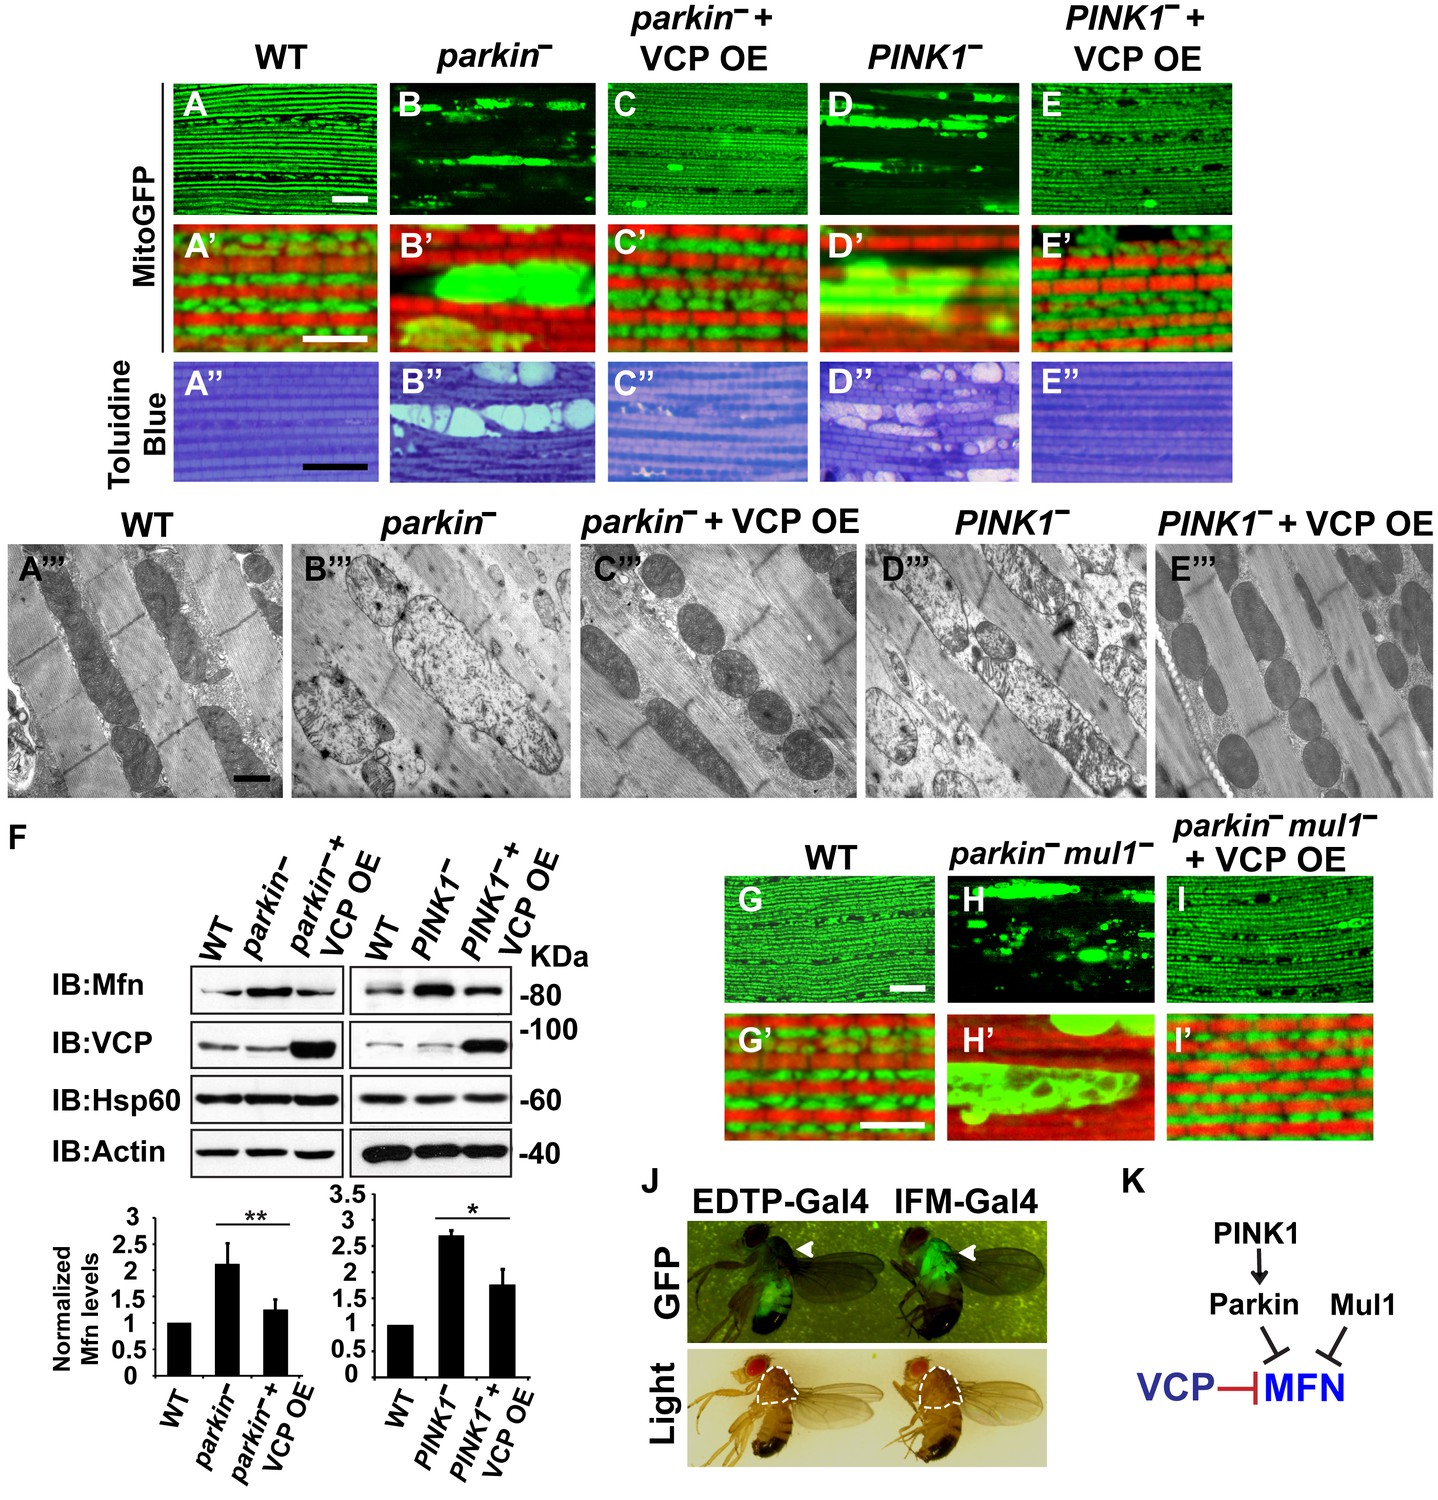
VCP overexpression suppresses mitochondrial defects in PINK1 null, parkin null and parkin mul1 double null mutants.
(A–E’) Compared to wildtype (A and A’), parkin and PINK1 mutants lose MitoGFP signal and accumulate large aggregates. VCP OE (IFM-Gal4>UAS-VCP) significantly rescues the MitoGFP phenotype in both mutants. Filamentous actin is stained with Rhodamine Phalloidin (Red). (A–E) Lower magnification. Scale bar: 20 µm. (A’–E’) Higher magnification. Scale bar: 5 µm. (A’’–E’’) Toluidine Blue shows that vacuole formation in the muscle tissue in parkin and PINK1 mutants is robustly suppressed by VCP OE. Thoraxes are assayed 2 days after eclosion. Scale bar: 30 µm. (A’’’–E’’’) At the ultrastructural level, wildtype (WT, IFM-Gal4 control) mitochondria are well aligned with compact cristae (A’’’). parkin and PINK1 mutants display swollen mitochondria with broken cristae (B’’’ and D’’’). VCP OE (IFM-Gal4>UAS-VCP) completely rescued the mitochondrial defects in both mutants (C’’’ and E’’’). Thoraxes are sectioned at 2 days after eclosion. Scale bar: 1 µm. (F) VCP OE caused a decrease in Mfn accumulation in parkin and PINK1 mutants. Mfn protein levels in the parkin mutant increased to 2.12 ± 0.69 as compared with wildtype (set as 1). VCP OE caused a decrease in Mfn levels in the parkin mutant to 1.26 ± 0.34 as compared with parkin (p=0.005, independent t test, N = 3. **p<0.01). In PINK1 mutants, Mfn levels increased to 2.69 ± 0.11 as compared with wildtype, while VCP OE in PINK1 mutant caused Mfn levels to decrease (1.77 ± 0.29 as compared with PINK1, p=0.023, independent t test, N = 3, *p<0.05). Normalized Mfn levels are shown as mean±½SD. (G–I’) Compared to wildtype, the parkin mul1 mutant lacks the most MitoGFP signal and large aggregates are present (G–H’). VCP OE (IFM-Gal4>UAS-VCP) rescues the MitoGFP phenotype in parkin mul1 mutants (I and I’). Myofibrils are stained with Rhodamine Phalloidin (Red). (G–I) Lower Magnification, Scale bar: 20 µm; (G’–I’) Higher Magnification, Scale bar: 5 µm. (J) Expression pattern of EDTP-Gal4 and IFM-Gal4 in 3-day-old flies. EDTP-Gal4 driven UAS-MitoGFP signal is barely detected in the thorax, where the indirect flight muscle is located, suggesting that EDTP-Gal4 does not have sufficient flight muscle specific expression. MitoGFP is present at high levels in the thoraxes of IFM-Gal4 driven flies. Thorax structure is outlined with dashed white lines in white light and indicated with a white arrowhead in GFP field. (K) Schematic diagram showing that PINK/Parkin in parallel with Mul1 negatively regulates Mfn protein levels; VCP negatively regulates Mfn protein levels independent of these modifiers.
Figure 3—figure supplement 1
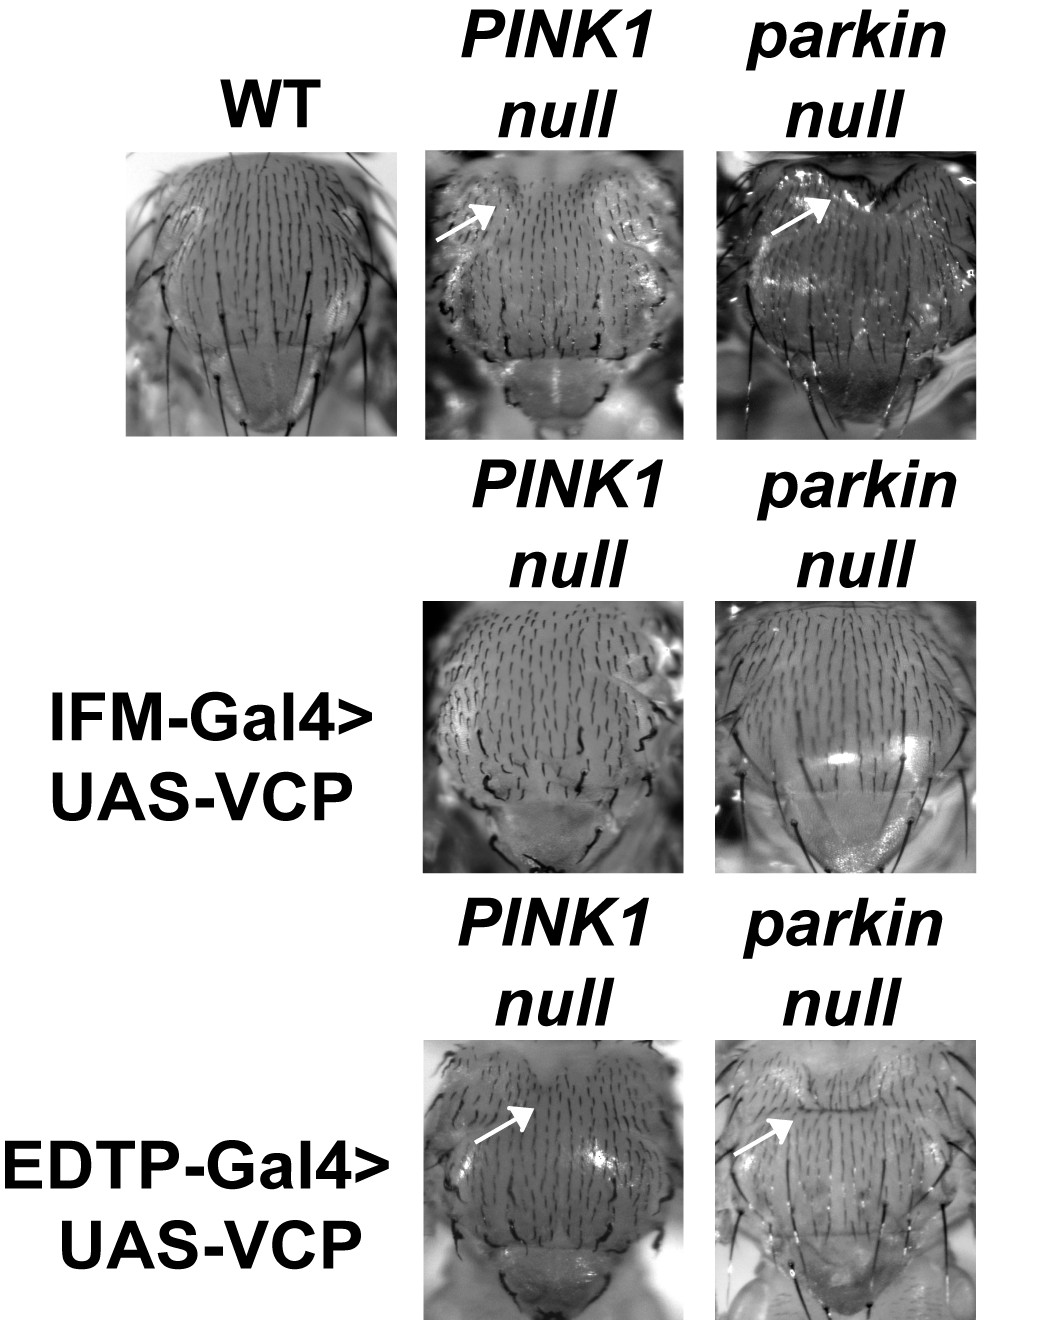
IFM-Gal4 driven UAS-VCP expression but not EDTP-Gal4 driven UAS-VCP rescues thorax defects in PINK1 and parkin mutants in Drosophila.
Thorax indentation (white arrows) is observed in both PINK1 and parkin mutants, indicative of muscle tissue damage. EDTP-Gal4 driven UAS-VCP does not rescue this defect in PINK1 and parkin mutants. IFM-Gal4 driven UAS-VCP completely rescues the thorax indentation in both mutants.
Figure 4 with 1 supplement
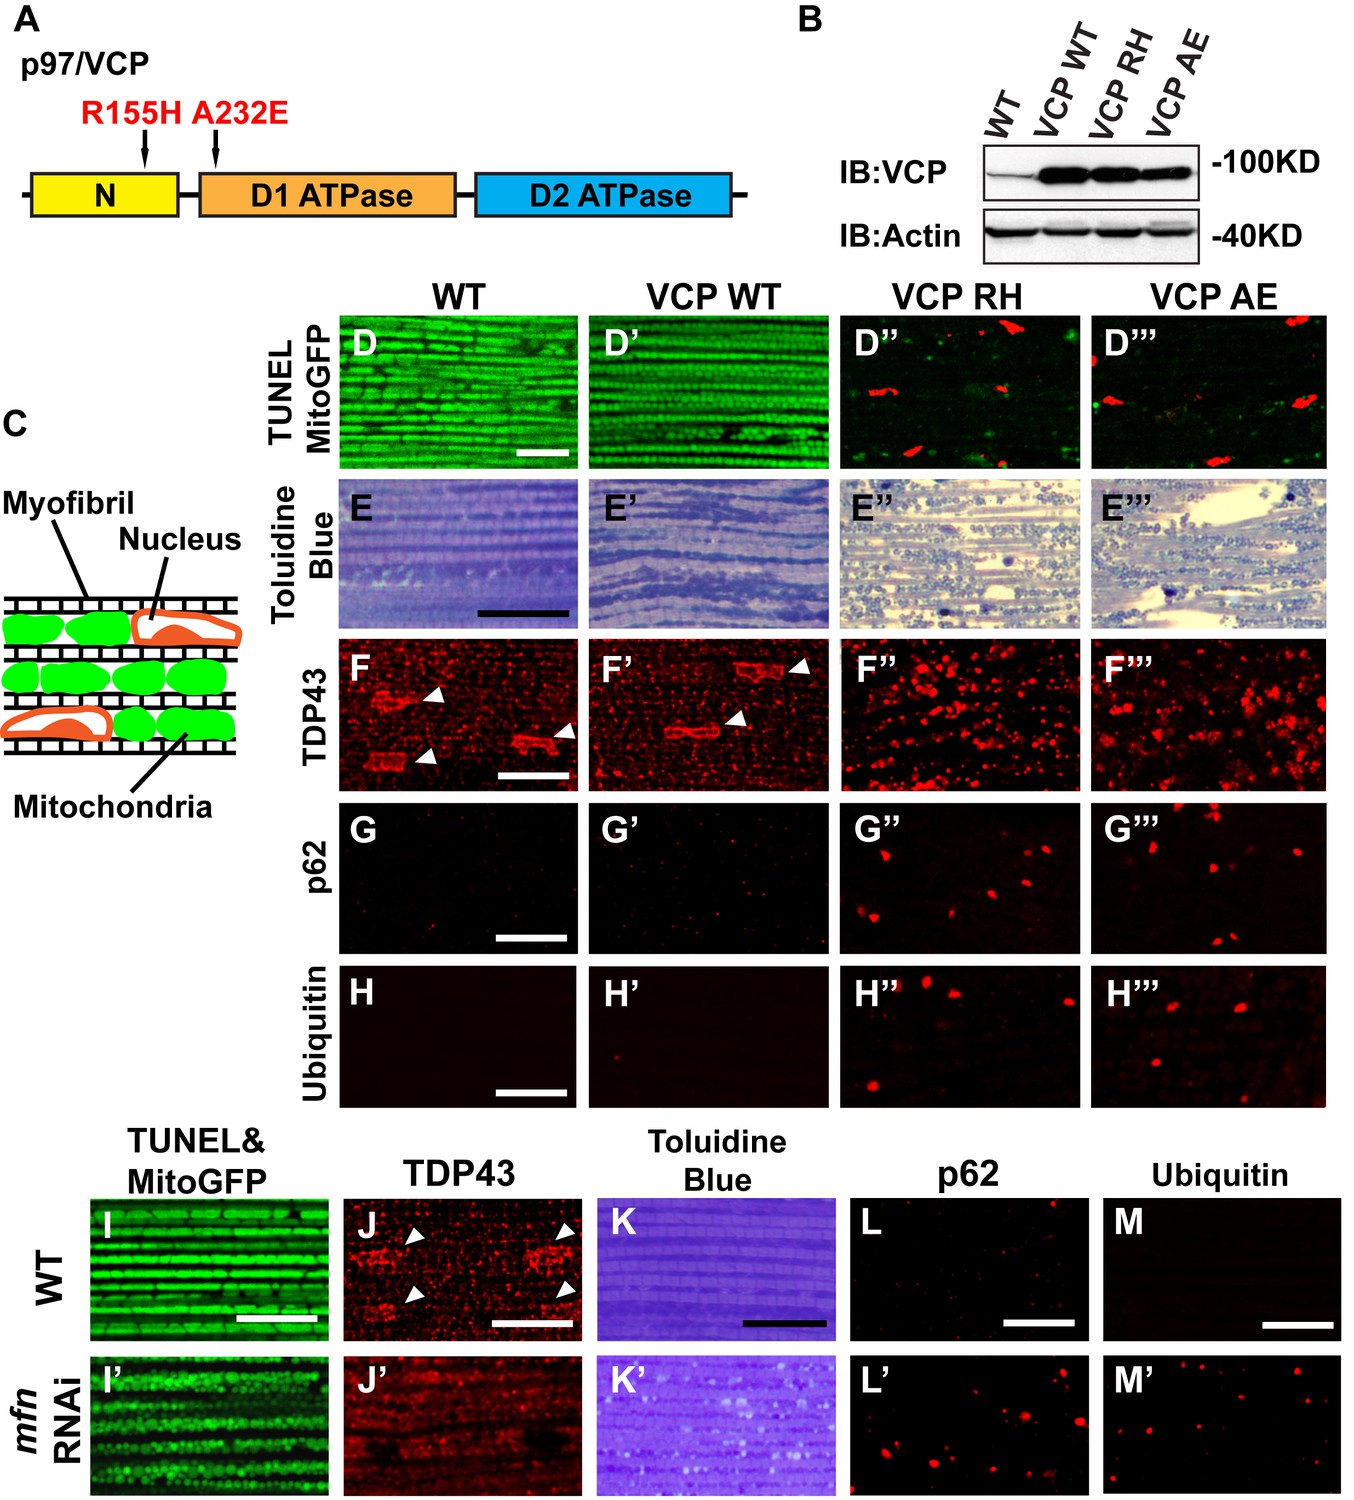
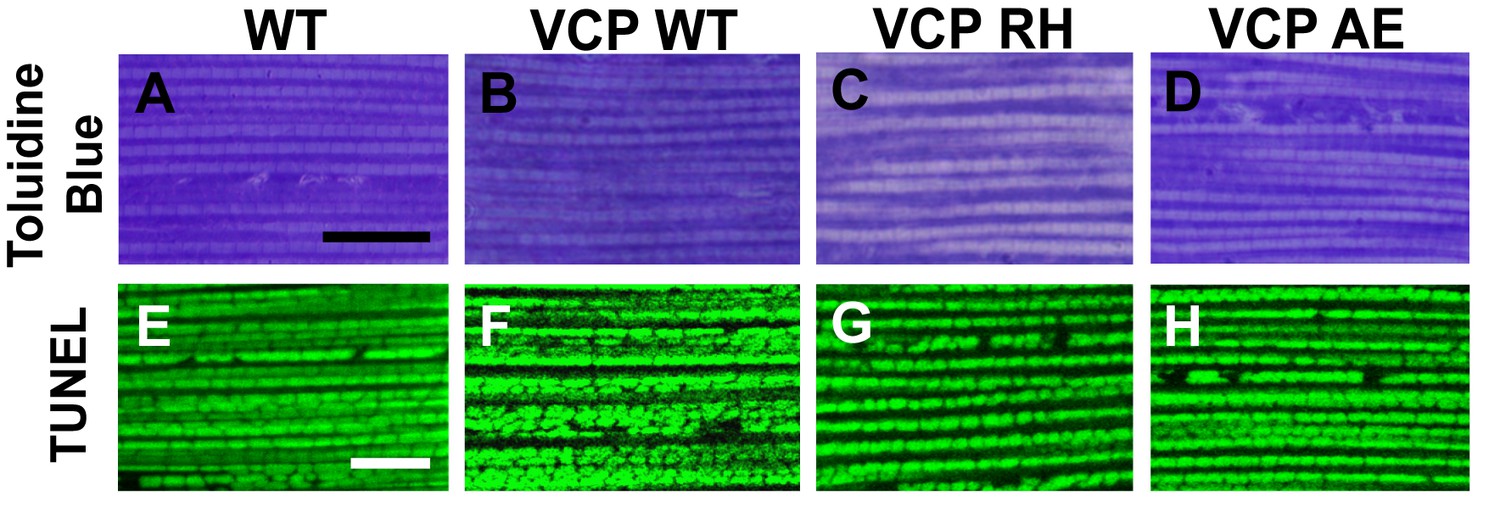
Expression of VCP disease mutants and mfn RNAi knocking down lead to pathology in adult muscle tissue.
(A) Diagram of Human p97/VCP protein domains and two disease mutants, VCP R155H and A232E. Their corresponding Drosophila homologues are VCP R152H and A229E, hereafter referred to as VCP RH and AE. (B) Expression levels of UAS-VCP WT, RH and AE disease mutants expressed under IFM-Gal4 are comparable. (C) Diagram of Drosophila indirect flight muscle structure. Mitochondria (Green) and nuclei (Orange) are densely packed in between myofibrils (which contain large amounts of actin, Black). (D–D''') MitoGFP (Green) and TUNEL staining (Red). 6-day-old WT (IFM-Gal4 control) flies and VCP WT flies have healthy muscles (no TUNEL staining) and are MitoGFP positive (D and D'). 6-day-old VCP RH and AE expressing flies show high levels of TUNEL staining. 97 ± 3.6% and 95.7 ± 5.1% of RH (p=0.03. RH v.s. WT, independent t test) and AE (p=0.015, AE v.s. WT, independent t test) and are MitoGFP negative (D'' and D'''). Scale bar: 10 µm. (E–E''') Toluidine Blue staining of muscle in WT, VCP WT, RH and AE flies. Myofibrils are well aligned with densely packed mitochondria in WT and VCP WT flies 6 days after eclosion (E and E'). In VCP RH and AE flies fiber structure is disrupted, and mitochondria are misaligned and lightly stained, with empty spaces in between (E'' and E'''). Scale bar: 40 µm. (F–F''') Anti-TDP43 antibody staining shows nuclear (white arrowhead) and sarcoplasmic localization of TDP-43 in WT and VCP WT adult fly muscle (F and F'). In VCP RH and AE flies the nuclear signal disappears and the signal is increased in muscle sarcoplasm (F'' and F'''). Scale bar: 5 µm. (G–G''') Anti-Ref(2)P/p62 antibody staining. The signal is weak and uniform in WT and VCP WT flies (G and G'), and punctate in VCP RH and AE flies (G'' and G'''). Scale bar: 5 µm. (H–H''') Anti-P4D1 ubiquitin antibody staining. Signal is weak and uniform in WT and VCP WT flies (H' and H'), and punctate in VCP RH and AE flies (H'' and H'''). Scale bar: 5 µm. (I–M) Effects of mfn RNAi in 8-day-old adult muscle tissue. (I–M) Wildtype muscle visualized with TUNEL and mitoGFP (I), anti-TDP43 (J), Toluidine blue (K), anti-p62 (L), and anti-ubiquitin (M). (I'–M') mfn RNAi muscle visualized with the same probes as above. Scale bar: 30 µm in K-K’, 5 µm in the rest.
Figure 4—figure supplement 1
Muscle isolated from flies expressing VCP disease mutants does not show gross defects at 2 days post eclosion.
(A–D) Toluidine Blue staining of overall muscle morphology shows that VCP RH and AE expression does not result in tissue damage. Scale bar: 40 µm. (E–H) Cell death, as visualized using TUNEL/MitoGFP assay, is absent (No Red Signal) and MitoGFP localization (Green) is normal in VCP RH and AE. Scale bar: 10 µm.
Figure 5 with 3 supplements
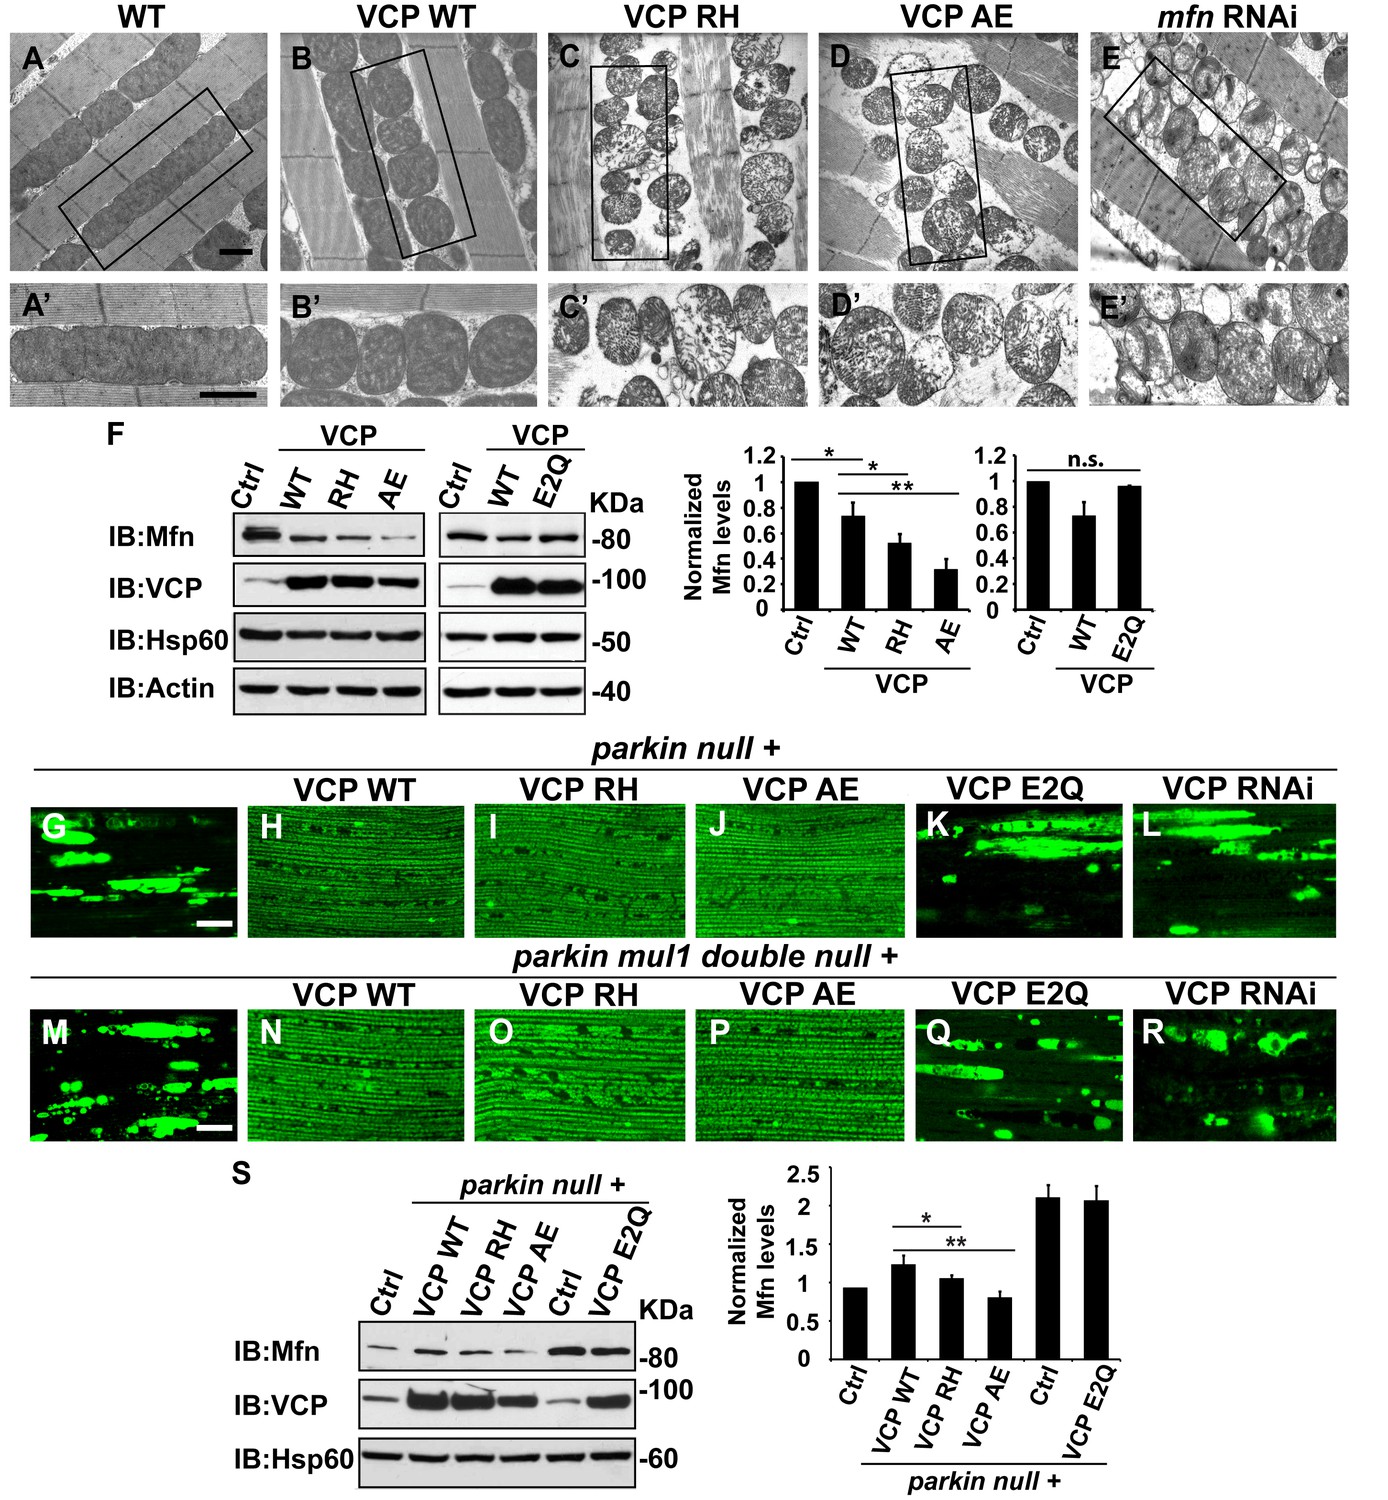
VCP disease mutants are hyperactive in downregulating Mfn protein levels and inhibiting mitochondrial fusion.
(A–B’) Electronic microscopic images of muscle of different genotypes. Compared to WT (IFM-Gal4 control, A and A’), mitochondria are smaller with intact cristea in VCP WT (B and B’) 6 days after eclosion. Scale bar: 1 µm. (C–E’) Expression of VCP RH and AE leads to distorted fiber structure, and small mitochondria with broken or empty cristae. mfn RNAi flies have similar morphological defects in mitochondria (E and E’). Scale bar: 1 µm. (F) Expression of VCP RH and AE lead to a further reduction in Mfn as compared to VCP WT. Mfn levels in VCP WT are reduced to 0.73 ± 0.21 as compared with Gal4 control, which is set as 1 (p=0.037, independent t test, N = 3). Mfn levels in VCP RH and AE are reduced to 0.52 ± 0.14 (p=0.037, independent t test, N = 3) and 0.32 ± 0.16 (p=0.003, independent t test, N = 3) as compared with Gal4 control. Mfn levels are normalized with those of Hsp60, a mitochondria marker. Expression of VCP ATPase defective mutant E2Q (p=0.097, independent t test, N = 3) does not significantly change the Mfn level in fly thoraxes as compared with Gal4 control. n.s.: no statistical significance, p>0.05. Normalized Mfn levels are shown as mean±½SD. (G–L) MitoGFP localization assay shows expression of VCP WT (H), RH (I) and AE (J) potently rescues the mitochondrial defects in parkin mutant (G). Expression of the ATPase defective mutant E2Q (K) or VCP RNAi (L) does not. Scale bar: 20 µm. (M–R) MitoGFP assay shows expression of VCP WT (N), RH (O) and AE (P) potently rescues the mitochondrial defects in parkin mul1 double mutants (M). Expression of VCP E2Q (Q) and VCP RNAi (R) do not. Scale bar: 20 µm. (S) Western blot shows that increased Mfn levels normally present in a parkin null mutant are significantly decreased in VCP WT, RH and AE flies, but not in VCP E2Q flies. Mfn levels are further decreased in a parkin mutant expressing VCP RH (p=0.0228, independent t test, N = 3) or AE (p=0.00565, independent t test, N = 3), as compared to VCP WT. Samples are from 2-day-old fly thoraces. Normalized Mfn levels are shown as mean±½SD. *p<0.05; **p<0.01.
Figure 5—figure supplement 1
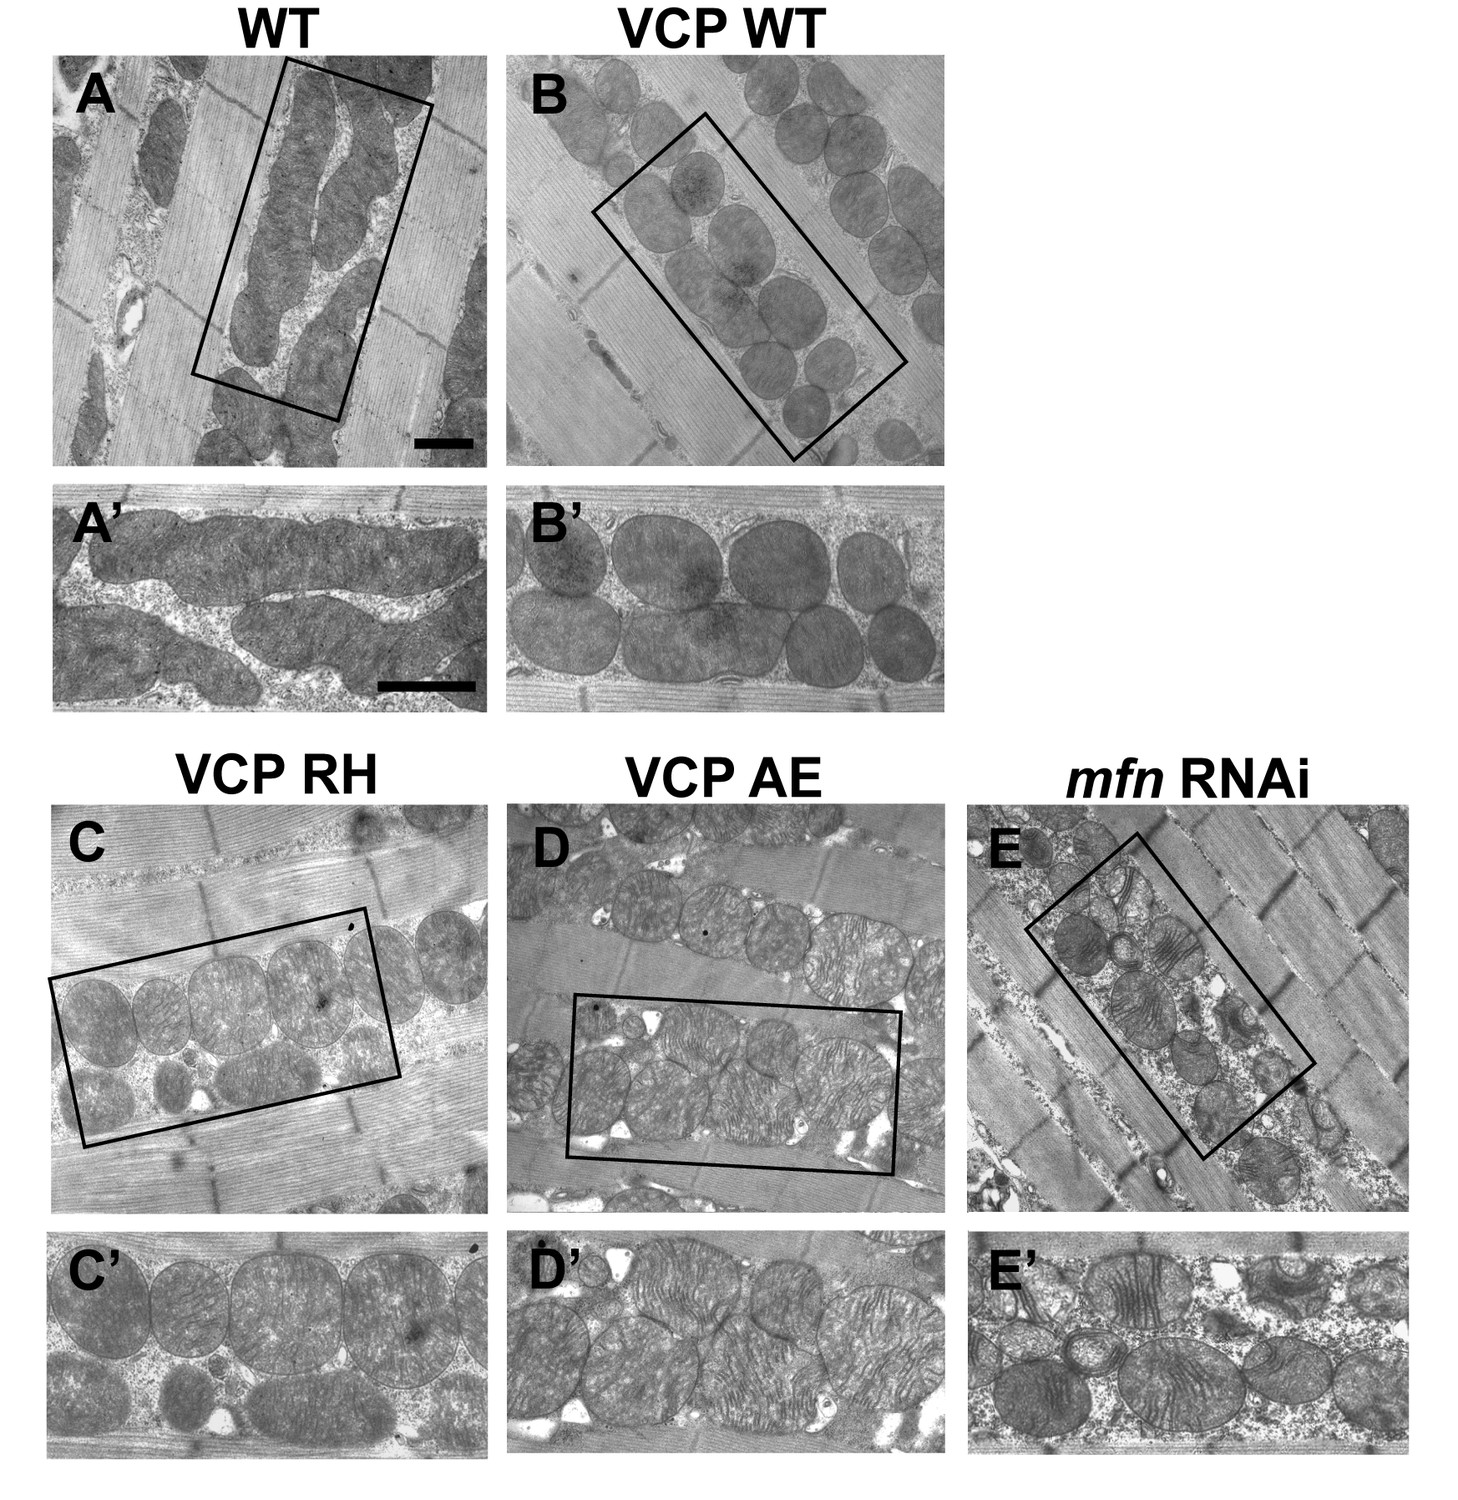
Expression of VCP disease mutants leads to small mitochondria with abnormal cristae, phenotypes similar to mfn RNAi knocking down.
(A–B’) 2 days after eclosion, EM shows that compared to WT (IFM-Gal4 control, A and A’), VCP WT expression results in smaller mitochondrial with intact cristae (B and B’). (C–E’) VCP RH and AE also have smaller and fragmented mitochondria, but the cristae are abnormal (C–D’), similar to the phenotype of mfn RNAi flies (E and E’). Scale bar: 1 µm.
Figure 5—figure supplement 2
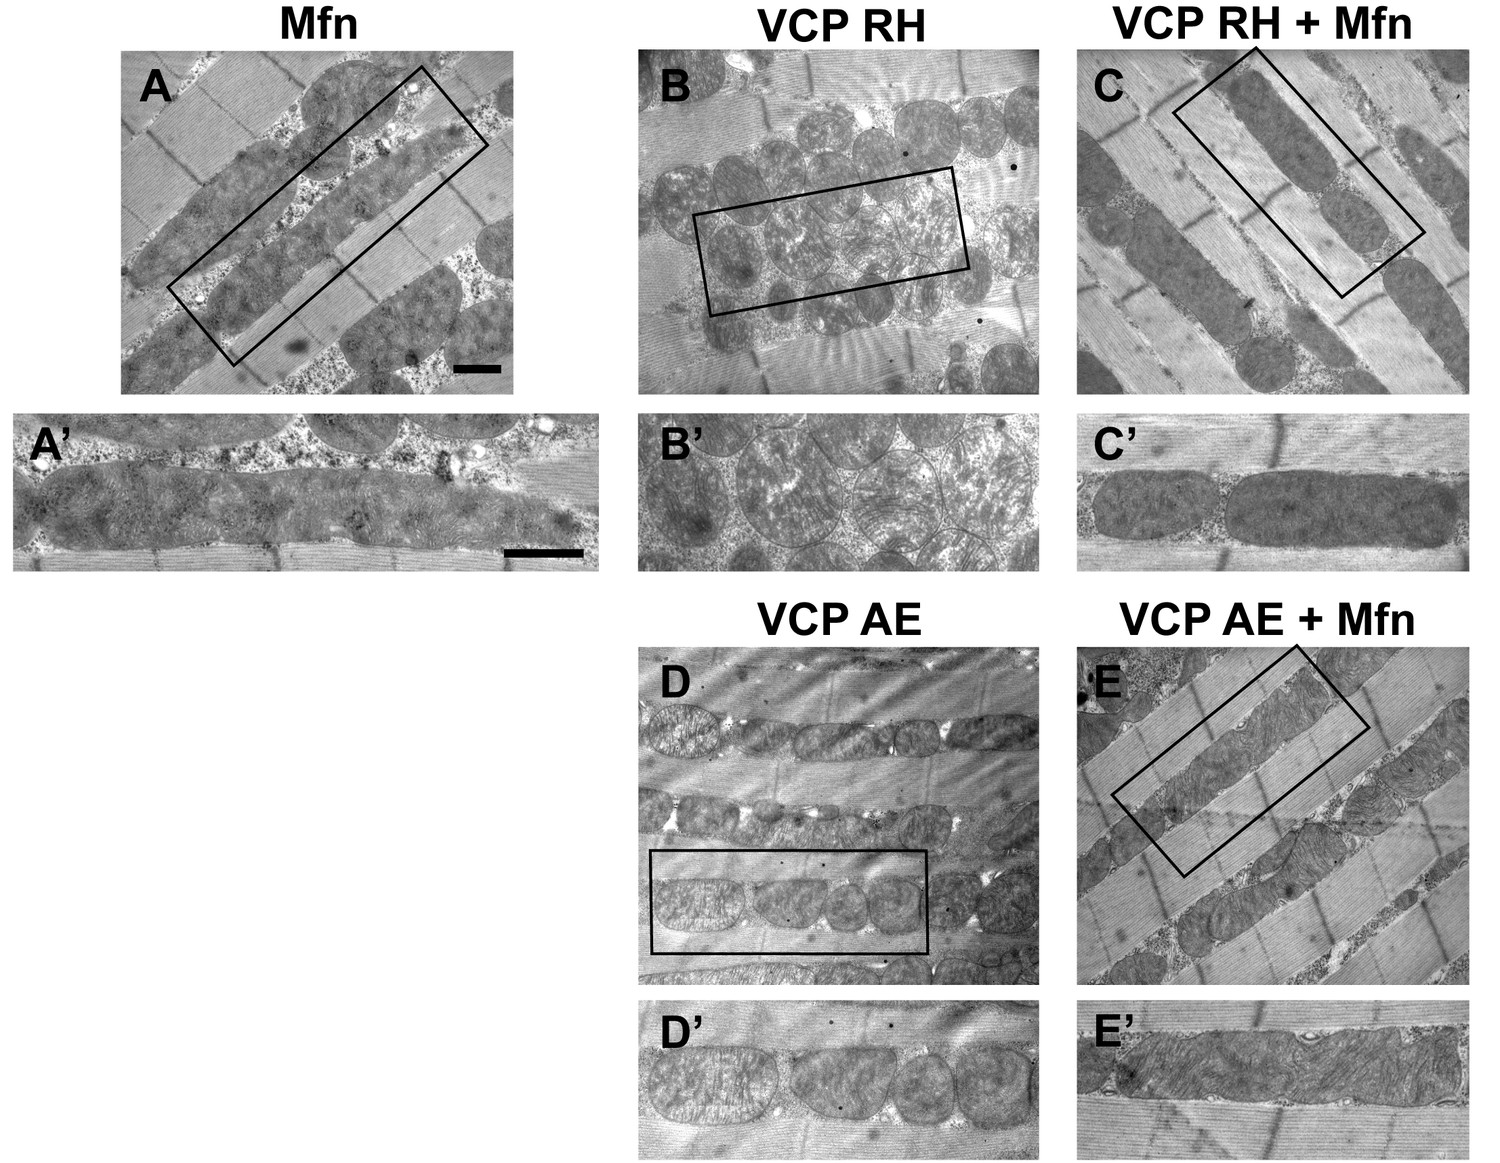
Mfn expression can suppress mitochondrial defects observed in VCP RH and AE flies.
(A) 2 copies of genomic rescue Mfn-HA (pCasper-Mfn-HA) lead to a heterogeneous mitochondrial phenotype in which some mitochondria are elongated. A’ shows a typical elongated mitochondrion. (B–E’) In 2-day-old flies, expression of 2 copies pCasper-Mfn-HA (C, C’ and E, E’) results in suppression of mitochondrial defects (fragmented mitochondria with abnormal cristae) in VCP RH (B and B’) and AE (D and D’) flies. Scale bar: 1 µm.
Figure 5—figure supplement 3
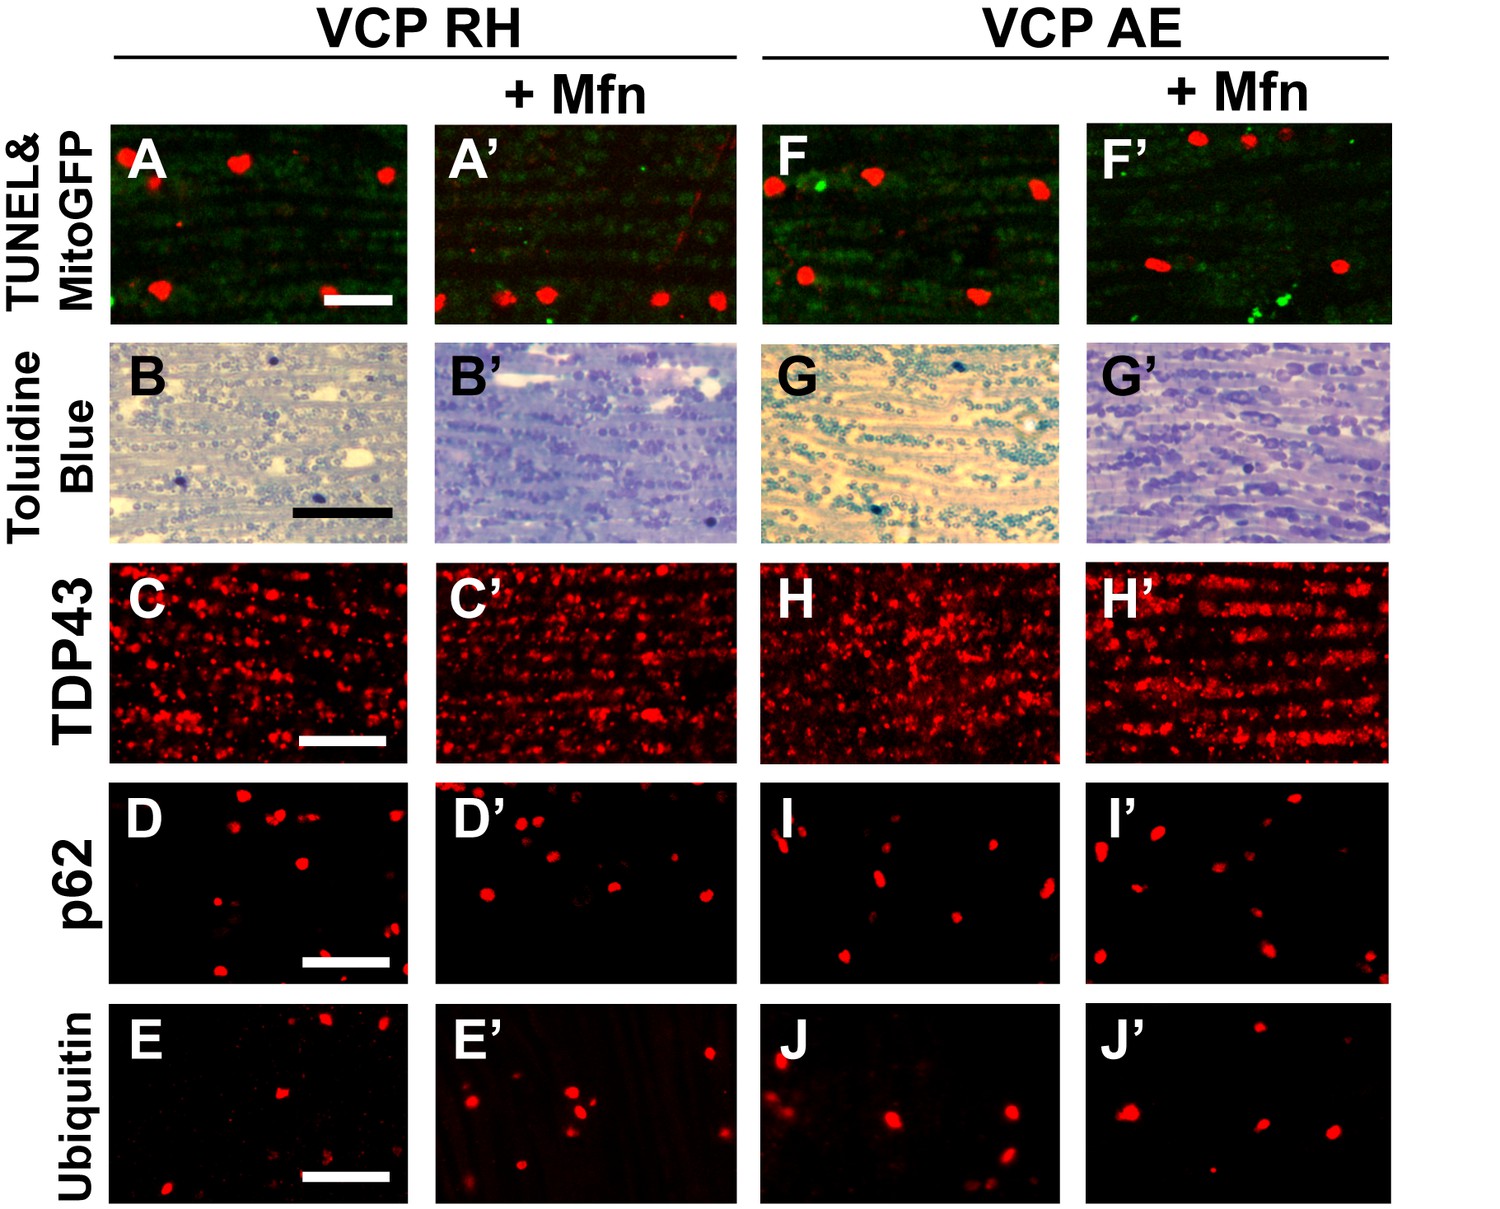
Mfn expression does not significantly rescue the pathology in VCP RH and AE fly muscles.
2 copies of the pCasper-Mfn-HA/eGFP transgene in VCP RH and AE flies at 6 days of age does not significantly alter muscle cell death assayed by TUNEL/MitoGFP (A, A’ and F, F’, Scale bar: 10 µm), overall tissue disintegration (B, B’ and G, G’, Scale bar: 40 µm), TDP43 mislocalization (C, C’ and H, H’ Scale bar: 5 µm), or the frequency of p62 (D, D' and I, I', Scale bar: 5 µm) and ubiquitin positive aggregates (E, E’ and J-J’, Scale bar: 5 µm).
Figure 6
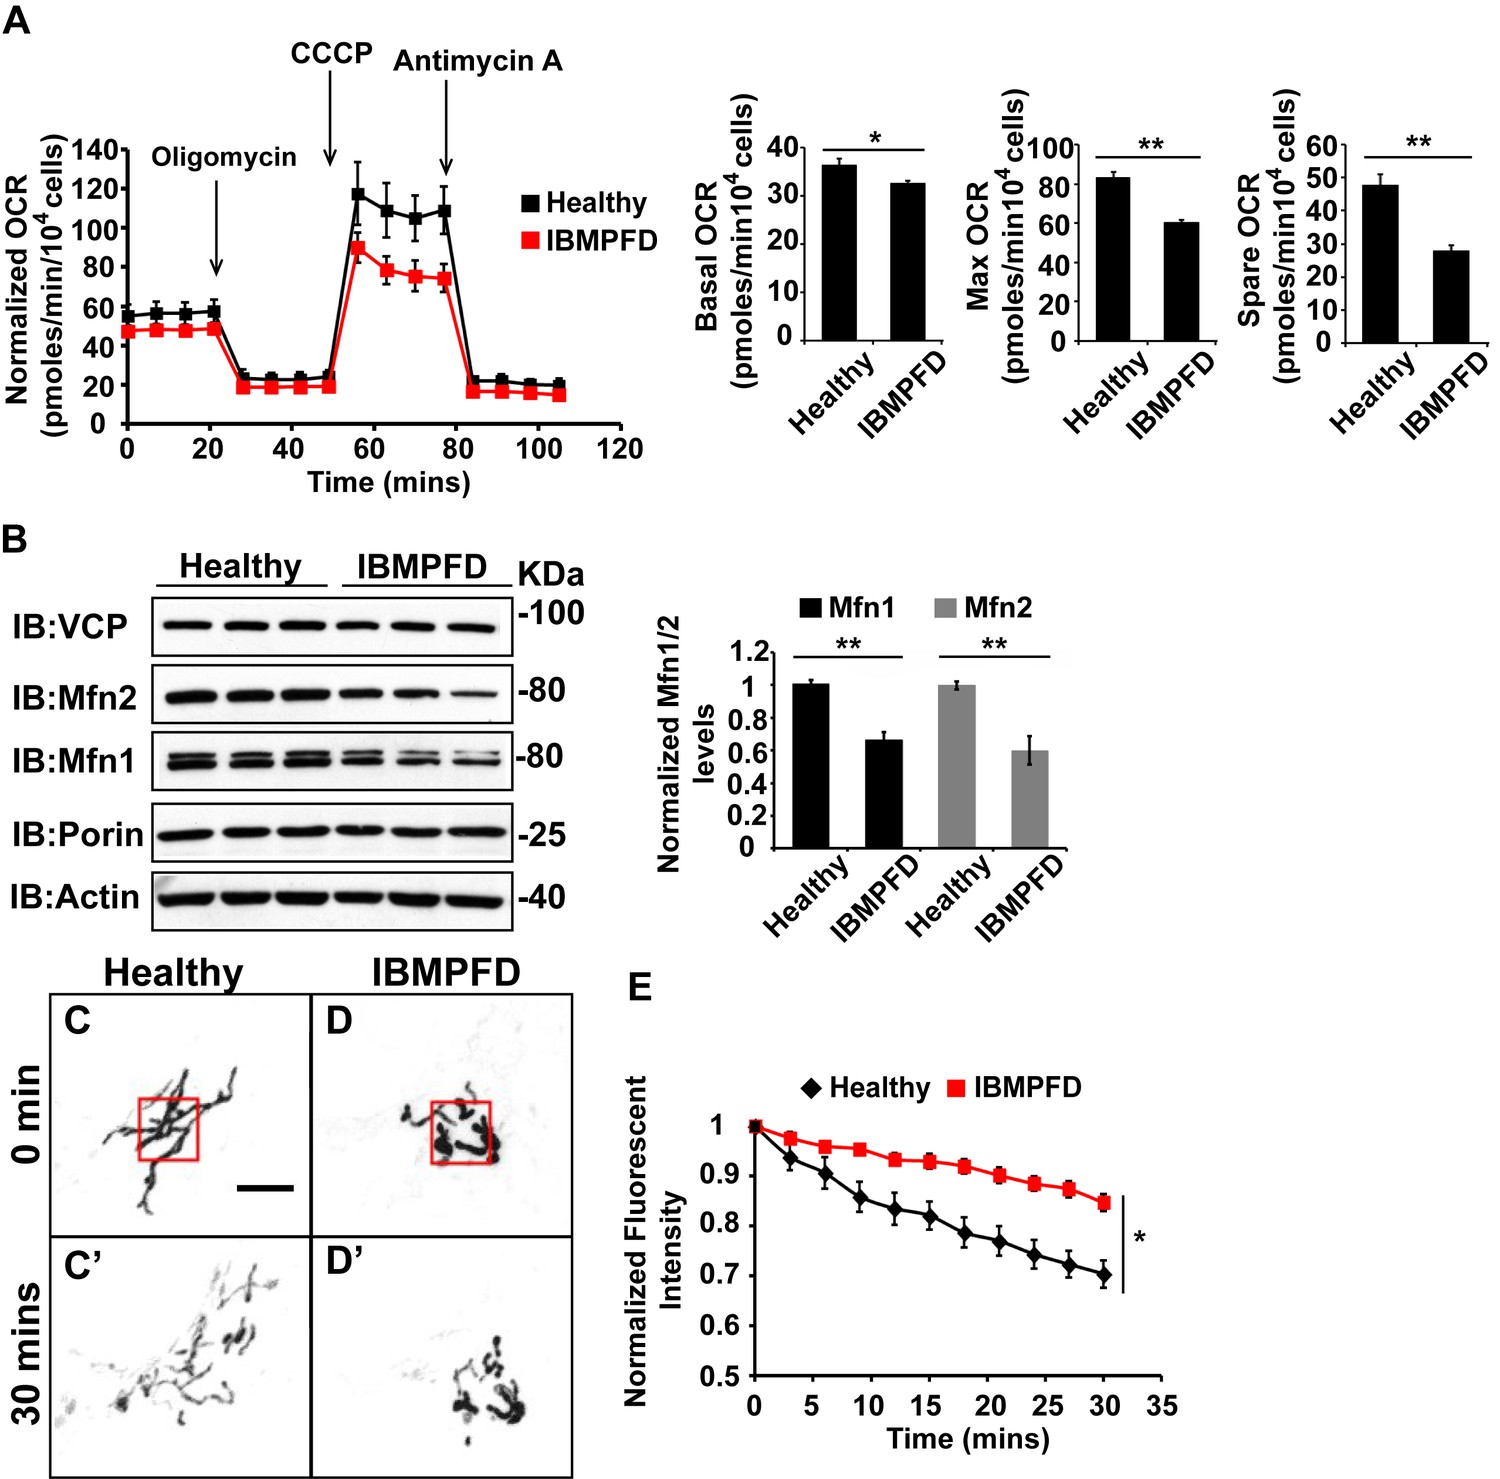
IBMPFD patient cells carrying the VCPR155H/+ mutation have decreased Mfn 1 and Mfn 2 levels and reduced mitochondrial fusion.
(A) Oxygen consumption rates (OCR) in healthy control and IBMPFD patient fibroblasts. Inhibitory drugs were added at the time points indicated. Basal levels of OCR (p=0.026, independent t test, N = 8) and maximum (CCCP-stimulated) OCR (p=3.74E-06, independent t test, N = 8) are both decreased in the IBMPFD patient fibroblasts. The spare OCR is also significantly decreased (p=0.000024, independent t test, N = 8). (B) Mfn 1 and 2 levels are consistently decreased in three independent lysates from the IBMPFD patient fibroblasts when compared to the healthy control. Mfn 1 levels in patient fibroblasts are reduced to 0.66 ± 0.14 of the controls (p=0.001, independent t test, N = 5); Mfn 2 levels are reduced to 0.60 ± 0.14 of the controls (p=0.008, independent t test, N = 5). **p<0.01. Normalized Mfn 1 and 2 levels are shown as mean±½SD. (C–D’) Mitochondrial fusion assay utilizing photoactivatable mitoGFP (PA-GFP) in healthy control and IBMPFD patient fibroblasts. After laser photoactivation of a region (Red hollow square in C and D), cells were tracked for 30 min. (E) PA-GFP signal intensity (throughout the whole cell) is recorded every 3 minutes, and the rate of decrease of average GFP signal is a measure of mitochondrial fusion. Fusion rates are significantly decreased in the IBMPFD patient fibroblasts when compared to the healthy control (C’, D’ and E, independent t test, *p<0.05).
Figure 7 with 1 supplement
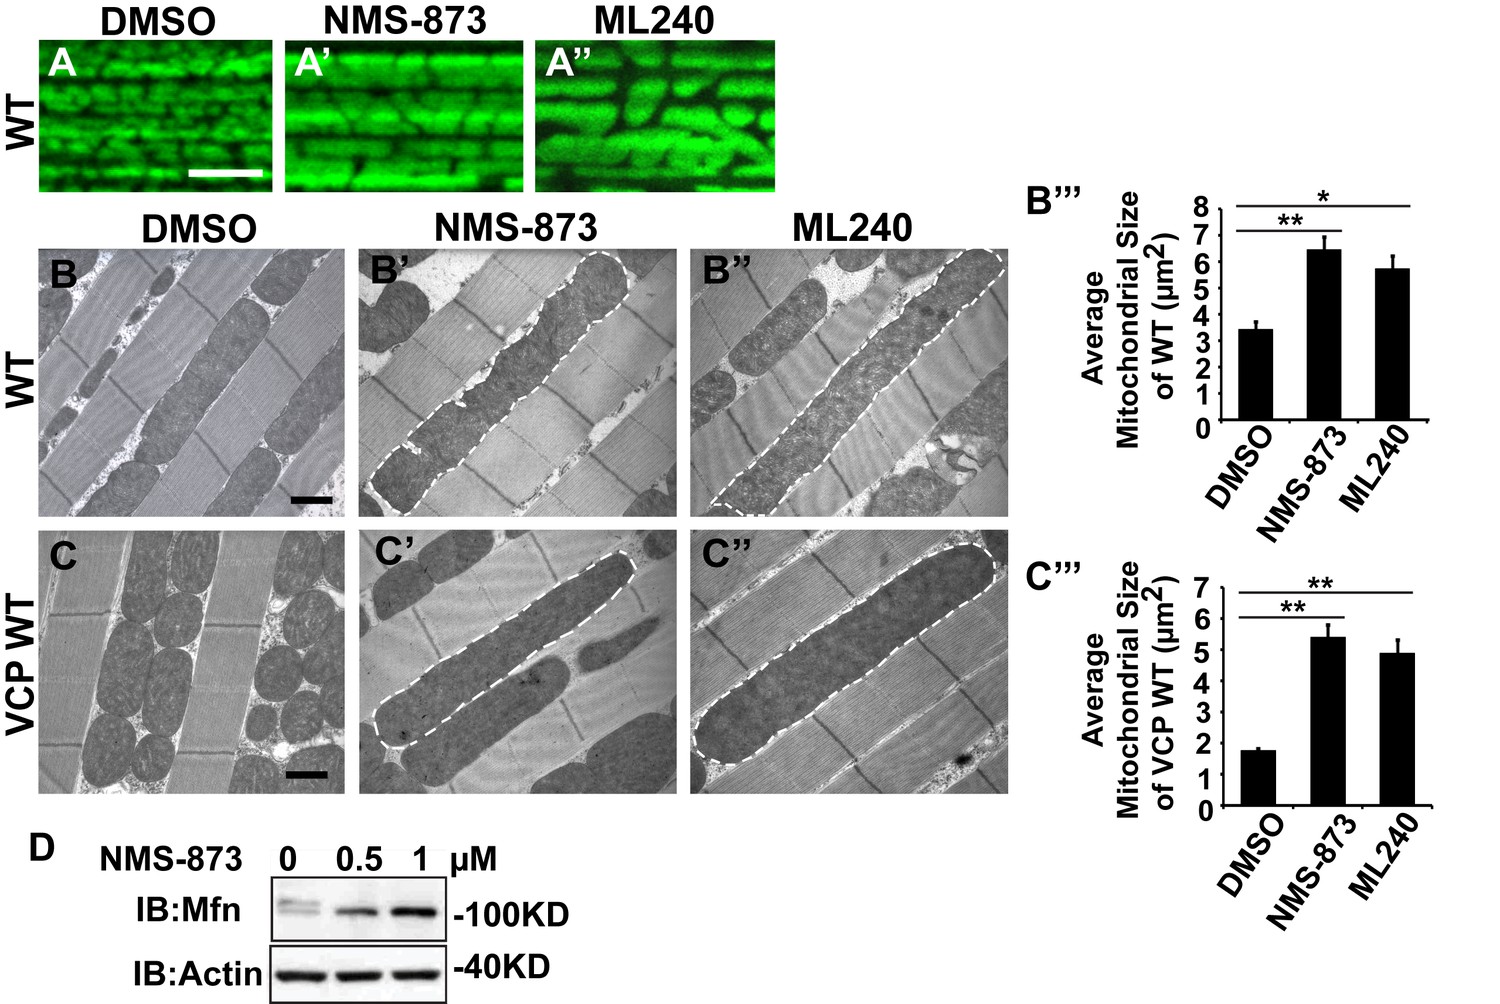
VCP inhibitors promote mitochondrial elongation.
(A–A’’) MitoGFP assay for mitochondrial morphology. Compared to DMSO-fed flies, 10 µM NMS-873 or ML240 feeding results in more fused mitochondria in 2-day-old flies. Scale bar: 5 µm. (B–B’’ and C–C’’) In 6-day-old flies fed with 30 µM NMS-873 (B’) or 30 µM ML240 (B’’), elongated mitochondria (outlined in dashed white lines) are observed in muscle. Mitochondria are small in VCP WT flies (C) as compared with WT (IFM-Gal4 control, B). This phenotype is reversed by 30 µM NMS-873 (C’) or 30 µM ML240 (C’’) feeding and shifted towards a pro-fusion direction, as the mitochondria are also elongated as compared with WT (B). (B’’’ and C’’’) Statistical analysis of mitochondrial size in EM cross sections. In wildtype flies, 30 µM NMS-873 or ML240 feeding results in a mitochondrial size increase to 6.46 ± 0.44 µm2 (p=0.007, independent t test, N = 45) or 5.75 ± 0.48 µm2 (p=0.032, independent t test, N = 39) as compared to the DMSO group (3.45 ± 0.27 µm2, N = 47). VCP WT expression results in small mitochondria (1.78 ± 0.05 µm2, N = 68) as compared with WT (B). Feeding of 30 µM NMS-873 (5.41 ± 0.40 µm2, p=0.000, independent t test, N = 44) or ML240 (4.90 ± 0.42 µm2, p=0.000, independent t test, N = 45) reverses these effects. Mitochondria size is shown as mean±½SEM. (D) pCasper-Mfn-eGFP levels accumulate in a dose dependent manner when treated with NMS-873 at 0.5 µM and 1 µM for 14 hr.
Figure 7—figure supplement 1
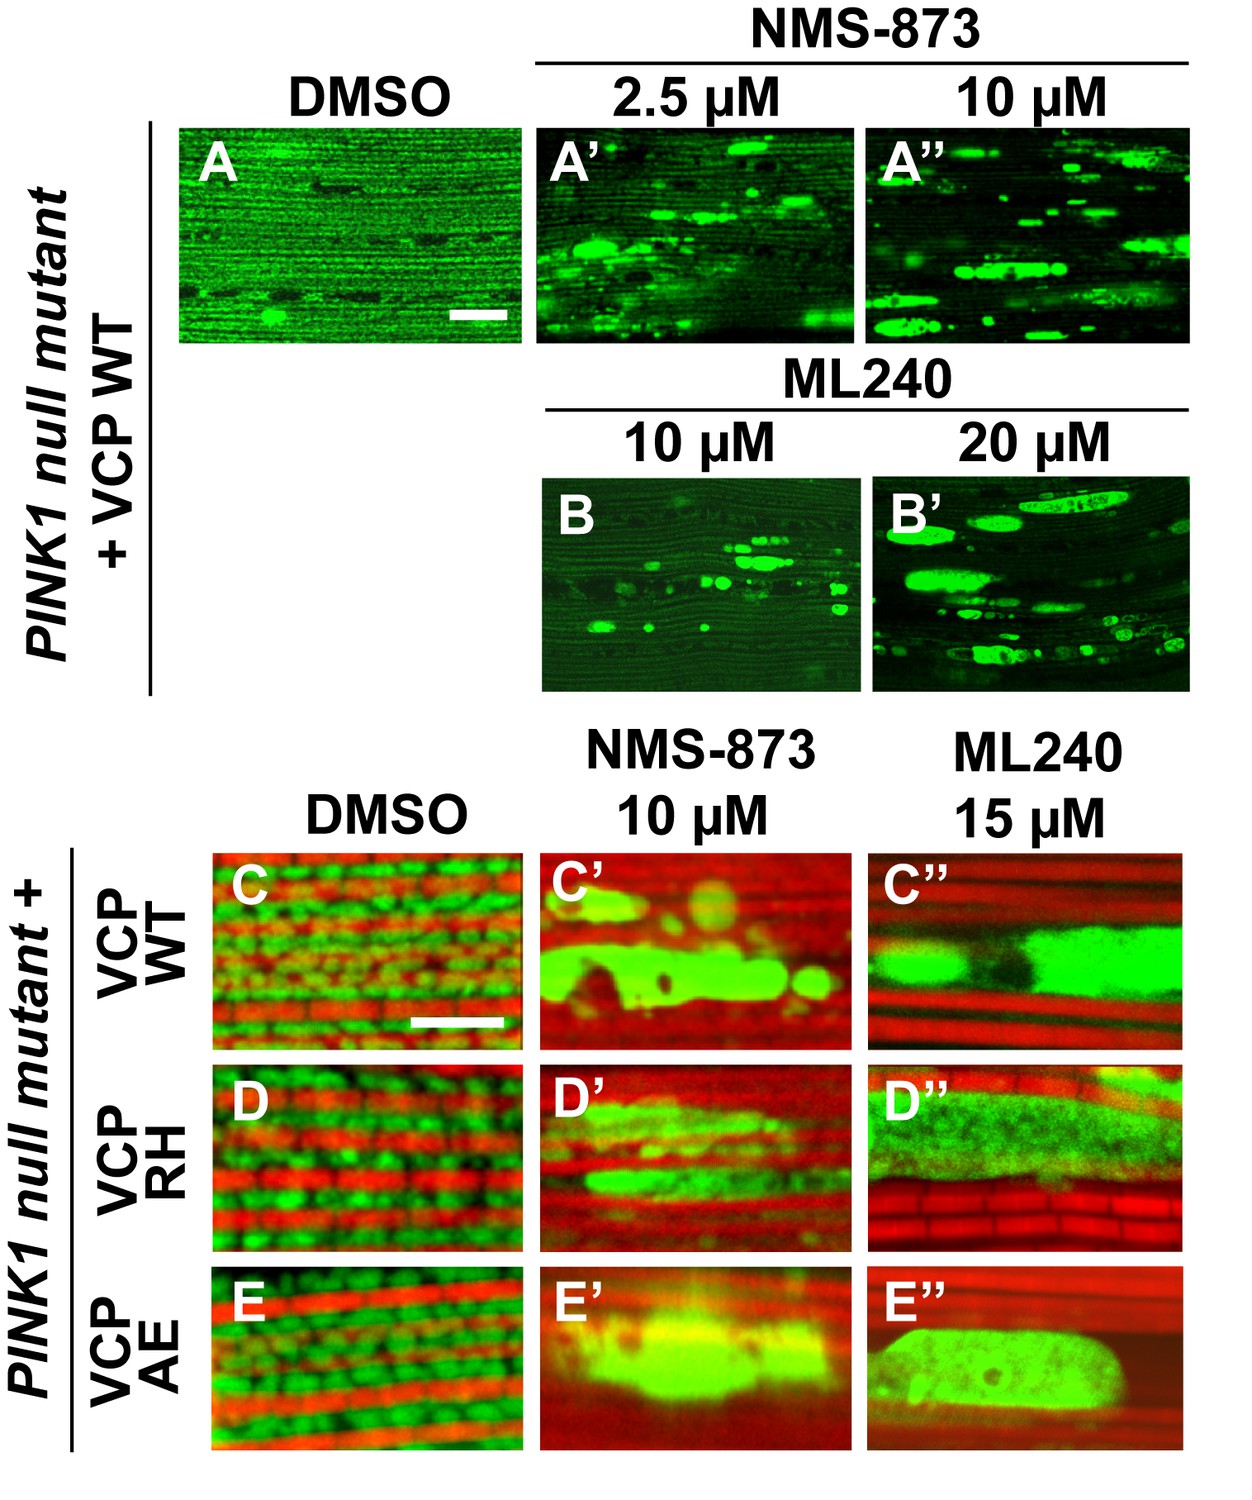
VCP inhibitor treatment blocks VCP WT and disease mutant rescue of mitochondrial defects in a PINK1 mutant.
(A–B’) MitoGFP assay shows that NMS-873 and ML240 feeding blocks the ability of VCP WT to rescue PINK1 mutant mitochondrial phenotypes in a dose-dependent manner. 2.5 µM NMS-873 (A) and 10 µM ML240 (B) partially inhibit the rescue effect. The rescue effect is significantly blocked with 10 µM NMS-873 (A’) and 20 µM ML240 (B’). Scale bar: 20 µm. (C–E’’) 10 µM NMS-873 blocks VCP WT (C’), RH (D’) and AE (E’) rescue of PINK1 mutant mitochondrial phenotypes (C–E) as does feeding with 15 µM ML240 in rescue flies of VCP WT (C’’), RH (D’’) and AE (E’’) in PINK1 mutant. Scale bar: 5 µm.
Figure 8 with 1 supplement
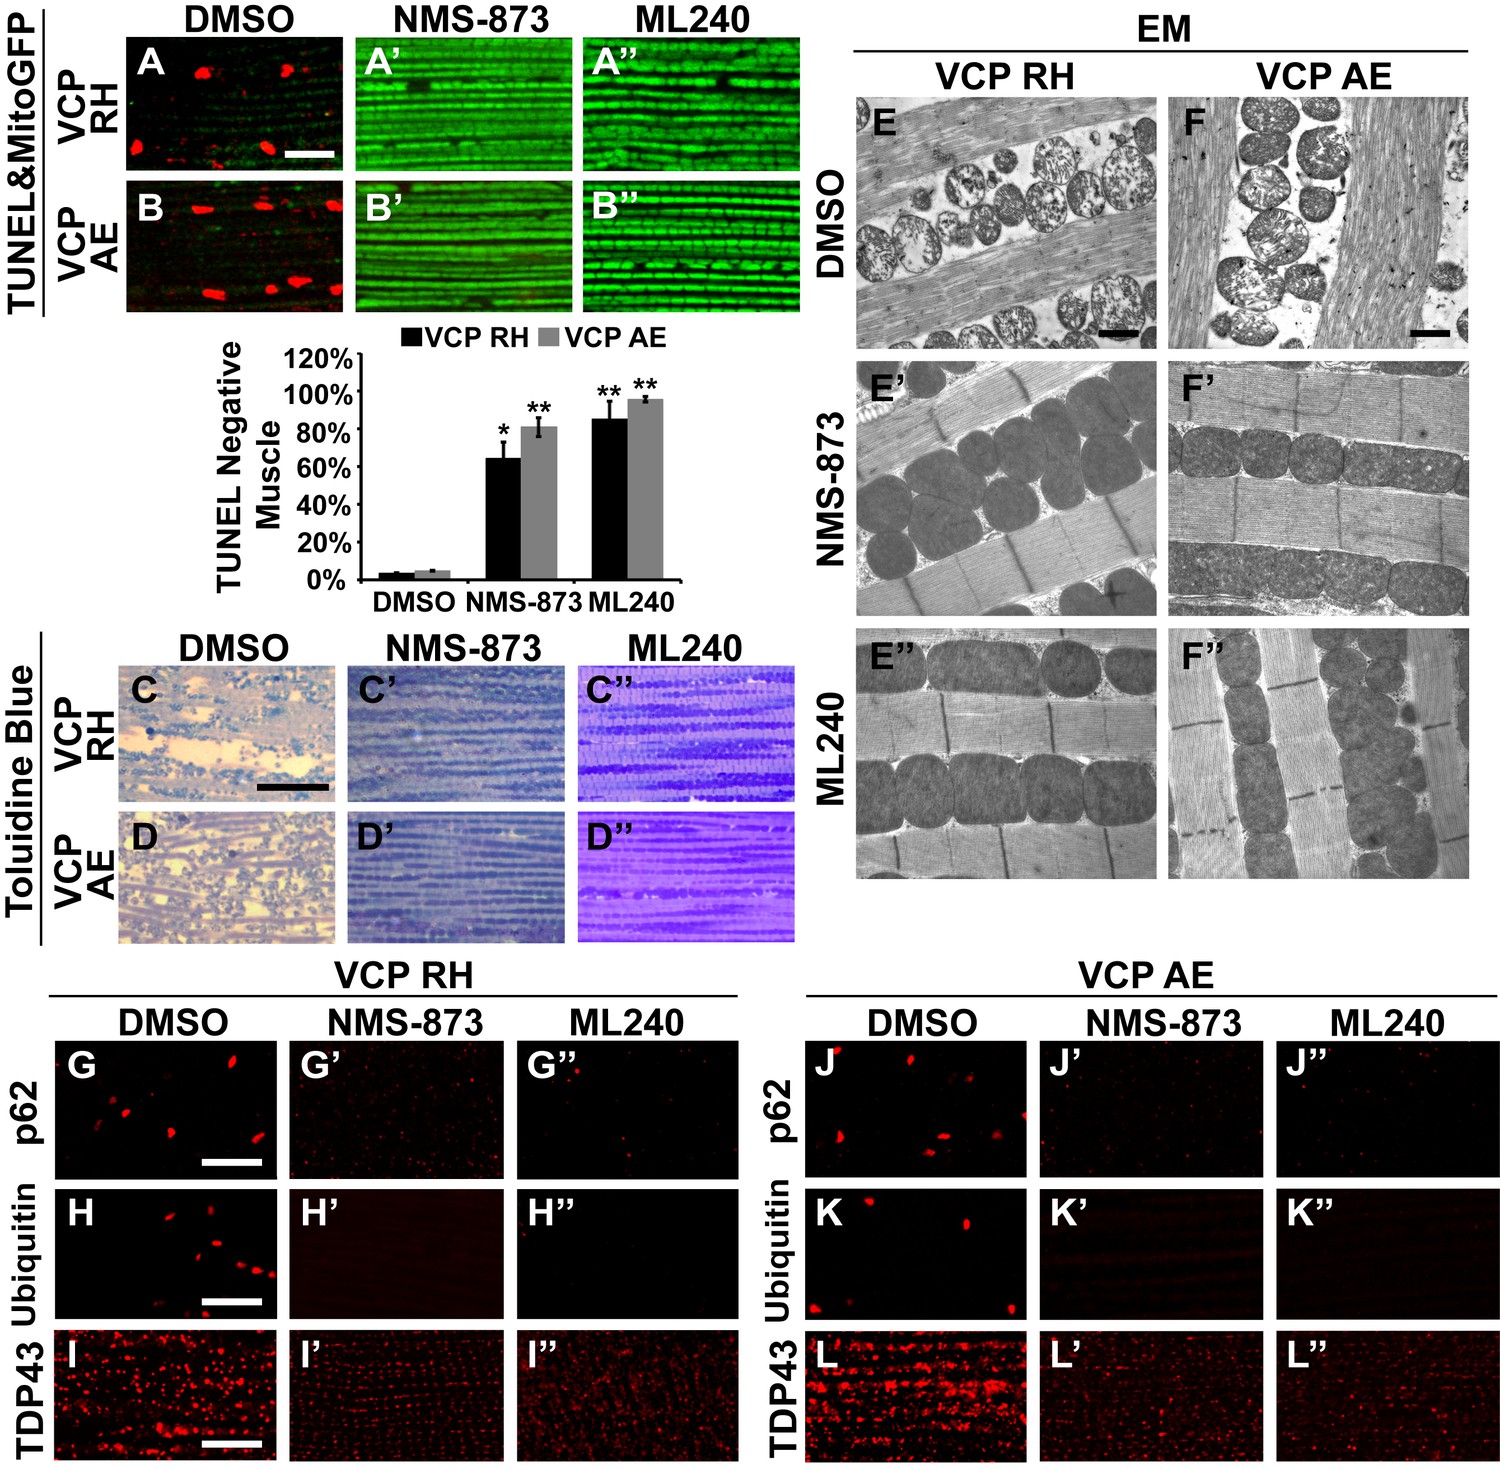
VCP inhibitors block mitochondrial defects, muscle tissue damage and muscle cell death in VCP disease mutant flies.
(A–B’’) Expression of VCP RH and AE leads to muscle cell death by 6 days after eclosion, as visualized through loss of MitoGFP and TUNEL positive signal in nuclei. In the DMSO feeding groups 3.4 ± 0.5% of VCP RH and 4.8 ± 0.6% of VCP AE flies are TUNEL negative. 30 µM NMS-873 or ML240 feeding since first instar larvae till 6 days after eclosion significantly blocks the muscle cell death, with 64.3 ± 17.0% (p=0.017) and 85.1 ± 19.0% (p=0.000) of VCP RH, and 80.9 ± 10.1% (p=0.002) and 95.6 ± 3.1% (p=0.000) of VCP AE muscles TUNEL negative. Data are shown as mean±½SD. Independent t test is used. Three independent rounds are performed, 15–20 flies are used each round. *p<0.05; **p<0.01. Scale bar: 10 µm. (C–D’’) Toluidine Blue staining shows that 30 µM NMS-873 or ML240 feeding significantly rescue the disrupted muscle structure in VCP RH and AE flies. Scale bar: 40 µm. (E–F’’) EM shows that 30 µM NMS-873 or ML240 feeding significantly rescue the broken myofibril structure and small mitochondria with broken cristae phenotypes in VCP RH and AE flies. Scale bar: 1 µm. Note that the mitochondria are still smaller than those from WT flies (Figure 6B). (G–L’’) In 6-day-old flies, 30 µM NMS-873 (G’, H’, J’ and K’) or ML240 (G’’, H’’, J’’ and K’’) treatments result in a significant decrease in Ref(2)P/p62 (G and J) and ubiquitin (H and K) aggregates in VCP RH and AE expressing flies; TDP43 mislocalization (I and L) is partially rescued as the large sarcoplasmic signal decreases, but no nuclear signal is observed (I’, I’’, L’ and L’’). Scale bar: 5 µm.
Figure 8—figure supplement 1
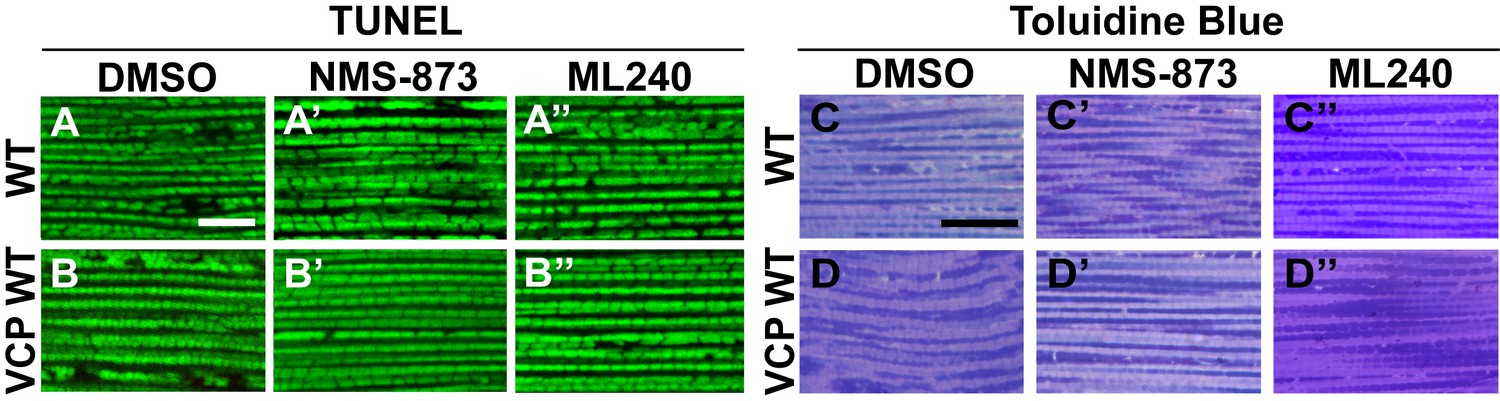
VCP inhibitor feeding does not affect muscle viability and tissue integrity in 6-day-old flies.
(A–B’’) TUNEL/MitoGFP assay shows that feeding of 30 µM NMS-873 or ML240 does not cause muscle cell death in WT (IFM-Gal4 control, A–A’’) and VCP WT flies (B–B’’). Scale bar: 10 µm. (C–D’’) Toluidine Blue assay shows that feeding of 30 µM NMS-873 or ML240 does not disrupt muscle integrity in WT (IFM-Gal4 control, C–C’’) and VCP WT flies (D–D’’). Scale bar: 40 µm.
Figure 9 with 1 supplement
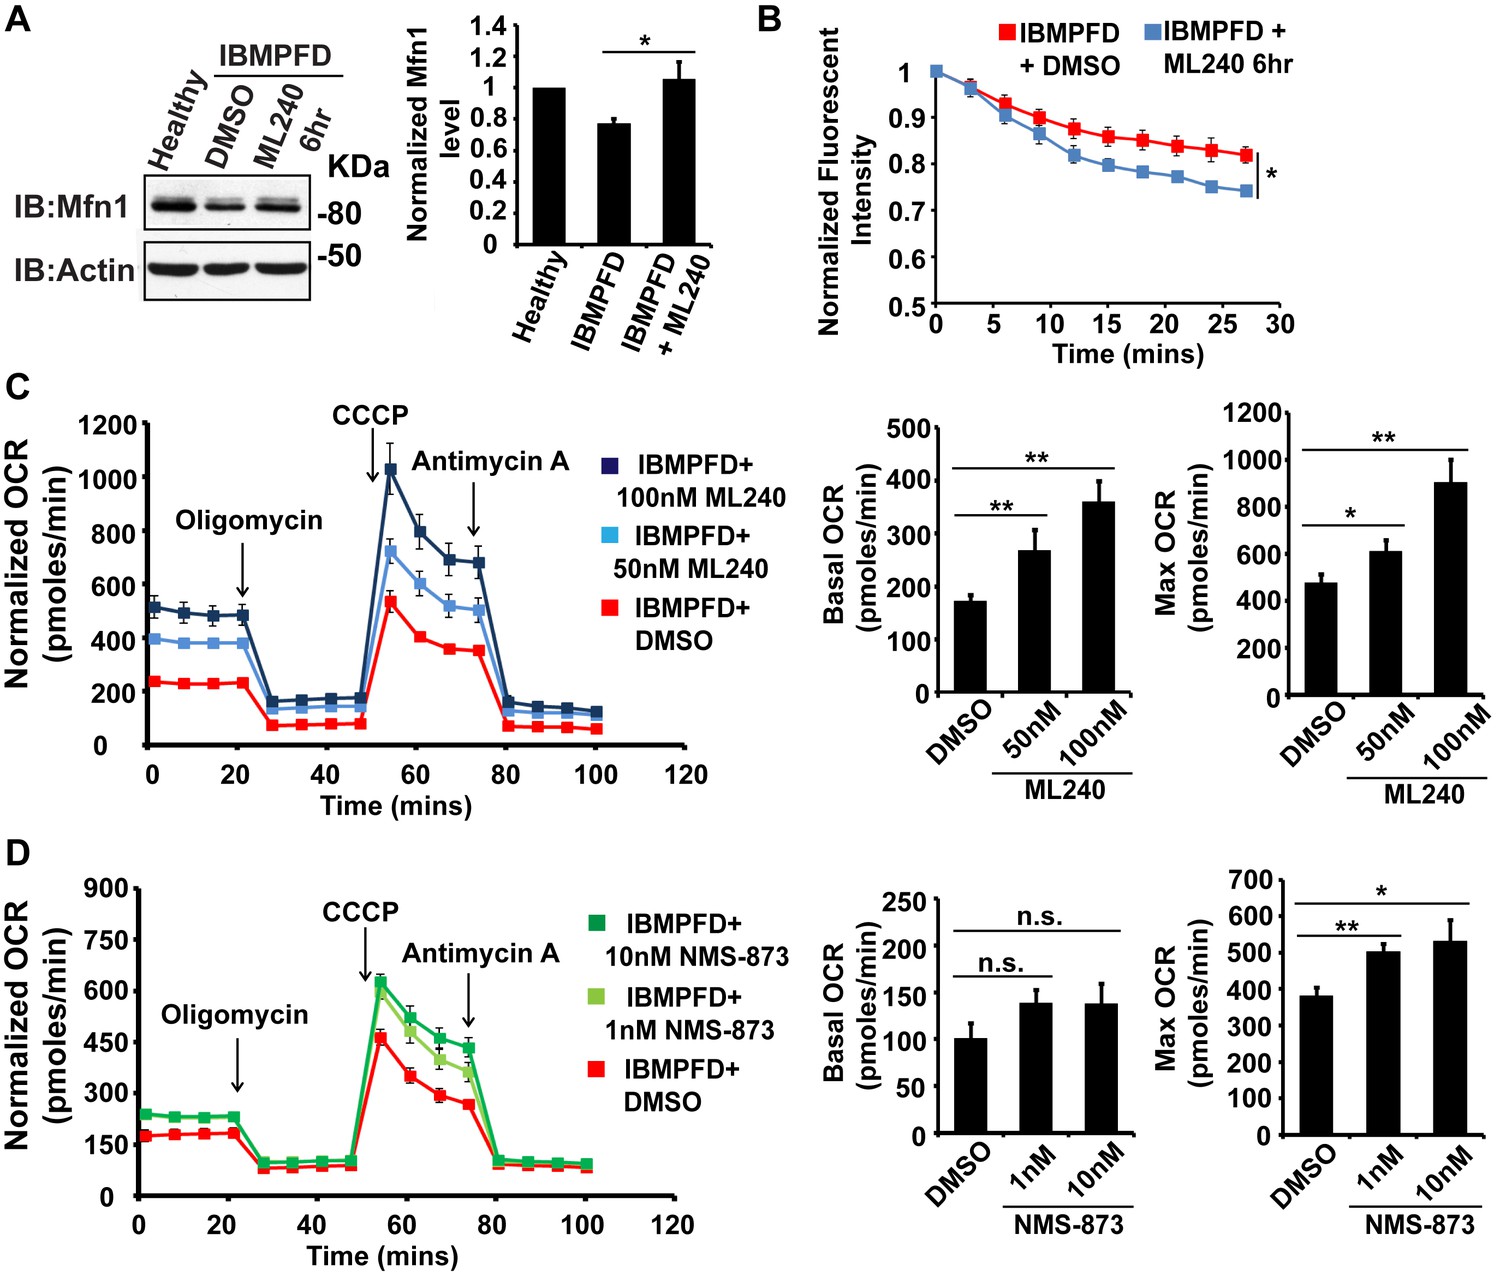
VCP inhibitor treatment significantly suppresses mitochondrial respiratory chain and fusion defects in VCPR155H/+ IBMPFD patient fibroblasts.
(A) After treatment of 250 nM ML240 for 6 hr, Mfn 1 level of VCPR155H/+ IBMPFD patient fibroblasts is elevated from 0.77 ± 0.02 to 1.05 ± 0.11 (p=0.037, independent t test, N = 3), as compared with healthy controls, for which values are set as 1. (B) After treatment with 250 nM ML240 for 6 hr, the mitochondria fusion assay shows that the decreased mitochondrial fusion observed in IBMPFD patient’s fibroblasts is significantly reversed (independent t test, *p<0.05). (C) 50 nM and 100 nM ML240 treatment for 4 days significantly increases basal (p=0.0001, DMSO v.s. 50 nM ML240; p=0.0027, DMSO v.s. 100 nM ML240, Welch's unpaired t test, N = 8) and maximal oxygen consumption rate (p=0.0415, DMSO v.s. 50 nM ML240; p=0.0028, DMSO v.s. 100 nM ML240, Welch’s unpaired t test, N = 8) in the IBMPFD patient fibroblasts harboring VCPR155H/+ mutation. (D) 1 nM and 10 nM NMS-873 treatment for 6 days significantly increases maximal oxygen consumption rate (p=0.0021, DMSO v.s. 1 nM NMS-873; p=0.0395, DMSO v.s. 10 nM NMS-873, N = 8), but not basal oxygen consumption rate (p=0.0994, DMSO v.s. 1 nM NMS-873; p=0.1804, DMSO v.s. 10 nM NMS-873, N = 8). Welch’s unpaired t test is used. *p<0.05, **p<0.01, n.s, no statistical significance.
Figure 9—figure supplement 1
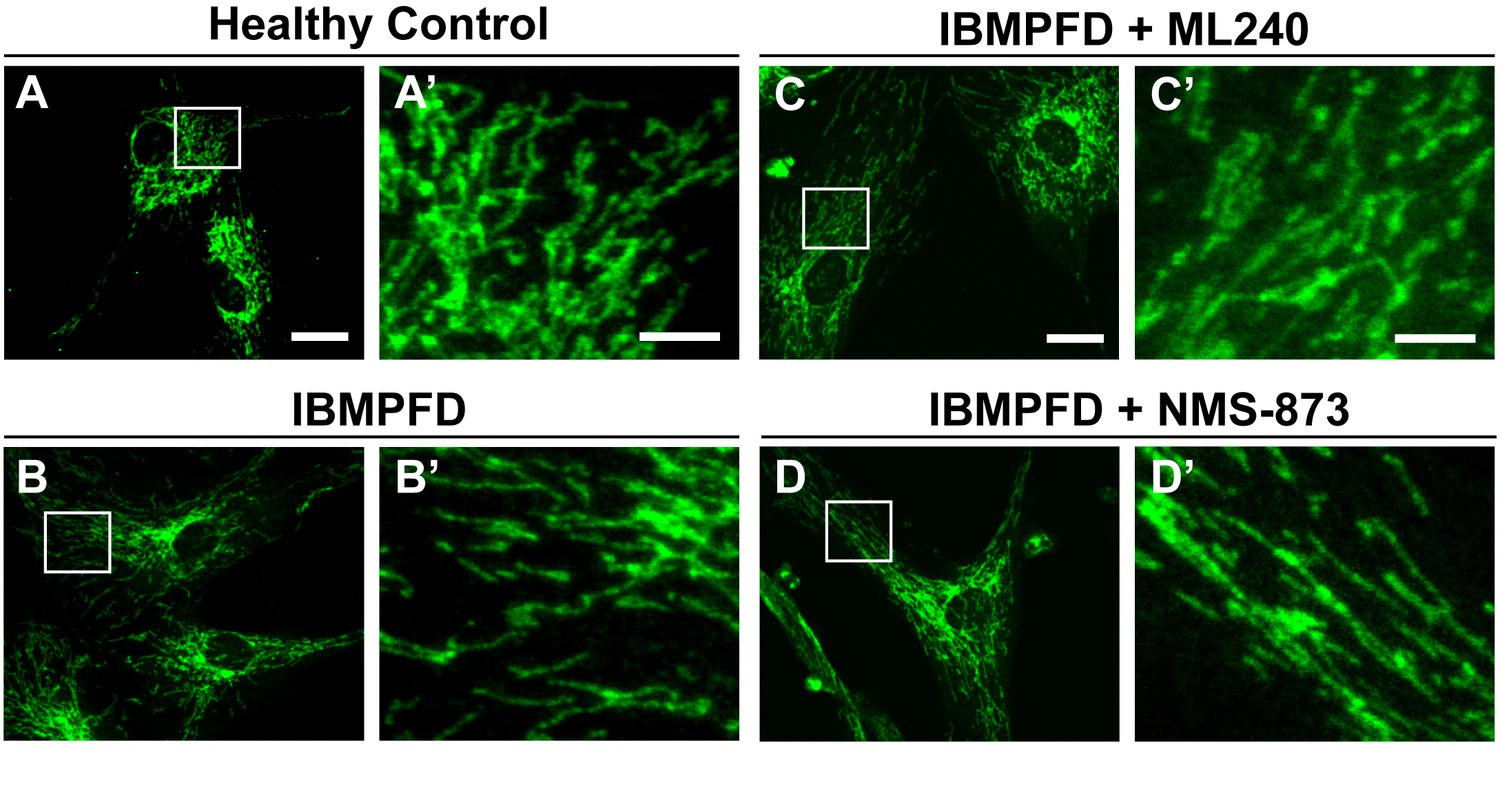
ML240 and NMS-873 treatments do not significantly change the mitochondrial morphology in IBMPFD patients.
In healthy control fibroblasts mitochondria display an elongated and interconnected phenotype (A–A’). IBMPFD patient’s fibroblasts harboring VCPR155H/+ mutation do not show a significant mitochondrial morphological difference (B–B’). Treatment of these cells with 100nM ML240 treatment for 4 days () or 10 nM NMS-873 treatment for 6 days (D–D’) also does not result in a change in mitochondrial morphology (though see Figure 9 for evidence that rates of fusion are altered). Scale bar: (A–D) 20 µm; Scale bar: (A’–D’): 5 µm. Anti-Tom20 antibody is used for mitochondial morphology assay.
Figure 10
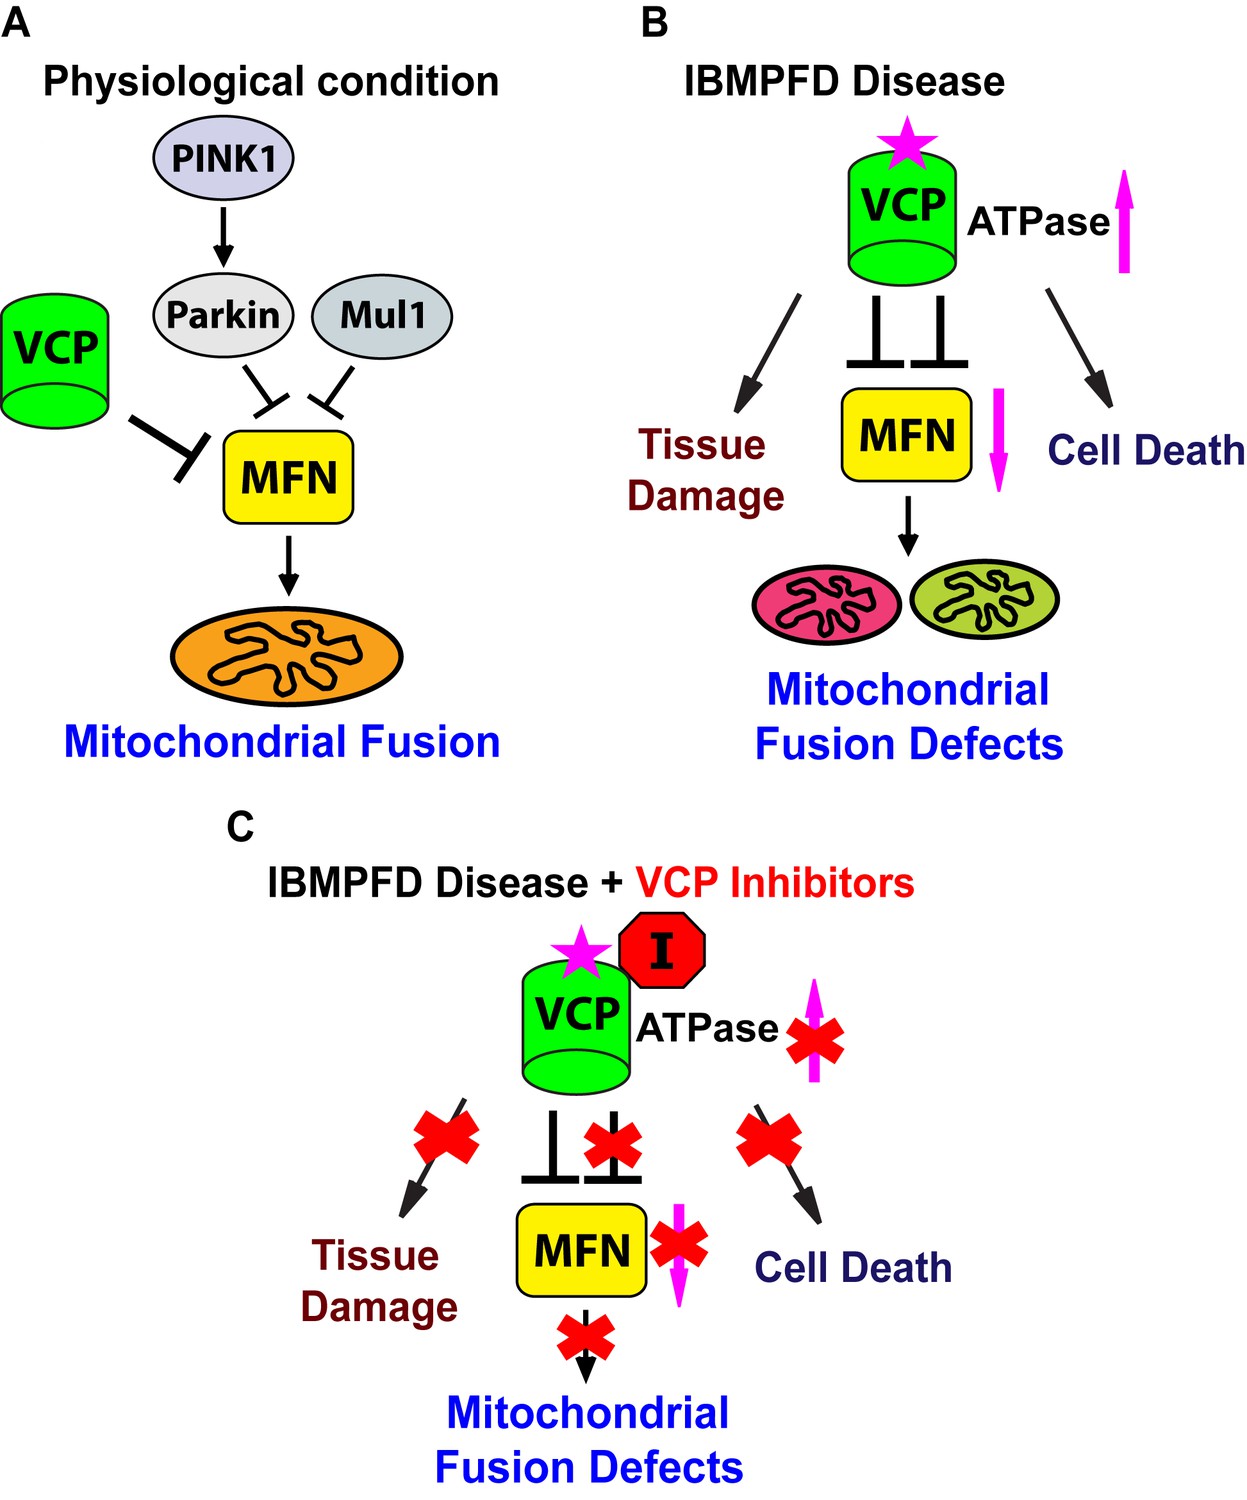
Proposed mechanisms of VCP disease mutants mediated mitochondrial defects and potential therapeutic role of VCP inhibitors.
(A) Under physiological conditions, VCP, independent of PINK1/parkin and Mul1, negatively regulates Mfn protein levels, which are critical for the proper balance of mitochondrial fusion and fission. (B) In the IBMPFD disease, the enhanced ATPase activity of a VCP disease mutant protein results in excessive loss of Mfn and mitochondrial fusion, leading to mitochondrial fusion defects. Besides the mitochondrial defects, VCP disease mutants also generate pathology including adult muscle tissue damage and muscle cell death. (C) VCP ATPase inhibitors robustly relieve the pathology caused by VCP disease mutants associated with hyperactive VCP activity while leaving normal VCP-dependent functions intact.
Download links
A two-part list of links to download the article, or parts of the article, in various formats.
Downloads (link to download the article as PDF)
Open citations (links to open the citations from this article in various online reference manager services)
Cite this article (links to download the citations from this article in formats compatible with various reference manager tools)
Valosin-containing protein (VCP/p97) inhibitors relieve Mitofusin-dependent mitochondrial defects due to VCP disease mutants
eLife 6:e17834.
https://doi.org/10.7554/eLife.17834


