Elimination of paternal mitochondria in mouse embryos occurs through autophagic degradation dependent on PARKIN and MUL1
- California Institute of Technology, United States
Figures
Figure 1 with 1 supplement
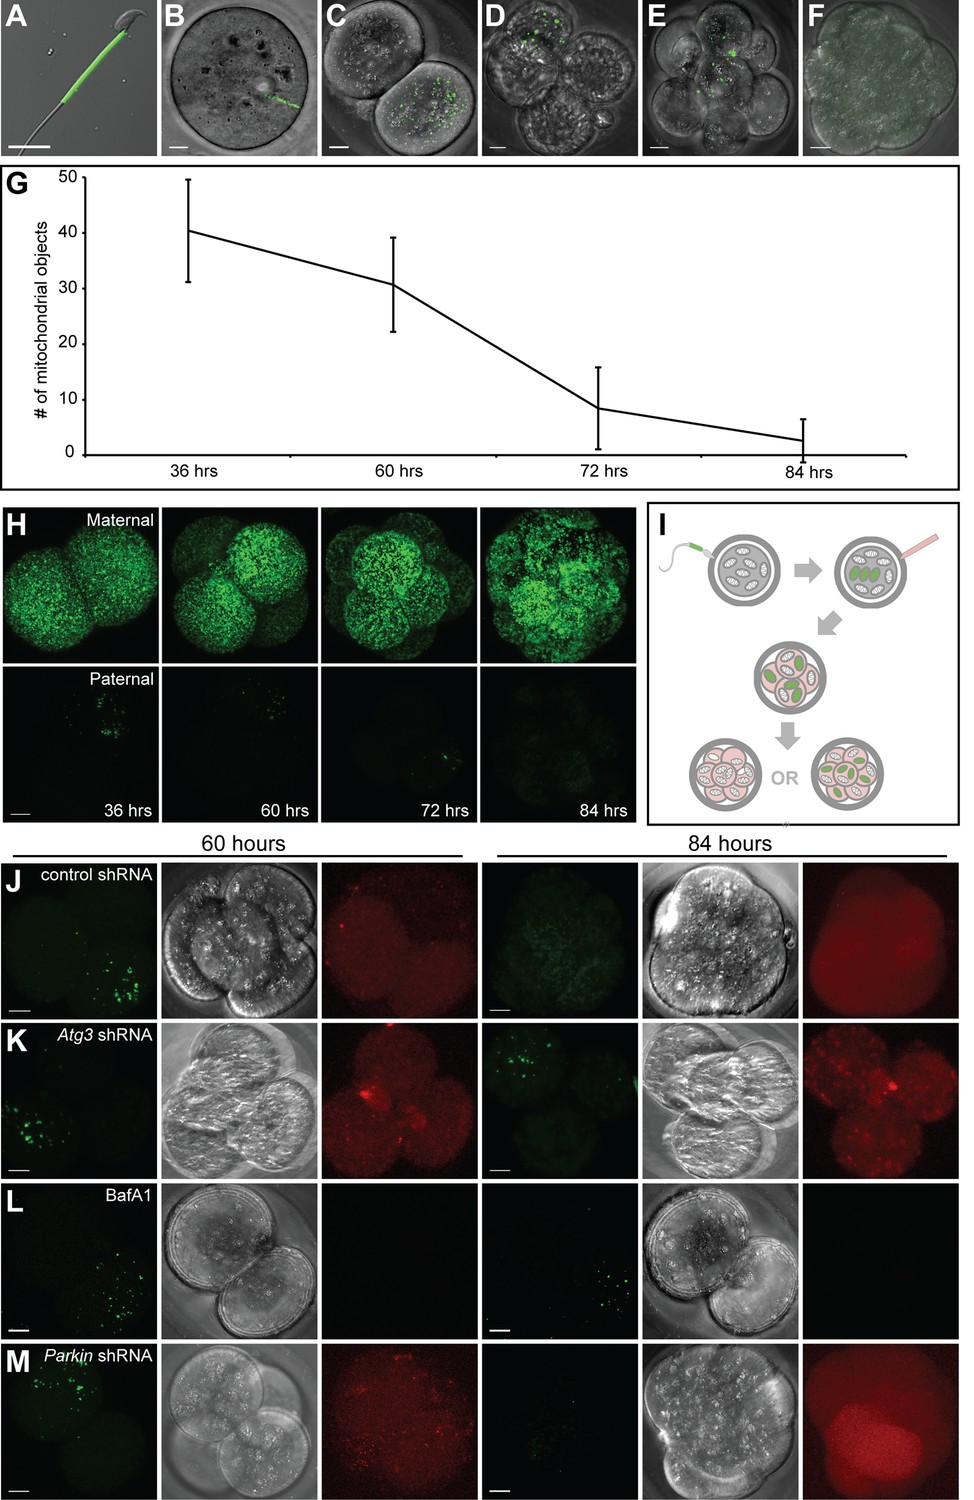
Paternal mitochondria are degraded by 84 hr after fertilization.
(A) Fluorescence of mito-Dendra2 in a live sperm cell isolated from the cauda epididymis of a PhAM mouse. (B–F) Mito-Dendra2 in a 12 hr (B), 36 hr (C), 60 hr (D), 72 hr (E), and 84 hr embryo (F). In (B), note that mito-Dendra2 is circumscribed to a distinct rod-like structure. The mitochondria disperse in later embryos and are lost by 84 hr. (G) Quantification of the mito-Dendra2 signal (see Materials and methods) at 36, 60, 72, and 84 hr after fertilization. Each data point represents the mean of 15 embryos. Error bars indicate SD. (H) Representative maximum intensity projection images of maternal mitochondrial content versus paternal mitochondrial content over time. Embryos with mito-Dendra2-labeled maternal mitochondria were derived from crosses of wildtype males with homozygous PhAM females. Embryos with labeled paternal mitochondria were derived from crosses of wild-type females with homozygous PhAM males, whose sperm donate Dendra2-labeled mitochondria to the embryo upon fertilization. Embryos were cultured in vitro and imaged at the indicated time. Note that paternal Dendra2 signal decreases with time, whereas maternal Dendra2 signal does not. (I) Schematic of paternal mitochondrial elimination assay. Wildtype females are mated with PhAM males. One-cell embryos are microinjected in the perivitelline space with concentrated lentivirus targeting candidate genes. During in vitro culture, embryos are periodically imaged live and monitored for their ability to eliminate paternal mitochondria. (J) Representative images of embryos injected with lentivirus carrying nontargeting shRNA. The left three images show mito-Dendra2, phase-contrast, and mCherry signals at 60 hr; the right three images show the same as 84 hr. (K) Embryos injected with lentivirus carrying Atg3 shRNA. (L) Embryos treated with bafilomycin A1. (M) Embryos injected with lentivirus carrying Parkin shRNA. All scale bars are 10 μm.
Figure 1—figure supplement 1
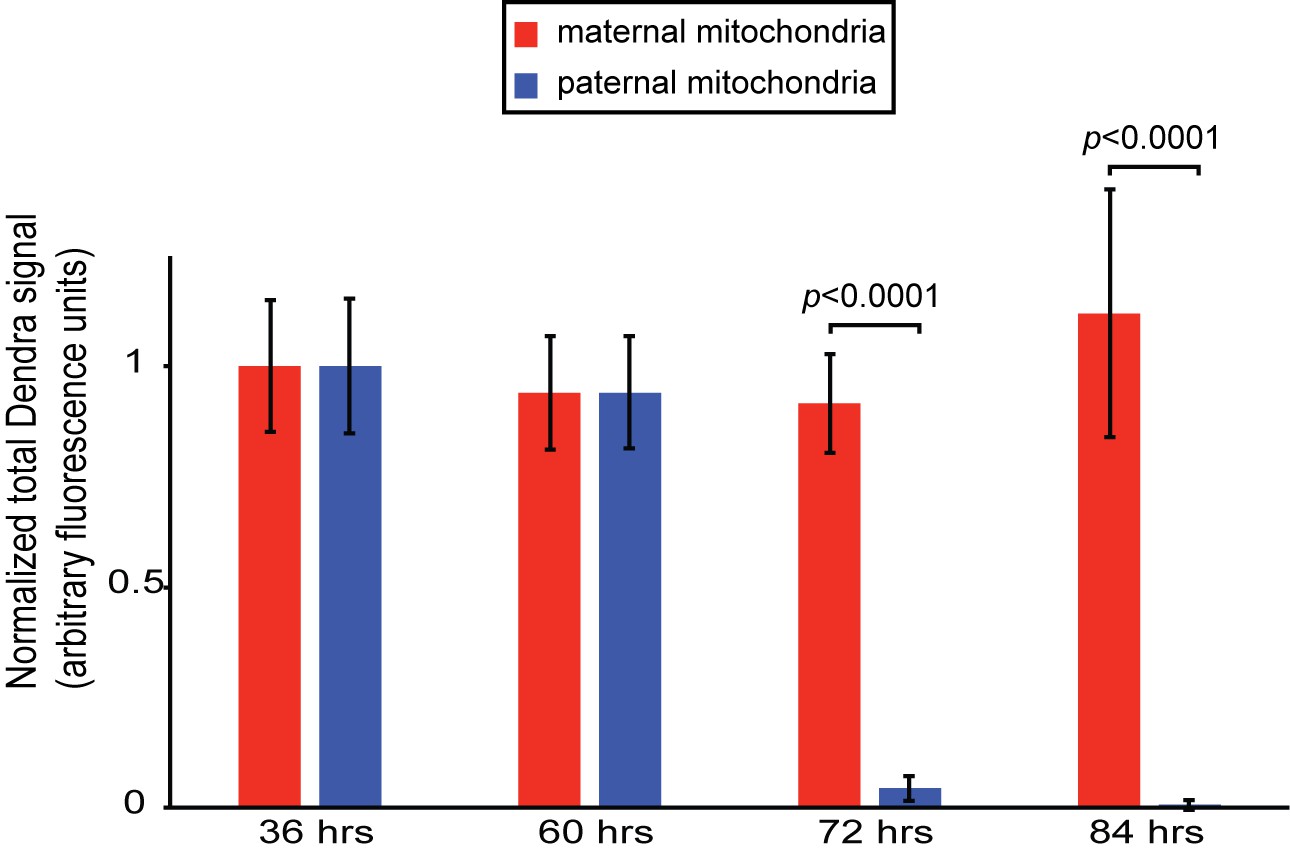
Persistence of maternal versus paternal mitochondria after fertilization.
(A) Quantification of Figure 1H. Embryos were collected from crosses of homozygous mito-Dendra2 females with unlabeled males, or homozygous mito-Dendra2 males with unlabeled females. The total Dendra2 signal in the embryos were quantified from z-stacks captured at 36, 60, 72, and 84 hr after fertilization. Values plotted are normalized to the measurement at 36 hr. Error bars indicate SD. p=3.422E-16 (72 hr), 7.208E-08 (84 hr) (Student’s t-test).
Figure 2
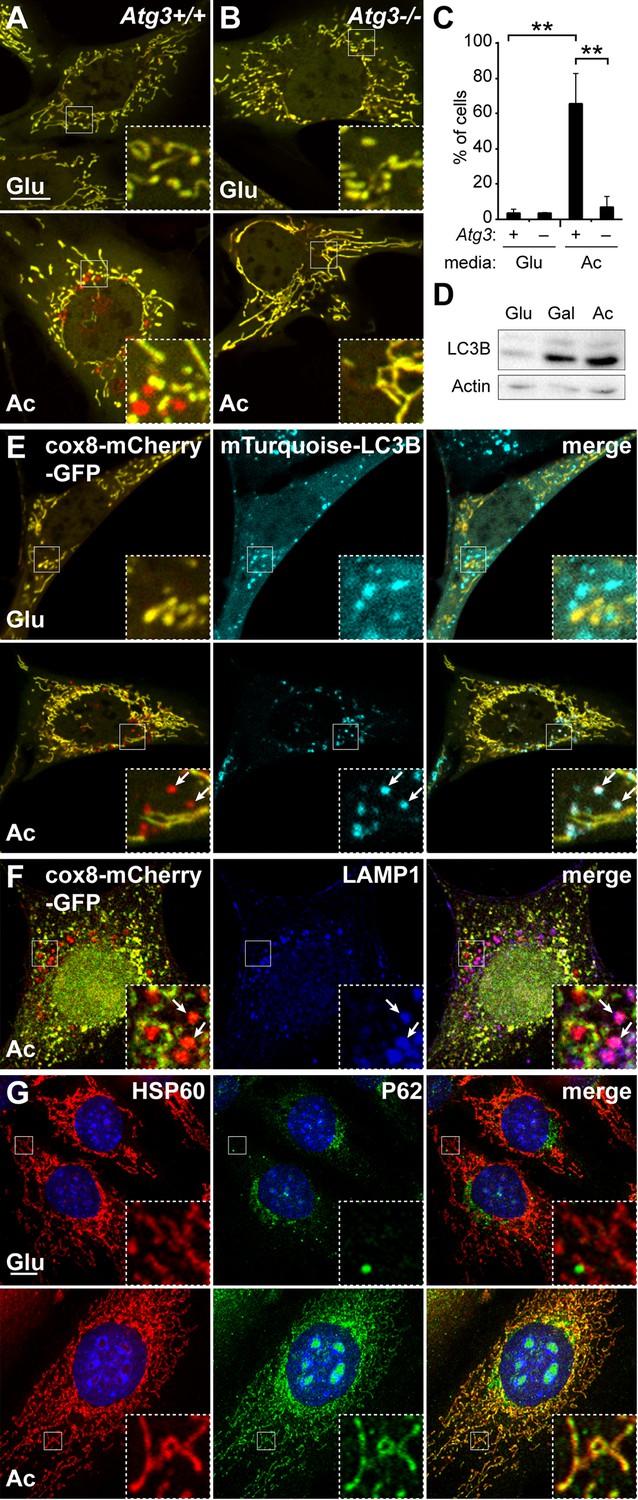
Induction of mitophagy by OXPHOS-inducing medium.
Mitophagy was examined in cells stably expressing Cox8-EGFP-mCherry. Wild-type (A) or Atg3 knockout mouse embryonic fibroblasts (MEFs) (B) were grown in Glucose (Glu) or Acetoacetate (Ac) containing medium for 4 days and then imaged by fluorescence microscopy. The red puncta in the bottom panel of (A) represent mitochondrial contents within acidic compartments. (C) Quantification of red-only puncta. Error bars indicate SD of three biological replicates, **p<0.01, p=0.0039 (Atg3+/+ Glu vs. Ac), p=0.0052 (Atg3+/+ vs. Atg3 -/-) (Student’s t-test). (D) Western blot analysis of LC3B expression in MEFs cultured in the indicated medium. The lower band is lipidated LC3B. Actin is a loading control. (E) Co-localization of LC3B with red puncta. MEFs expressing cox8-EGFP-mCherry and mTurquoise2-LC3B were grown in the indicated medium and imaged by fluorescence microscopy. Arrows indicate examples of mTurquoise2-LC3B co-localization with red mitochondrial puncta. (F) Co-localization of LAMP1 with red puncta. MEFs stably expressing cox8-EGFP-mCherry were grown in acetoacetate-containing medium and immunostained with anti-Lamp1 antibody (blue). Arrows indicate red mitochondrial puncta that co-localized with LAMP1. Scale bar in (A) is 10 µm and applies to (A–F). (G) Co-localization of p62 with mitochondria. MEFs were grown in the indicated medium and immunostained with anti-p62 (green) and anti-HSP60 (red, mitochondrial marker). Error bars indicate SD. Scale bar, 10 μm.
Figure 3 with 1 supplement
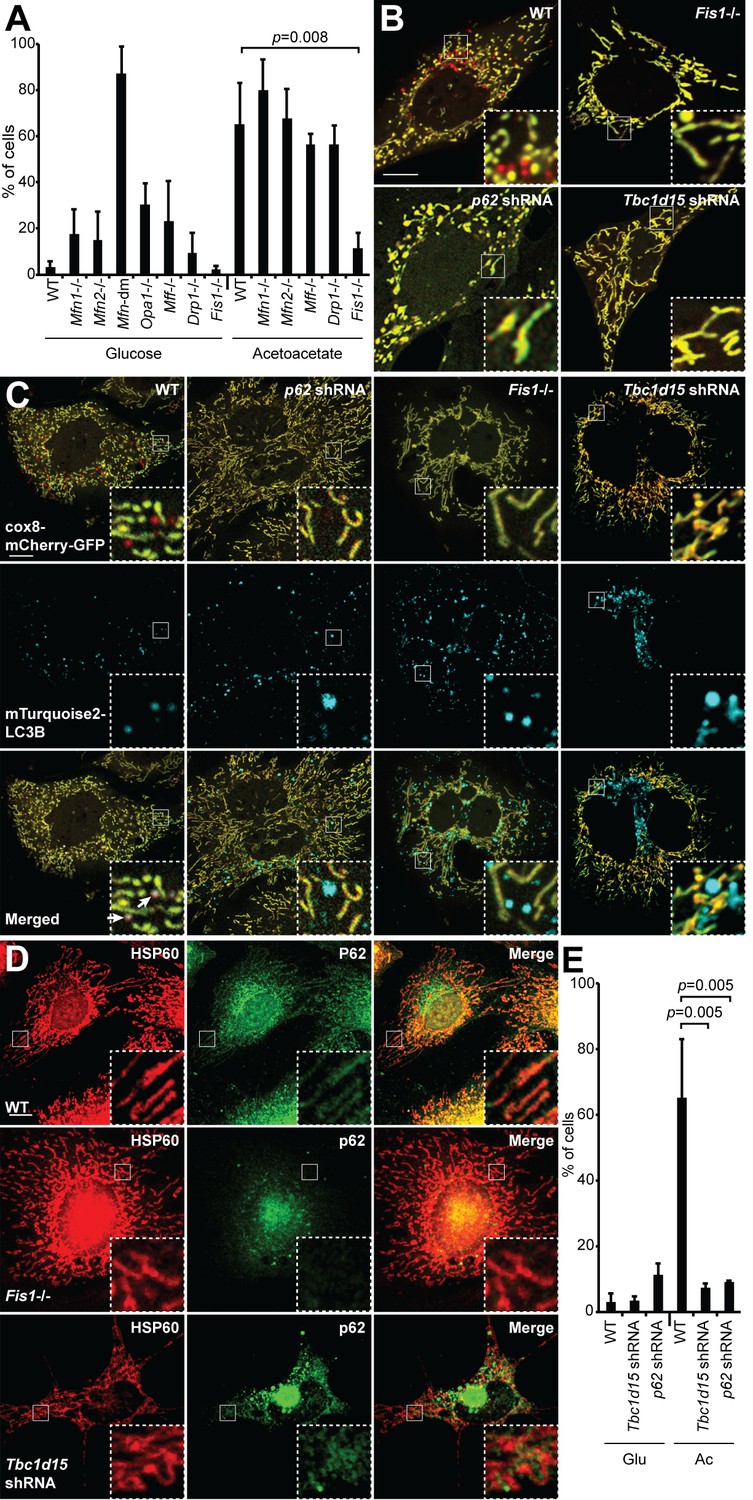
Mitophagy under OXPHOS-inducing conditions requires FIS1, TBC1D15, and p62.
(A) Mitophagy in cells with mutations in mitochondrial dynamics genes. MEFs of the indicated genotype were cultured in glucose or acetoacetate medium, and mitophagy was quantified using the Cox8-EGFP-mCherry marker. Neither Mfn-dm cells nor Opa1-/- cells were viable in acetoacetate-containing medium. Error bars indicate SD of three biological replicates, p=0.0078 (Student’s t-test. (B) MEFs stably expressing Cox8-EGFP-mCherry were grown in acetoacetate containing medium and then imaged by fluorescence microscopy. p62 and Tbc1d15 shRNAs were introduced by retroviral infection. (C) Co-localization of mTurquoise2-LC3B with mitochondria. MEFs were grown in acetoacetate containing medium. Note that mTurquoise2 puncta localize to mitochondrial puncta (arrows) only in WT cells. (D) Co-localization of P62 with mitochondria. MEFs were grown in acetoacetate containing medium and immunostained with anti-P62 (green) and anti-HSP60 (red). (E) Quantification of red-only puncta in WT cells and cells containing shRNA against Tbc1d15 or p62 cultured in glucose (Glu) or acetoacetate (Ac) medium. Error bars indicate SD of three biological replicates, p=0.0048 (Tbc1d15), p=0.0053 (p62) (Student’s t-test).
Figure 3—figure supplement 1
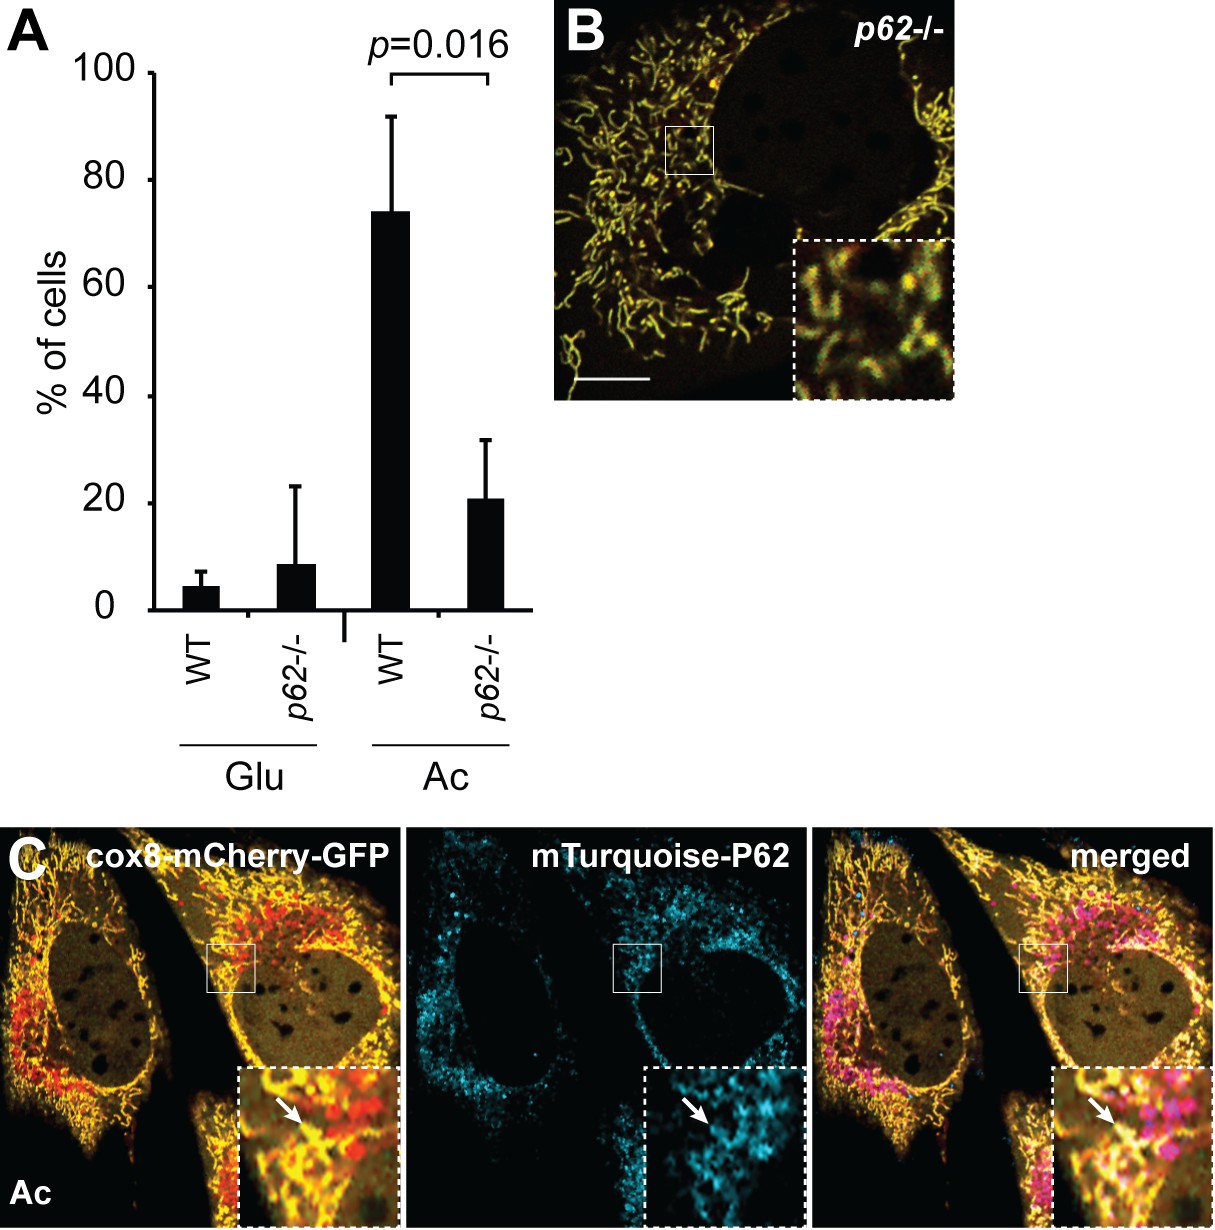
p62 knockout cells have defective OXPHOS-induced mitophagy.
(A) Quantification of red-only puncta in wild-type or p62 knockout cells grown in medium containing glucose (Glu) or acetoacetate (Ac). Error bars indicate SD, three biological replicates, p=0.0163 (Student’s t-test). (B) Representative image of p62 knockout cell expressing cox8-EGFP-mCherry. Cells were grown in medium containing acetoacetate and imaged by fluorescent microscopy. Scale bar, 10 μm. (C) Rescue of mitophagy by p62 replacement. p62 knockout cells stably expressing cox8-EGFP-mCherry were transduced with mTurquoise2-p62, grown in acetoacetate (Ac) containing medium, and imaged by fluorescence microscopy. Arrow indicates mitochondrial localization of mTurquoise2-P62.
Figure 4 with 1 supplement
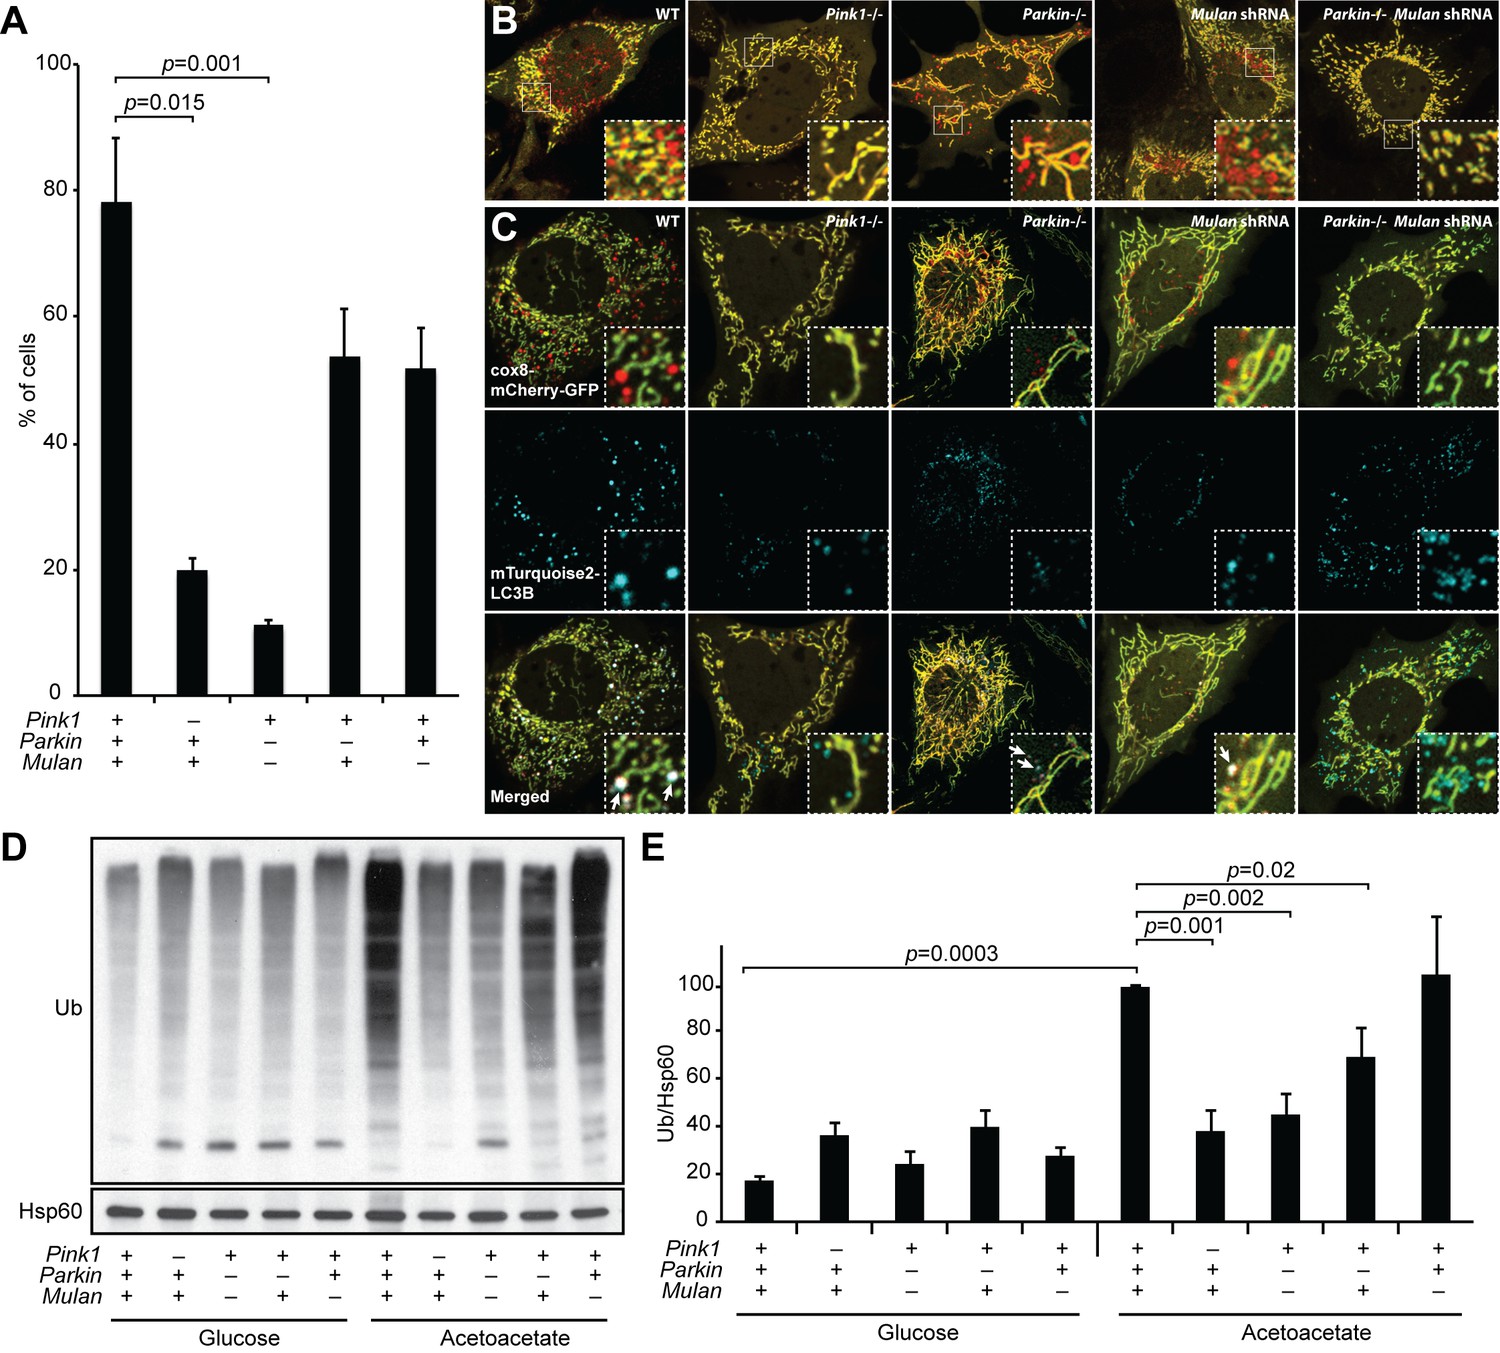
MUL1 and PARKIN have redundant functions in OXPHOS-induced mitophagy.
(A) Quantification of red-only puncta in cells grown in acetoacetate-containing medium. Presence (+) or absence (-) of Pink1, Parkin, or Mul1 is indicated. Error bars indicate SD of three biological replicates, p=0.015 (Pink1), p=0.0011 (Parkin-/- Mulan shRNA) (Student’s t-test). (B) Mitophagy in wild-type and mutant cells. Cells stably expressing Cox8-EGFP-mCherry were grown in acetoacetate-containing medium and imaged by fluorescence microscopy. (C) Co-localization of LC3B with mitophagy intermediates. Wild-type and mutant cells were retrovirally transduced with mTurquoise2-LC3B, grown in acetoacetate-containing medium and imaged by fluorescence microscopy. Examples of LC3B co-localization with mitophagy intermediates are indicated by arrows. (D) Accumulation of polyubiquitinated proteins in mitochondria. Cells were grown in the indicated medium, and mitochondria were isolated by differential centrifugation. Mitochondrial lysates were analyzed by Western blot for pan-Ubiquitin. HSP60 is a loading control. (E) Quantification of polyubiquitinated proteins in mitochondria. Three independent experiments were quantified by densitometry and averages are shown. Ubiquitin level was normalized to HSP60. Error bars indicate SD, p=0.0003 (WT Glu vs. Ac), p=0.0011 (Pink1-/-), p=0.0016 (Parkin-/- Mulan shRNA), p=0.0206 (Parkin-/-) (Student’s t-test).
Figure 4—figure supplement 1
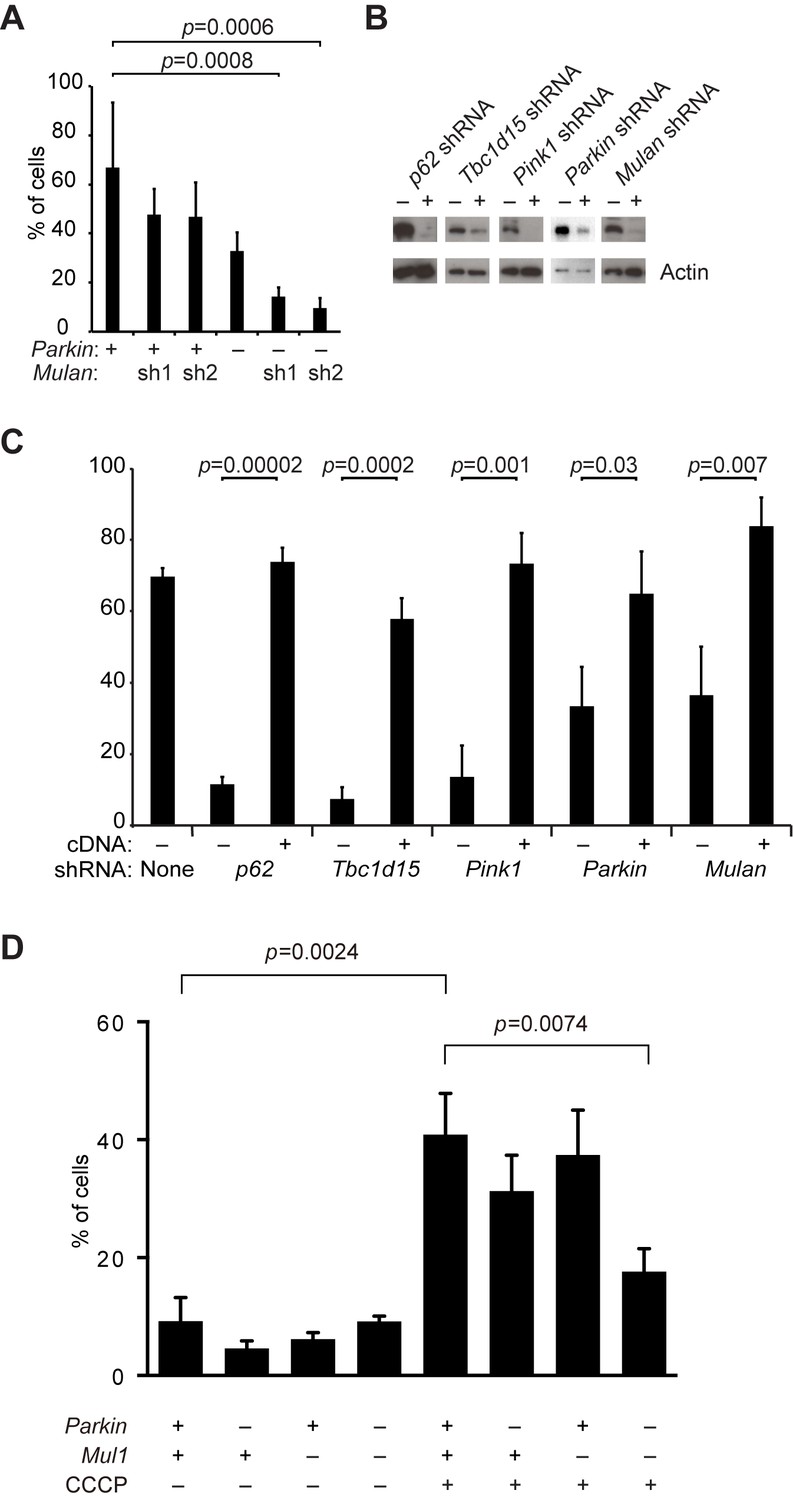
Defective mitophagy in Parkin/Mul1-deficient cells.
(A) Requirement for Parkin/Mul1 in mitophagy. Quantification of red-only puncta in cells grown in medium containing acetoacetate. Wild-type (+) or Parkin knockout (-) cells were transduced with one of two independent Mulan shRNAs as indicated. Error bars indicate SD from two biological replicates. p values are from the Student’s t-test. (B) Western blot analysis of shRNA knockdowns. Cells were transduced with the indicated shRNA (+) or not (-) and blotted with corresponding antibody. For analysis of the Parkin shRNA, MEFs overexpressing EGFP-Parkin were used, because endogenous Parkin is below the detection limit of the antibody. Actin was used as a loading control. (C) Rescue of mitophagy with shRNA-resistant cDNA expression. Cells expressing the indicated shRNA were transduced with shRNA-resistant cDNA constructs as indicated (+). The cells were grown in acetoacetate containing medium, and mitophagy was quantified as described in Figure 4. Error bars indicate SD from three biological replicates. p values are from the Student’s t-test. (D) Dependence of CCCP-induced mitophagy on Parkin and Mul1. MEFs of the indicated genotypes were incubated with (+) or without (-) CCCP (10 μM) for 6 hr, and mitophagy was quantified. Error bars indicate SD from three independent experiments. p values are from the Student's t-test.
Figure 5 with 1 supplement
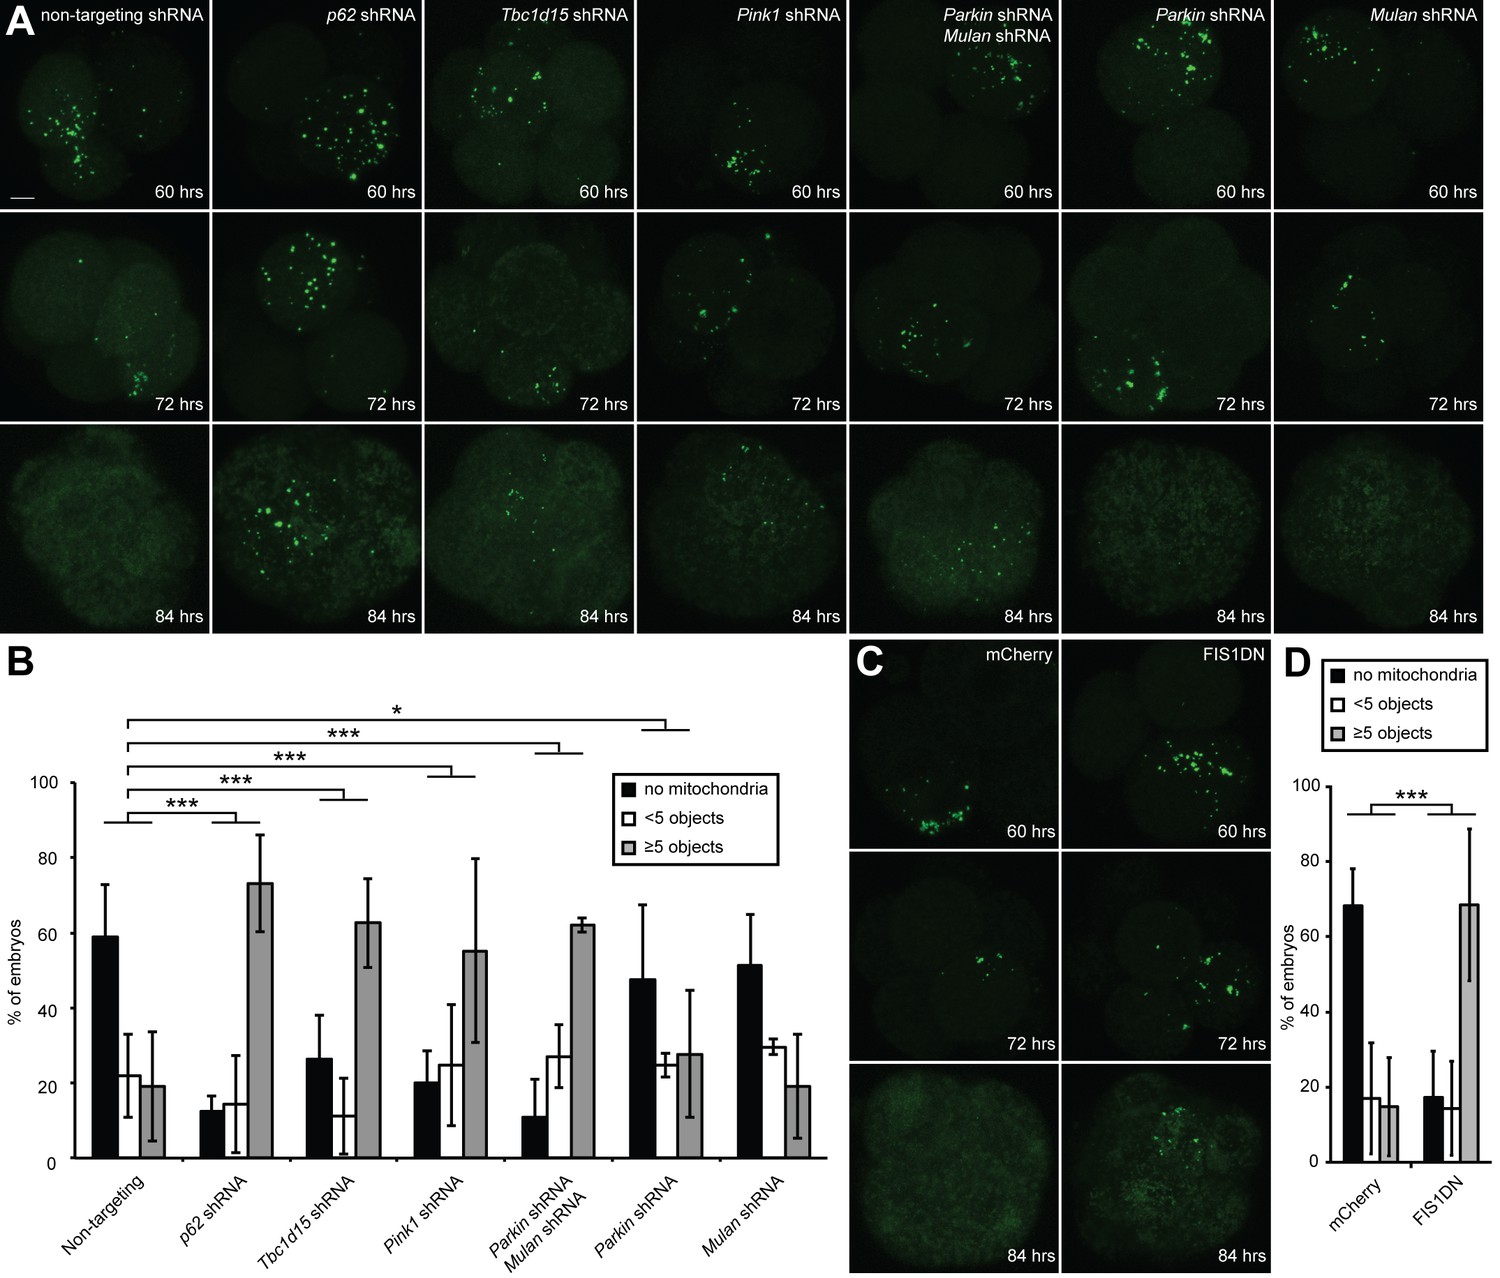
Clearance of paternal mitochondria in preimplantation embryos requires mitophagy genes.
(A) Impaired elimination of paternal mitochondria upon inhibition of mitophagy genes. Embryos were injected with lentivirus expressing shRNA against the indicated genes. The mitochondrial Dendra2 signal is shown for live embryos at 60, 72, and 84 hr after fertilization. Images are maximum intensity projections. Scale bar, 10 μm. (B) Quantification of paternal mitochondrial elimination at 84 hr post-fertilization. Maximum intensity z-projection images were analyzed encompassing the full embryo with z-slices overlapping. Embryos were scored as having no paternal mitochondria (black bar), less than five mitochondrial objects (white bar), or five or more mitochondrial objects (grey bar). Averages of at least three independent injection experiments are shown with 32–200 embryos quantified. Error bars indicate SD, *p<0.05; **p<0.01; ***p<0.001 (Chi-squared test). p-Values compare experimental embryos to control embryos with non-targeting shRNA. Chi-squared values: 75.386 (Tbc1d15), 155.784 (p62), 58.064 (Parkin shRNA, Mulan shRNA), 1.484 (Mulan shRNA), 8.074 (Parkin shRNA). (C) Clearance of paternal mitochondria in embryos expressing mCherry (control) or Fis1-DN. Same scale as (B). (D) Quantification of 84 hr results from (D). Error bars indicate SD. ***p<0.001 (Chi-square test). p-Values compare experimental embryos to mCherry control embryos. Chi-squared value: 125.584.
-
Figure 5—source data 1
Source data for Figure 5B and D.
Excel file containing source data for the plots in Figure 5B and D.
- https://doi.org/10.7554/eLife.17896.011
Figure 5—figure supplement 1
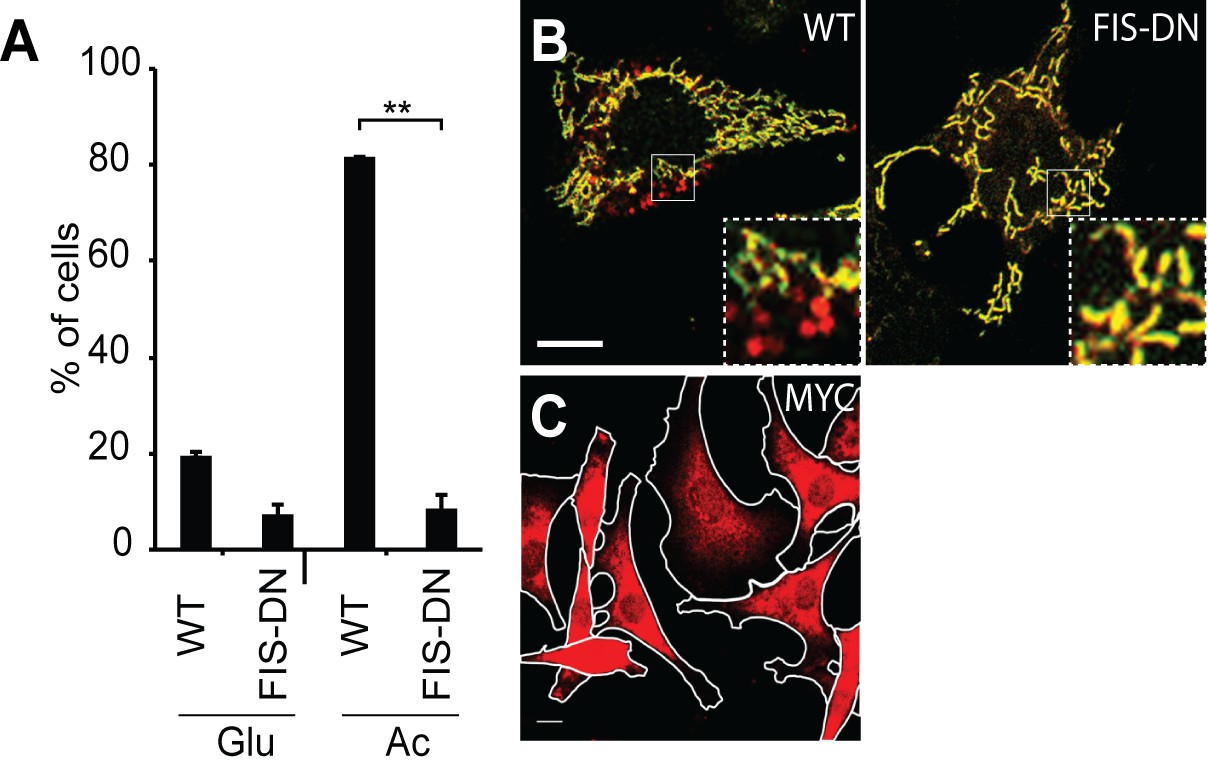
Inhibition of OXPHOS-induced mitophagy by dominant negative FIS1.
(A) Quantification of red-only puncta in wildtype (WT) cells or cells transduced with MYC-FIS1-DN retrovirus. Cells were grown in medium containing glucose (Glu) or acetoacetate (Ac). Error bars indicate SD from two biological replicates, **p=0.00066 (Student’s t-test). (B) Imaging of cox8-EGFP-mCherry in WT cells or cells transduced with MYC-FIS1-DN retrovirus. Cells were grown in medium containing acetoacetate. Scale bar, 10 μm. (C) Diffuse cytosolic localization of MYC-FIS1-DN. Scale bar, 10 μm.
Figure 6 with 1 supplement
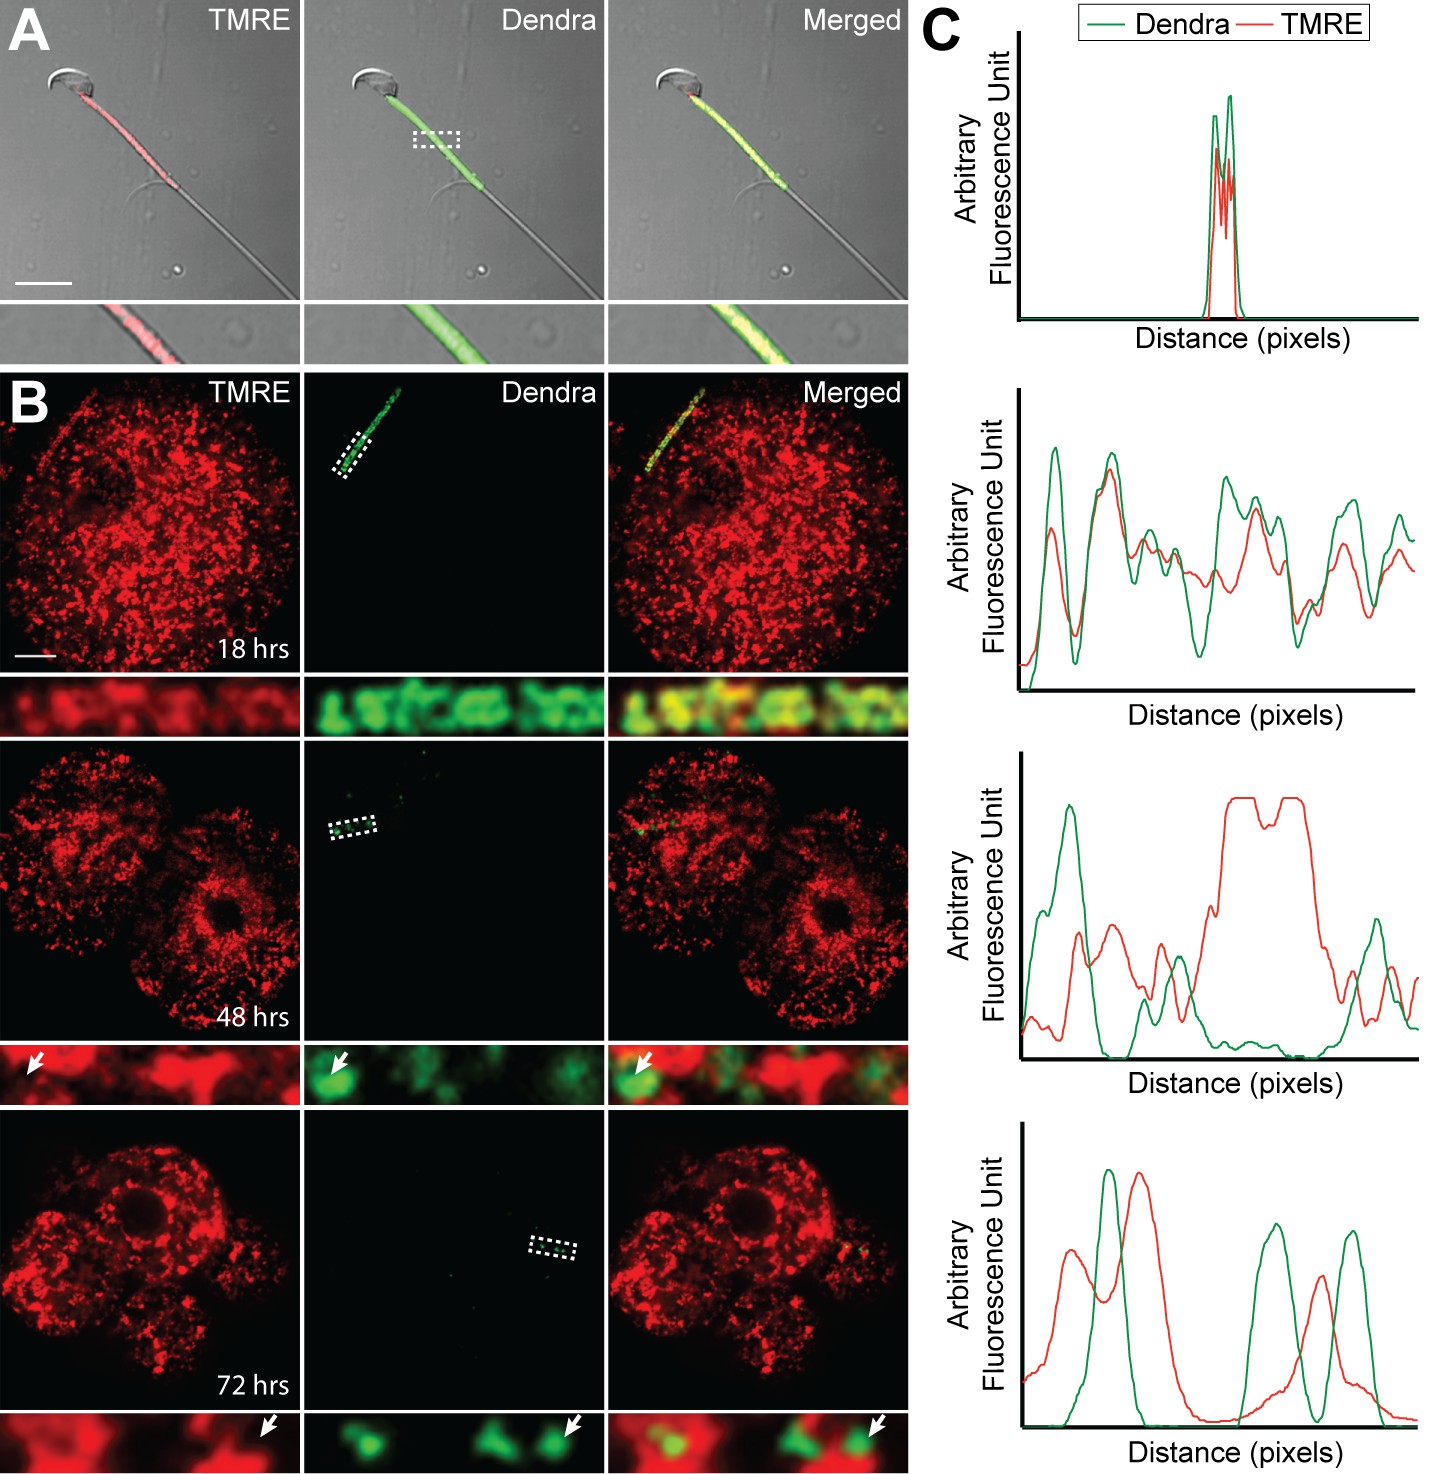
Loss of membrane potential in paternal mitochondria after fertilization.
(A) Mitochondrial membrane potential in live sperm cell. Spermatozoa were isolated from the cauda epididymis of a PhAM mouse, stained with 20 nM TMRE, washed, and imaged by fluorescent microscopy. Red signal is TMRE; green signal is mito-Dendra2. The boxed region is enlarged below. Scale bar, 10 μm. (B) Membrane potential of paternal mitochondria in early embryos. Embryos, generated by mating wildtype females with PhAM males, were collected at 12 hr after fertilization and cultured in vitro. At 18, 48, or 72 hr after fertilization, the embryos were incubated in 20 nM TMRE, washed, and imaged by fluorescent microscopy. Dashed box indicates region enlarged below. Arrows indicate examples of mito-Dendra2-positive spots lacking TMRE signal. Scale bar, 10 μm. (C) Fluorescence line analysis of the boxed regions in (A) and (B). Each plot measures the TMRE and mito-Dendra2 signals along a one-pixel width line through the center of the boxed region. Note that the mito-Dendra2 and TMRE signals are co-incident at 18 hr after fertilization but not at 48 or 72 hr.
Figure 6—figure supplement 1
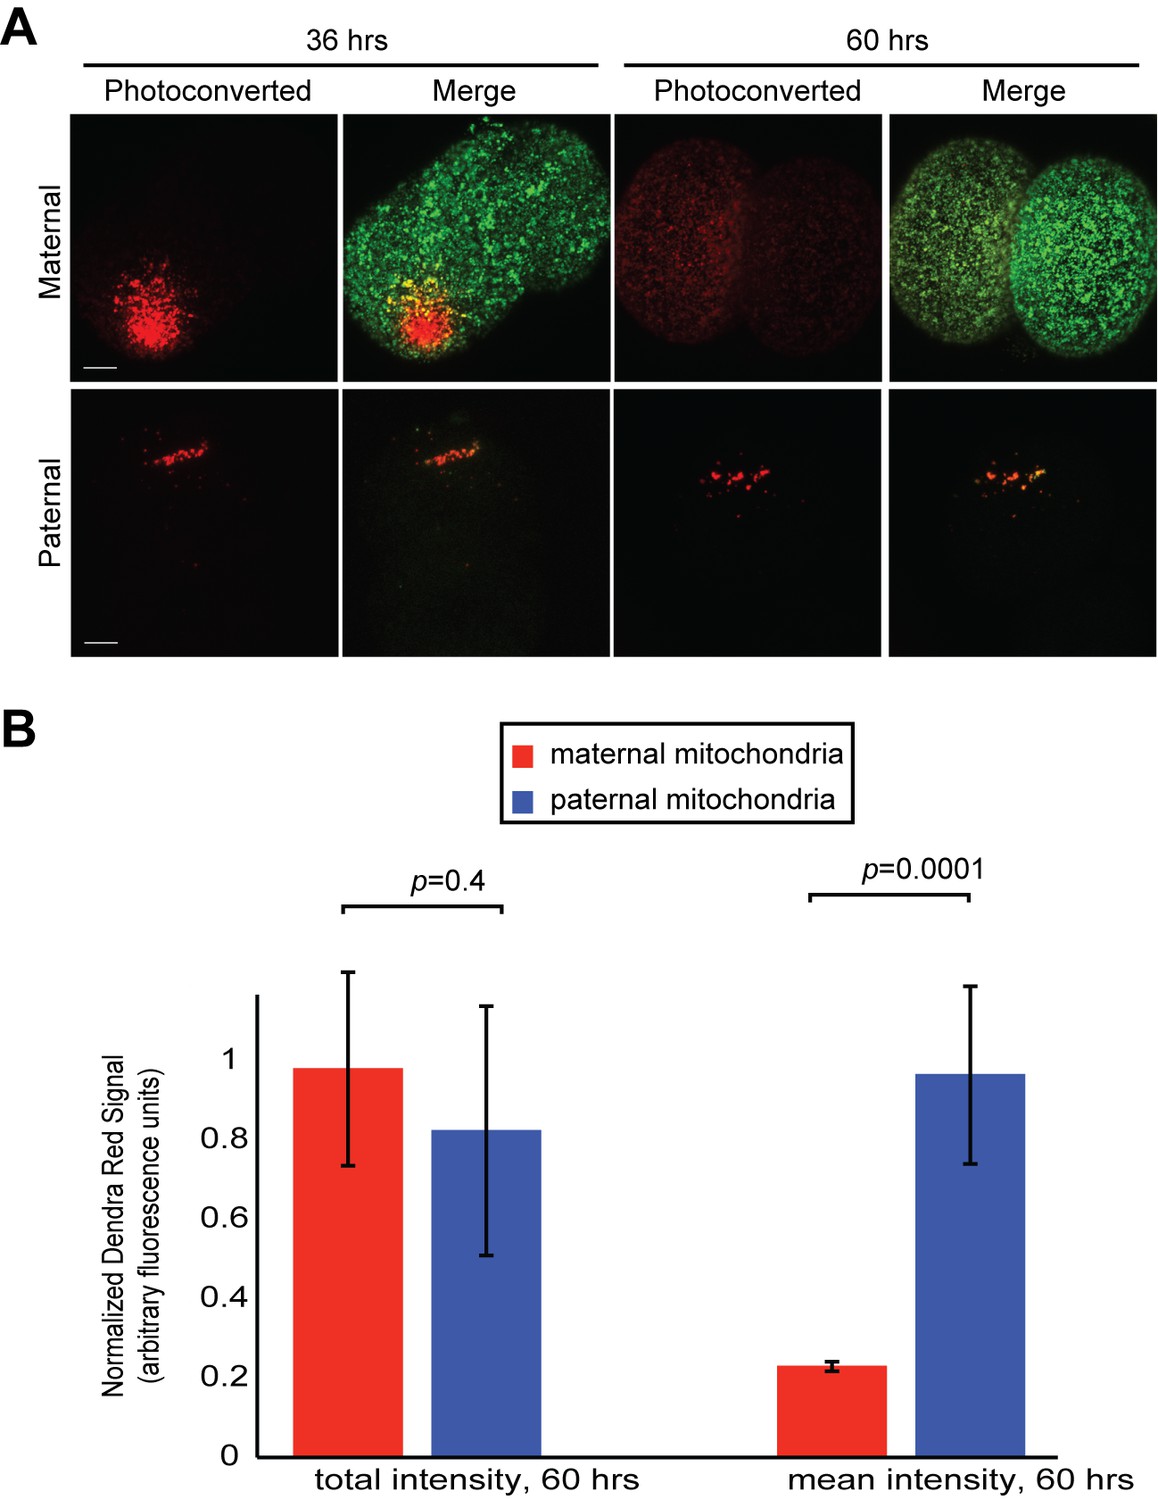
Fusion activity of maternal mitochondria versus paternal mitochondria in the early embryo.
(A) Monitoring mitochondrial fusion in embryos. Embryos were collected from crosses of homozygous mito-Dendra females with unlabeled males (top panel), or homozygous mito-Dendra male with unlabeled female (bottom panel). A subset of mitochondria was photo-converted (red) at 36 hr after fertilization. Embryos were again imaged at 60 hr after fertilization. Representative maximum intensity z-projections of the entire embryo are shown. Note the diffusion of the photoconverted Dendra signal (red) in maternal but not paternal mitochondria. (B) Quantification of experiment in (A). The sum of all red pixel intensities over entire embryo was measured at 36 and 60 hr. The first two bars show the ratios at 60 hr/36 hr (total intensity). The last two bars show the same analysis for average red pixel intensity (mean intensity). Note that mean intensity of maternal photo-converted mitochondria decreases (indicating fusion), whereas that of paternal photo-converted mitochondria does not. Error bars indicate SD of embryos pooled from three females, p=0.4156 (total intensity), p=0.00013 (mean intensity) (Student’s t-test).
Download links
A two-part list of links to download the article, or parts of the article, in various formats.
Downloads (link to download the article as PDF)
Open citations (links to open the citations from this article in various online reference manager services)
Cite this article (links to download the citations from this article in formats compatible with various reference manager tools)
Elimination of paternal mitochondria in mouse embryos occurs through autophagic degradation dependent on PARKIN and MUL1
eLife 5:e17896.
https://doi.org/10.7554/eLife.17896


