A histone H3K9M mutation traps histone methyltransferase Clr4 to prevent heterochromatin spreading
- Columbia University, United States
- Nice (IRCAN), CNRS UMR 7284, INSERM U1081, France
- Scripps Research Institute, United States
Figures
Figure 1 with 3 supplements
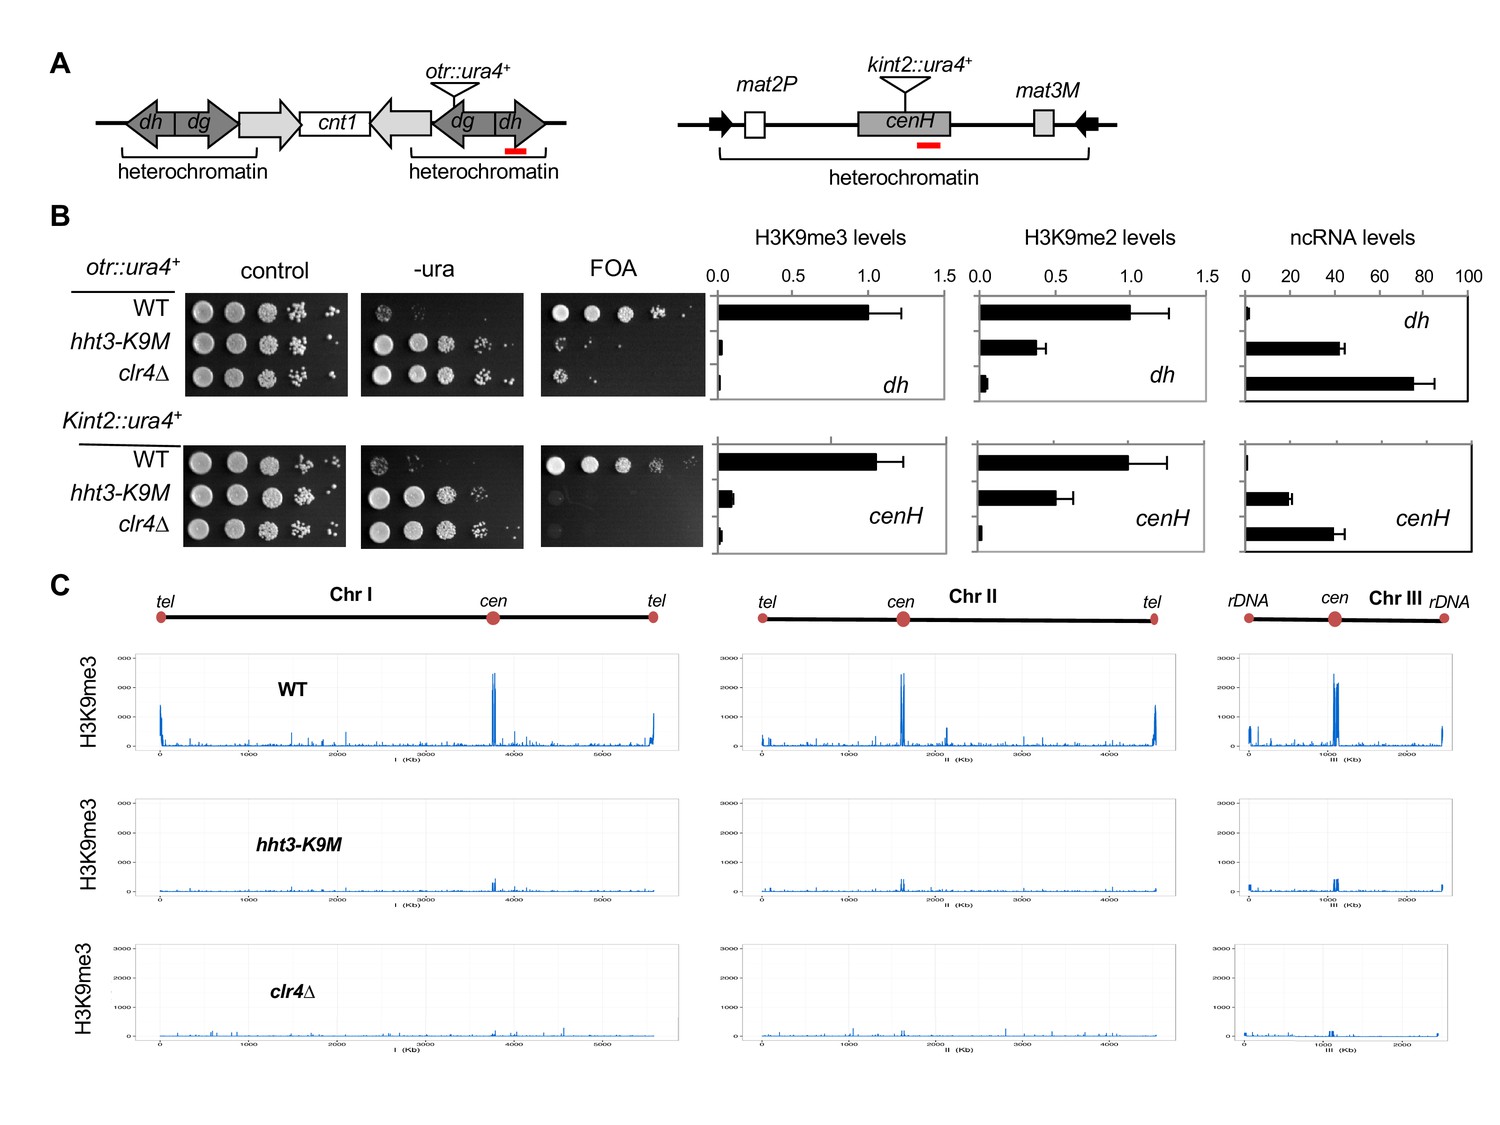
H3K9M affects H3K9me and heterochromatin assembly.
(A) Schematic diagrams of reporter genes used. Red bars indicate primers used for ChIP-qPCR and qRT-PCR analyses. (B) Left, ten-fold serial dilution analyses of indicated yeast strains grown on indicated media to measure the expression of otr::ura4+. Right, ChIP analyses of H3K9me3 and H3K9me2 levels at heterochromatin-associated repeats, normalized to act1+, and qRT-PCR analysis of repeat transcript levels, normalized to act1+. Data presented is mean ± s.d. of four technical repeats. (C) ChIP-seq analysis of H3K9me3 levels across the genome. Data presented is average of two sequencing runs.
Figure 1—figure supplement 1
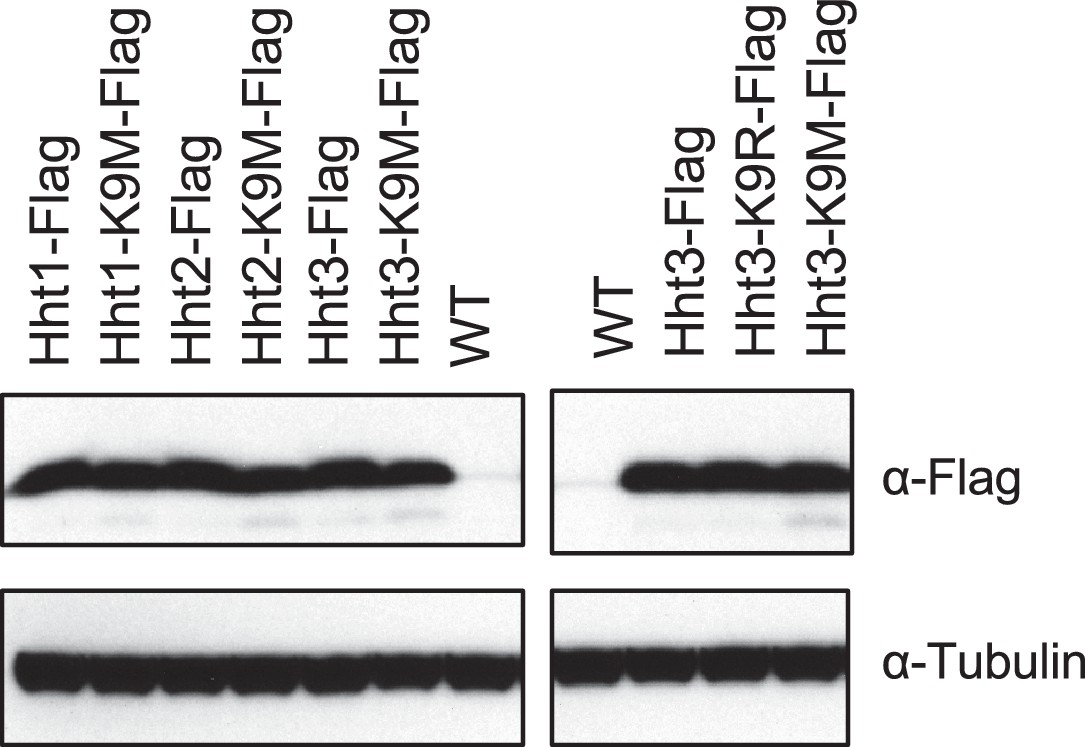
Western blot analyses of histone H3 and Tubulin levels.
https://doi.org/10.7554/eLife.17903.004
Figure 1—figure supplement 2
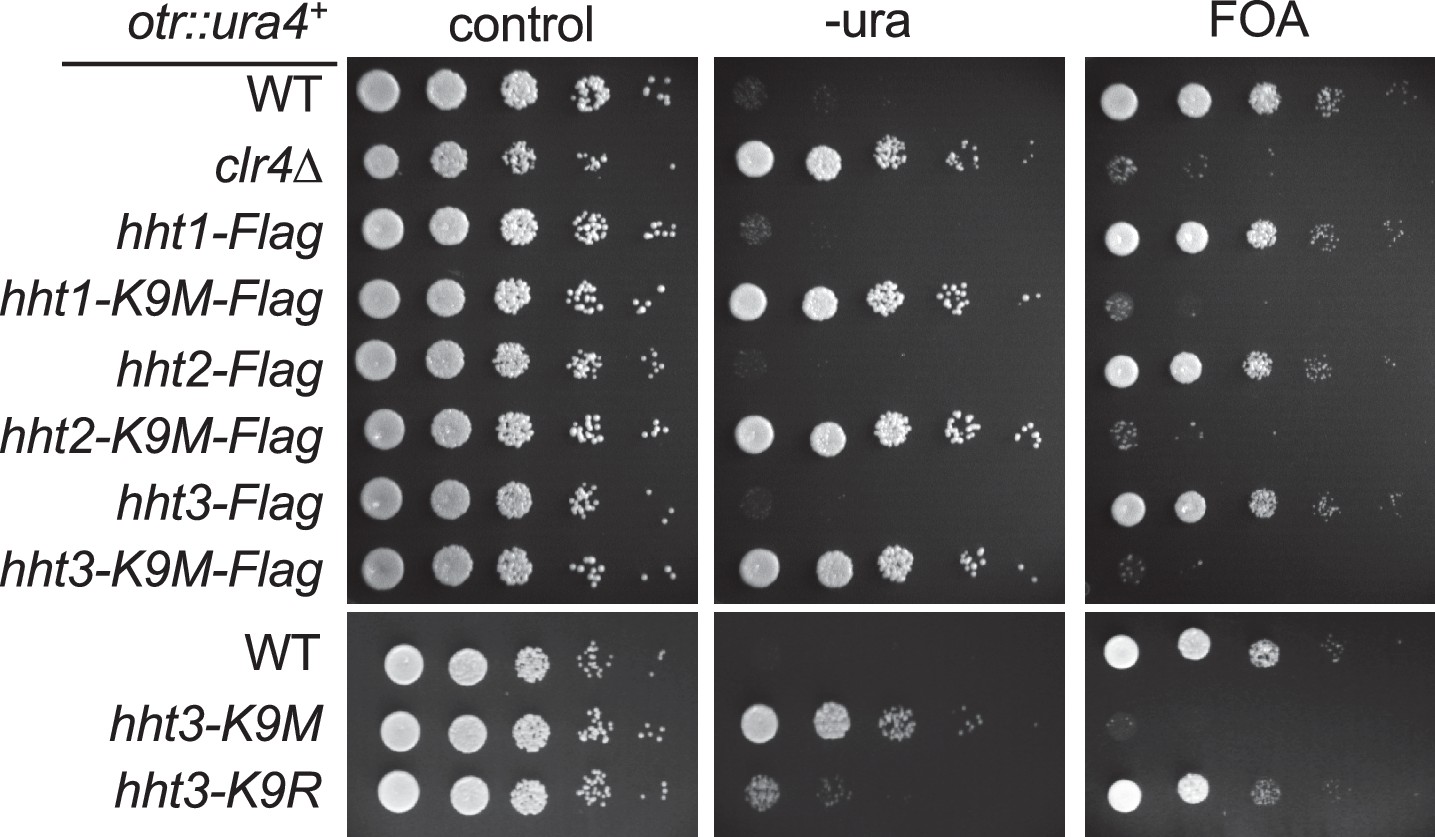
Ten-fold serial dilution analyses of indicated yeast strains grown on indicated media to measure the expression of otr::ura4+.
https://doi.org/10.7554/eLife.17903.005
Figure 1—figure supplement 3
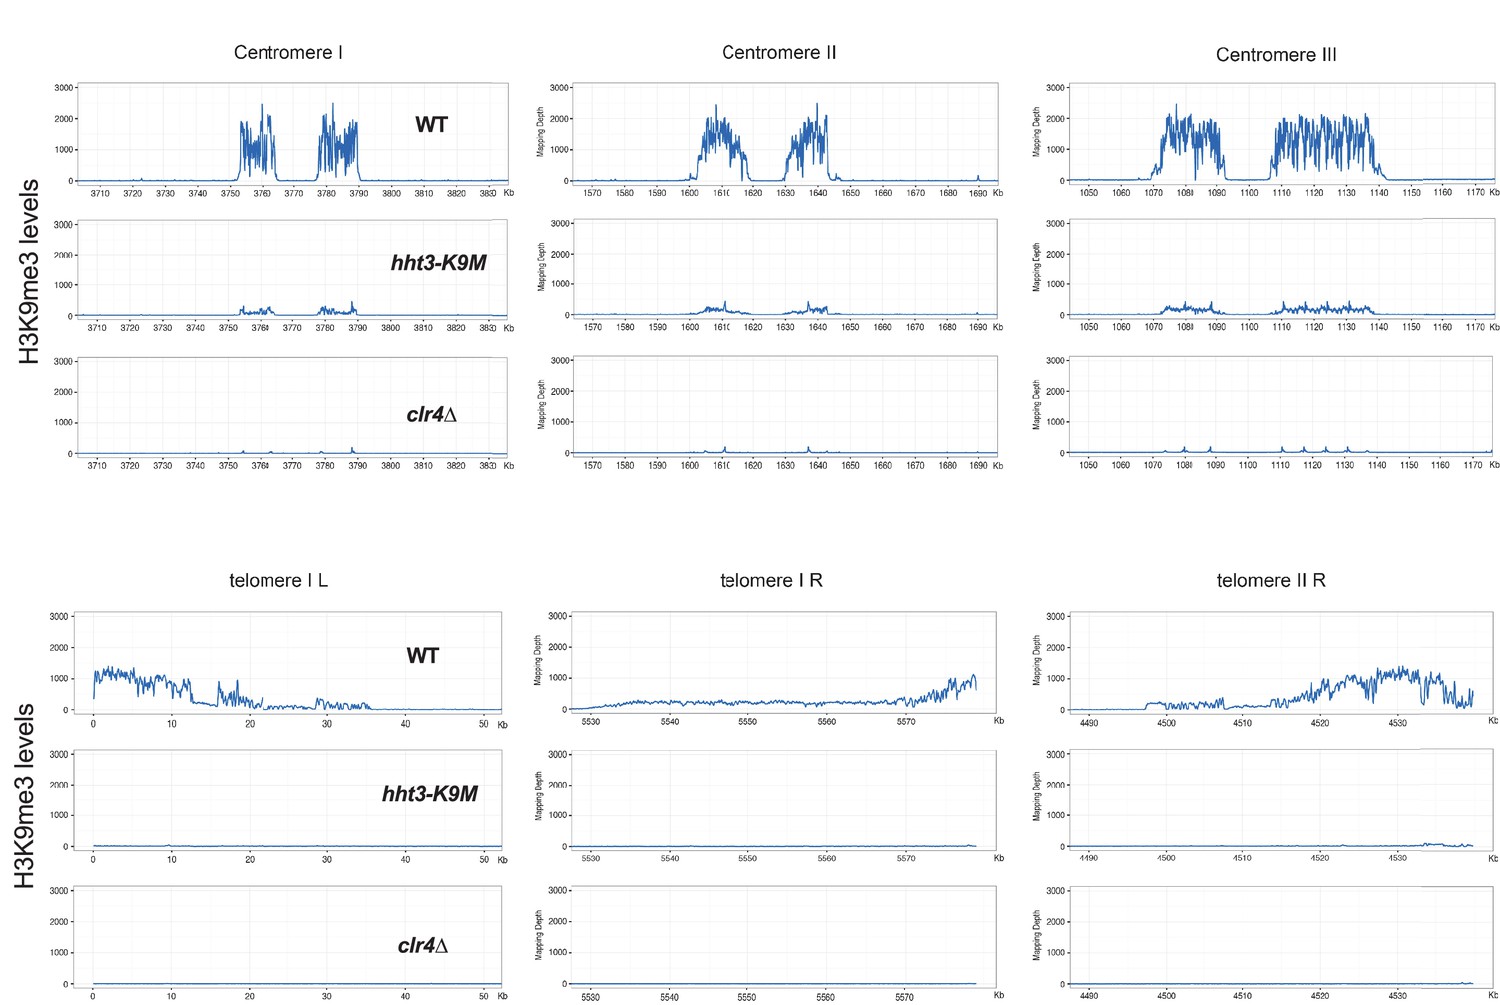
ChIP-seq analyses of H3K9me3 levels at centromeres and telomeres.
https://doi.org/10.7554/eLife.17903.006
Figure 2 with 2 supplements
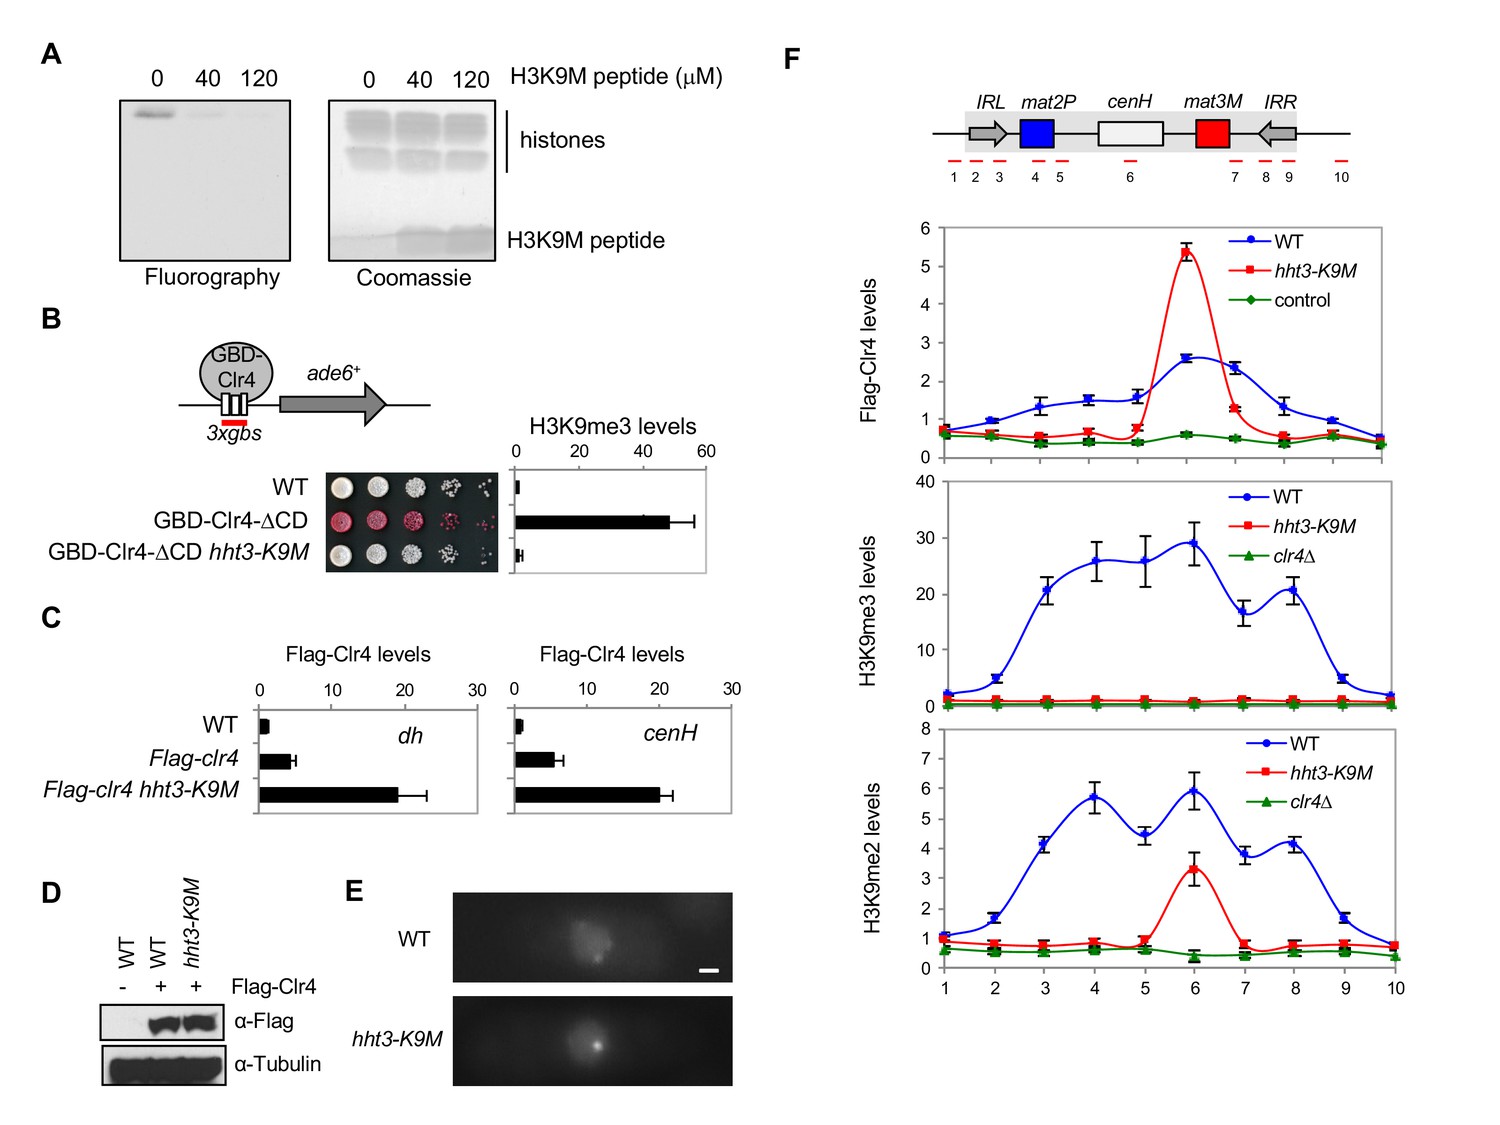
H3K9M traps Clr4 at nucleation centers to prevent heterochromatin spreading.
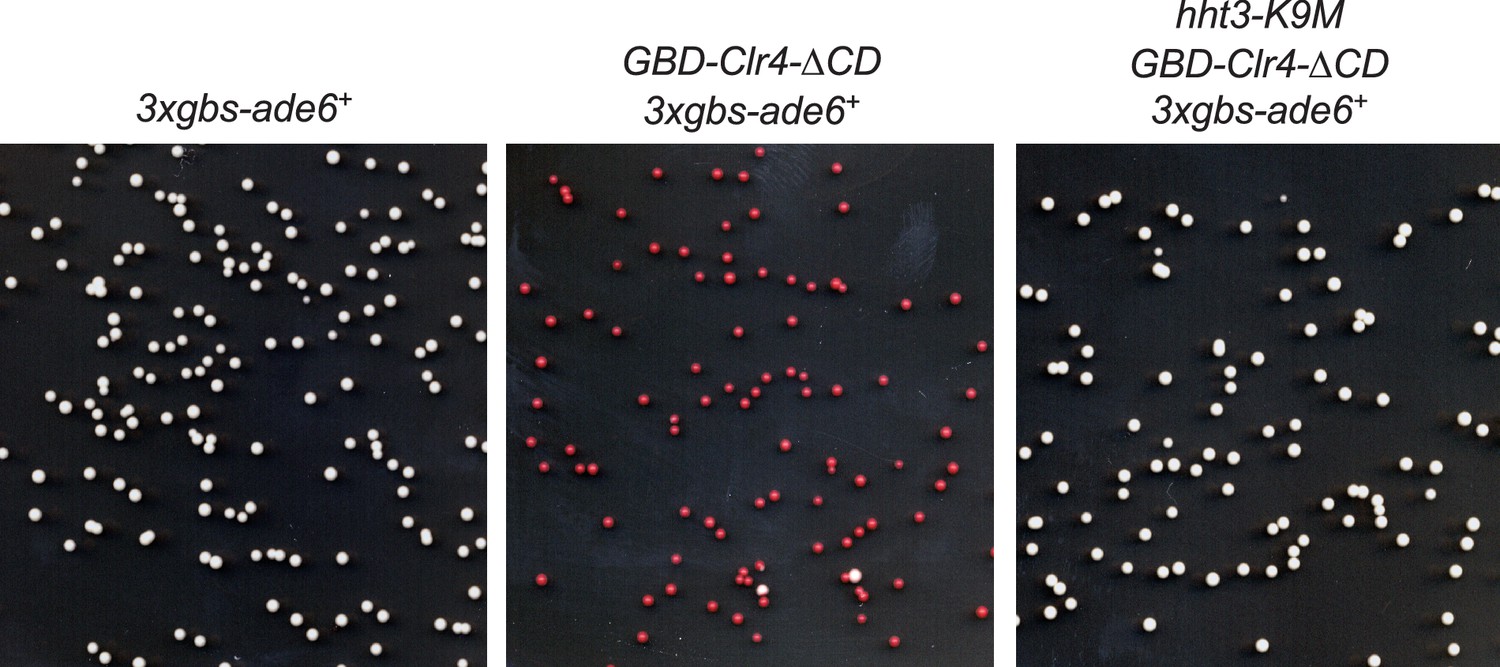
(A) In vitro histone methyltransferase assay with recombinant Clr4 SET domain and recombinant nucleosomes. (B) Top, a schematic diagram of the 3xgbs-ade6+ reporter. Left, ten-fold serial dilution analyses of indicated yeast strains grown on low adenine media (YE) to measure the expression of 3xgbs-ade6+. Right, ChIP analyses of H3K9me3 levels at 3xgbs, normalized to act1+. Data presented is mean ± s.d. of four technical replicates. (C) ChIP analysis of Clr4 levels at heterochromatin associated repeats, normalized to act1+. Data presented is mean ± s.d. of four technical replicates. (D) Western blot analysis of Flag-Clr4 protein levels. (E) Live cell imaging of cells expressing GFP-Clr4. Scale bar is 1 μm. (F) Top, a schematic diagram of the mating type region, with shaded area representing heterochromatin. The PCR fragments used for qPCR analyses are labeled. Bottom, ChIP analysis of Flag-Clr4, H3K9me3, and H3K9me2 levels across the mating type region, normalized to act1+. Data presented is mean ± s.d. of four technical replicates.
Figure 2—figure supplement 1
Yeast strains were grown on low adenine media (YE) to measure the expression of 3xgbs-ade6+.
https://doi.org/10.7554/eLife.17903.008
Figure 2—figure supplement 2
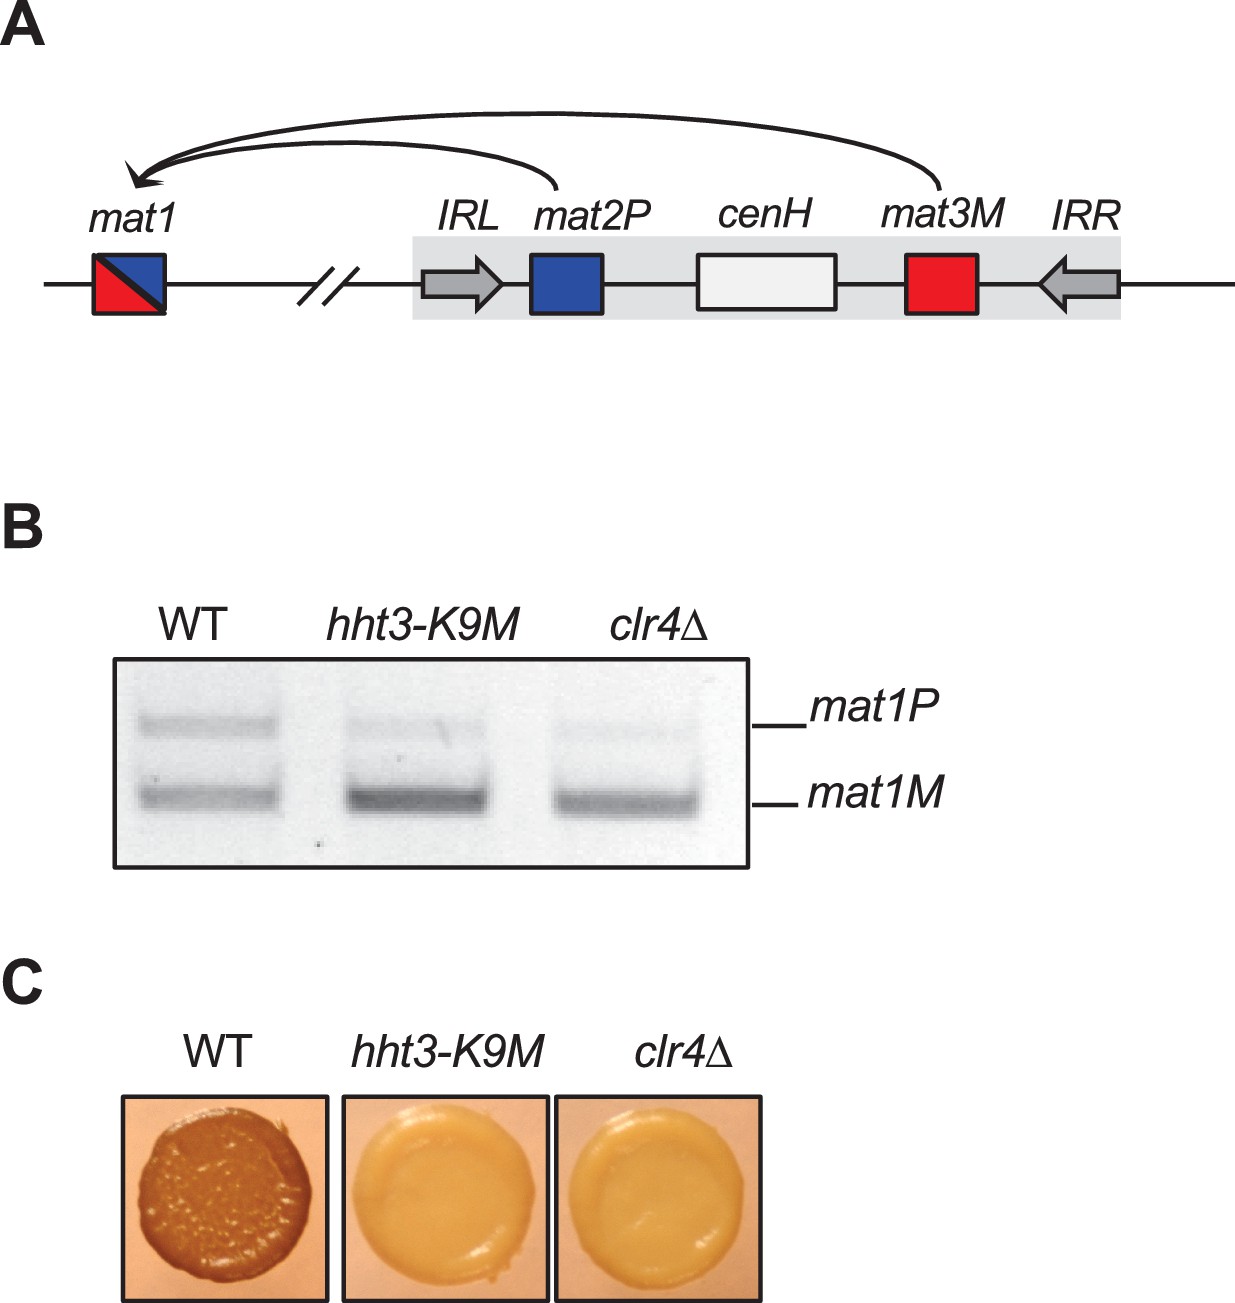
H3K9M affects mating-type switching.
(A) Schematic diagram of the mating-type region. mat2P and mat3M embedded with heterochromatin are used as donors to replace sequence at mat1, which determine the mating-type of the cell. (B) A competitive PCR analysis to show the relative amount of cells of each mating type. (C) Iodine staining of indicated colonies.
Figure 3 with 2 supplements
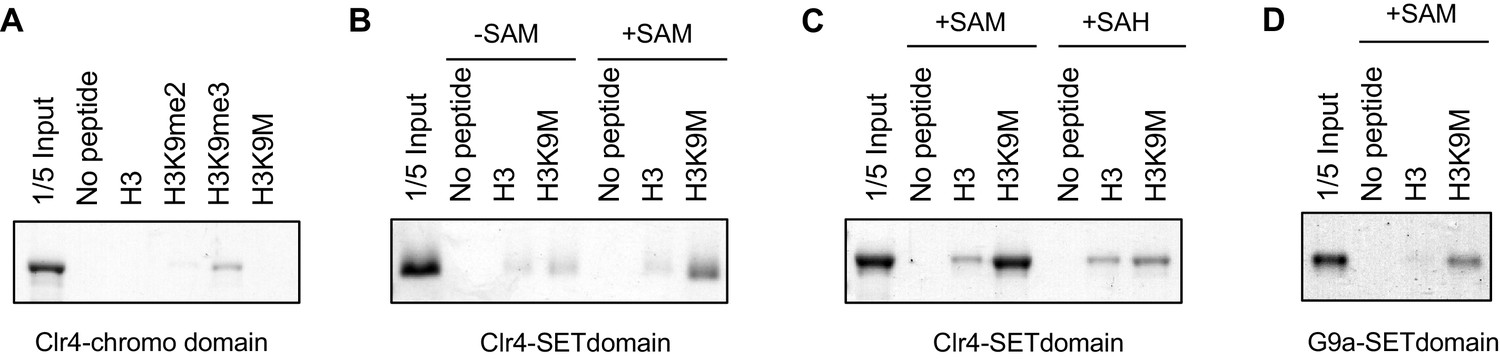
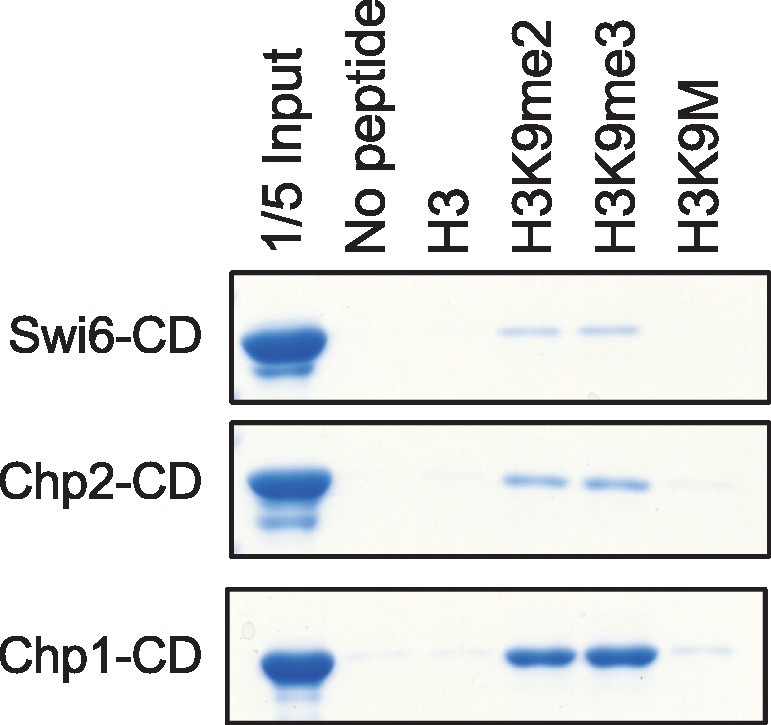
H3K9M interacts directly with H3K9 methyltransferases.
(A) Binding assays with recombinant Clr4 chromo domain and histone peptides in PBS buffer. (B, C) Binding assays with recombinant Clr4 SET domain and histone peptides in histone methyltransferase buffer supplemented with SAM or SAH. (D) Binding assays with recombinant G9a SET domain and histone peptides in histone methyltransferase buffer supplemented with SAM.
Figure 3—figure supplement 1
Binding assays with recombinant GST-tagged chromo domains and histone peptides in PBS buffer.
https://doi.org/10.7554/eLife.17903.011
Figure 3—figure supplement 2
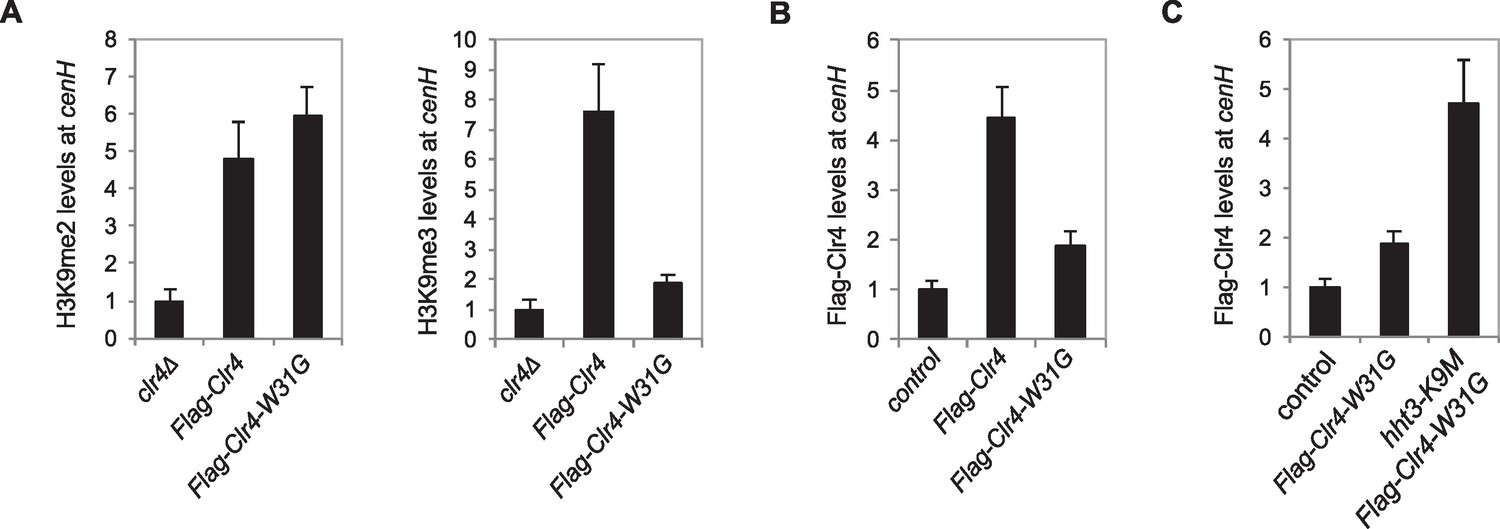
H3K9M functions through the SET domain of Clr4.
(A) ChIP analyses of H3K9me2 and H3K9me3 levels at cenH, normalized to act1. Data presented is mean ± s.d. of four technical repeats. (B, C) ChIP analysis of Clr4 levels at cenH, normalized to act1. Data presented is mean ± s.d. of four technical repeats.
Figure 4 with 3 supplements
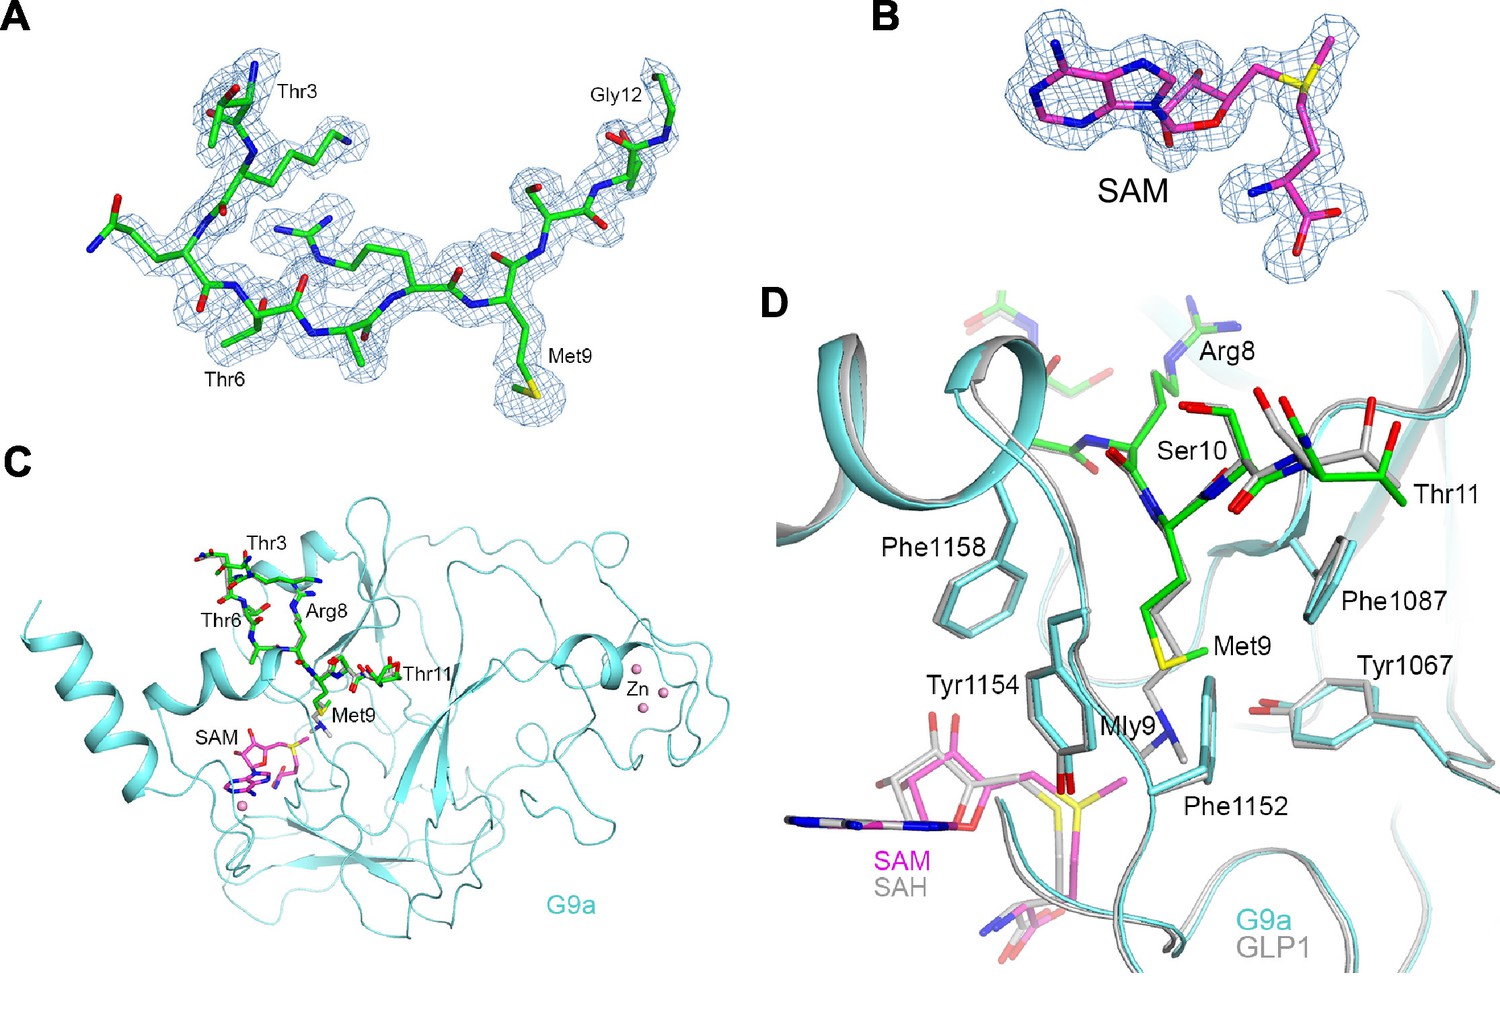
Structure of the H3K9M-G9a-SAM complex.
(A) Omit Fo–Fc electron density at 1.7 Å resolution for the H3K9M peptide, contoured at 3σ. (B) Omit Fo–Fc electron density at 1.7 Å resolution for SAM, contoured at 3σ. (C) Overall structure of G9a (cyan) in complex with the H3K9M peptide (green, stick models) and SAM (magenta). Several zinc ions bound to the protein are shown as pink spheres. The bound position of dimethylated H3K9 peptide to GLP1 is also shown (gray). (D) Detailed interactions between G9a (cyan) and the H3K9M peptide (green) near Met9. The structure of GLP1 in complex with the dimethylated H3K9 (Mly9) peptide and SAH is also shown (gray).
Figure 4—figure supplement 1
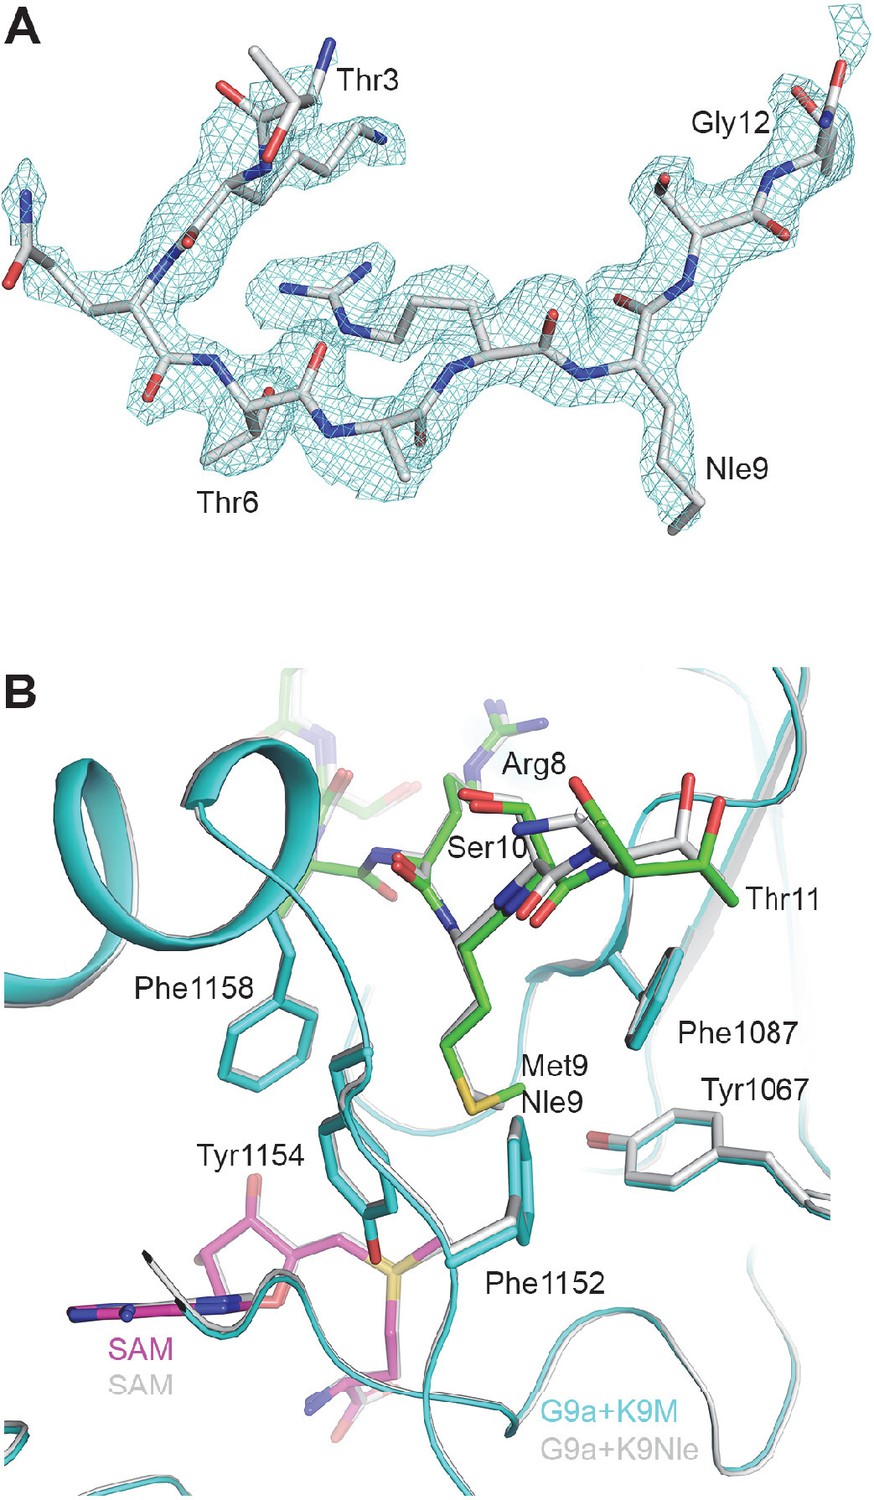
Structure of the H3K9Nle-G9a-SAM complex.
(A) Omit Fo–Fc electron density at 1.9 Å resolution for the H3K9Nle peptide, contoured at 3σ. (B) Detailed interactions between G9a (cyan) and the H3K9Nle peptide (green) near Nle9. The structure of H3K9M in complex with G9a is also shown for comparison.
Figure 4—figure supplement 2
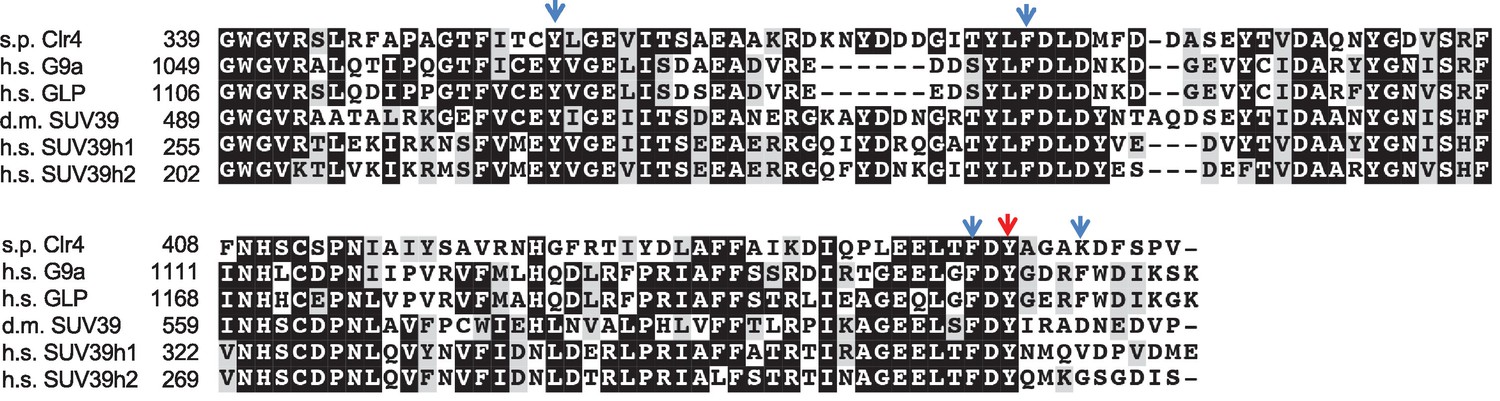
Sequence alignment of SUV39 family H3K9 histone methyltransferases.
Arrows indicate residues of G9a that interact with the methionine side chain. Red arrow indicates Y451 of Clr4. s.p. stands for Schizosaccharomyces pombe, d.m. stands for Drosophila melanogaster, h.s. stands for homo sapiens.
Figure 4—figure supplement 3
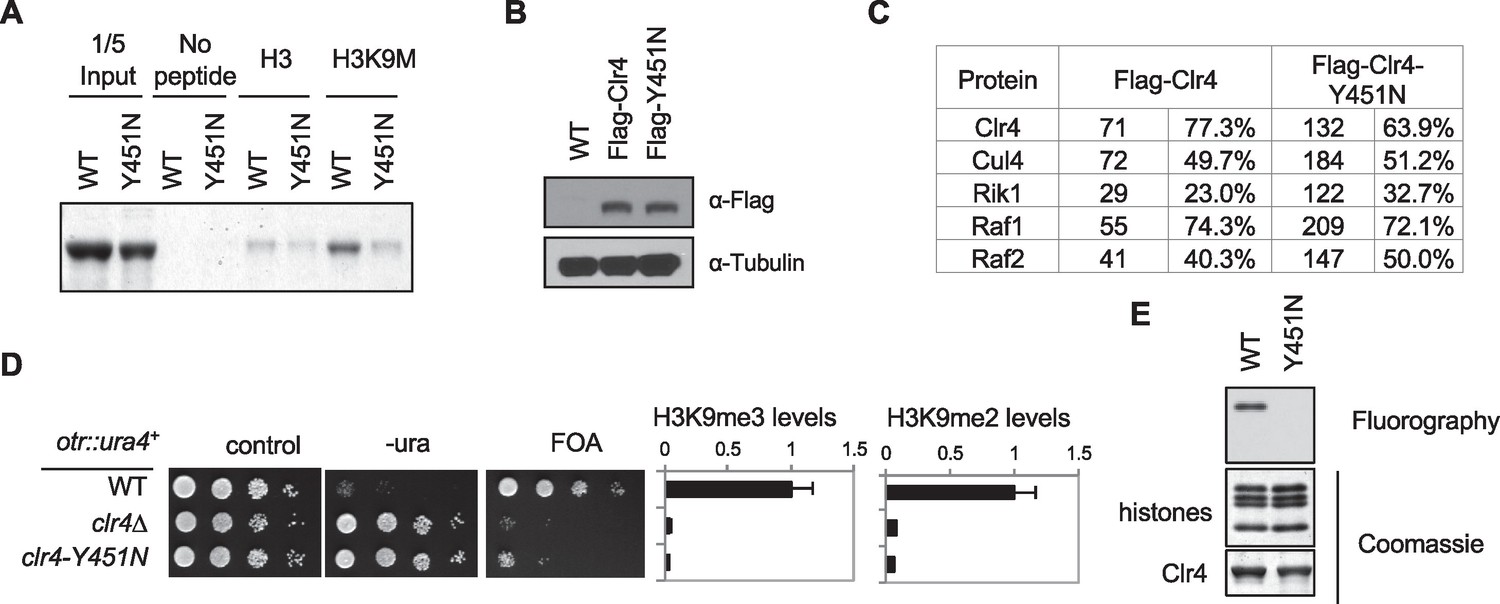
Characterization of the Clr4-Y451N mutant.
(A) In vitro binding assays with recombinant SET domain of Clr4 and histone peptides in the presence of SAM. (B) Western blot analysis of Flag-Clr4 levels. (C) Mass spectrometry analyses of purified Clr4 complexes. The number of peptides identified and the percentage of protein these peptides cover are indicated. (D) Left, ten-fold serial dilution analyses of indicated yeast strains grown on indicated media to measure the expression of otr::ura4+. Right, ChIP analyses of H3K9me3 and H3K9me2 levels at pericentric dh repeats, normalized to act1+.Data presented is mean ± s.d. of four technical repeats. (E) In vitro histone methyltransferase assay with recombinant Clr4 SET domain and histone octamers.
Figure 5 with 1 supplement
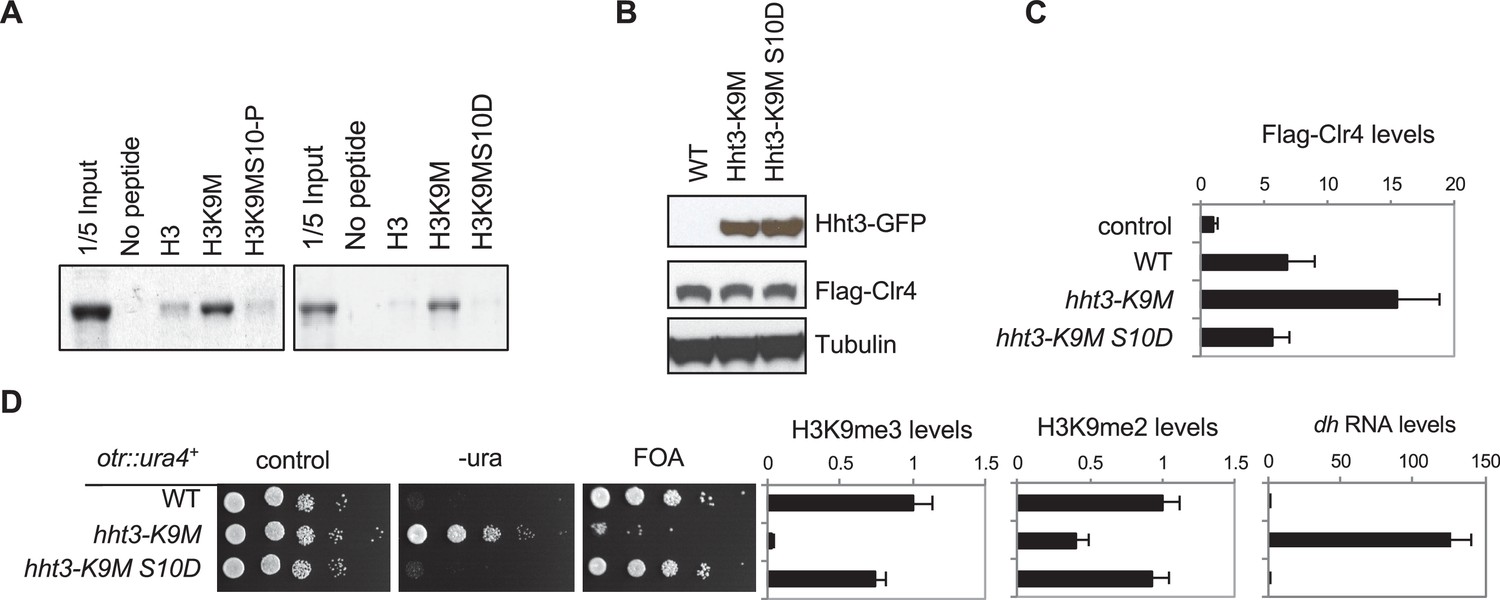
Reduced binding between H3K9M and Clr4 alleviates its inhibitory effects.
(A) Binding assays with recombinant Clr4 SET domain and histone peptides in histone methyltrasnferase buffer containing SAM. (B) Western blot analyses of histone H3 and Clr4 levels. (C) ChIP analysis of Clr4 levels at heterochromatin associated repeats, normalized to act1+. Data presented is mean ± s.d. of four technical repeats. (D) Left, ten-fold serial dilution analyses of indicated yeast strains grown on indicated media to measure the expression of otr::ura4+. Right, ChIP analyses of H3K9me3 and H3K9me2 levels at heterochromatin-associated repeats, normalized to act1+, and qRT-PCR analysis of repeat transcript levels, normalized to act1+. Data presented is mean ± s.d. of four technical repeats.
Figure 5—figure supplement 1
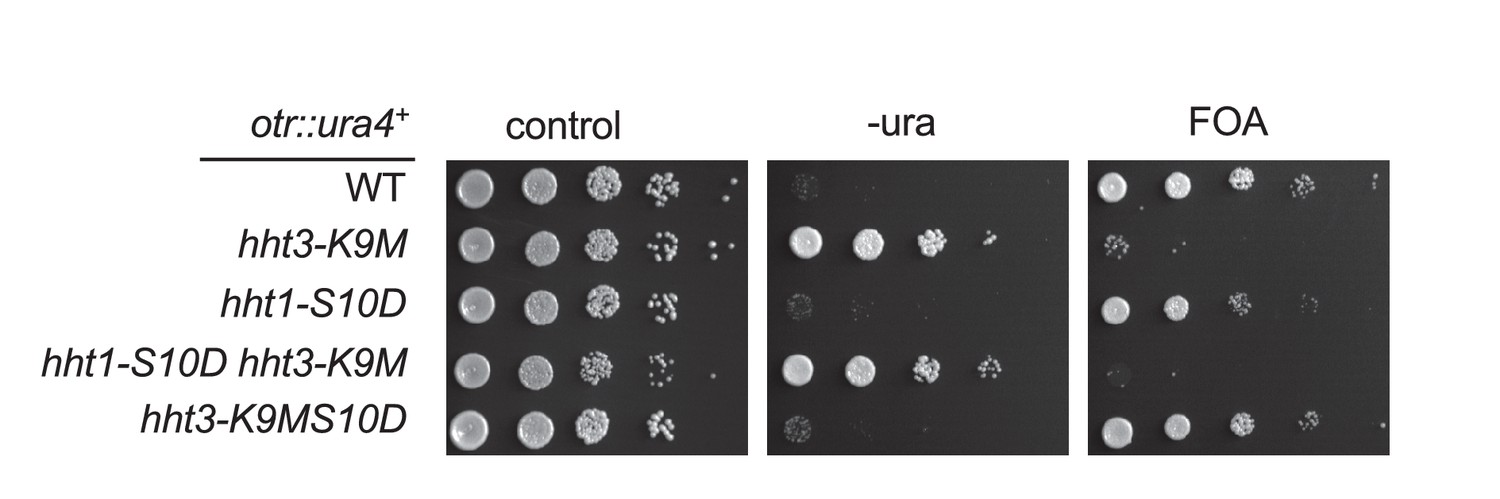
S10D has to be present in cis with K9M to detoxify H3K9M.
Ten-fold serial dilution analyses of indicated yeast strains grown on indicated media to measure the expression of otr::ura4+.
Figure 6 with 1 supplement

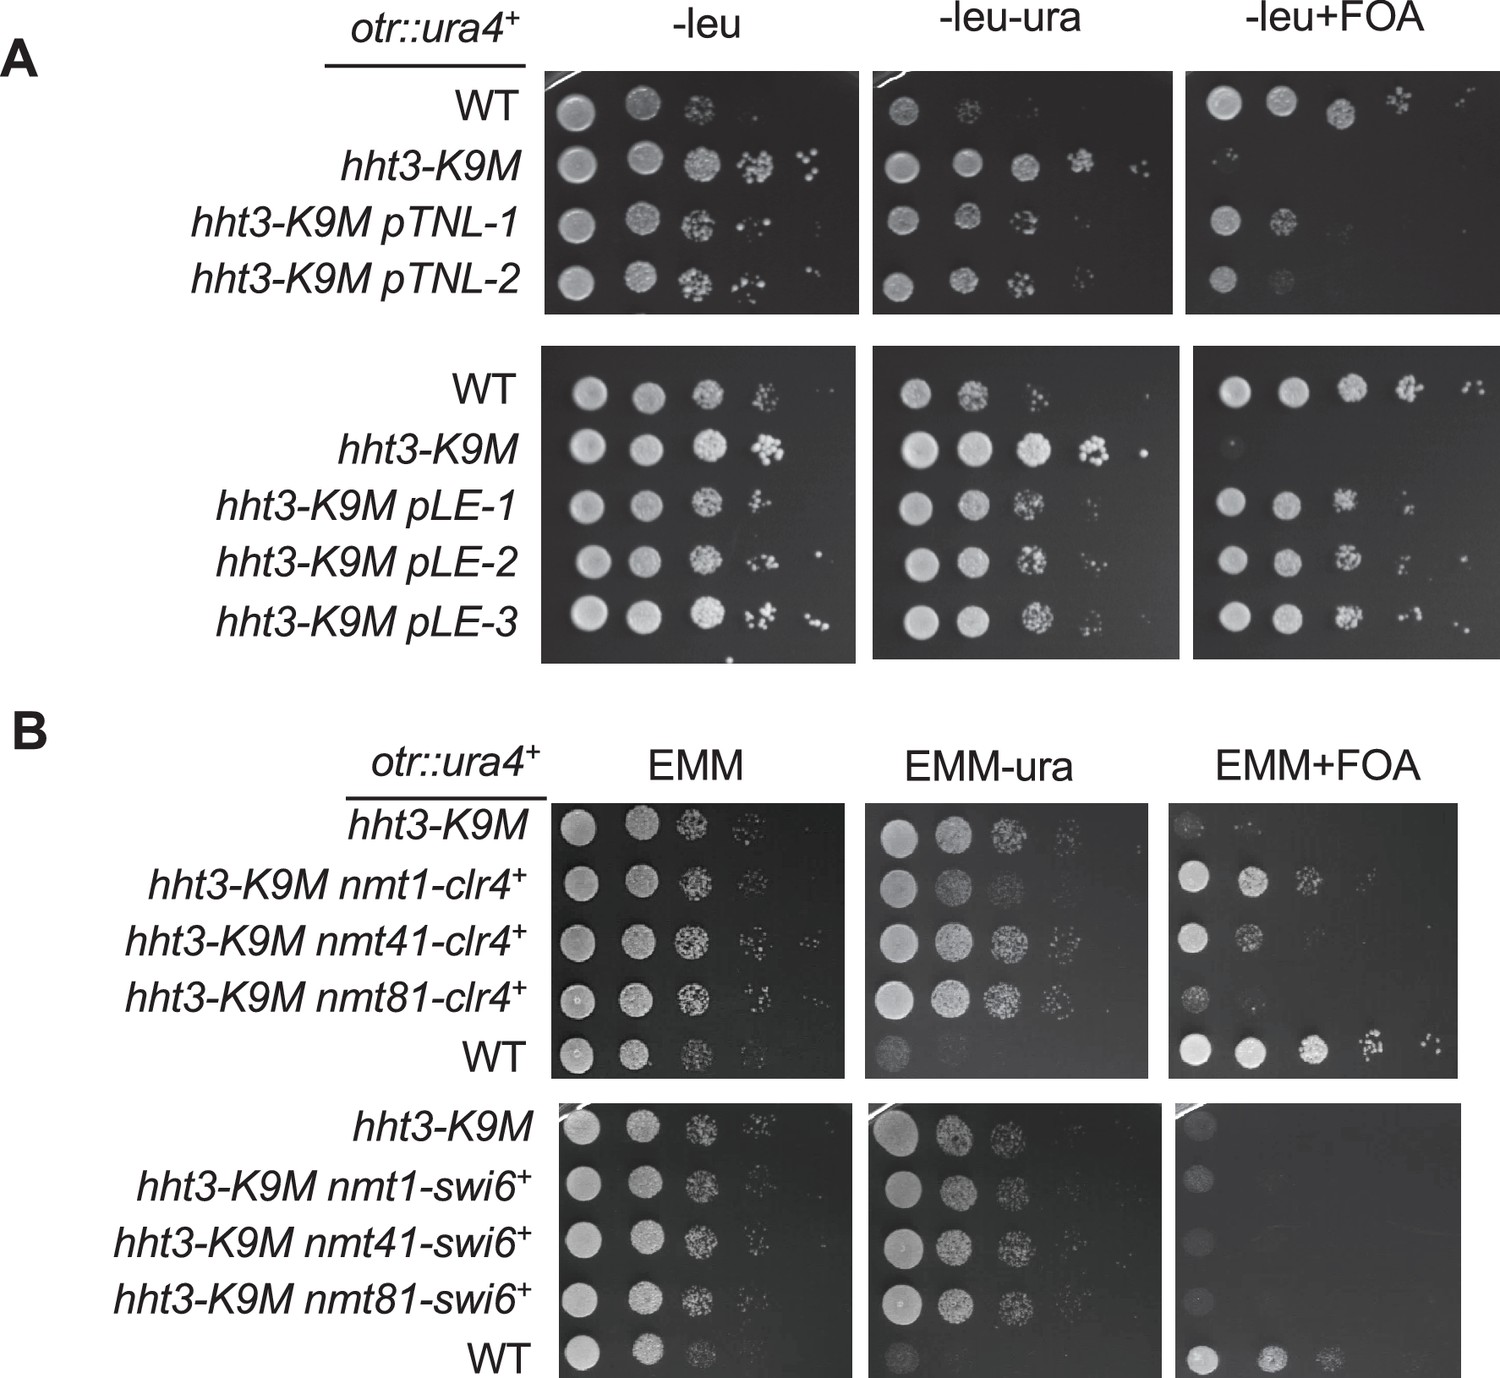
The effects of H3K9M on heterochromatin depend on the relative concentrations of H3K9M and Clr4.
(A) A schematic diagram of the screen procedure for overexpression suppressors of hht3-K9M. (B) List of genomic and cDNA clones identified in the screen. (C, D, E) Left, ten-fold serial dilution analyses of indicated yeast strains grown on indicated media to measure the expression of otr::ura4+. Right, ChIP analyses of H3K9me3 and H3K9me2 levels at pericentric dh repeat, normalized to act1+, and qRT-PCR analysis of dh repeat transcript levels, normalized to act1+. Data presented is mean ± s.d. of four technical replicates.
Figure 6—figure supplement 1
Ten-fold serial dilution analyses of indicated yeast strains grown on indicated media to measure the expression of otr::ura4+.
https://doi.org/10.7554/eLife.17903.020
Figure 7
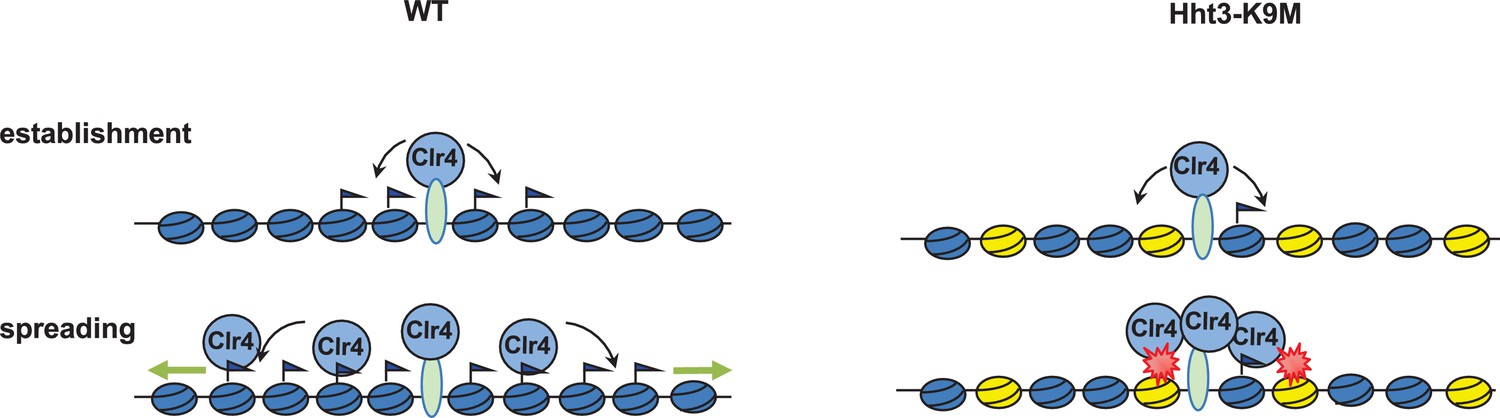
A model of H3K9M dominantly blocking histone H3K9 methylation.
In wild type cells, Clr4 is first recruited to heterochromatin nucleation centers to initiate H3K9 methylation. Methylated nucleosomes recruit additional Clr4 to methylate neighboring nucleosomes, leading to heterochromatin spreading. In the end, low levels of Clr4 will cover the entire heterochromatin domain. In H3K9M expressing cells, Clr4 is still recruited to heterochromatin nucleation centers, but will be trapped there due to its interaction with H3K9M containing nucleosomes (yellow). This result in the failure of Clr4 spreading to form heterochromatin domains.
Additional files
-
Supplementary file 1
Data collection and refinement statistics.
- https://doi.org/10.7554/eLife.17903.022
-
Supplementary file 2
Yeast strains used in this study.
- https://doi.org/10.7554/eLife.17903.023
-
Supplementary file 3
DNA oligos used in this study.
- https://doi.org/10.7554/eLife.17903.024
Download links
A two-part list of links to download the article, or parts of the article, in various formats.
Downloads (link to download the article as PDF)
Open citations (links to open the citations from this article in various online reference manager services)
Cite this article (links to download the citations from this article in formats compatible with various reference manager tools)
A histone H3K9M mutation traps histone methyltransferase Clr4 to prevent heterochromatin spreading
eLife 5:e17903.
https://doi.org/10.7554/eLife.17903


