Aerotaxis in the closest relatives of animals
- University of Cambridge, United Kingdom
Figures
Figure 1
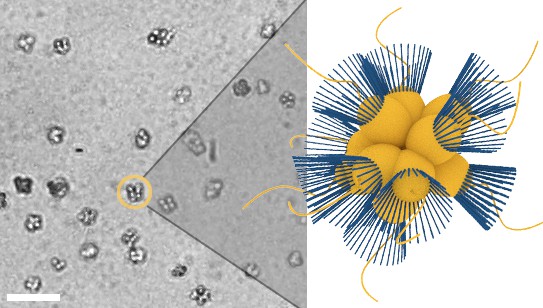
Micrograph of S. rosetta colonies (left) with schematic illustration (right, collars in blue).
Scale bar: 50 µm. Cell body diameters are ~5 µm.
Figure 2
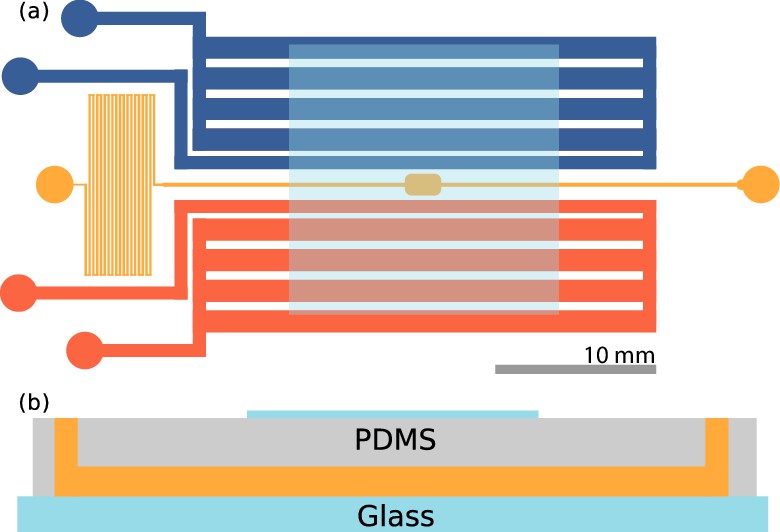
Microfluidic device.
(a) Top view of the device. The sample channel (yellow) is loaded with culture and observed in the middle chamber. The side channels (red, blue) are gas channels in which oxygen and nitrogen may be flown. Scale bar: 10 mm. (b) Side view of the device. PDMS is plasma etched to a glass slide, and a cover slip is plasma etched on top, centered on the imaging chamber, also shown in (a). Thickness of the channels are ≈115 µm.
Figure 3 with 1 supplement
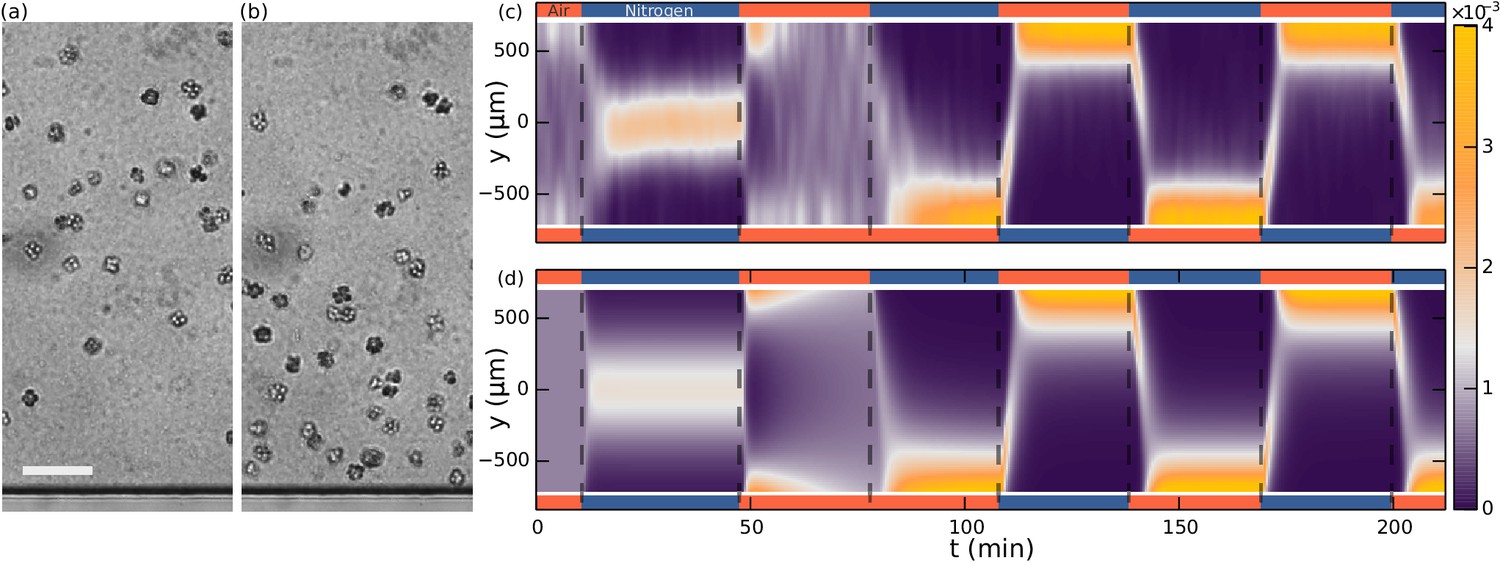
Aerotaxis of S. rosetta colonies.
(a–b) Micrographs near an oxygen-rich wall at twice the resolution of that used in the density experiments. Scale bar: 50 µm (a) Colonies approach a wall where the oxygen-concentration is high. (b) Colonies staying near this wall. (c) Density evolution of S. rosetta during experiment. At each time step the distribution is normalized to a probability distribution [colorbar units in µm−1]. Colors on the side indicate what gas is flowing in that side channel, red for oxygen and blue for nitrogen. Ncolonies~150, concentration ~5 · 106 mL−1. (d) Keller-Segel model with log-concentration input given by Equation 4, D = 865 µm2/s, α = 1850 µm, vdrift = 5.2 µm/s.
Figure 3—figure supplement 1
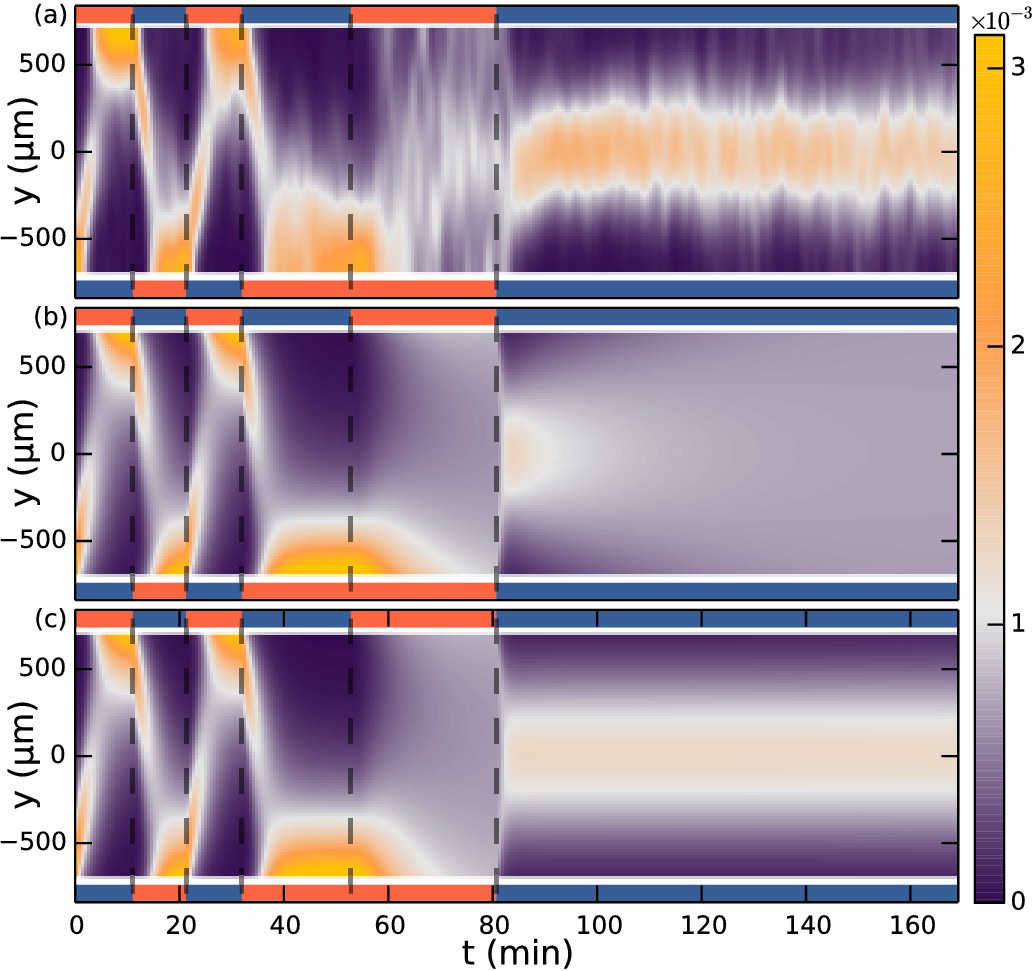
Seperate aerotaxis experiment.
(a) Density evolution of S. rosetta during experiment [colorbar units in µm−1]. , concentration . (b) Keller-Segel model with linear concentration input , with , and otherwise same parameters as in main text Figure 3. (c) Keller-Segel model with log concentration input, same parameters as in main text Figure 3. Experiment and simulation was started in steady-state configuration of oxygen down and nitrogen up.
Figure 4 with 1 supplement
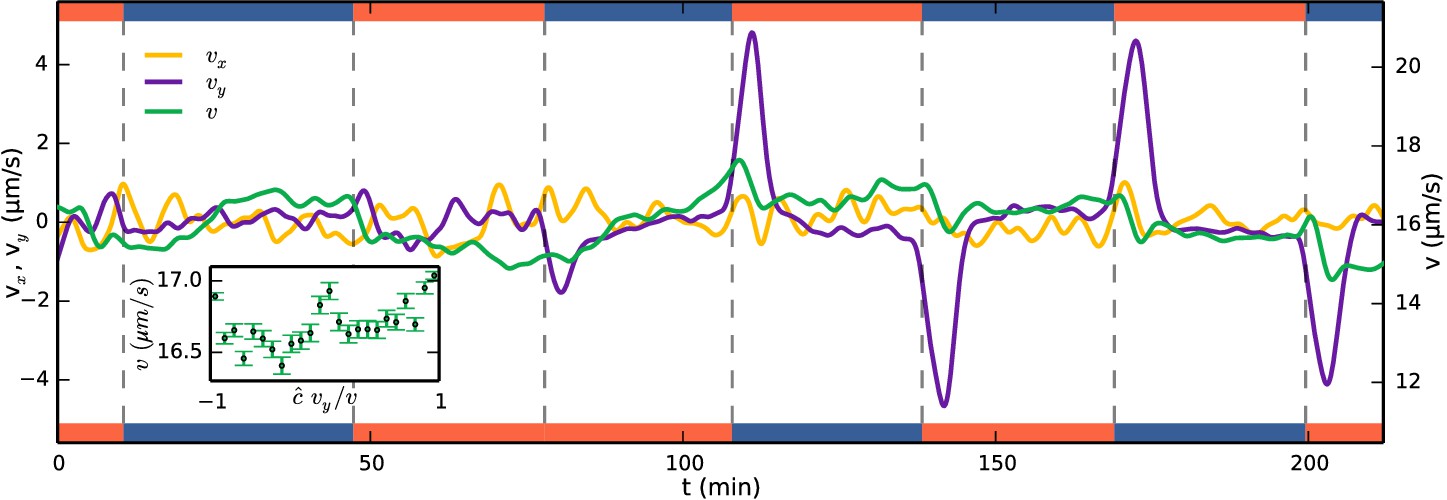
Running mean velocity statistics, showing that the primary mechanism of aerotaxis is not by modulation of swimming speed.
Evolution of mean speed (green, right axis) and velocity in the -direction (yellow, left axis) and -direction (purple, left axis), being along the gradient of oxygen. Left and right axes have equal ranges. Side bars indicate gas flowing, oxygen (red) or nitrogen (blue). The peaks of do not quite reach the true drift velocity due to smoothing of the curves. Inset shows the speed as function of alignment with the gas gradient at times after a swap. if the gradient is up and = −1 if down.
Figure 4—figure supplement 1
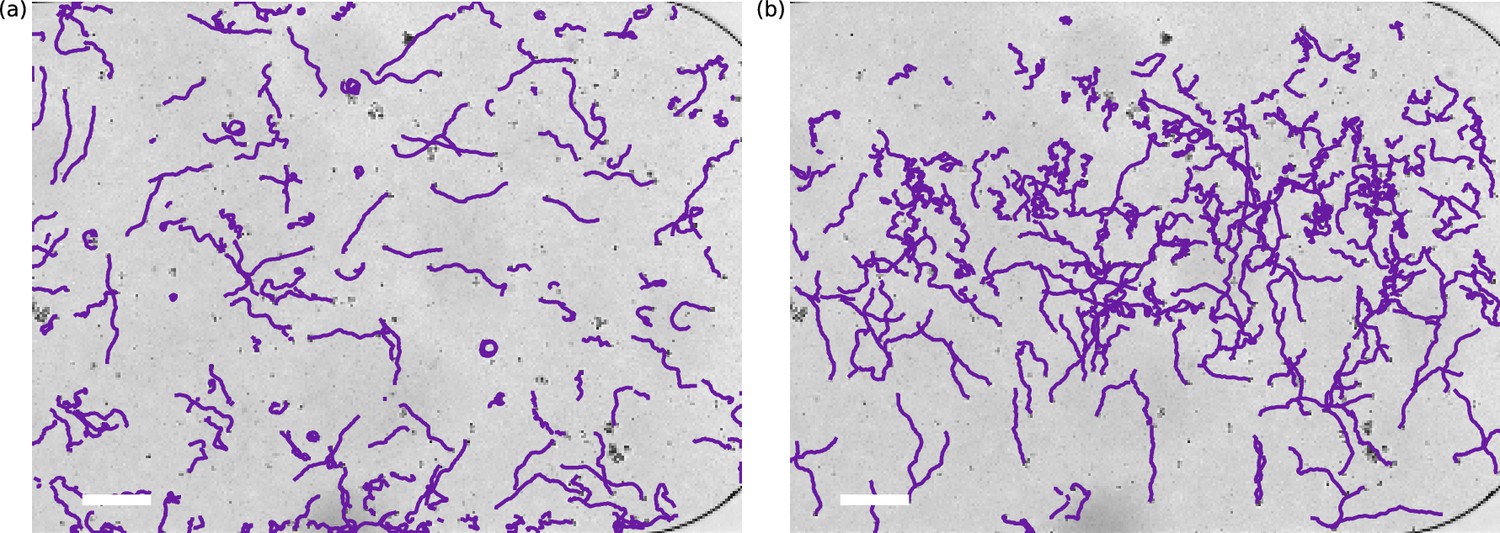
Example tracks.
Trajectories are from the experiment of the main text. (a) t = 70 min. Trajectories at uniform oxygen concentration. (b) t = 142 min. Migration downwards after a swap to oxygen in the lower channel. Tracks were obtained by the algorithm described in methods. Scale bars: 150 µm.
Figure 5
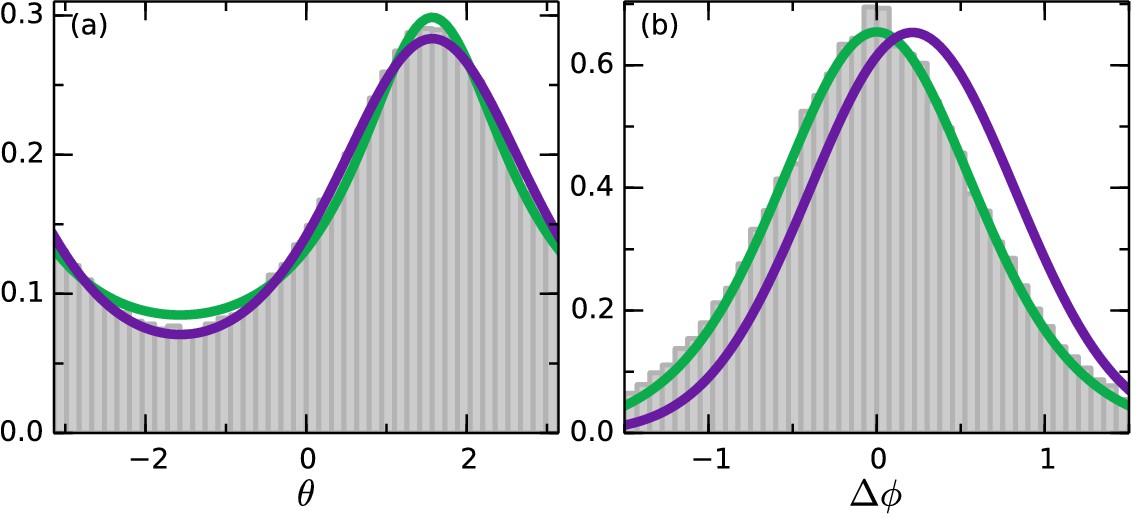
Angle statistics.
Experimental data in grey bars. Deterministic model in purple and stochastic in green. (a) Distribution of . is along the gradient. (b) Change in angle for Δt = 0.65 s. Positive change corresponds to a turn towards the gradient. Deterministic parameters: . Stochastic parameters: .
Figure 6
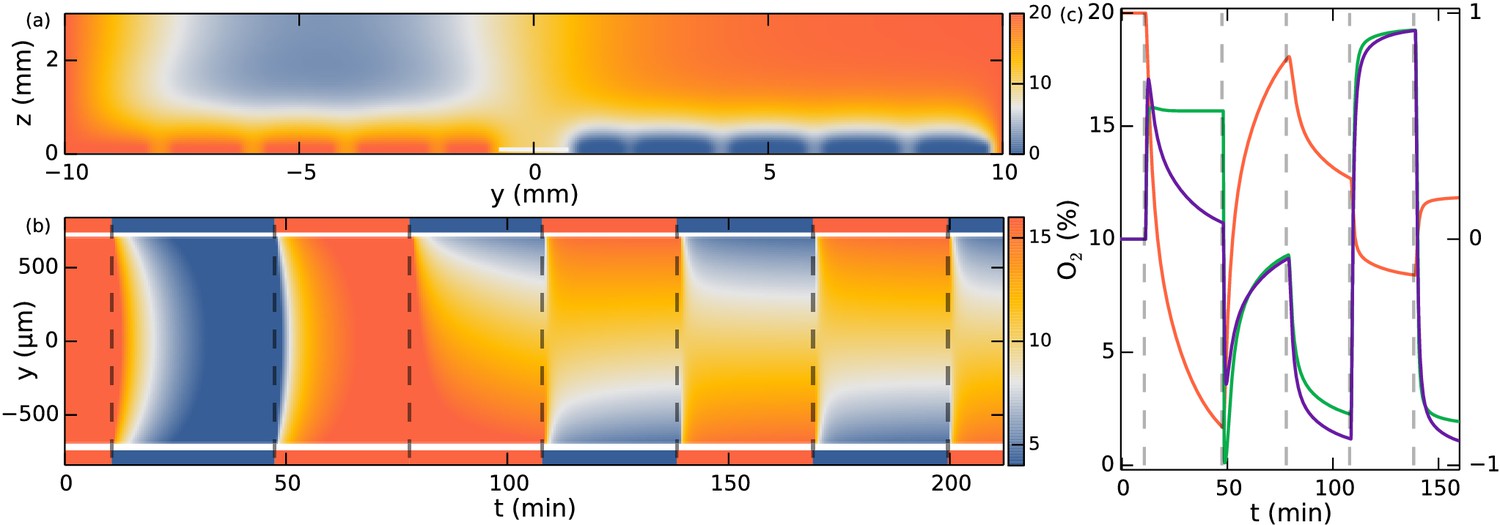
Simulation of oxygen concentration in microfluidic device.
(a) Simulation of 2D cross-section of the device. Oxygen concentration boundary conditions are imposed at the gas channel positions. Snapshot shows t = 110 min, ~1.5 min after the swap. White line indicates evaluation location at the observation chamber. (b) Evolution of oxygen concentration at z = 100 µm. (c) Simulation at y = −250 µm. Oxygen percentage in red (left axis), and spatial gradient in purple normalized to fit in [−1, 1] (right axis), response function in green (right axis).
Figure 7
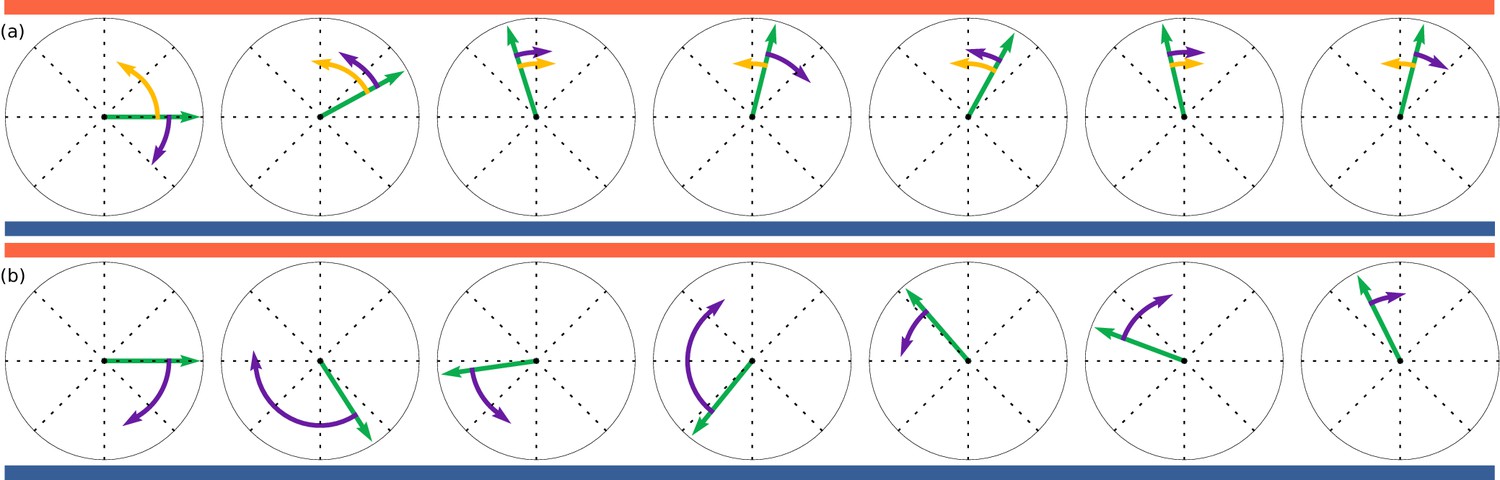
Illustration of deterministic and stochastic strategies based on discretised simulations with exaggerated steps.
Time evolves from left to right. Orientations, shown by green arrows, are trying to align to up-motion, , indicated by red (oxygen) at the top and blue (nitrogen) at the bottom. (a): Deterministic strategy, described by Equation 6. Deterministic part in yellow and stochastic part in purple. The deterministic part is always in the correct direction. (b): Stochastic strategies, described by Equation 7. All steps are stochastic, but largest when furthest away from .
Videos
Video 1
Experimental videos of aerotaxis (top) and oxygen gas simulation (bottom) (as in Figure 6).
Experimental videos are colored by the output of the gas simulation. Colonies migrating from one side to other after a swap of nitrogen and air (138–148 min. in experiment of Figure 3).
Video 2
Colonies migrating from the middle to the sides after a change from nitrogen only in the two gas channels to air only (45–55 min in experiment of Figure 3.
https://doi.org/10.7554/eLife.18109.008Download links
A two-part list of links to download the article, or parts of the article, in various formats.
Downloads (link to download the article as PDF)
Open citations (links to open the citations from this article in various online reference manager services)
Cite this article (links to download the citations from this article in formats compatible with various reference manager tools)
Aerotaxis in the closest relatives of animals
eLife 5:e18109.
https://doi.org/10.7554/eLife.18109


