Intramuscular Neurotrophin-3 normalizes low threshold spinal reflexes, reduces spasms and improves mobility after bilateral corticospinal tract injury in rats
- King's College London, University of London, United Kingdom
- Imperial College London, United Kingdom
Figures
Figure 1 with 4 supplements
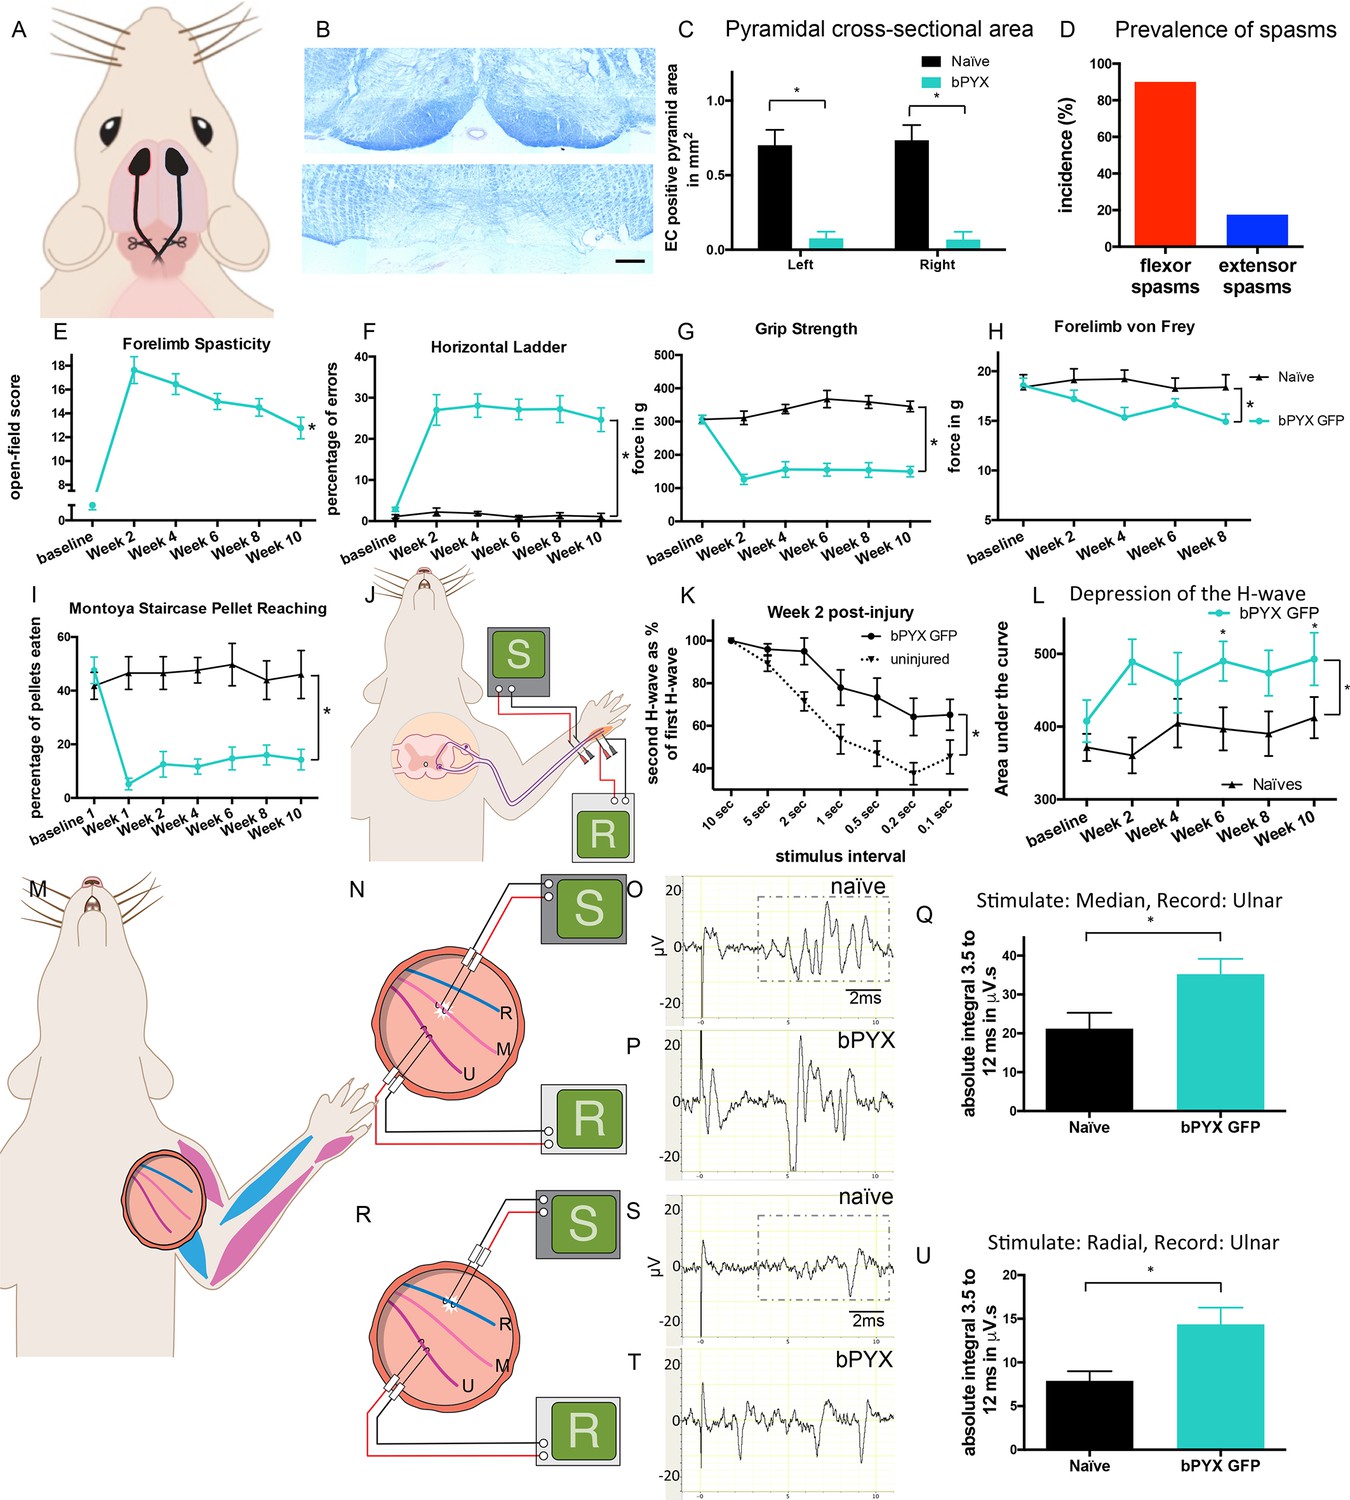
Bilateral transection of the corticospinal tracts in the pyramids resulted in forelimb spasms, impaired walking and caused hyperreflexia.
(A) Schematic of experimental set-up. Rats received a bilateral pyramidotomy (bPYX) and were treated 24 hr post-injury with AAV1-NT3 or AAV1-GFP injections into biceps brachii and distal forelimb flexors and hand muscles. For clarity in describing the consequences of bPYX, Figure 1 shows only data from uninjured naïve rats and from bPYX rats treated with AAV1-GFP (bPYX GFP). (B) Transverse sections of the medullary brainstem were stained with eriochrome cyanine to quantify the cross-sectional area of the pyramids in (upper panel) uninjured naïve rats and (lower panel) bPYX GFP rats. Pyramids are absent in the lower panel. Scale bar: 200 μm. (C) The left and right pyramids were almost completely absent in bPYX GFP rats versus uninjured naïve rats (RM two-way ANOVA, group F = 107.4, p<0.0001; bPYX GFP versus naïve p<0.001). (D) A greater percentage of bPYX GFP rats exhibited flexor spasms than the percentage that exhibited extensor spasms two weeks post-injury. (E) Rats showed abnormal forelimb movements and signs of spasticity in the open field after bPYX (RM two-way ANOVA, group F = 19.8, p<0.001; bPYX GFP baseline versus all post-injury Weeks, paired t-test p-values<0.05). (F) Bilateral pyramidotomy caused rats to make many errors on the horizontal ladder with their treated forelimb as a percentage of the total steps taken (RM two-way ANOVA, group F = 123.4, p<0.001; bPYX GFP vs naïve p<0.0001; bPYX GFP vs naïve at Weeks 2, 4, 6, 8 and 10, p-values<0.05). (G) Unilateral Grip Strength Test. bPYX rats had reduced grip strength with their treated forepaw at Weeks 2, 4, 6, 8 and 10 versus uninjured naïves (RM two-way ANOVA, group F = 145.0, p<0.001; bPYX GFP vs naïve p<0.0001; bPYX GFP vs naïve at Weeks 2, 4, 6, 8 and 10, p-values<0.05). (H) Responses to mechanical stimulation of the treated forepaw were assessed using the automated von Frey test. Bilateral pyramidotomy caused slight mechanical hypersensitivity (RM two-way ANOVA, group F = 5.2, p=0.019; bPYX GFP vs naïve p = 0.003; bPYX GFP versus naïve at Week 4 and 8, p-values<0.05) (I) Montoya Staircase Pellet Reaching Test. This test assesses fine motor function of the distal forelimb. The sucrose pellets that were eaten on the treated side were counted. Bilateral pyramidotomy led to a persistent deficit in dexterity (RM two-way ANOVA, group F = 100.3, p<0.0001; bPYX GFP vs naïve p<0.0001; bPYX GFP versus naïve at weeks 1, 2, 4, 6, 8 and 10 post-injury p-values<0.0001). (J) Schematic showing the H-reflex paradigm. The ulnar nerve was stimulated distally and EMGs were recorded from a homonymous hand muscle (abductor digiti quinti). (K) Frequency-dependent depression: The H-wave was depressed at short inter-stimulus intervals in uninjured naïve rats. Less H-wave depression was observed in bPYX GFP rats two weeks post injury (RM two-way ANOVA, group F = 9.8, p<0.0001; uninjured versus bPYX GFP at 2 s, 1 s, 0.5 s, 0.2 s and 0.1 s inter-stimulus interval p-values<0.05). (L) Data for each rat at each week was analysed by measuring the area under each curve which gives an electrophysiological correlate of hyperreflexia. Bilateral pyramidotomy caused an increase in hyperreflexia relative to uninjured naïve rats at week 2, 4, 6, 8 and 10 (RM two-way ANOVA, group F = 5.9, p<0.001; bPYX GFP versus naïve p = 0.003; bPYX GFP versus naïve at weeks 2, 6 and 10 post-injury, p-values<0.05). (M) At week 10, the radial, median and ulnar nerves were exposed for stimulation and recording. The radial nerve (blue) innervates extensor muscles (blue) whereas the median and ulnar nerves (pink and magenta) innervate synergist flexor muscles (magenta). (N) Stimulation of afferents in the median nerve evoked responses in the (synergist, flexor) ulnar nerve. (O–P) Example traces show recordings from (O) uninjured naïve and (P) bPYX GFP rats. The boxed area highlights polysynaptic compound action potentials which were analysed for Figure 1Q. (Q) The polysynaptic compound action potentials were quantified by measuring the absolute integral (area under the rectified curve) from 3.5 ms to 12 ms. bPYX GFP rats had an increased polysynaptic reflex response (one-way ANOVA F-value = 4.8, p=0.02; bPYX GFP versus naïve, p-value = 0.02). (R) Stimulation of afferents in the radial nerve evoked polysynaptic responses in the (antagonistic) ulnar nerve. (S–T) Representative traces showing recordings from (S) uninjured naïve and (T) bPYX GFP rats. The boxed area highlights polysynaptic compound action potentials which were analysed for Figure 1U. (U) The polysynaptic compound action potentials were quantified by measuring the absolute integral (area under the rectified curve) from 3.5 ms to 12 ms. bPYX GFP rats had increased polysynaptic responses versus uninjured naïve rats (one-way ANOVA F-value = 4.2, p=0.03; bPYX GFP versus naïve, p-value = 0.01). (A–U) n = 10 or 11 per group. Data are represented as mean ± SEM.
Figure 1—figure supplement 1

Lesion cross-sectional areas were similar on the left and right of the medulla.
Eriochrome cyanine staining of transverse sections through the medulla taken 10 weeks after bilateral pyramidotomy showed lesions in bPYX GFP rats (green) relative to naïve rats (RM two-way ANOVA, group F = 43.3, p<0.0001; bPYX GFP vs naïve p-values<0.0001) with similar cross-sectional areas on the left and right side of the brainstem (p-values>0.05). Naïve uninjured rats had no lesion; therefore their mean lesion area equals 0. n = 3 uninjured naïve rats and n = 11 bPYX GFP rats.
Figure 1—figure supplement 2
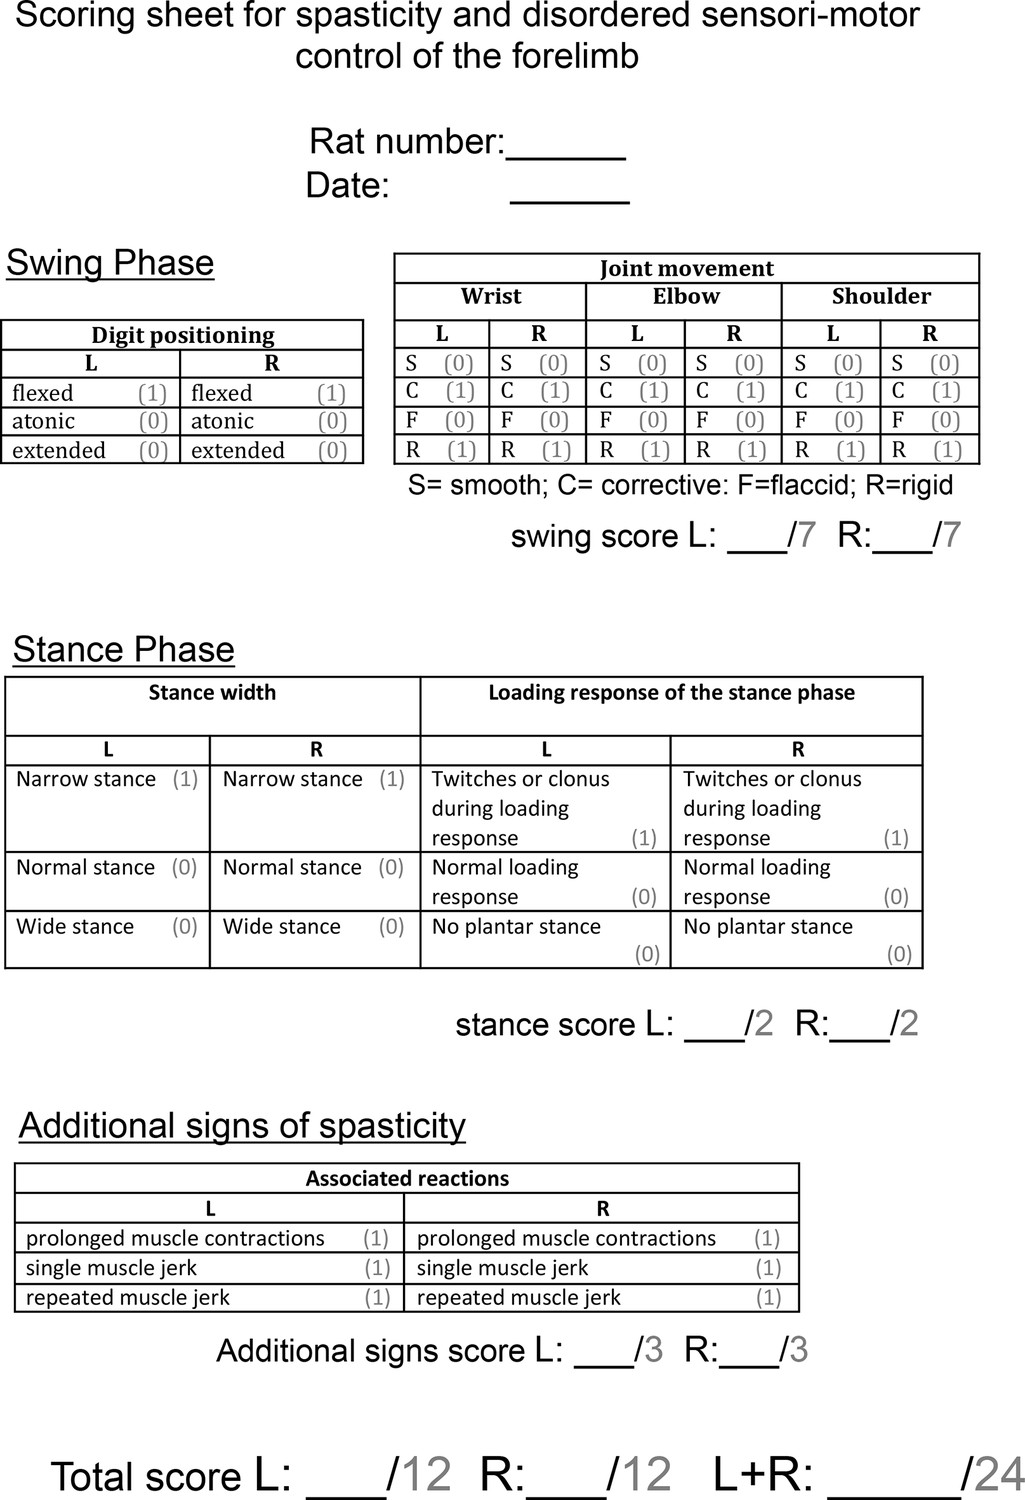
Scoring sheet for spasticity and disordered sensori-motor control of the forelimb.
Abnormal forelimb movements were scored by a blinded observer after rats were videotaped in a Perspex cylinder for 3 min each fortnight. Each sign of spasticity or abnormal forelimb movement can be seen in Video 2. Operational definitions of each behaviour can be found in the Methods section. Each rat could receive a score of up to 24 per week.
Figure 1—figure supplement 3
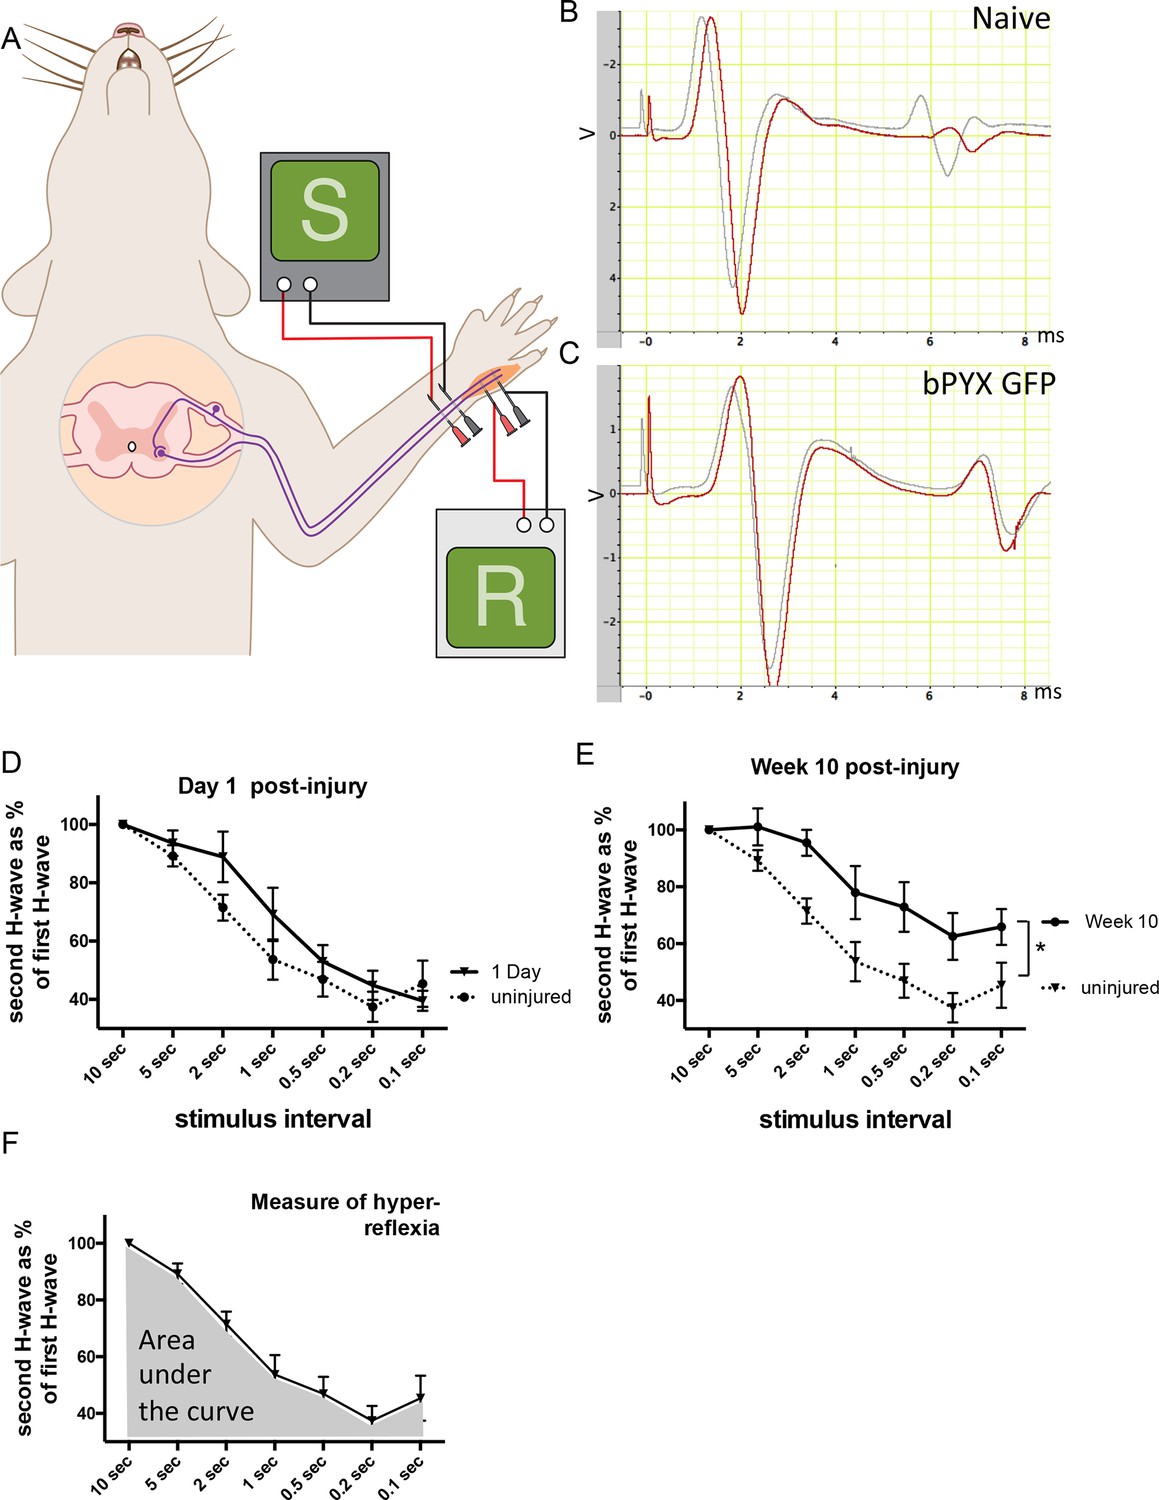
The H reflex undergoes frequency-dependent depression in uninjured naïve rats whereas this is attenuated in rats with bilateral pyramidotomy.
(A) Schematic showing the H-reflex paradigm. The ulnar nerve was stimulated distally and EMGs were recorded from a homonymous hand muscle (abductor digiti quinti). (B–C) A single stimulus evokes an M wave and then an H wave. When the nerve is stimulated twice in quick succession (e.g., inter-stimulus interval of 0.5 s) then the second H wave (shown in red) is smaller than the first H wave (shown in grey). This frequency-dependent depression is greater in (B) uninjured naïve rats than in (C) rats with bilateral pyramidotomy at two weeks post-injury. (D) Graph shows frequency-dependent depression in uninjured naïve rats ('baseline') and in injured rats one day after bilateral pyramidotomy. (This was a separate cohort used during set-up of the electrophysiological paradigm, n = 5). Very little change in frequency-dependent depression can be observed at this time point after injury relative to uninjured naïve rats (RM two-way ANOVA, group F = 1.5, p = 0.24) (E) Graph shows frequency-dependent depression in uninjured rats ('baseline') and the same rats ten weeks after pyramidotomy. (i.e., both traces represent the bPYX GFP cohort shown in Figure 1). Bilateral pyramidotomy caused attenuation of the frequency-dependent depression of the H reflex at 10 weeks post-injury (RM two-way ANOVA, group F = 8.5, p = 0.009; uninjured versus bPYX GFP at 2 s, 1 s, 0.5 s, 0.2 s and 0.1 s inter-stimulus interval p-values<0.05). (F) The extent of frequency-dependent depression was quantified by measuring the area under each curve for inter-stimulus intervals between 10 s and 0.1 s (i.e., the grey shaded area) for each rat. Graph shows group mean plus SEM of the bPYX GFP rats at baseline testing before injury (n = 11).
Figure 1—figure supplement 4
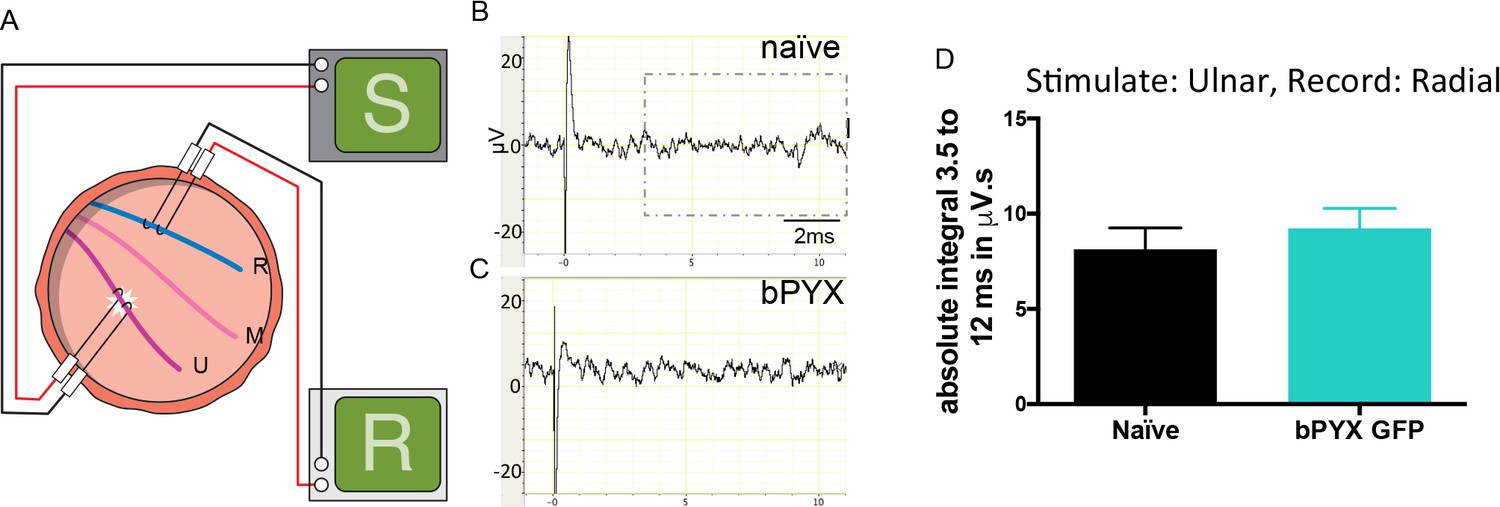
Polysynaptic reflex responses recorded from the radial nerve after ulnar nerve stimulation were not changed after injury.
(A) Stimulation of afferents in the ulnar nerve evoked few or no responses in the (antagonistic, extensor) radial nerve. (B–C) Representative traces showing recordings from (B) uninjured naïve and (C) bPYX GFP rats. The boxed area highlights polysynaptic compound action potentials which were analysed for Figure 1—figure supplement 4D. (D) The polysynaptic compound action potentials were quantified by measuring the absolute integral (area under the rectified curve) from 3.5 ms to 12 ms. bPYX GFP rats had no (increased) polysynaptic responses versus uninjured naïve rats (one-way ANOVA F-value = 0.3, p=0.71). (A–D) n = 10 or 11 per group. Data are represented as mean ± SEM.
Figure 2 with 2 supplements
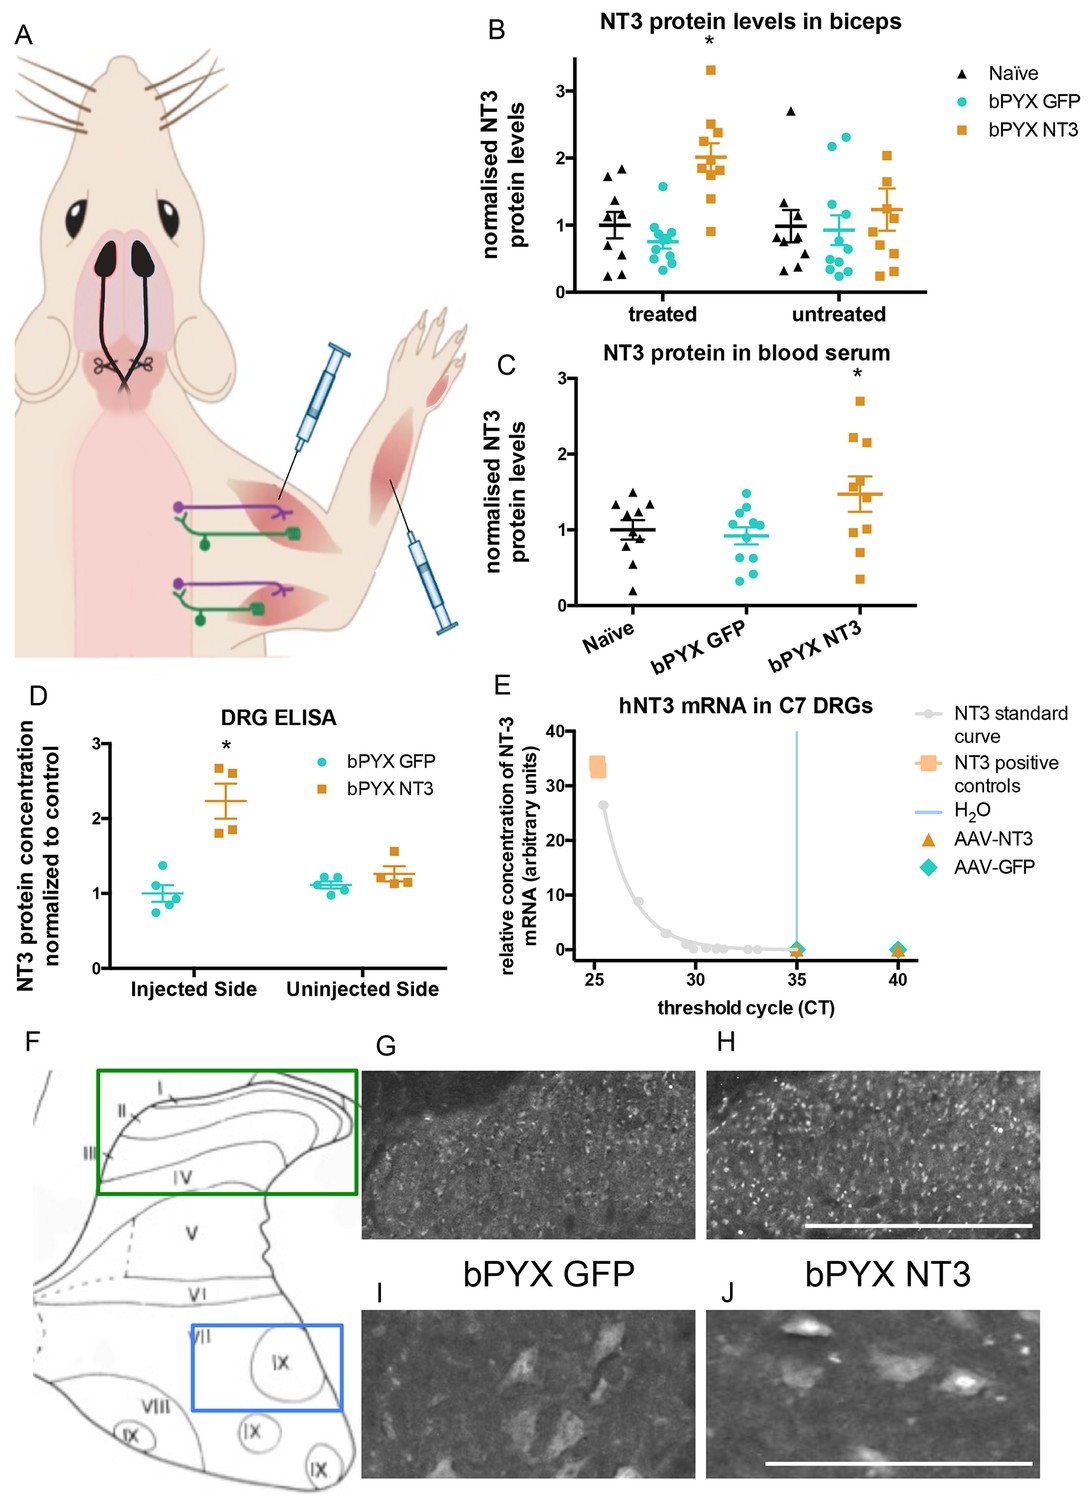
Increased levels of neurotrophin-3 in muscle and blood post-injection of AAV1 neurotrophin-3 into forelimb muscles.
(A) Schematic showing experimental set-up. Rats received bilateral pyramidotomies and were injected either AAV1-NT3 or AAV1-GFP into forelimb muscles. The monosynaptic proprioceptive reflexes are shown. Group Ia afferents project from the muscle via their cell bodies in the DRG into the spinal cord. Motor neurons project to the muscles. (B) ELISAs confirmed that neurotrophin-3 is upregulated in the biceps brachii 10 weeks post-injection with AAV1-NT3 (n = 10/11 per group, RM two-way ANOVA, group F = 7.2, p = 0.003, post-hoc analysis revealed an increase only on the injected side of the bPYX NT3 group versus naïve or bPYX GFP, p-values<0.05). (C) The Neurotrophin-3 level in the blood serum was also increased after AAV1 NT-3 treatment (one-way ANOVA, F-value = 3.4, p=0.047, bPYX NT3 versus naïve or bPYX GFP, p-values<0.05). (D) A separate cohort of rats was injected with either AAV1-GFP or AAV1-NT3 into forelimb muscles. ELISAs of C3 to C8 DRGs showed a 2.3 fold increase of NT3 only in DRGs from the side ipsilateral 4 weeks after injections (n = 4/5 per group, one-way ANOVA, F = 34.13, p<0.001, AAV-NT3 injected side versus all other groups, p-values<0.05). (E) qRT-PCR for human NT-3 mRNA confirms that the viral vector is not transported retrogradely to the DRG. Human neurotrophin-3 mRNA was detected in positive control samples (human brain cDNA) and in the standard curve but not detected in the ipsilateral (left) DRGs at 4 weeks after injection of AAV-NT3 or AAV-GFP (n = 5 per group). The x-axis shows the cycle at which signal rose above background threshold (CT) versus the y-axis which shows the concentration of human NT-3 cDNA with a standard curve plotted through points of the standard. Samples from AAV-NT3 and AAV-GFP groups had CT values ≥35 (comparable to water as No Template Control), indicating absence of human NT-3 mRNA in those samples. (F–J) Transverse cervical spinal cord sections were immunostained for NT3. There was increased immunoreactivity in dorsal horn neurons (compare H with G) and in the nuclei of motor neurons in laminae XI (compare J with I) in the AAV-NT3 group versus AAV-GFP group although we did not detect increased levels of NT3 protein in the spinal cord overall, see Figure 2—figure supplement 2. Scale bars 0.5 mm. (B–E) Data are represented as mean ± SEM.
Figure 2—figure supplement 1
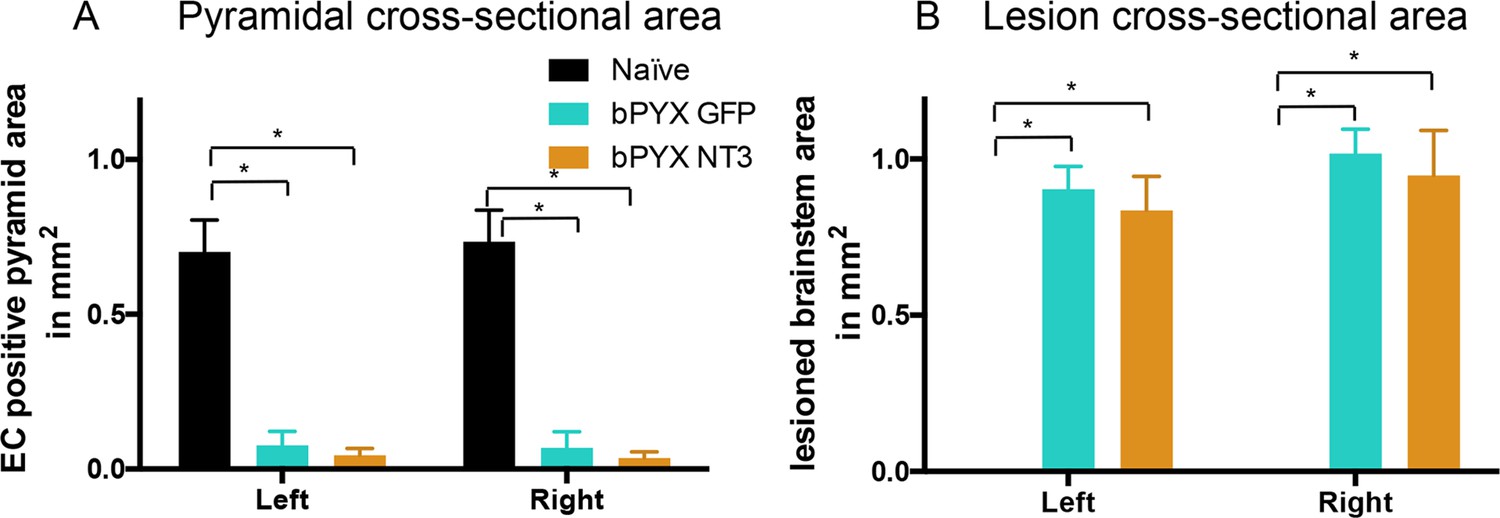
Lesion cross-sectional areas were similar on the left and right of the medulla in both bPYX groups.
(A–B) Eriochrome cyanine staining of transverse sections through the medulla taken 10 weeks after bilateral pyramidotomy. (A) Uninjured naïve rats showed intact pyramids on the left and right whereas bPYX GFP and bPYX NT3 rats showed essentially complete loss of the pyramids on the left and right (RM two-way ANOVA, group F = 107.4, p<0.0001; bPYX vs NT3 p-values>0.05) (B) bPYX GFP and bPYX NT3 rats showed lesions with similar cross-sectional areas on the left and right side of the brainstem (RM two-way ANOVA, group F = 43.3, p<0.0001; bPYX vs NT3 p-values>0.05). Naïve uninjured rats had no lesion; therefore the mean lesion area equals 0. Estimated lesion areas in injured animals were slightly larger than the pyramidal cross-sectional area in uninjured naïves, compare to (A). (A–B) n = 10 or 11 per group.
Figure 2—figure supplement 2
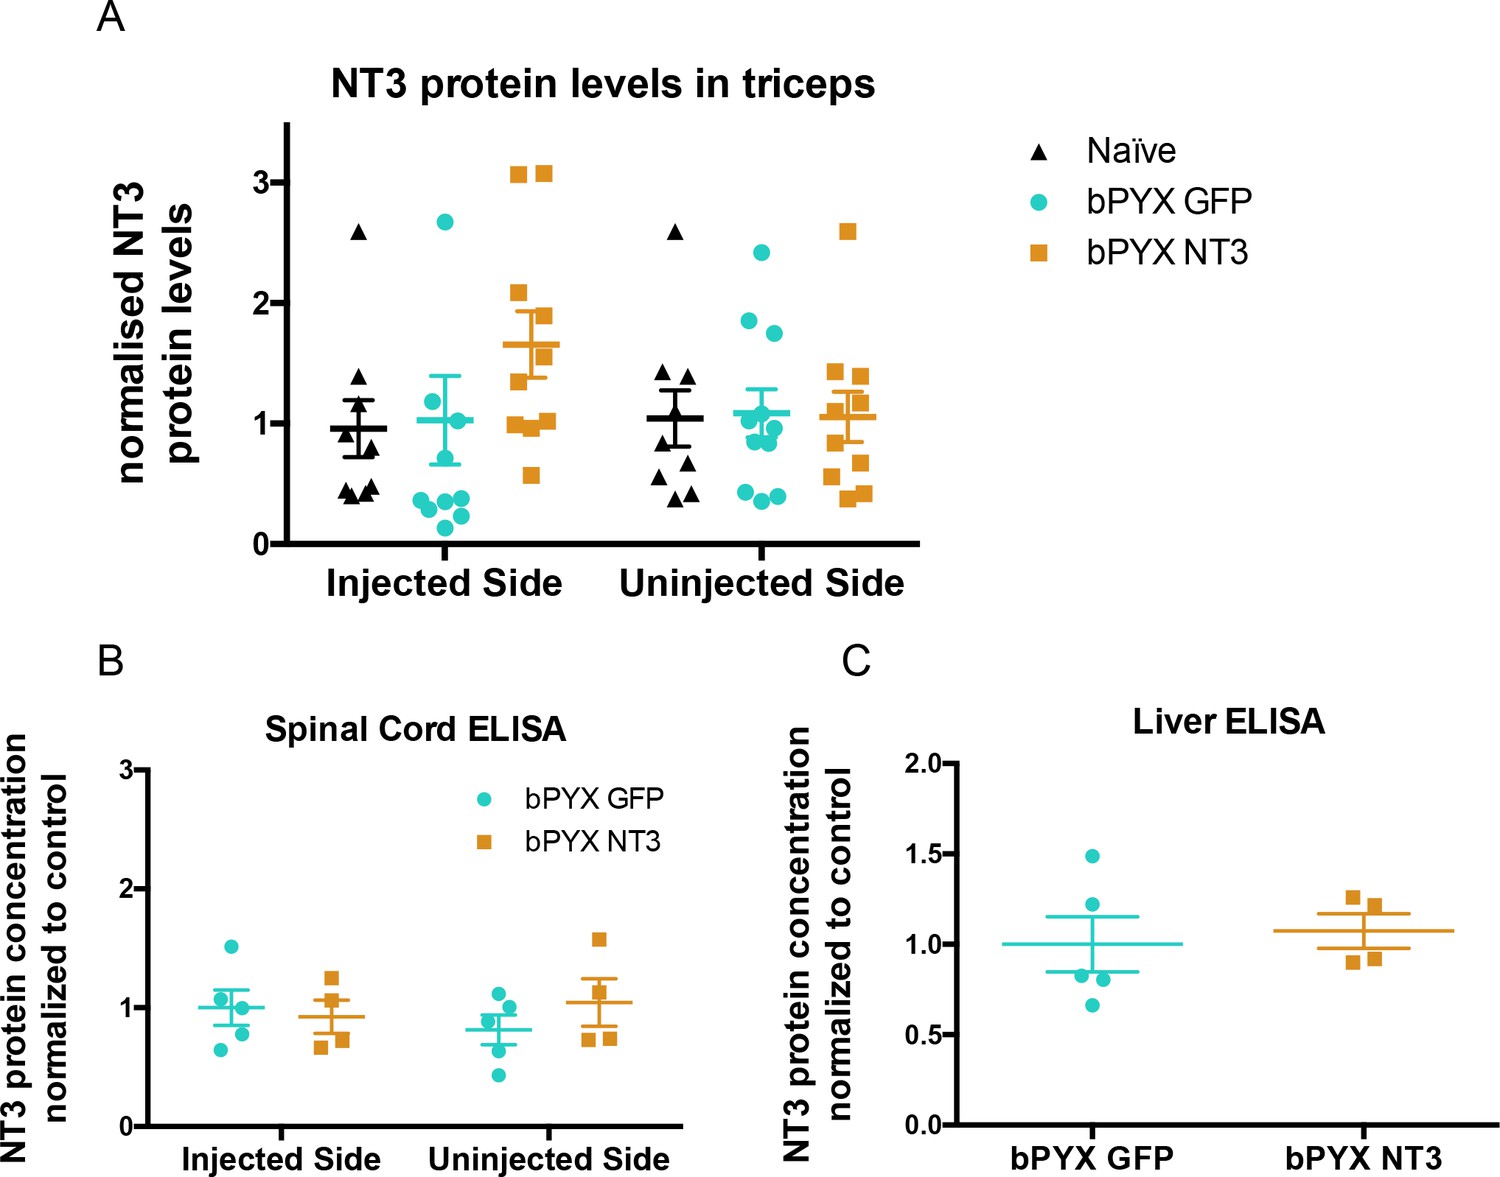
No increased levels of neurotrophin-3 in homogenates of triceps brachii, spinal cord or liver after injections of an AAV expressing neurotrophin-3 into the biceps brachii and other forelimb flexors.
(A) ELISAs showed that there was no significant difference between groups in the level of Neurotrophin-3 protein in the triceps brachii extensor muscles on the ipsilateral side or contralateral side 10 weeks after AAV neurotrophin-3 treatment consistent with injection only into flexors. However, there was a non-significant trend towards increased neurotrophin-3 in the triceps ipsilateral to the treated side (n = 10/11 per group, RM two-way ANOVA, group F = 1.2, p=0.83, group*side F = 0.9, p = 0.42). (B) ELISAs were performed for hemi-spinal cords using tissue from the additional cohort. No overall increase of neurotrophin-3 in either the ipsilateral or contralateral hemi-cords was detected after AAV1 NT-3 injection into forelimb muscles 3 (n = 5/4 per group, RM two-way ANOVA, group F = 0.13, p=0.72, group*side F = 4.1, p = 0.08). (C) ELISA showed that Neurotrophin-3 levels were not increased in the liver (n = 5/4 per group, unpaired t-test, t = 0.38, p = 0.71).
Figure 3 with 1 supplement
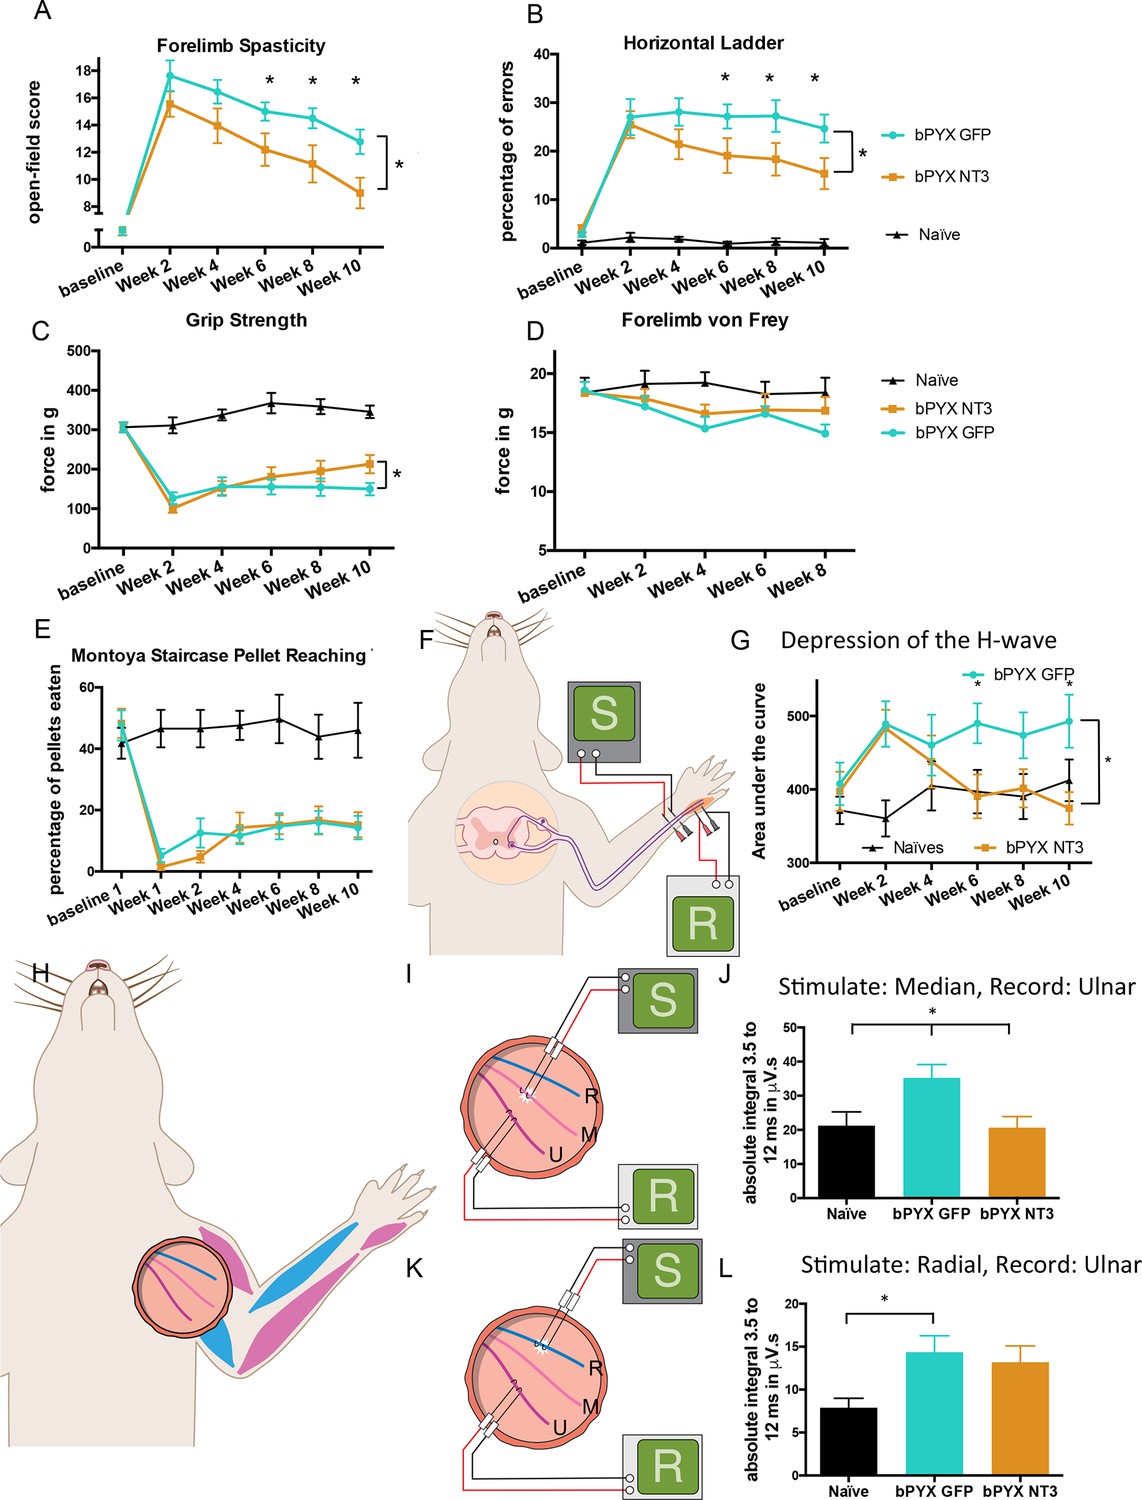
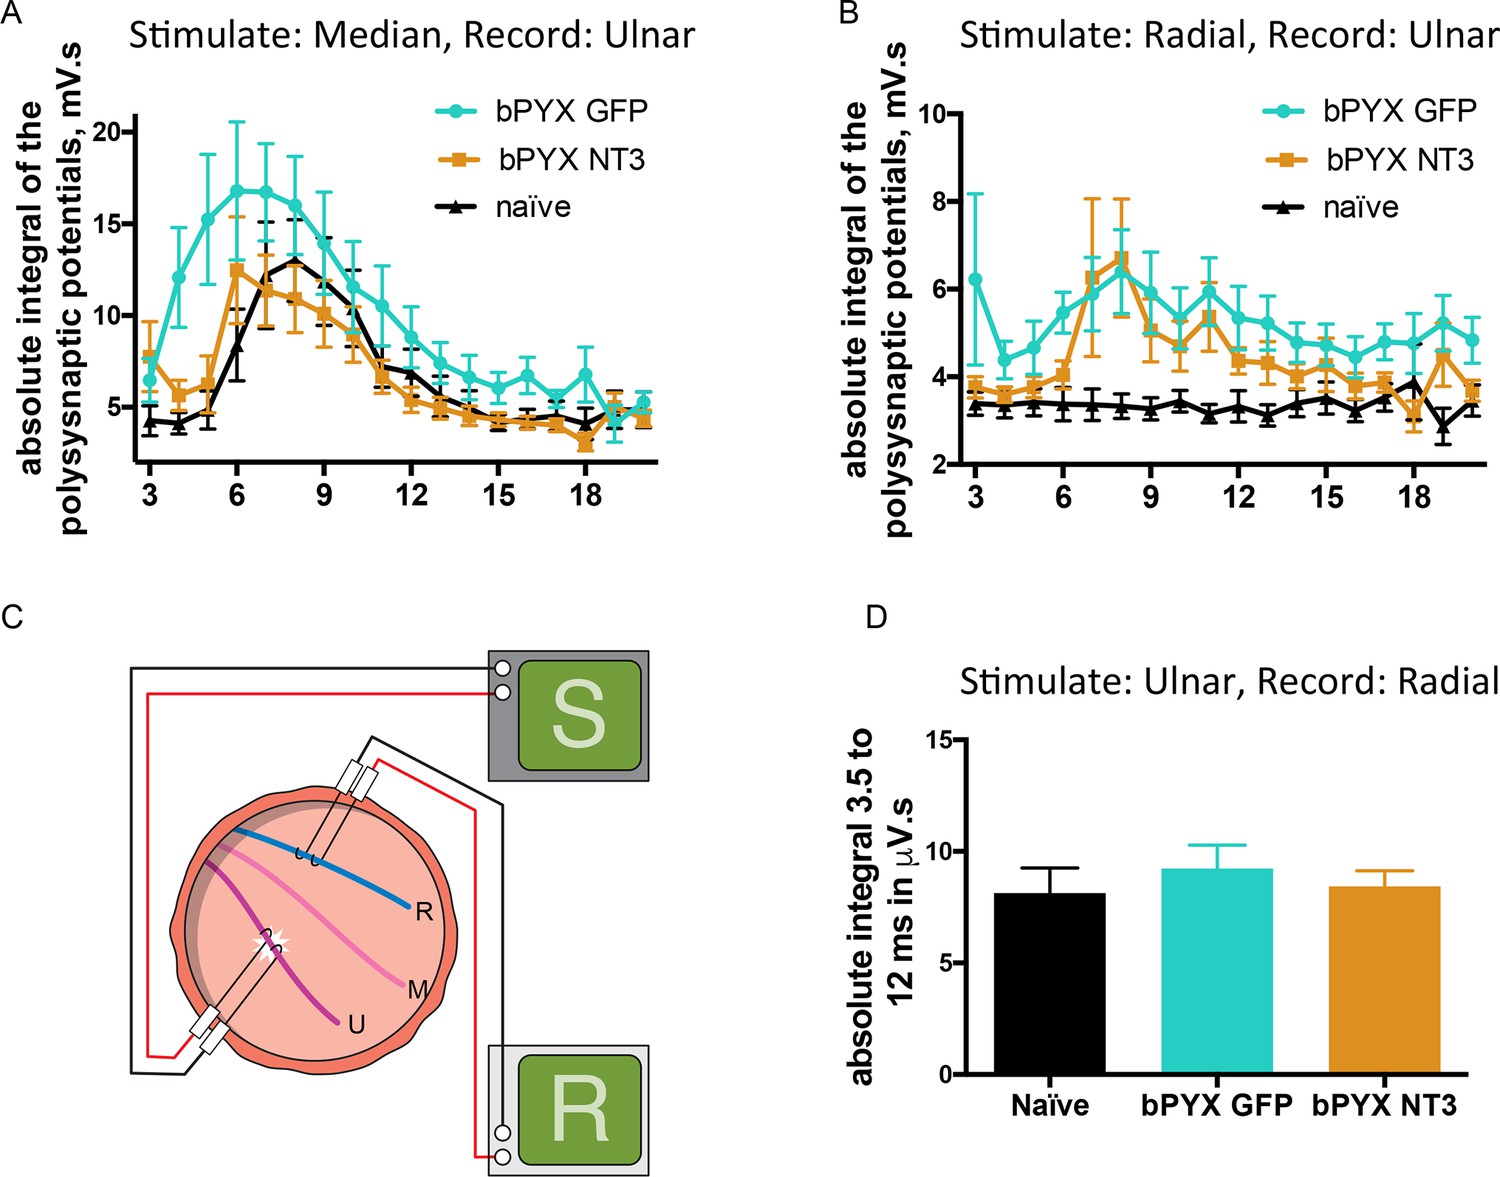
Intramuscular Neurotrophin-3 treatment improved functional recovery and reduced spasms after bilateral pyramidotomy.
Please note that for clarity in describing our model of spasticity, Figure 1 contained information from Figure 3 relating to the uninjured naïve and bPYX GFP groups. (A) Neurotrophin-3 treatment reduced signs of spasticity (RM two-way ANOVA, group F = 19.8, p<0.001; bPYX NT3 versus bPYX GFP at Week 6, 8 and 10, p-values<0.05). (B) Neurotrophin-3 caused rats to make fewer errors on the horizontal ladder with their treated forelimb as a percentage of the total steps taken (RM two-way ANOVA, group F = 123.4, p<0.001; bPYX NT3 versus bPYX GFP p<0.0001; bPYX NT3 versus bPYX GFP at Week 6, 8 and 10, p-values<0.05). (C) Unilateral Grip Strength Test. Neurotrophin-3 treatment slightly improved grip strength of the treated forepaw at 10 weeks (RM two-way ANOVA, group F = 145.0, p<0.001; bPYX NT3 vs bPYX GFP p = 0.11; bPYX NT3 vs bPYX GFP at Week 10, p-value = 0.026). (D) Cutaneous mechanical hypersensitivity was not affected by NT3 treatment assessed using the automated von Frey test (RM two-way ANOVA, group F = 5.2 p=0.019; bPYX NT3 versus bPYX GFP p = 0.29). (E) Dexterity was assessed using the staircase test. The two treatment groups were impaired relative to uninjured naïve rats, and no differences were detected between two treatment groups post-injury (RM two-way ANOVA, group F = 100.3, p<0.0001; bPYX NT3 versus bPYX GFP p = 0.69) confirming that the corticospinal tract is essential for recovery of fine motor function (Weidner et al., 2001). (F) Schematic showing the H-reflex paradigm. The ulnar nerve was stimulated distally and EMGs were recorded from a homonymous hand muscle (abductor digiti quinti). (G) Graph shows changes over time in hyper-reflexia, measured as the area under the curve of the frequency-dependent depression (Figure 1—figure supplement 3F). Injury groups had exaggerated reflexes from 2 weeks post-injury, but NT3 treated rats had normal H-wave depression from 6 weeks onwards. (RM two-way ANOVA, group F = 5.9 p<0.001; bPYX NT3 versus bPYX GFP p = 0.024; bPYX NT3 versus bPYX GFP at Week 6 and 10, p-values<0.05). (H) At week 10, the radial, median and ulnar nerves were exposed for stimulation and recording. The radial nerve (blue) innervates extensor muscles (blue) whereas the median and ulnar nerves (pink and magenta) innervate synergist flexor muscles that were injected with AAV (pink and magenta). (I) Stimulation of afferents in the median nerve evoked responses in the (synergist, flexor) ulnar nerve (J) The polysynaptic compound action potentials were quantified by measuring the absolute integral (area under the rectified curve) from 3.5 ms to 12 ms. Neurotrophin-3 treatment restored the exaggerated reflexes to normal (one-way ANOVA F-value = 4.8, p=0.02, bPYX NT3 versus bPYX GFP, p-values = 0.01) (K) Stimulation of afferents in the radial nerve evoked polysynaptic responses in the (antagonistic) ulnar nerve. (L) The polysynaptic compound action potentials were quantified by measuring the absolute integral (area under the rectified curve) from 3.5 ms to 12 ms. Neurotrophin-3 treatment did not restore the exaggerated reflexes to normal (one-way ANOVA F-value = 4.2, p=0.03, bPYX NT3 versus bPYX GFP, p-values = 0.63) (A–L) n = 10 or 11 per group. Data are represented as mean ± SEM.
Figure 3—figure supplement 1
Changes in polysynaptic reflexes after bilateral pyramidotomy and with Neurotrophin-3.
(A) The polysynaptic reflex responses were recorded from the ulnar while stimulating the median nerve. The polysynaptic compound action potentials were quantified by measuring the absolute integral (area under the rectified curve) separately for each ms bin (i.e. 3.0 ms to 4.0 ms, 4.0 ms to 5.0 ms etc). bPYX GFP rats had an increased and slightly earlier response, but no longer lasting reflexes. bPYX NT3 rats had a normalized response (i.e., similar to uninjured naïve rats, n = 10 per group). (B) The polysynaptic reflex responses were recorded from the ulnar while stimulating the radial nerve. The polysynaptic compound action potentials were quantified by measuring the absolute integral (area under the rectified curve) separately for each ms bin (i.e., 3.0 ms to 4.0 ms, 4.0 ms to 5.0 ms, etc). bPYX GFP and bPYX NT3 rats had an increased polysynaptic response (n = 10 per group). Note y-axis scale is different in A and B. (C) Stimulation of afferents in the ulnar nerve evoked few or no responses in the (antagonistic, extensor) radial nerve. (D) The polysynaptic compound action potentials were quantified by measuring the absolute integral. Polysynaptic reflex responses were not increased after bilateral pyramidotomy or modified with neurotrophin-3 treatment (area under the rectified curve) from 3.5 ms to 12 ms (one-way ANOVA F-value = 0.3, p=0.71). (A–D) n = 10 or 11 per group. Data are represented as mean ± SEM.
Figure 4 with 1 supplement

Neurotrophin-3 treatment restored balance between excitatory and inhibitory causes of spasticity.
(A–D) Ia boutons were identified by vGluT1 immunolabelling (green) and motor neurons were traced retrogradely with Fast Blue or Cholera Toxin beta (blue) in (B) uninjured naïve rats, (C) bPYX GFP rats and (D) bPYX NT3 rats. C8, scale bar: 20 µm. (E) bPYX caused an increase in vGluT1 boutons in close proximity to motor neurons. Neurotrophin-3 reduced the number of boutons to normal (two-way-ANOVA, group F = 33.5 p<0.001; bPYX GFP versus naïve or bPYX NT3, p-values<0.05). (F) The number of vGluT1 boutons of afferents from the ulnar nerve (CTb traced) increased on radial but not ulnar motor neurons after bilateral pyramidotomy, which was normalized with NT3 treatment (RM two-way-ANOVA, group F = 4.6, p = 0.01, motor neurons F = 4.2, p = 0.047; radial MNs bPYX GFP versus naïve or bPYX NT3, p-values<0.05). (G) Proprioceptive afferent boutons (vGluT1, green) receive pre-synaptic inhibition from boutons immunopositive for the vesicular GABA transporter (vGAT, red) in (H) uninjured naïve rats, (I) bPYX GFP rats and (J) bPYX NT3 rats. C8 transverse spinal cord sections, scale bar 10 µm. Yellow arrows indicate putative pre-synaptically inhibited vGluT1 synapses. (K) Injury led to a reduction in vGluT1 boutons receiving presynaptic inhibition whereas NT3 restored levels of presynaptic inhibition (one-way ANOVA, F = 3.6 p = 0.042; bPYX GFP versus naïve or bPYX NT3, p-values<0.05). (E,F,K) n = 10 or 11 per group. Data are represented as mean ± SEM.
Figure 4—figure supplement 1
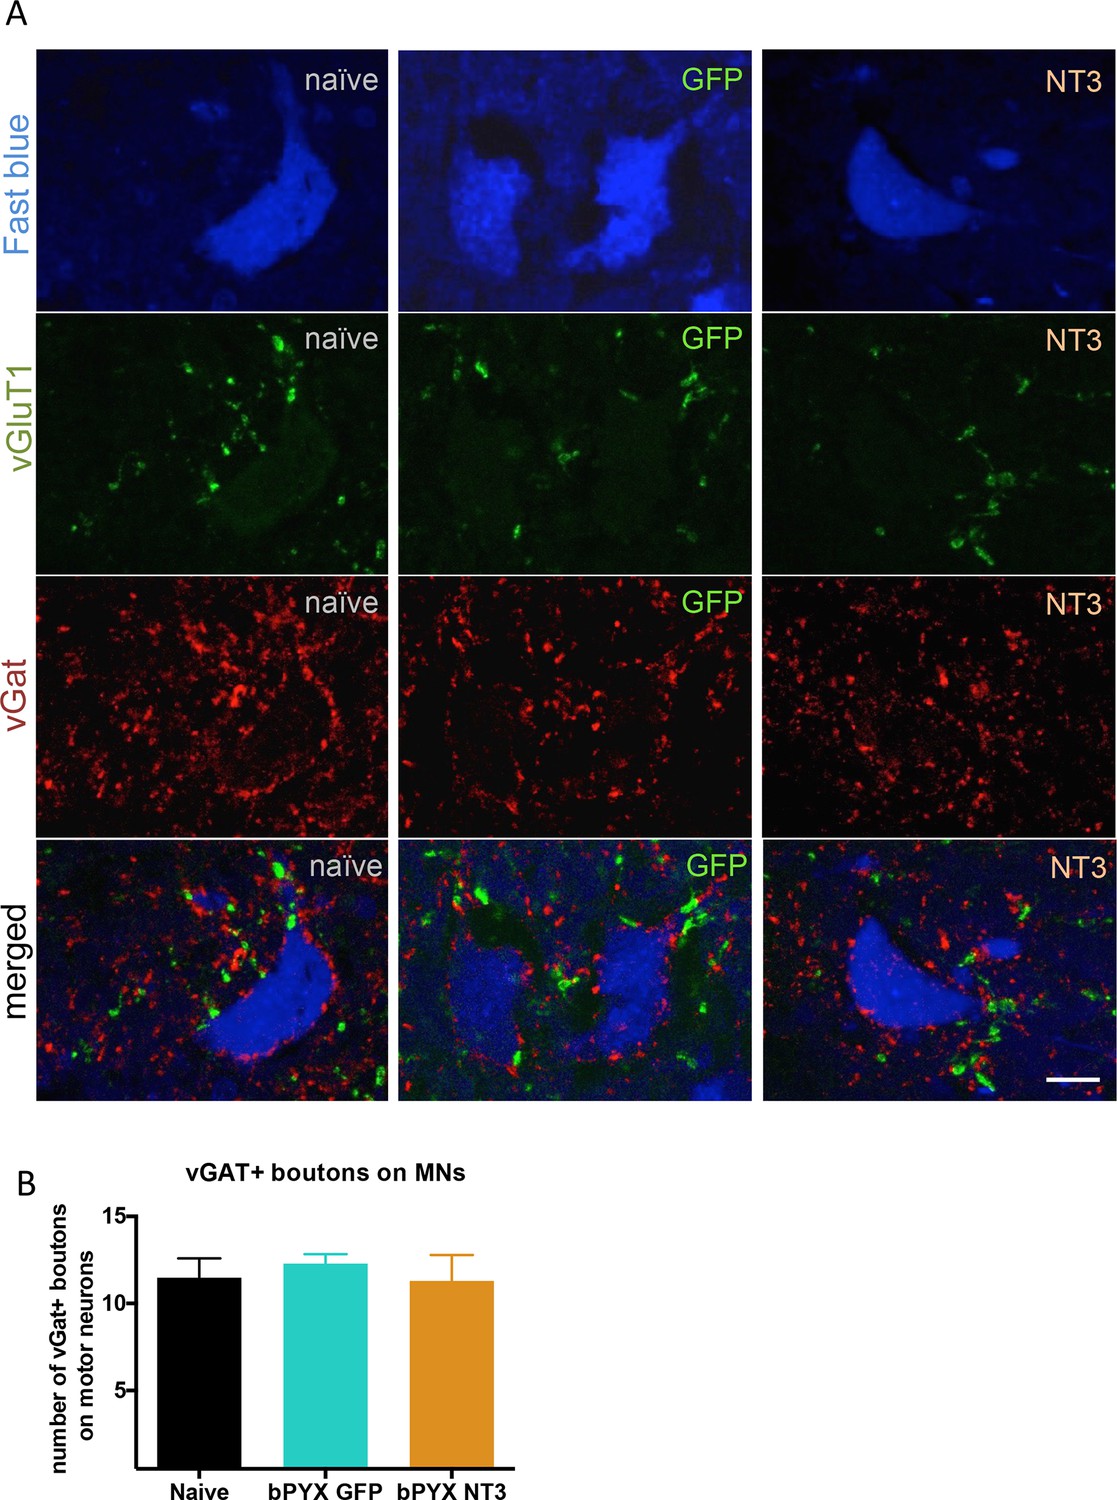
The density of inhibitory boutons directly onto motor neurons did not change with injury or neurotrophin-3 treatment.
(A) Motor neurons were retrogradely traced with Fast blue or CTb (blue) on the treated side. Transverse spinal sections of C7/8 were immunolabeled with antibodies against vGluT1 (green) and vGAT (red). Scale bar: 20 µm. (B) Quantification revealed that the density of vGAT+ boutons onto motor neurons did not change (one-way ANOVA F-value = 0.26, p=0.78). n = 10 per group.
Figure 5 with 1 supplement
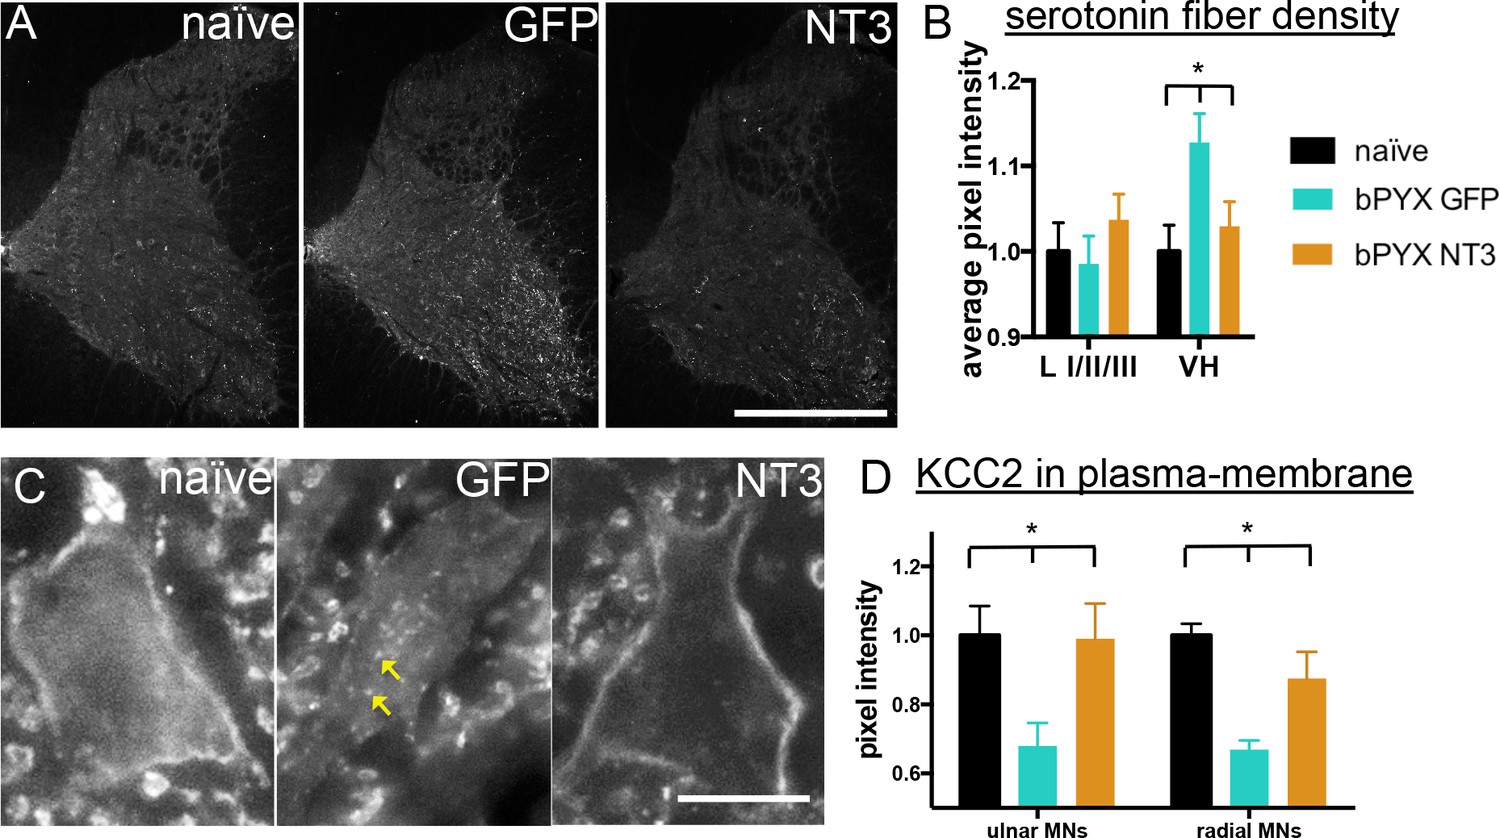
Neurotrophin-3 treatment normalised serotonergic innervation of the C7/8 spinal cord and the ion transporter KCC2 in motor neuron membranes to normal.
(A) Representative images of C7/8 spinal cords on the treated side immunolabelled for serotonin in uninjured naïve, bPYX GFP and bPYX NT3 rats. Scale bar: 1 mm. (B) Serotonergic pixel intensity in Ventral Horn (laminae VII-IX) was increased after injury, but NT3 treatment restored this to normal levels (RM two-way ANOVA, group*horn interaction F = 3.5 p = 0.037; Ventral Horn bPYX GFP versus naïve or bPYX NT3, p<0.05). Pixel intensities in the dorsal horn (laminae I-III) did not change. (C–D) KCC2 immunolabeling: methods can be found in Figure 5—figure supplement 1 The pixel intensity of KCC2 across the plasma membrane of motor neurons was decreased after injury but accumulations of KCC2 were seen intracellularly (yellow arrows). KCC2 was normalized by NT3 (RM two-way ANOVA, group F = 10.2, p<0.001; bPYX GFP versus naïve or bPYX NT3, p-values<0.05). Scale bar, 20 µm. (B, D) n = 10 or 11 per group. Data are represented as mean ± SEM.
Figure 5—figure supplement 1
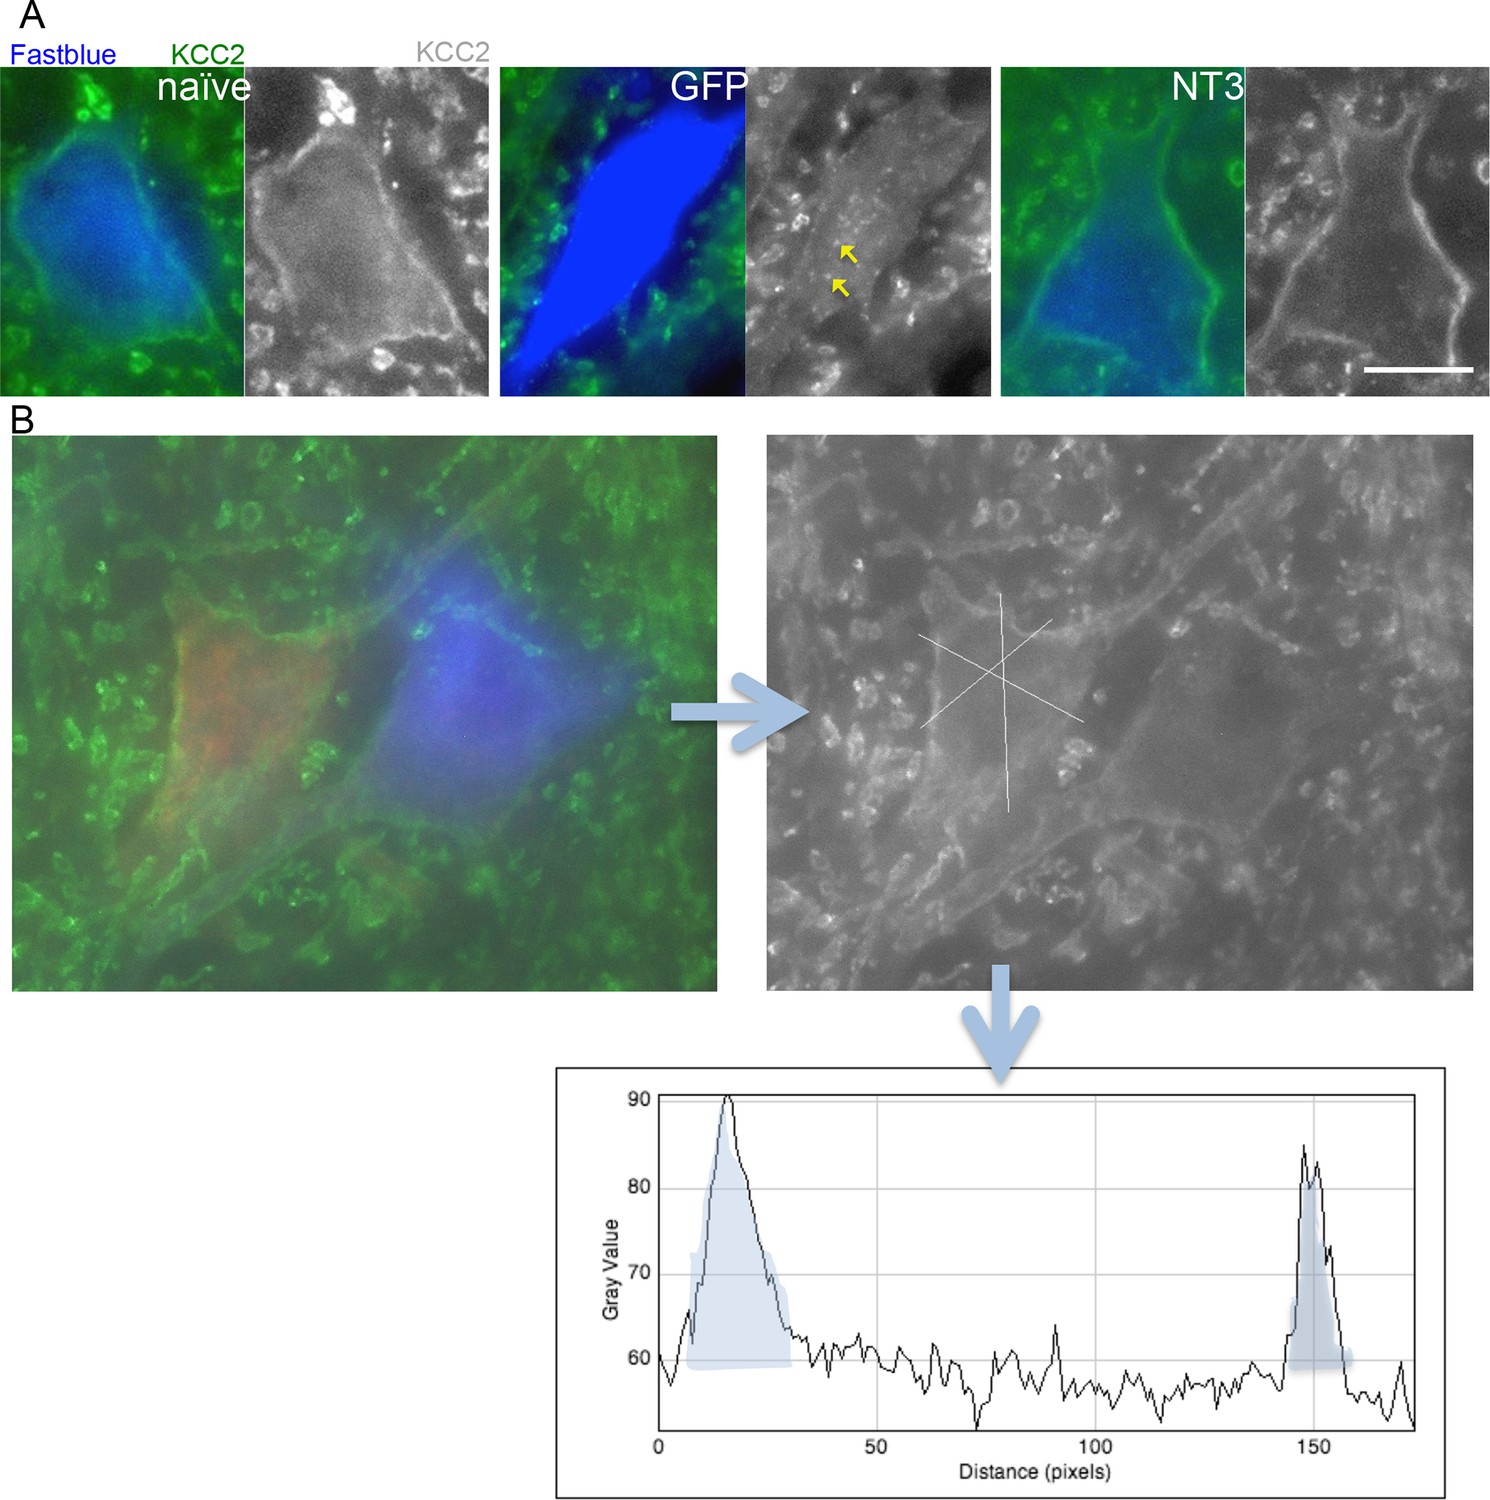
Analysis of KCC2 in the membrane of motor neurons.
(A) Images of retrogradely traced motor neurons stained for KCC2. Scale bars 20 µm. Uninjured naïve and bPYX NT3 rats had a high immunoreactivity in the membrane. This was not observed in bPYX GFP animals, although accumulations were seen within the cell somata. (B) Analysis of KCC2 immunoreactivity in the plasma membrane: Motor neurons were first identified by retrogradely labeling them with Cholera Toxin B (ulnar nerve) or Fast blue (radial nerve). Once identified, 3 cross-sectional lines were drawn across the motor neurons and pixel intensities were measured along the lines. Each area under the curve, bounded where the line crosses the membrane (shaded in grey above), was measured as indicated below. Thus, 6 values for each motor neuron were measured, which were averaged before further analysis.
Figure 6
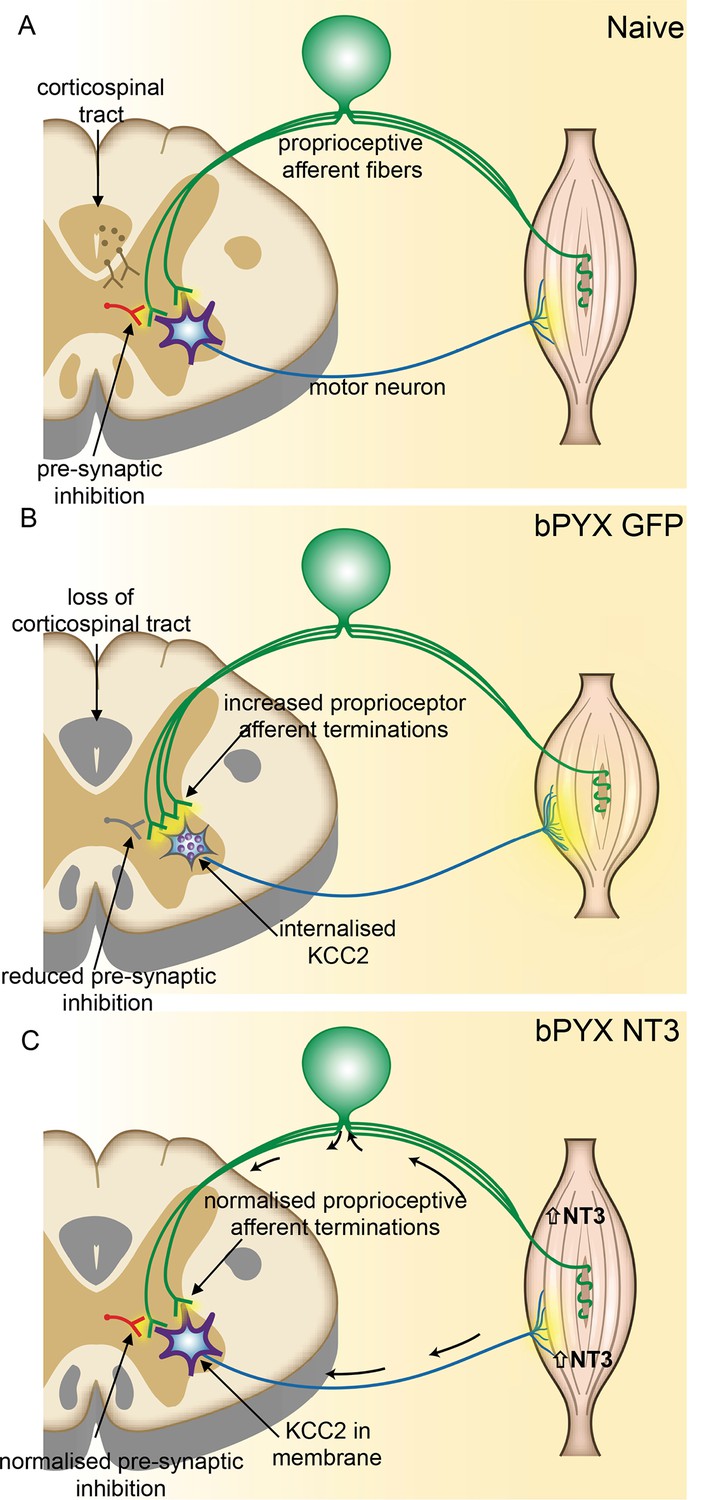
Spinal hyper-excitability causing hyperreflexia, spasms and disordered sensorimotor control is normalized by intramuscular Neurotrophin-3 treatment.
(A) In uninjured healthy conditions, there is a balance between excitatory (afferent and descending) networks, pre-synaptic inhibition and motor neuron excitability. (B) After loss of corticospinal innervation, there is a loss of specificity in connections between proprioceptive afferents, spinal interneurons and motor neurons. Indeed, excitatory (afferent) terminations in the spinal cord are increased in number and there is a reduction in molecular markers of pre-synaptic inhibition upon proprioceptive afferents. We propose that this causes increased spinal excitability. Moreover, KCC2 is internalized from the membrane of motor neurons rendering them more excitable. Together, these result in increased spinal reflexes, hallmarks of spasticity. (C) Injection of AAV-NT3 into flexor muscles causes trafficking of NT3 to the cervical DRG by retrograde transport (and, possibly, to a lesser extent, by systemic transport). Treatment normalizes the pattern of proprioceptive afferent terminations and restores pre-synaptic inhibition upon proprioceptive afferents. NT3 is also retrogradely transported to motor neurons where KCC2 levels are normalized in the membrane. Multiple spinal reflexes involving treated muscles are normalized. We propose that this is the result of restored specificity of connections between proprioceptive afferents and appropriate motor neurons and normalised motor neuron excitability. Abnormal forelimb movements including spasms are reduced and walking on the ladder is improved. In conclusion, delayed intramuscular treatment with AAV-NT3 results in neurophysiological, molecular and behavioural improvements after CNS injury.
Videos
Video 1
Open-field movements shown by an uninjured naïve rat (Supplementary to Figure 1 and Experimental Procedures).
Rats are placed in a 50 cm diameter Plexiglas cylinder and videotaped for 3 min every fortnight. See Supplementary Figure 1—figure supplement 2 for scoring system. During swing, forepaw digits are extended. Joint movements in the forelimb are smooth and linear. Forepaws are placed slightly medial to the shoulders and the loading response in stance phase is normal, i.e. stance initiated with a single placing movement with immediate weight bearing. When rearing without wall contact, the rats regulate their balance fully through the hind-paws and tail; distal forelimbs are held parallel to the floor. During swing, hindpaws are not raised above the lowest point of the belly. Tail twitches are not seen.
Video 2
Open-field scoring of spasticity and disordered sensorimotor forelimb movements of rats with bilateral pyramidotomies (Supplementary to Figure 1 and Experimental Procedures).
Rats exhibiting signs of disordered sensorimotor control have their forepaw digits in a flexed position during swing phase presumably because of hypertonic flexor muscles in the forepaw. Movements of the wrist, elbow and shoulder are corrective (swing trajectory is non-linear) and rigid during swing phase. Stance is narrower compared to controls, with forepaws aligning rostrocaudally or with forepaws crossing over. Furthermore, during the loading response of the stance phase, the forepaw makes multiple contacts as weight bearing starts (muscle jerks causing a 'dampened bounce'). Rats display 'associated reactions', such as single muscle jerks, prolonged muscle contractions and repeated muscle jerks. All these behaviours were scored with the forelimb scale shown in Figure 1—figure supplement 2. Videos show a number of different rats at a range of time points after CNS injury.
Video 3
Additional signs and associated features of spasticity and disordered sensorimotor movements (Supplementary to Figure 1 and Experimental Procedures).
The behaviours shown in this video were not scored as part of the forelimb scale, but were frequently observed. Rats with bilateral pyramidotomy displayed prolonged forelimb muscle contractions and repeated muscle jerks when rearing. Furthermore, stepping with hindlimbs is abnormally high during swing phases (likely to due to increased activation of iliopsoas and other hip flexors) and the hindlimb heels are frequently incompletely placed down. Rats have tail twitches and are unstable during rearing.
Tables
Table 1
Properties of the M-wave and H-reflex (Supplementary to Figures 1 and 3). Values (mean ± SEM) are given for motor threshold, M-wave and H-wave latencies and maximum amplitudes, maximum depression of H-wave. The maximum depression of the H-wave is different between bPYX GFP and bPYX NT3 animals (n = 10 to 11/group, Two-way RM ANOVA, group F = 6.9, p<0.001, group*week F = 2.3 p = 0.047; post-hoc analysis revealed differences between uninjured naïve rats and bPYX GFP or bPYX NT3 at Week 2, bPYX GFP and bPYX NT3 or uninjured naïve rats at Week 6, 8 and 10, Fisher's LSD, p-values *<0.05, **<0.01, ***<0.001, ****<0.0001).
| baseline | Week 2 | Week 4 | Week 6 | Week 8 | Week 10 | ||
|---|---|---|---|---|---|---|---|
| Motor threshold (mA) | naïve | 1.14 ± 0.2 | 2.25 ± 0.5 | 2.13 ± 0.5 | 2.01 ± 1.5 | 2.27 ± 0.4 | 3.45 ± 0.5 |
| bPYX GFP | 1.83 ± 0.3 | 1.26 ± 0.2 | 1.71 ± 1.4 | 2.42 ± 0.5 | 2.15 ± 0.4 | 2.05 ± 1.6 | |
| bPYX NT3 | 1.28 ± 0.2 | 1.33 ± 0.3 | 2.06 ± 0.4 | 1.62 ± 0.3 | 1.79 ± 0.5 | 2.04 ± 0.5 | |
| M-wave latency (ms) | naïve | 0.96 ± 0.0 | 0.95 ± 0.1 | 0.85 ± 0.0 | 0.88 ± 0.0 | 0.97 ± 0.1 | 1.13 ± 0.1 |
| bPYX GFP | 0.92 ± 0.1 | 0.91 ± 0.1 | 0.98 ± 0.0 | 0.99 ± 0.1 | 0.91 ± 0.0 | 1.01 ± 0.1 | |
| bPYX NT3 | 0.99 ± 0.1 | 0.89 ± 0.0 | 1.24 ± 0.3 | 0.98 ± 0.1 | 0.94 ± 0.1 | 1.12 ± 0.1 | |
| maximum M-wave (mV) | naïve | 7.23 ± 0.9 | 6.76 ± 0.5 | 5.53 ± 0.4 | 4.76 ± 0.5 | 4.83 ± 0.5 | 3.31 ± 0.4 |
| bPYX GFP | 6.34 ± 0.8 | 6.94 ± 0.9 | 8.34 ± 0.7 | 5.84 ± 0.7 | 6.92 ± 0.6 | 4.93 ± 0.7 | |
| bPYX NT3 | 7.89 ± 0.8 | 6.25 ± 0.7 | 4.82 ± 1.0 | 6.08 ± 0.7 | 3.74 ± 0.4 | 4.32 ± 0.5 | |
| H-wave latency (ms) | naïve | 5.66 ± 0.1 | 5.60 ± 0.1 | 5.39 ± 0.1 | 5.42 ± 0.1 | 5.69 ± 0.1 | 5.97 ± 0.1 |
| bPYX GFP | 5.48 ± 0.1 | 5.24 ± 0.1 | 5.67 ± 0.1 | 5.55 ± 0.4 | 5.42 ± 0.1 | 5.60 ± 0.2 | |
| bPYX NT3 | 5.22 ± 0.1 | 5.30 ± 0.2 | 5.80 ± 0.3 | 5.48 ± 0.1 | 5.36 ± 0.2 | 5.40 ± 0.1 | |
| maximum H-wave (mA) | naïve | 1.34 ± 0.2 | 1.46 ± 0.3 | 1.09 ± 0.2 | 1.22 ± 0.2 | 1.31 ± 0.2 | 0.92 ± 0.2 |
| bPYX GFP | 1.60 ± 0.3 | 3.50 ± 0.7 | 2.84 ± 0.5 | 2.48 ± 1.8 | 2.72 ± 0.6 | 1.94 ± 0.5 | |
| bPYX NT3 | 2.43 ± 0.5 | 2.15 ± 0.4 | 1.53 ± 0.3 | 2.01 ± 0.3 | 1.41 ± 0.2 | 1.63 ± 0.2 | |
| maximum H-wave (%) | naïve | 19.5 ± 8.0 | 21.7 ± 3.3 | 19.7 ± 3.5 | 29.9 ± 6.5 | 26.5 ± 3.0 | 31.2 ± 5.8 |
| bPYX GFP | 29.5 ± 6.7 | 46.2 ± 4.7 | 31.9 ± 4.8 | 41.8 ± 5.7 | 40.8 ± 6.2 | 43.8 ± 5.5 | |
| bPYX NT3 | 30.7 ± 5.7 | 38.2 ± 6.5 | 36.8 ± 4.8 | 44 ± 10.7 | 45.3 ± 9.1 | 45.0 ± 8.8 | |
| maximum depression of H-wave | naïve | 24.3 ± 4.2 | 35.9 ± 3.8 **** | 42.7 ± 6.7 | 37.9 ± 7.3 | 34.7 ± 6.6 | 41.0 ± 5.5 |
| bPYX GFP | 38.5 ± 5.9 | 56.4 ± 7.9 | 57.5 ± 8.7 | 61.0 ± 8.c2 *** | 56.3 ± 8.1 * | 62.9 ± 8.3 *** | |
| bPYX NT3 | 37.9 ± 5.9 | 58.9 ± 6.1 | 48.6 ± 8.0 | 37.6 ± 5.8 | 36.5 ± 6.3 | 29.2 ± 3.9 |
-
Table 1: Properties of the M- and H-wave.
Download links
A two-part list of links to download the article, or parts of the article, in various formats.
Downloads (link to download the article as PDF)
Open citations (links to open the citations from this article in various online reference manager services)
Cite this article (links to download the citations from this article in formats compatible with various reference manager tools)
Intramuscular Neurotrophin-3 normalizes low threshold spinal reflexes, reduces spasms and improves mobility after bilateral corticospinal tract injury in rats
eLife 5:e18146.
https://doi.org/10.7554/eLife.18146


