Migratory and adhesive cues controlling innate-like lymphocyte surveillance of the pathogen-exposed surface of the lymph node
- Howard Hughes Medical Institute, University of California, San Francisco, United States
- University of California, San Francisco, United States
- University of Dundee, United Kingdom
Figures
Figure 1
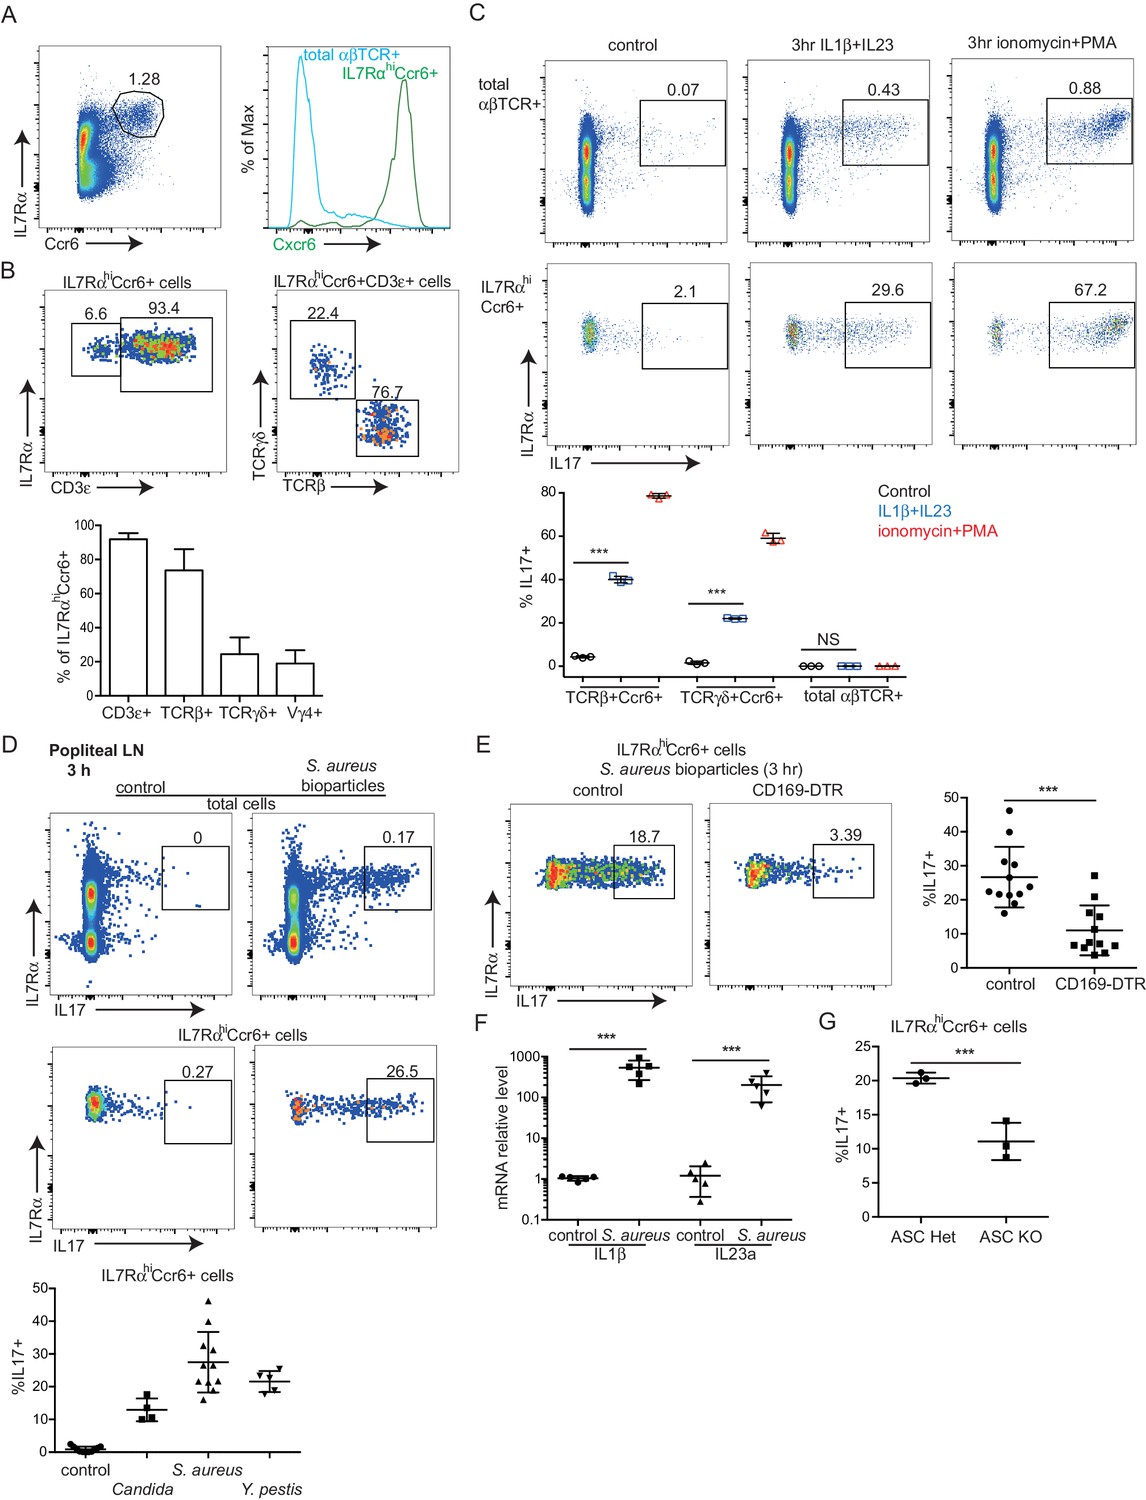
Rapid induction of IL17 expression by IL7RαhiCcr6+ innate-like lymphocytes in a CD169+ macrophage-dependent manner following bacterial and fungal challenge.
(A) Representative FACS plot showing IL7RαhiCcr6+ staining of peripheral LN cells from a Cxcr6GFP/+ mouse, and Cxcr6-GFP intensity on the gated cells. (B) Representative FACS plots showing CD3ε, TCRβ and TCRγδ staining of the IL7RαhiCcr6+ population. Bar graph shows summary frequency data (mean ± sd) for more than 10 mice. (C) Intracellular FACS showing IL17 production among LN cells after 3 hr in vitro stimulation with IL1β and IL23 or phorbol 12-myristate 13-acetate and ionomycin. Graph shows summary data from 3 experiments. (D) Representative FACS plots showing IL17 production among popliteal LN cells 3 hr after footpad challenge with heat inactivated C. albicans, S. aureus coated bioparticles, and attenuated Y. pestis. Summary graph shows% IL17+ cells among IL7RαhiCcr6+ cells. (E) IL17 production by IL7RαhiCcr6+ cells in control and CD169-DTR macrophage ablated mice treated with S. aureus bioparticles as in D, Summary graph shows% IL17+ cells among IL7RαhiCcr6+ cells. (F) Il1b and Il23a mRNA level in popliteal LNs of S. aureus bioparticle challenged mice relative to controls, determined by qRT-PCR. (G) Summary graph to show% IL17+ cells among IL7RαhiCcr6+ cells between control and ASC-deficient mice after 3 hr S. aureus bioparticle challenge. ***p<0.001 by student’s t test. Data are representative of at least two experiments for panels A–C. Data are representative of two or more experiments with at least two mice per group for panels D–G. LN, Lymph node.
Figure 2

IL7RαhiCcr6+ innate-like lymphocytes are mostly LN resident.
(A) Representative FACS plots showing frequency of IL7RαhiCcr6+ and Vγ4+Ccr6+ cells in LNs and blood. Graphs show summary data for more than 30 mice of each type. (B) FACS analysis of LN IL7RαhiCcr6+ cells and naïve αβ T cells in KikGR mice before, immediately after and 24 and 48 hr after photoconversion. Summary data are pooled from three experiments and each point indicates an individual mouse. (C) FACS analysis of LN IL7RαhiCcr6+ cells and naive αβ T cells in GFP-host and GFP+ host from parabiotic pairs. Summary data are pooled from two experiments and each point indicates an individual mouse. **p<0.01, ***p<0.001, by student’s t test. Data are representative for at least two experiments. LN, Lymph node.
Figure 3 with 1 supplement
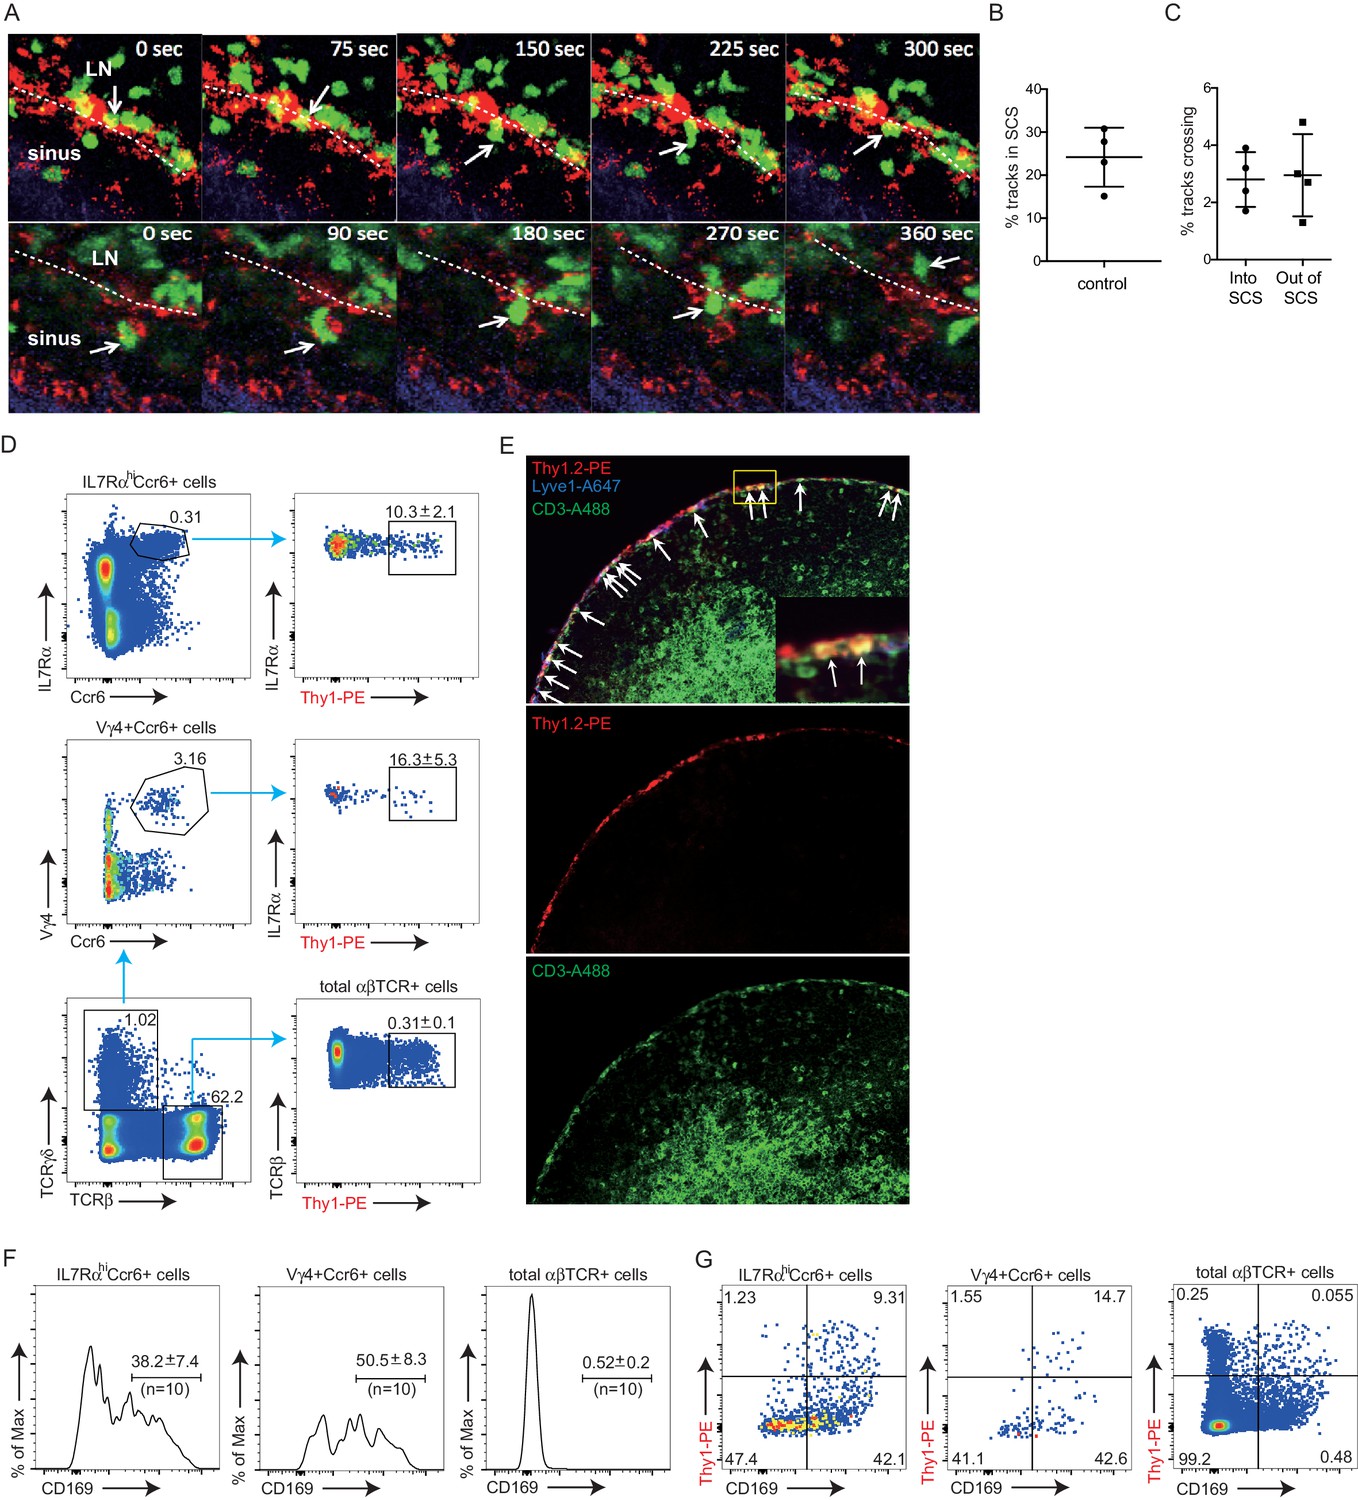
Migration dynamics, sinus exposure and CD169+ macrophage interaction of LN innate-like lymphocytes.
(A) Time series of Cxcr6GFP/+ cell movement with respect to CD169+ SCS macrophages. Upper panels: white arrow indicates a Cxcr6GFP/+ lymphocyte in the LN parenchyma that crosses into the SCS. 300 s time series was taken from a 46 μm z stack. Lower panel: white arrow indicates a Cxcr6GFP/+ lymphocyte that begins in the SCS and crosses into the LN parenchyma. 360 s time series was taken from a 34 μm z stack. Green, Cxcr6-GFP+ lymphocytes; Red, CD169+ macrophages; Blue, second harmonic. White dashed line indicates boundary between SCS and LN parenchyma. (B, C) Percent tracks in SCS compartment among the total tracks enumerated (B) and frequency of tracks crossing from the parenchyma into the SCS or out of the SCS into the parenchyma (C) in Cxcr6GFP/+ control mice. Each point represents data from a single movie (two independent experiments). (D) In vivo 5 min Thy1-PE labeling of IL7RαhiCcr6+ cells, Vγ4+Ccr6+ cells and αβ T cells, analyzed by flow cytometry. Data are representative of at least 10 mice. (E) In vivo Thy1-PE labeling of cells analyzed in tissue sections. Costaining was with CD3-A488 (green) and Lyve1-A647 (blue). White arrows point out Thy1 and CD3 costained cells. (F) Frequency of IL7RαhiCcr6+, Vγ4+Ccr6+ and naive αβ T cells positive for CD169. Data are representative of 10 mice. (G) In vivo Thy1-PE labeling and CD169 staining on IL7RαhiCcr6+, Vγ4+Ccr6+ and naive αβ T cells, analyzed by flow cytometry. Data are representative of at least two experiments in each panel.
Figure 3—figure supplement 1
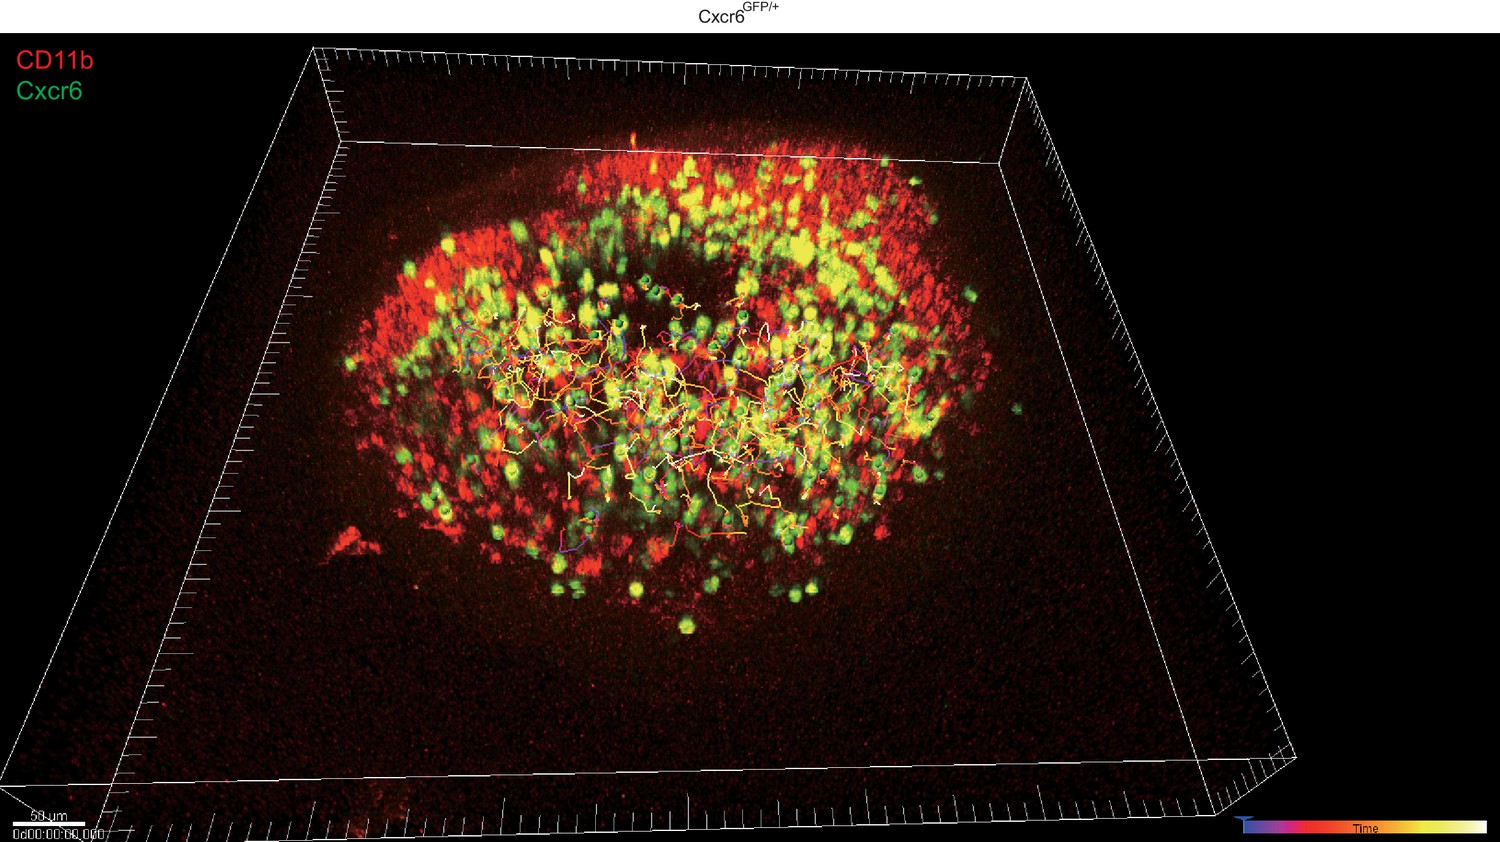
Example of automatically generated tracks for Cxcr6-GFP+ cells in a Cxcr6GFP/+ mouse LN.
Green, Cxcr6-GFP+ lymphocytes; Red, CD11b+ macrophages. 5 min~30 min tracks for Cxcr6-GFP+ lymphocytes are shown in colored lines. LN, Lymph node.
Figure 4 with 4 supplements
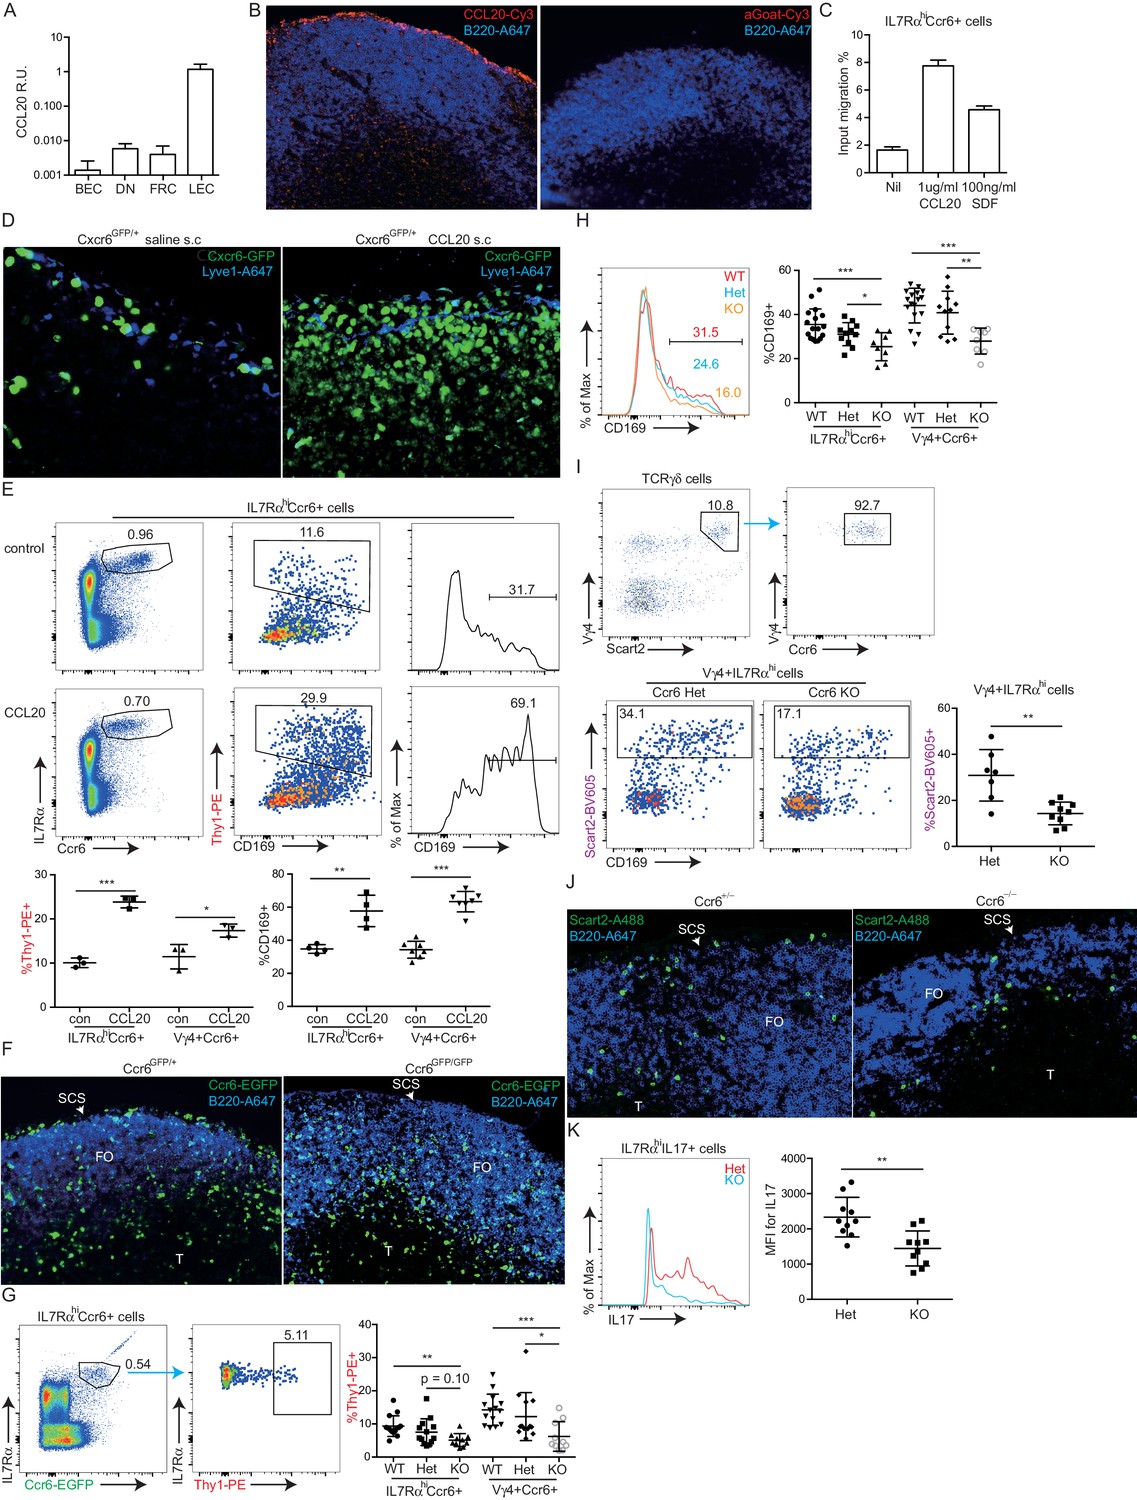
Ccr6 promotes innate-like lymphocyte positioning near the SCS.
(A) Ccl20 mRNA abundance in sorted LN lymphatic endothelial cells (LEC), blood endothelial cells (BEC), fibroblastic reticular cells (FRC) and double negative stromal cells (DN) determined by qRT-PCR, shown relative to Hprt. (B) CCL20 staining of LN section (red). The control (no primary) section was stained with the secondary anti-goat-Cy3 antibody alone. B cells were detected in blue (B220). (C) Transwell migration of IL7RαhiCcr6+ cells to CCL20. (D) Distribution of Cxcr6GFP/+ cells in LNs 3 hr after saline or CCL20 s.c. injection. Sections were stained to detect Cxcr6-GFP (green) and Lyve1 (blue). (E) Representative FACS plots show Ccr6 surface level, in vivo Thy1-PE labeling and CD169 macrophage bleb level on IL7RαhiCcr6+ cells from control (con) or CCL20 injected mice. Summary graph shows comparison of Thy1-PE labeling and CD169+ staining frequency of IL7RαhiCcr6+ and Vγ4+Ccr6+ cells from control or CCL20 injected mice. (F) LN sections from Ccr6GFP/+ or Ccr6GFP/GFP mice stained for EGFP (green) and B220 (blue). White arrow indicates subcapsular sinus area; FO: B cell follicle; T: T zone. (G) Comparison of Thy1-PE labeling on IL7RαhiCcr6+ cells from WT and Ccr6GFP/+ or Ccr6GFP/GFP mice. Ccr6 in Het and KO mice was detected based on GFP reporter expression. (H) Comparison of CD169 staining on IL7RαhiCcr6+ cells from WT, Ccr6GFP/+ or Ccr6GFP/GFP mice. (I) Representative FACS plots showing Vγ4+Scart2+ cells amongst γδT cells and the fraction that are Ccr6+ (upper), and in vivo Scart2-BV605 labeling and CD169 staining (lower). Graph shows summary data. (J) LN sections from Ccr6 Het or KO mice stained for Scart2+ (green) and B220 (blue). White arrow indicates subcapsular sinus area; FO: B cell follicle; T: T zone. (K) Representative histogram plot and summary mean fluorescence intensity (MFI) data of IL17 intracellular staining in IL7RαhiCcr6+ LN cells from Ccr6 Het or KO mice 3 hr after S. aureus bioparticle challenge. *p<0.05, **p<0.01, ***p<0.001, by student’s t test. Data are representative of at least two experiments for panel A–D, F, J. Data are representative of two or more experiments with at least two mice per group for panels E, G–I, K. LN, Lymph node; SCS, Subcapsular sinus.
Figure 4—figure supplement 1
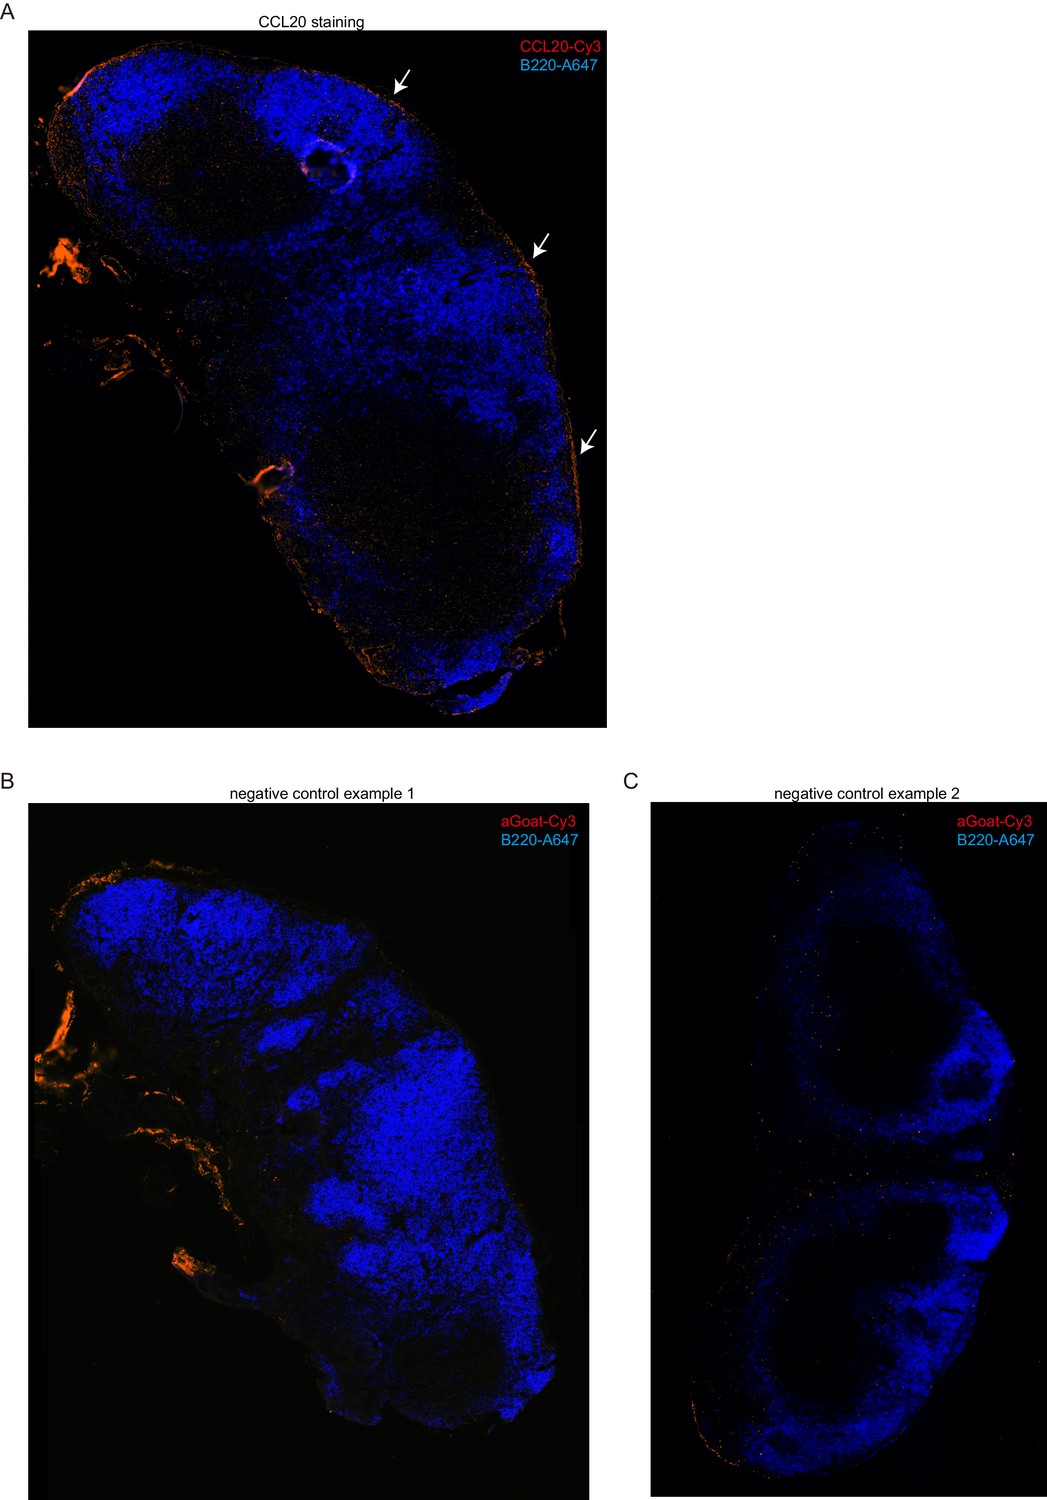
CCL20 distribution in inguinal LN.
Serial sections were stained with anti-CCL20 (A) or without primary antibody (B, C) (red) and anti-B220 (blue). The arrows in A point to staining in the SCS region adjacent to B cell follicles. The controls show that there is non-specific staining in some regions, particularly, in the medulla, but this is minimal in the SCS. The weak staining of the T zone in A but not in the control (panel B) may reflect non-specific binding by the primary antibody since T zone stromal cells showed minimal CCL20 transcript expression (Figure 4A). SCS, Subcapsular sinus.
Figure 4—figure supplement 2
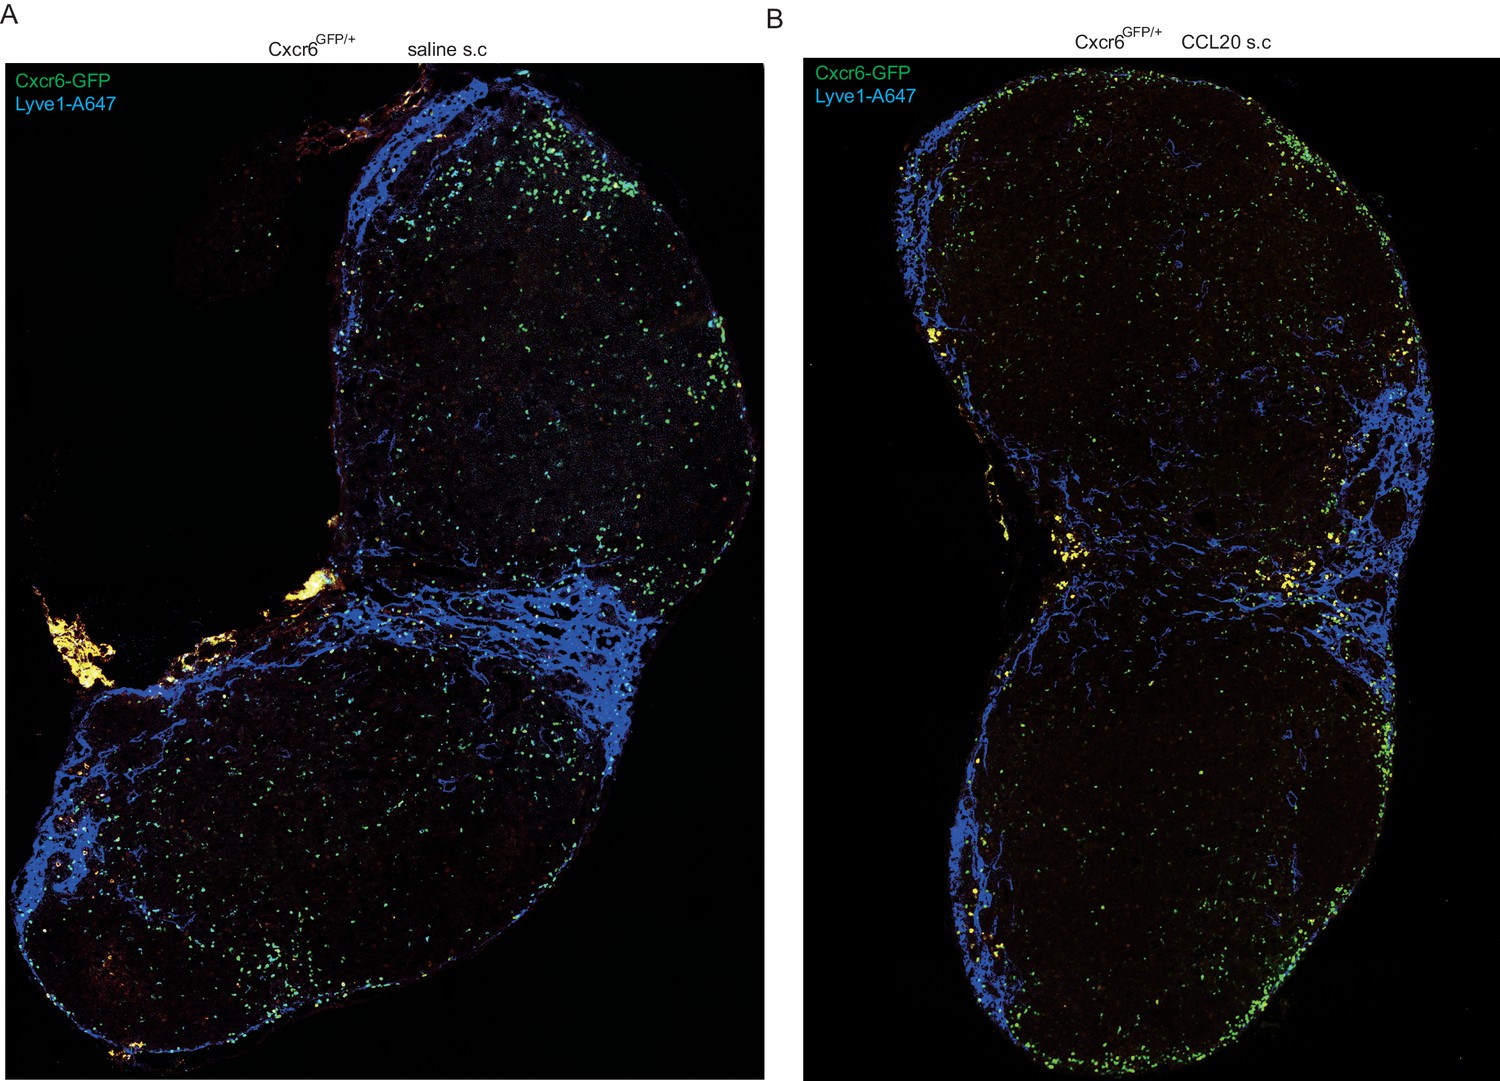
Movement of Cxcr6-GFP+ cells to SCS location following CCL20 injection.
Cxcr6GFP/+ mice were injected s.c. with saline (A) or CCL20 (B) and 1 hr later inguinal LN sections were stained to detect Cxcr6-GFP (green), and Lyve1 (blue). LN, Lymph node.
Figure 4—figure supplement 3
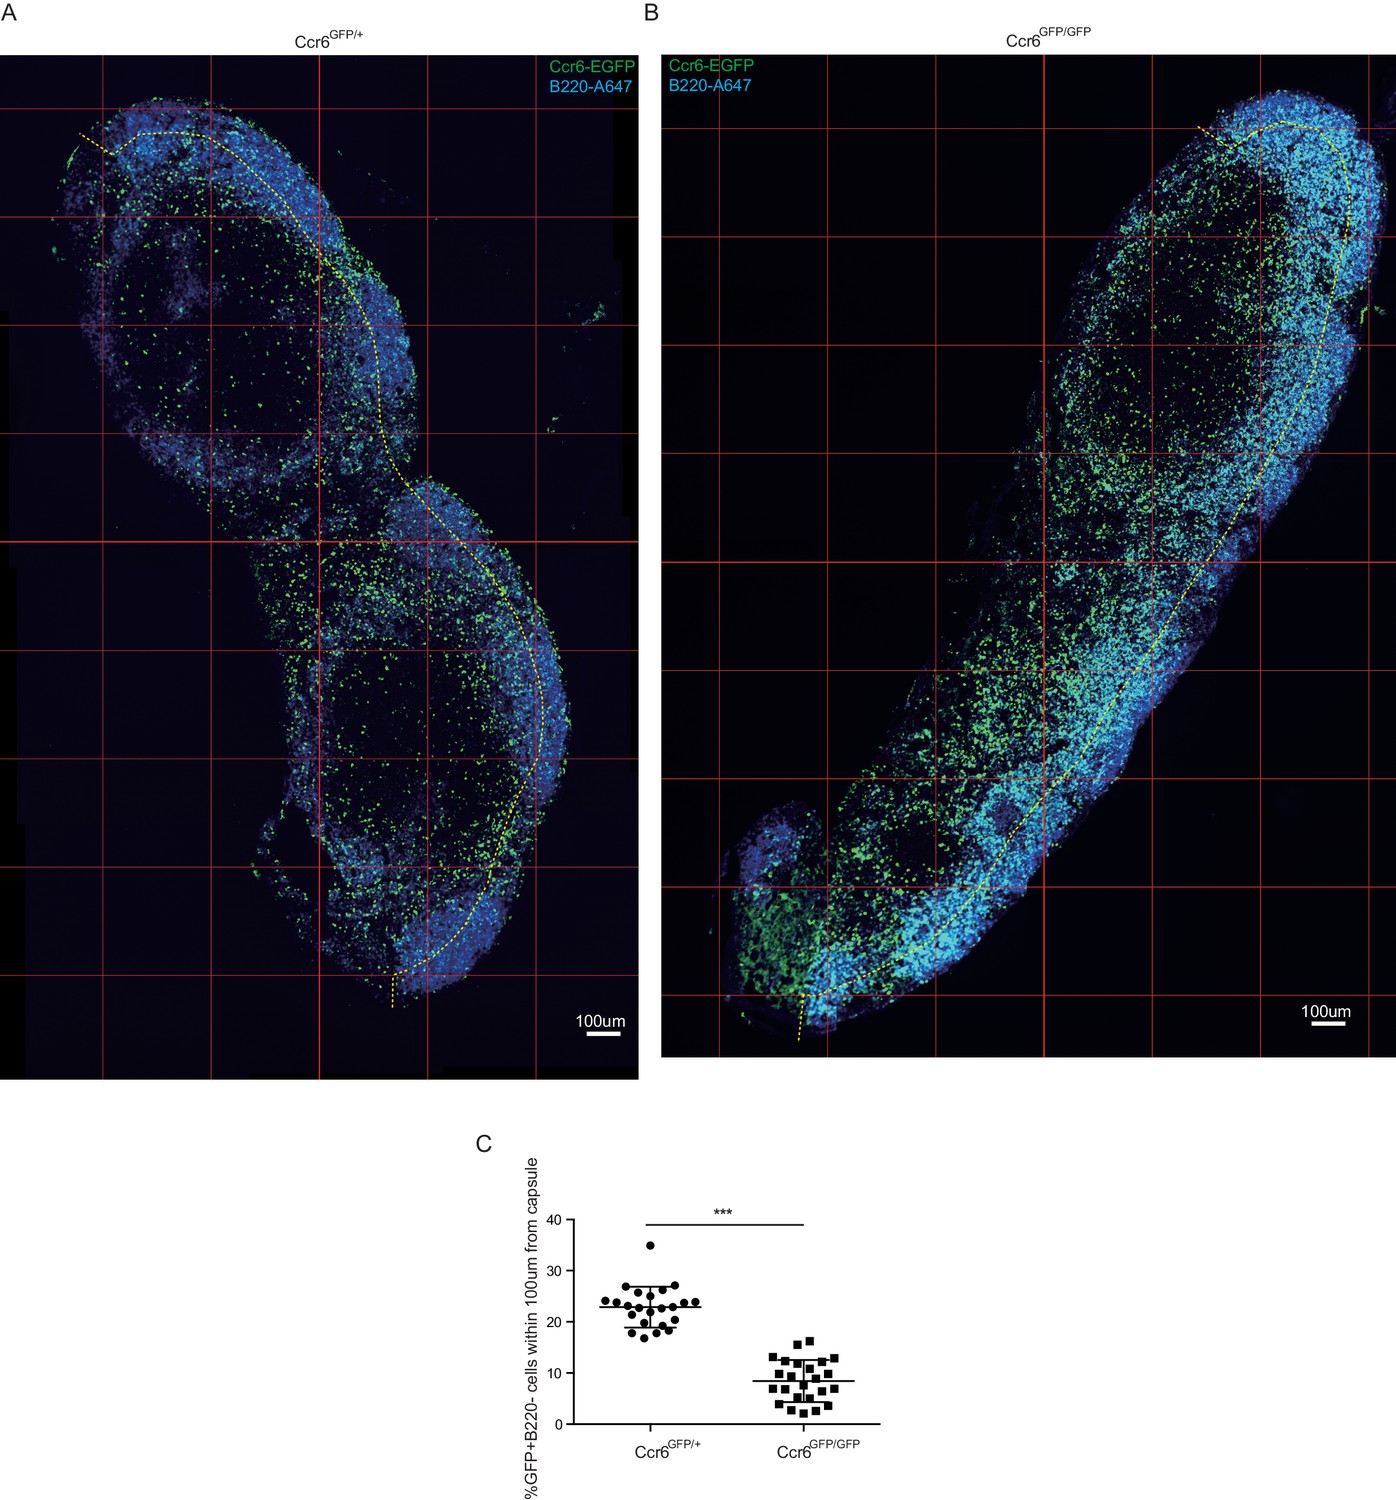
Ccr6 is required for positioning of Ccr6+ cells at the SCS.
Inguinal LN sections from Ccr6GFP/+ (A) and Ccr6GFP/GFP (Ccr6-deficient) (B) mice were stained to detect GFP (green) and B220 (blue). (C) GFP+B220– cells were counted manually and percentage of cells within 100 µm of the capsule (indicated by the yellow dashed line in A, B) was calculated. Quantification was done for serial sections of LNs from three Ccr6GFP/+ and 3 Ccr6GFP/GFP mice. LNs, Lymph nodes.
Figure 4—figure supplement 4
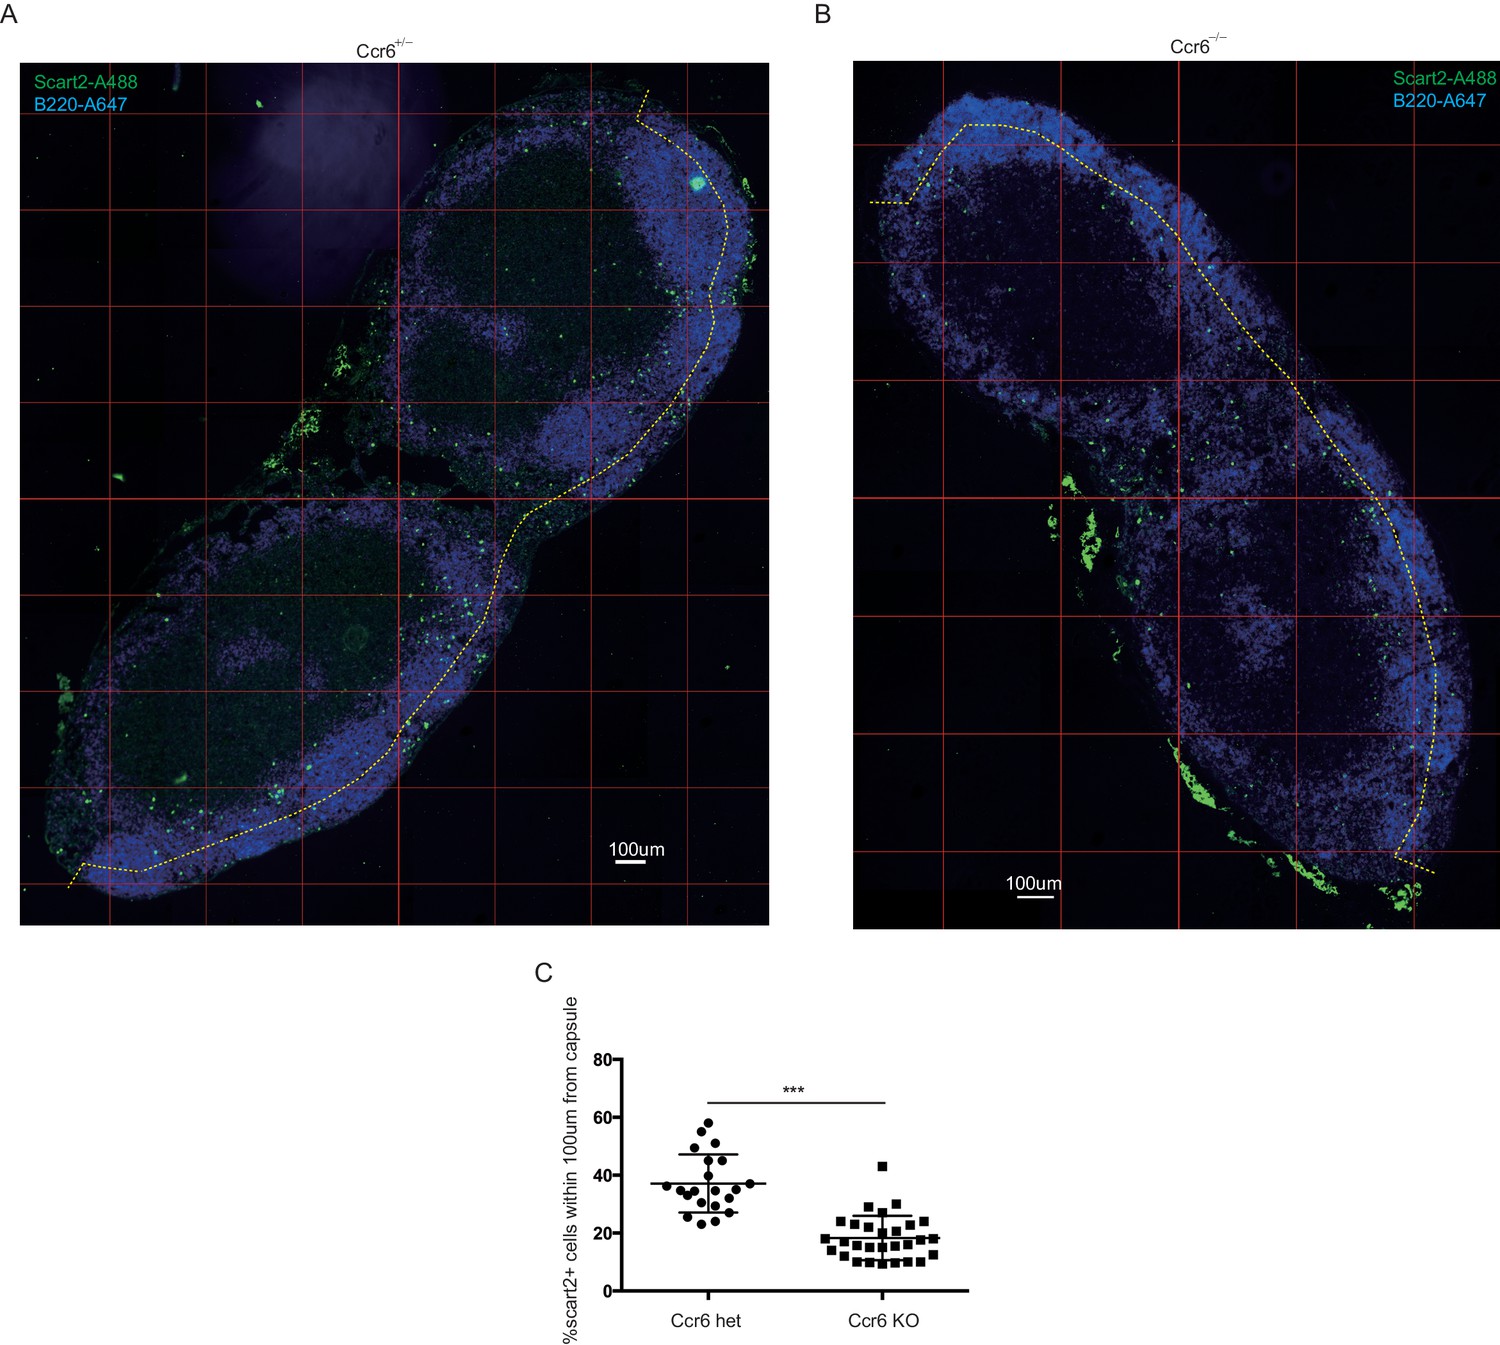
Ccr6 is required for positioning of Scart2+γδT cells at the SCS.
Inguinal LN sections from control (Ccr6+/–) (A) and Ccr6–/– (Ccr6 deficient) (B) mice were stained to detect Scart2 (green) and B220 (blue). (C) Scart2+ cells were counted manually and percentage of cells within 100 µm of the capsule (indicated by the yellow dashed line in A, B) was calculated. Quantification was done for serial sections of LNs from 3 Ccr6+/– and 3 Ccr6–/– mice. LN, Lymph node.
Figure 5 with 2 supplements
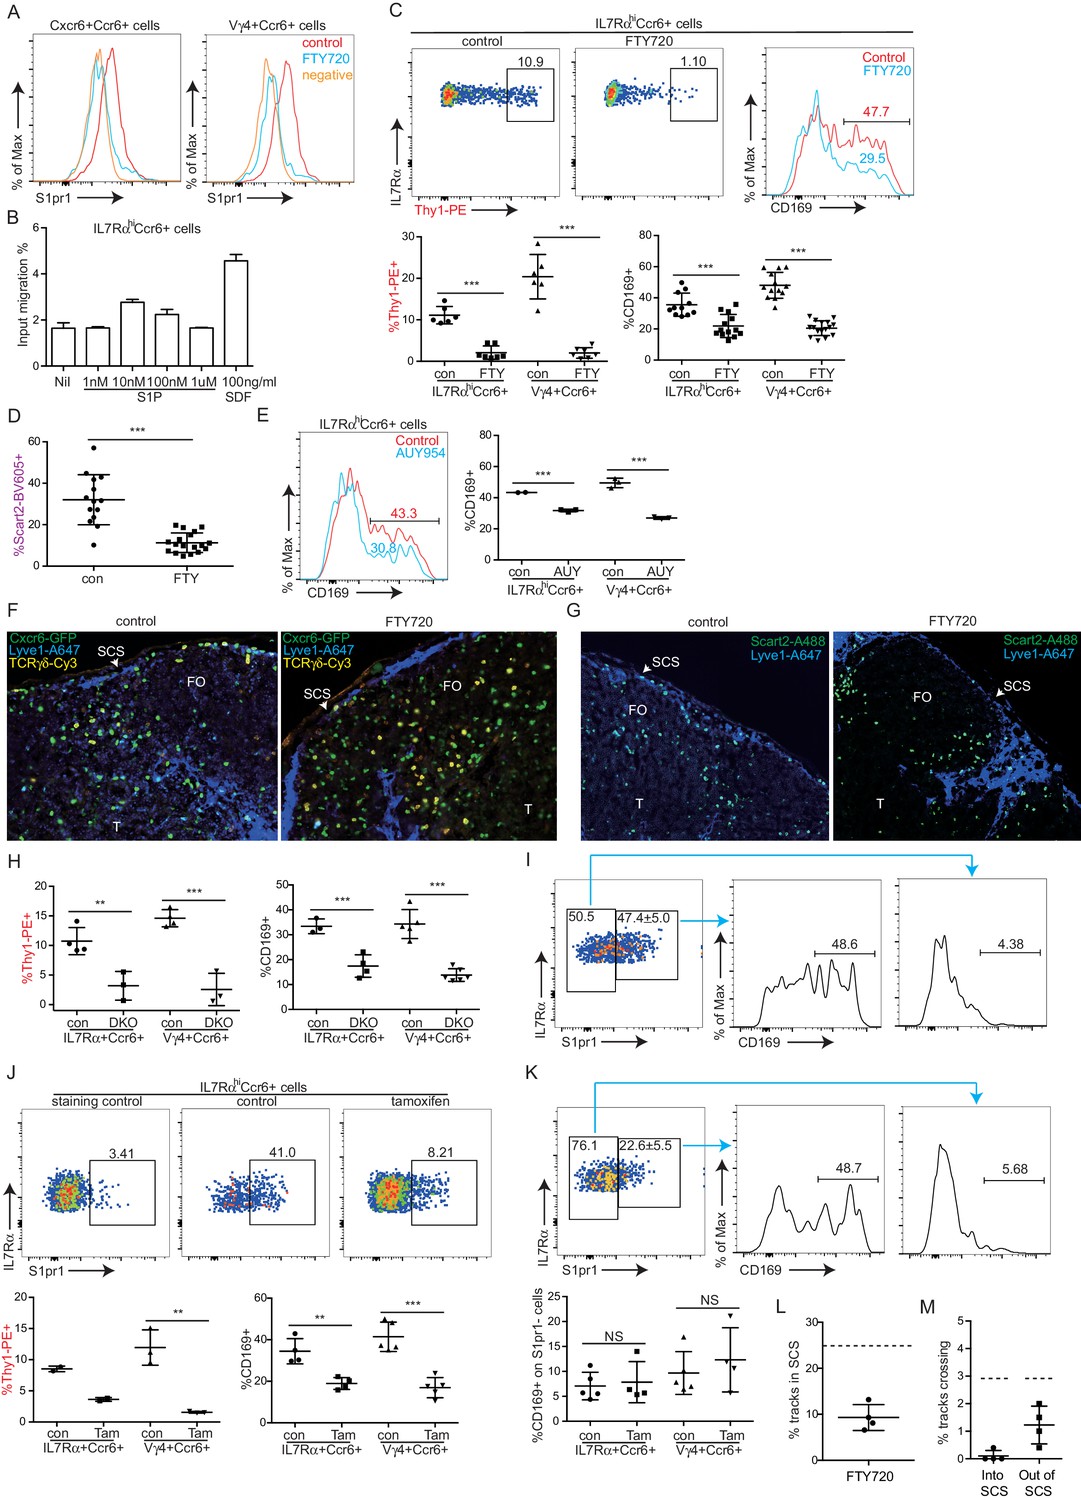
S1pr1 is required for innate-like lymphocyte movement into the SCS.
(A) S1pr1 surface expression on IL7RαhiCcr6+ and Vγ4+Ccr6+ cells from control or FTY720 treated mice. Negative indicates samples stained with no primary antibody. (B) Transwell migration assay showing % of input cells that migrated to the indicated amounts of S1P or SDF. (C) Representative FACS plots and summary data of in vivo Thy1-PE labeling and CD169 staining on IL7RαhiCcr6+ and Vγ4+Ccr6+ LN cells from control or FTY720 treated mice. (D) Summary graph showing in vivo Scart2 labeling on IL7RαhiCcr6+ Vγ4+ cells from control or FTY720-treated mice. (E) Representative histogram plot and summary data of CD169 staining on IL7RαhiCcr6+ and Vγ4+Ccr6+ LN cells from AUY954-treated mice. (F) GFP, Lyve1 and TCRγδ staining of LN sections from control and FTY720-treated Cxcr6-GFP+ mice. White, SCS: white arrow indicates subcapsular sinus area; FO: B cell follicle; T: T zone. (G) Scart2 and Lyve1 staining of LN sections from FTY720 treated and control mice. White arrow indicates subcapsular sinus area; FO: B cell follicle; T: T zone. (H) Summary data of in vivo Thy1-PE labeling and CD169 staining of the indicated cells in Lyve1-Cre Sphk1fl/-Sphk2-/- (Sphk DKO) and control mice. (I) Representative FACS plot showing S1pr1 staining on IL7RαhiCcr6+ cells from a control mouse and histogram plots of CD169 staining on the indicated cells. (J) Representative FACS plot showing S1pr1 staining on IL7RαhiCcr6+ cells from a control and 5-day tamoxifen-treated S1pr1f/f CreERt2 mouse, Graphs show summary data for frequency of Thy1-PE labeled and CD169+ IL7RαhiCcr6+ and Vγ4+Ccr6+ cells in control (con) or tamoxifen (tam) treated mice. (K) Representative FACS plots of the type in I for cells from a 2-day tamoxifen-treated S1pr1f/f CreERt2 mouse. Graph shows CD169+ cell frequency amongst S1pr1-negative IL7RαhiCcr6+ cells. *p<0.05, **p<0.01, ***p<0.001, by student’s t test. Data are representative of at least two experiments for panels A–B, E–G, I and two or more experiments with at least two mice per group for panels C–D, H. Data are representative of at least three experiments with at least one control and one S1pr1f/f CreERt2 mouse for panels J and K. (L) Percent tracks in SCS compartment among the total tracks enumerated in FTY720 treated mice. Each point represents data from a single movie (three independent experiments). Dashed line is the mean for control mice (data shown in Figure 3B). The frequency of cells in the SCS differed significantly from the control (p<0.05 by students t test). (M) Frequency of tracks crossing into and out of the SCS of FTY720-treated mice, enumerated as in L. Dashed lines are the means for control mice (data shown in Figure 3C). Frequency of tracks crossing into the SCS differed significantly from the control (p<0.05 by students t test). SCS, Subcapsular sinus.
Figure 5—figure supplement 1
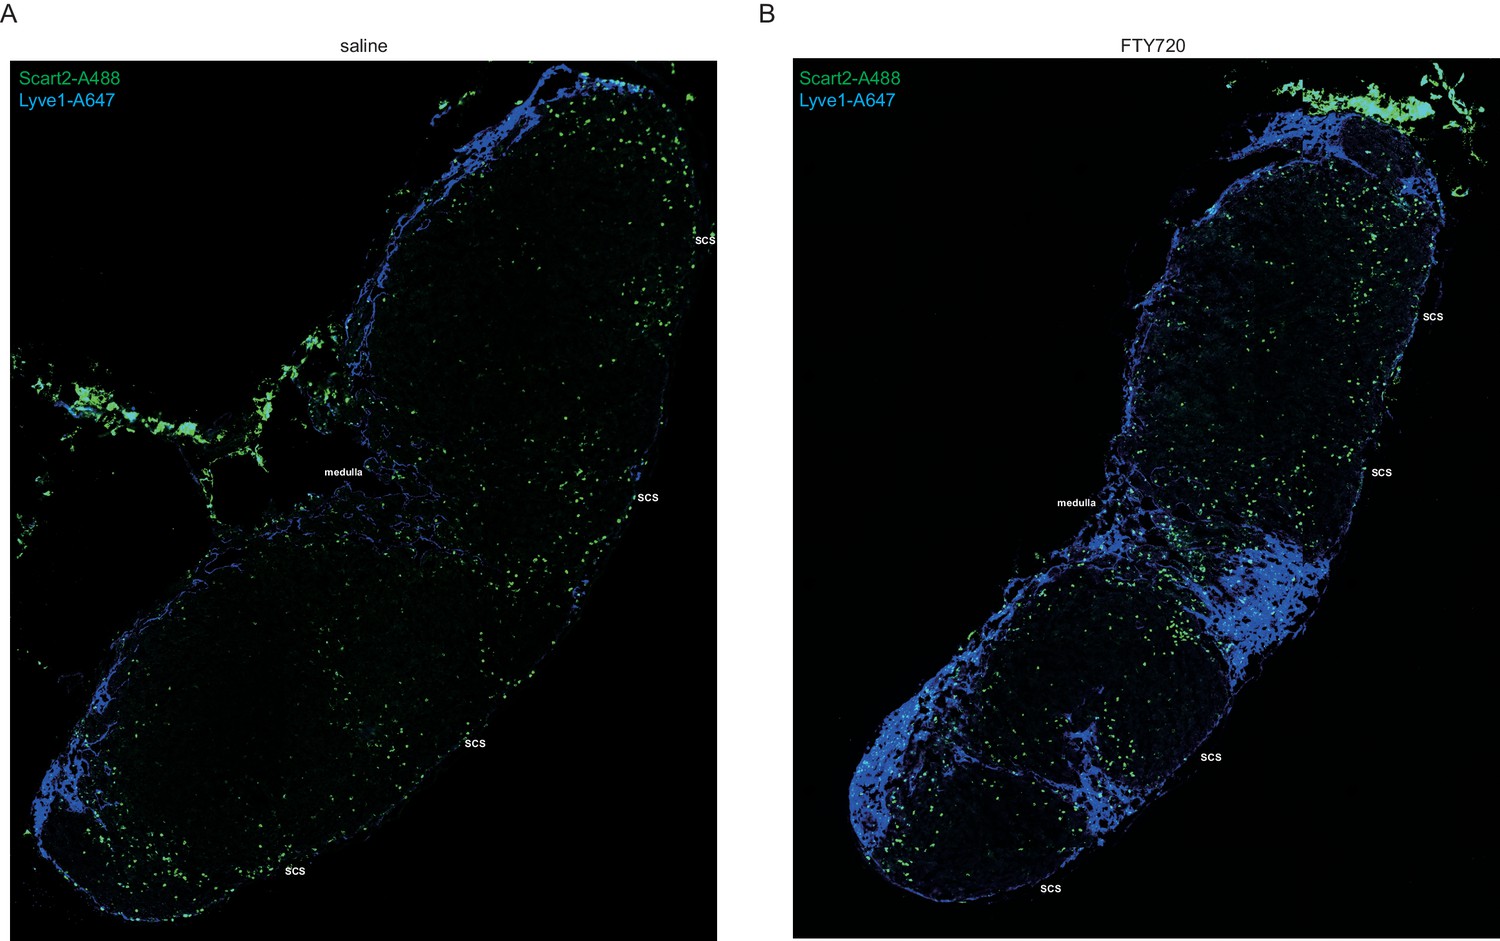
FTY720 treatment depletes SCART2+γδT cells from the SCS.
Mice were treated i.v. with saline (A) or FTY720 (B) and 6 hr later inguinal LN sections were stained to detect Scart2 (green) and Lyve1 (blue). SCS and medulla indicate subcapsular sinus area and medullary area.
Figure 5—figure supplement 2
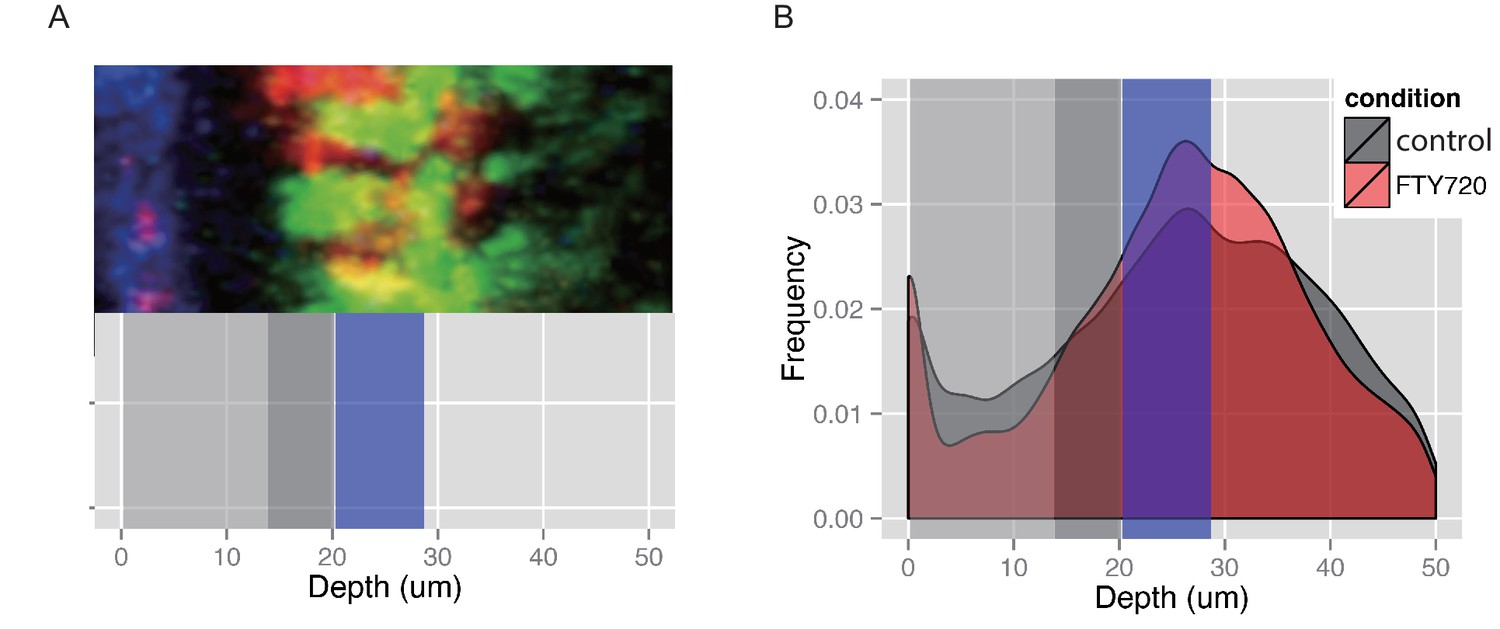
Frequency of Cxcr6GFP/+ cells plotted against their depth from the surface of the LN capsule.
Each individual cell’s location was determined using the Spots tool in Imaris. The depth, or minimum distance from the cell’s center as a Surface object created in Imaris to the capsule, was calculated using a custom Matlab script and the ImarisXT interface. Plots are an aggregate of all experiments for each presented condition (n = 3–6 mice per condition). (A) Representative anatomy for reference against the plotted depth. The region adjacent to the LN capsule (blue in image) can be divided into the sinus (depth defined as 0–20 µm below capsule, represented by gray bars) and the LN parenchyma (depth defined as > 20 µm below capsule, see Video 1 for dynamics in these regions). Cxcr6+ cells (green in image) at the floor of the sinus (depth 15–20 µm, dark gray bar) and close to the sinus but within the parenchyma (depth 20–28 µM, blue bar) are both adjacent to CD11b+ subcapsular macrophages (red in image). (B) Sixteen hr after FTY720 treatment, a buildup of Cxcr6GFP/+ cells is seen in the parenchyma adjacent to the sinus (blue bar), while a corresponding depletion of cells within the sinus is observed, compared to control mice.
Figure 6 with 1 supplement
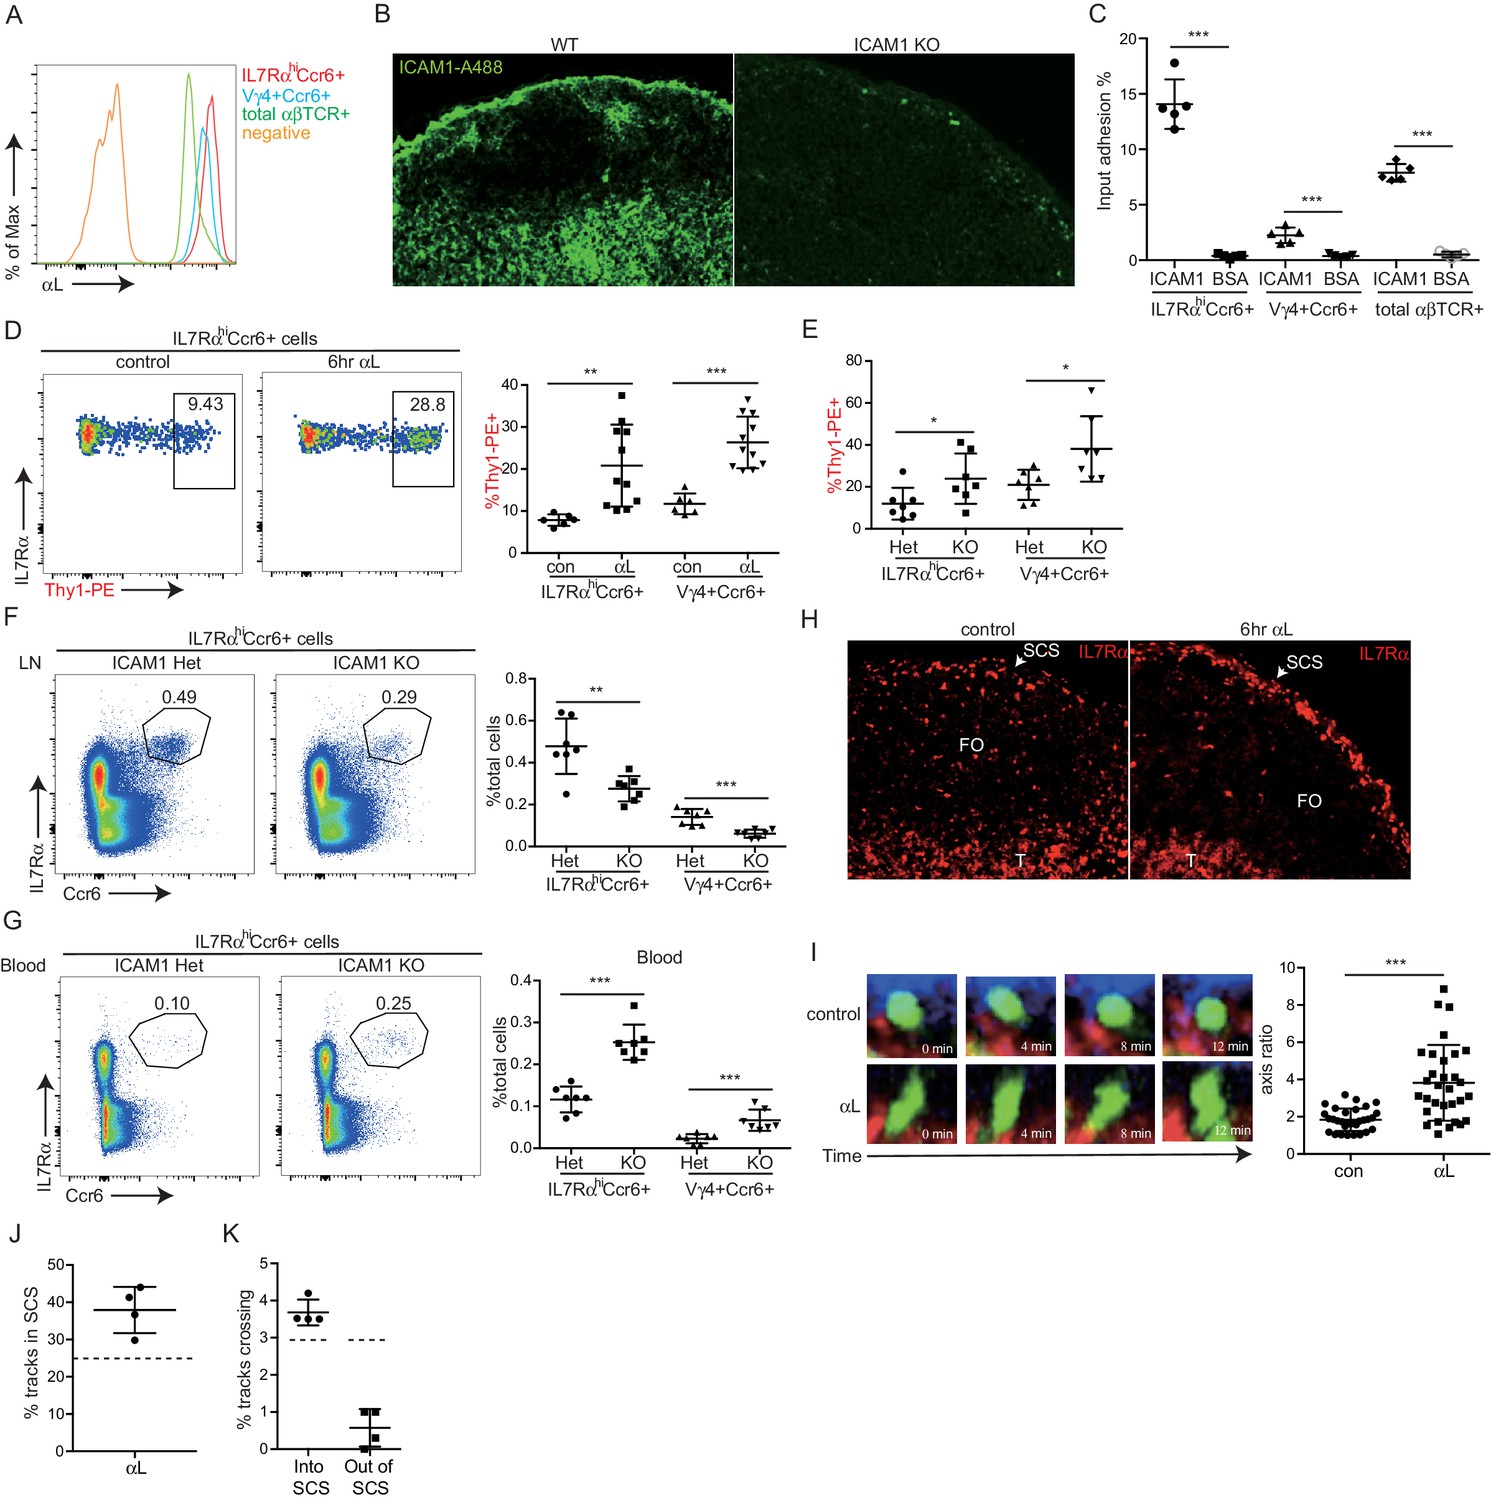
LFA1 and ICAM1 control innate-like lymphocyte access to the LN parenchyma from the SCS.
(A) Representative FACS histogram showing LFA1 staining of IL7RαhiCcr6+, Vγ4+Ccr6+ and naïve αβ T cells. (B) ICAM1 staining of WT and ICAM1 KO LN sections. (C) Adhesion of IL7RαhiCcr6+, Vγ4+Ccr6+ cells and naïve αβ T cells to ICAM1 or BSA. (D) Representative FACS plots and summary graph showing in vivo Thy1-PE labeling of IL7RαhiCcr6+ cells in 6 hr control or αL blocking antibody treated mice. (E) Summary graph showing in vivo Thy1-PE labeling of IL7RαhiCcr6+ cells in ICAM1 Het and KO mice. (F, G) IL7RαhiCcr6+ and Vγ4+Ccr6+ cell frequencies in LNs (F) and blood (G) from ICAM1 Het and KO mice. (H) Distribution of IL7Rhi cells in LN sections from control and αL-antibody-treated mice. White, SCS: white arrow indicates subcapsular sinus area; FO: B cell follicle; T: T zone. (I) Left panels: Time series of Cxcr6GFP/+ cells in LN of control or anti-αL treated mice. Mice were treated with CD11b-PE to label macrophages. Right panel: Axis ratio of Cxcr6GFP/+ cells in control and anti-αL treated mice. Cxcr6GFP/+ cells in SCS contacting CD11b+ macrophages were measured. Data are pooled from two independent experiments. *p<0.05, **p<0.01, ***p<0.001, by student’s t test. Data are representative of at least two experiments for panels A–C, H–I and two or more experiments with at least two mice per group for panels D–G. (J) Percent of tracks in the SCS compartment among the total tracks enumerated in anti-αL-treated mice. Each point represents data from a single movie (three independent experiments). Dashed line is the mean for control mice (data shown in Figure 3B). The frequency of cells in the SCS differed significantly from the control (p<0.05 by students t test). (K) Frequency of tracks crossing into and out of the SCS of anti-αL-treated mice, enumerated as in J. Dashed lines are the means for control mice (data shown in Figure 3C). Frequency of tracks crossing out of the SCS differed significantly from the control (p<0.05 by students t test). SCS, Subcapsular sinus.
Figure 6—figure supplement 1
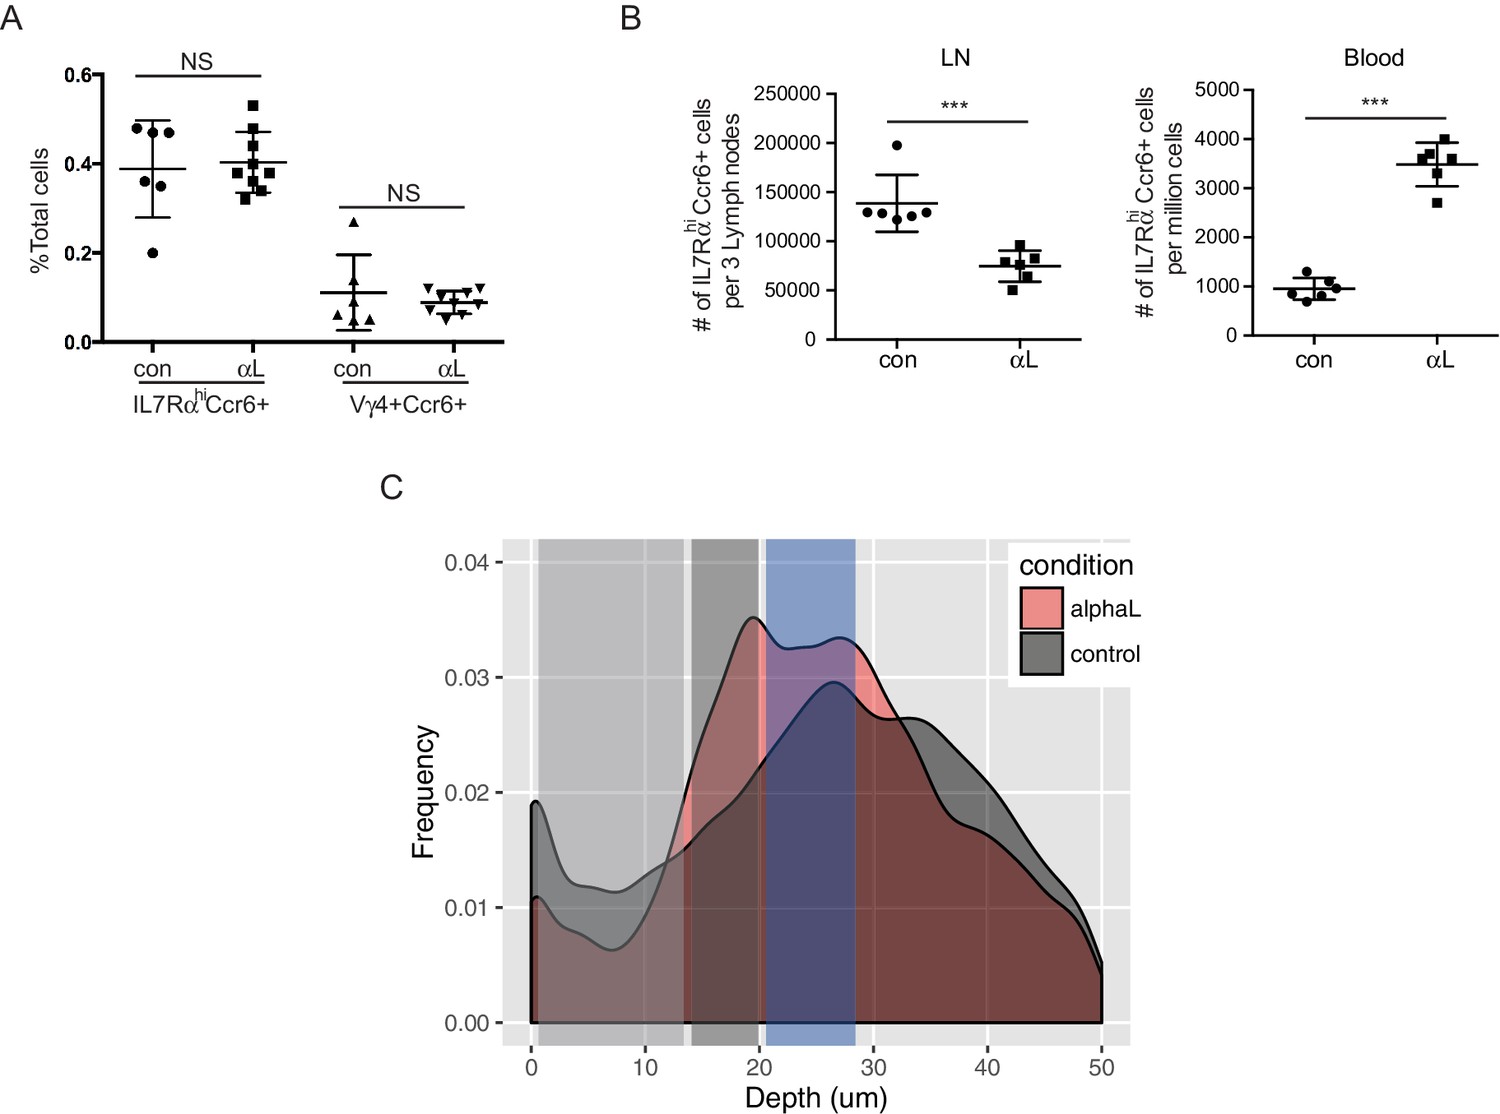
Effects of αL blockade on innate-like lymphocyte distribution.
(A) Frequency of IL7RαhiCcr6+ and Vγ4+Ccr6+ LN cells 6 hr after treatment with saline or αL blocking antibody. (B) Number of IL7RαhiCcr6+ cells in peripheral LNs and blood 3 days after treatment with saline or αL blocking antibody. (C) Frequency of Cxcr6GFP/+ cells plotted against their depth from the surface of the LN capsule. Four hours after treatment with αL blocking antibody (alphaL), a marked increase in the number of Cxcr6GFP/+ cells at the floor of the sinus (dark gray bar) is observed compared to control mice. LN, Lymph node.
Figure 7 with 1 supplement
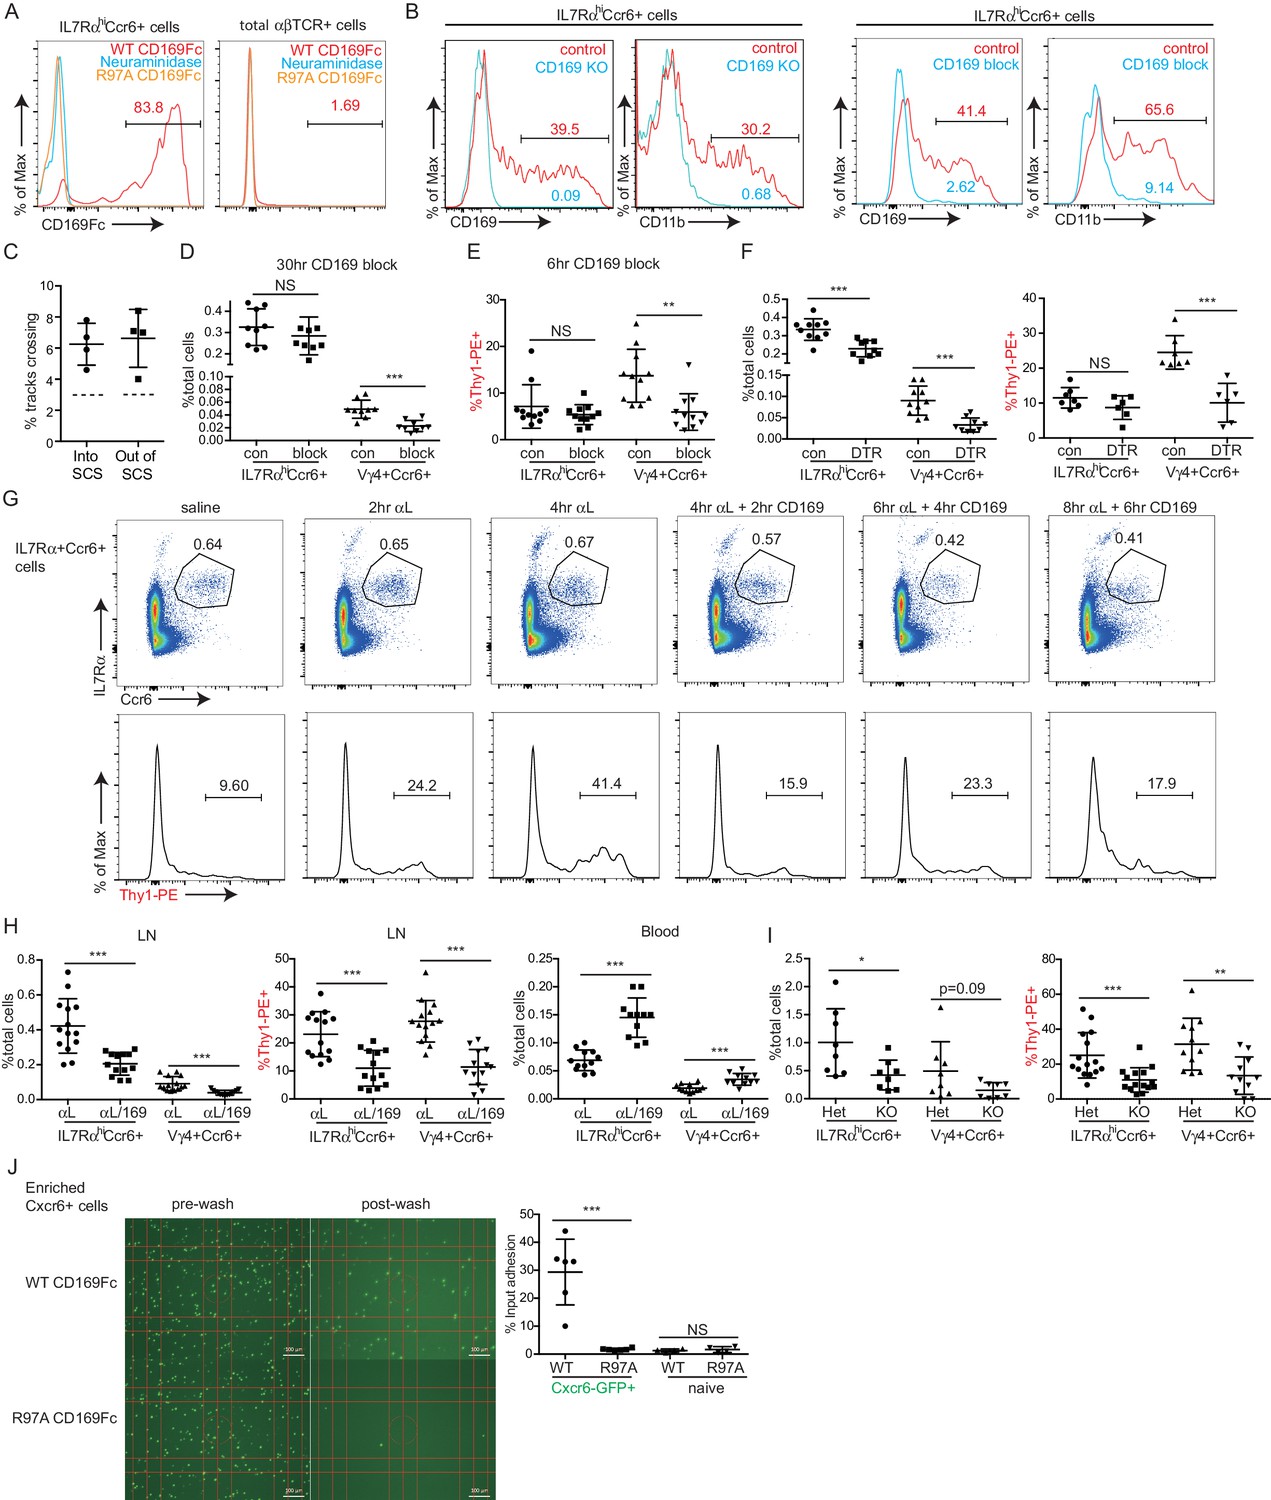
CD169 mediates SCS retention of innate-like lymphocytes.
(A) CD169-Fc binding of innate-like lymphocytes. (B) Effect of CD169-deficiency or blocking antibody treatment on macrophage bleb acquisition by IL7RαhiCcr6+ cells. Cells were stained to detect the macrophage markers CD169 and CD11b. (C) Frequency of tracks crossing into and out of the SCS of anti-CD169-treated mice. Each point represents data from a single movie (three independent experiments). Frequency of tracks crossing into and out of the SCS differed significantly from the control (p<0.05 by students t test). (D) Number of Vγ4+Ccr6+ cells in LN after 30 hr of CD169 blockade. (E) In vivo Thy1-PE labeling on Vγ4+Ccr6+ cells after 6 hr CD169 blockade. (F) Number and in vivo Thy1-PE+-labeled Vγ4+Ccr6+ cell frequency in LNs of control (con) or CD169-DTR+ mice after DT treatment. (G) Change in innate-like lymphocyte frequency and Thy1-PE labeling over time after treating mice with αL and CD169 blocking antibodies. (H) Effect of 6 hr combined αL and CD169 blockade on IL7RαhiCcr6+ cell frequency in LN and blood, and fraction of LN cells that are in vivo Thy1-PE labeled. (I) Effect of αL blocking in CD169 KO mice on IL7RαhiCcr6+ cell number and in vivo Thy1-PE labeling. (J) IL7RαhiCcr6+ cell adhesion to CD169-Fc and R97A-Fc-coated plates. *p<0.05, **p<0.01, ***p<0.001, by student’s t test. Data are representative of at least two experiments for panels A–B, F, I. Data are representative of two or more experiments with at least two mice per group for panels C–E, G–H. LN, Lymph node; SCS, Subcapsular sinus.
Figure 7—figure supplement 1
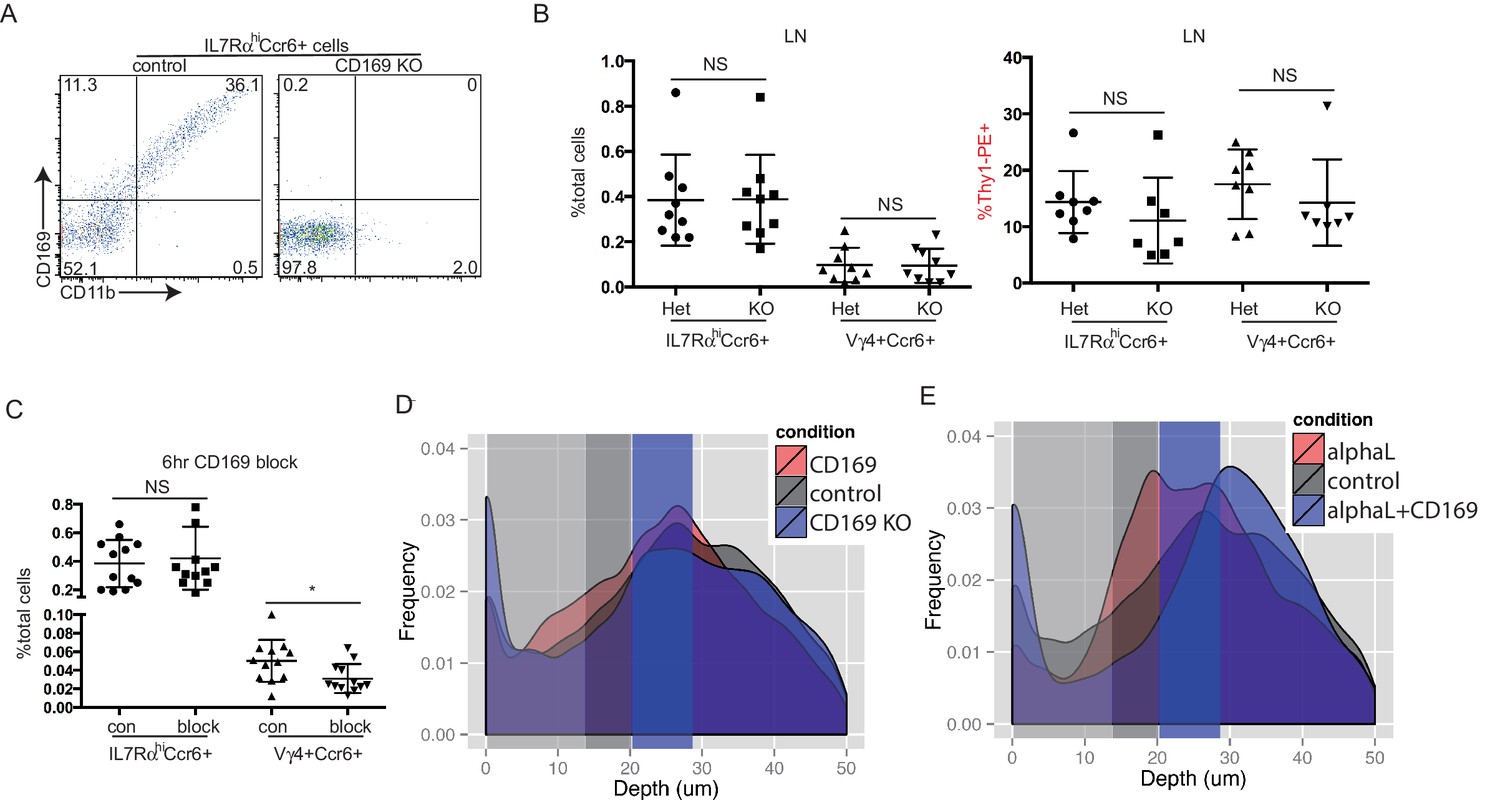
Effects of CD169 blockade on innate-like lymphocyte properties and distribution.
(A) CD169 CD11b costaining of IL7RαhiCcr6+ cells from control and CD169-deficient LNs. (B) Frequency and Thy1-PE labeling of IL7RαhiCcr6+ and Vγ4+Ccr6+ LN cells in control and CD169-deficient mice. (C) Frequency of IL7RαhiCcr6+ and Vγ4+Ccr6+ LN cells 6 hr after treatment with saline or CD169 blocking antibody. (D) Frequency of Cxcr6GFP/+ cells plotted against their depth from the surface of the LN capsule. Only slight changes in distribution of Cxcr6GFP/+ cells are observed 4 hr following treatment with CD169 blocking antibody (CD169), or in CD169-/- Cxcr6GFP/+ mice (CD169 KO), compared to control mice. (E) Frequency of Cxcr6GFP/+ cells plotted against their depth from the surface of the LN capsule. Mice treated for 4 hr with both αL blocking antibody and CD169 blocking antibody (alphaL+CD169) show a marked decrease in the frequency of Cxcr6+ cells at the sinus floor compared to control mice or mice treated with 4 hr aL blocking antibody (alphaL) alone.
Figure 8
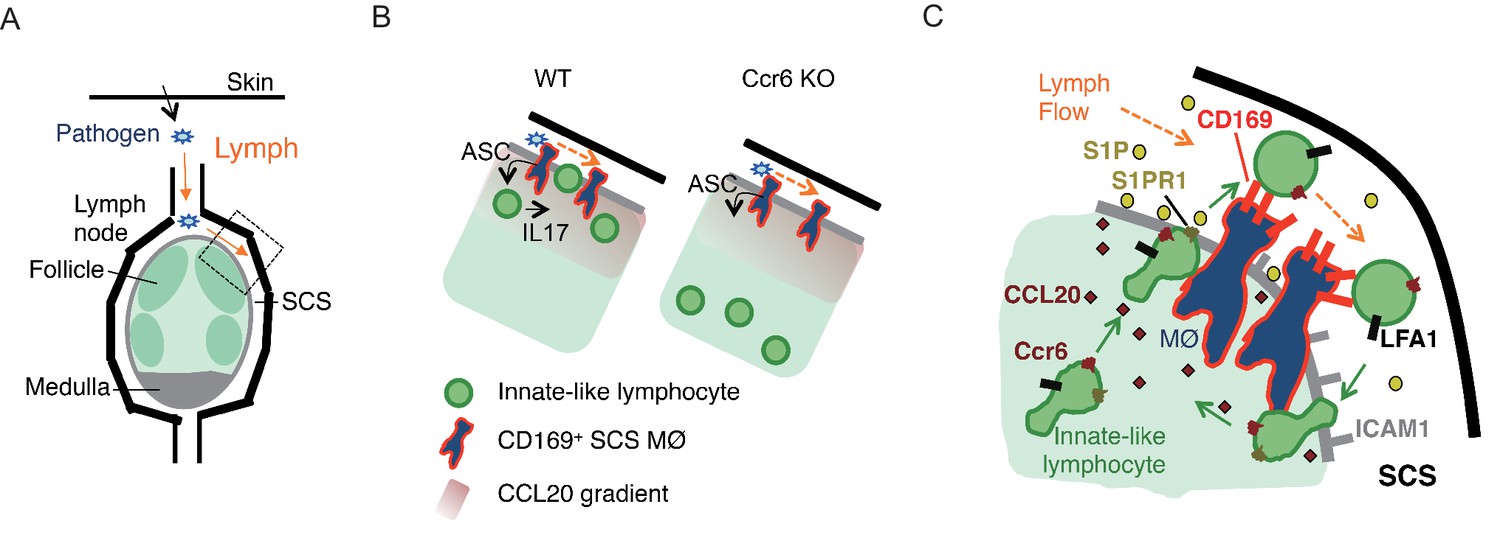
Model of requirements for innate-like lymphocyte surveillance of the LN SCS.
(A) Diagram of skin draining LN. (B) Model showing effect of Ccr6-deficiency on innate-like lymphocyte positioning and associated defect in ability to upregulate IL17 in response to IL1-family cytokines produced by SCS macrophages in an ASC-dependent manner. (C) Model showing role of Ccr6-CCL20 in guiding innate-like lymphocyte to lymphatic sinus, S1pr1-S1P in promoting trans-cellular migration into sinus, CD169 on macrophage (MØ) in mediating retention of CD169-ligandhi lymphocyte (green) against lymph flow, and LFA1-ICAM1 in promoting adhesion and transmigration. Green arrows show cell migration and orange arrows show lymph flow. LN, Lymph node; SCS, Subcapsular sinus.
Videos
Video 1
Cxcr6-GFP+ cell shuttling between parenchyma and the SCS.
Representative intravital time-lapse imaging of the popliteal LNs from two Cxcr6GFP/+ mice. Overhead 3D video exemplifies the dynamic movement of Cxcr6-GFP+ cells (green) within the LN. Two-dimensional video of a 20 µm maximal intensity projection from an orthogonal plane demonstrates the anatomy of the SCS region. An afferent lymphatic vessel (rarely visualized) drains into the SCS, bounded by the collagenous LN capsule (blue, second harmonic signal) and CD11b+ SCS macrophages (red). The second example further reveals the motility of Cxcr6-GFP+ cells both within the SCS and the LN parenchyma. Cxcr6-GFP+ cells are observed to cross from within the LN parenchyma into the SCS, as well as from within the SCS into the LN parenchyma (examples highlighted by circles). LN, Lymph node; SCS, Subcapsular sinus.
Video 2
Representative examples of individual Cxcr6-GFP+ cells crossing into and out of SCS.
Intravital time-lapse imaging of the popliteal LN from a Cxcr6GFP/+ control mouse, highlighting one cell crossing from the parenchyma into the SCS, and one crossing from the SCS into the parenchyma. Cells such as these that clearly crossed from one region were manually identified from automated tracking of all Cxcr6-GFP+ cells in an experiment. SCS, Subcapsular sinus.
Video 3
Cxcr6-GFP+ cellular dynamics following FTY720 treatment.
One hour time-lapse imaging of a popliteal LN in a Cxcr6GFP/+ mouse 16 hr after treatment with FTY720. Cxcr6-GFP+ cells (green) can be seen accumulated on the parenchymal side of the SCS macrophages (red, CD11b+), and depleted from the SCS. LN capsule appears blue (second harmonic signal).
Video 4
Cxcr6-GFP+ cell fluttering in the SCS following αL blockade.
In Cxcr6GFP/+ mice, four hours after treatment with αL blocking antibody, Cxcr6-GFP+ cells (green) are observed to flutter at the floor of the SCS. Cxcr6-GFP+ cells appear attached to CD11b+ SCS macrophages (red) while being buffeted by bulk lymph flow in the SCS, yielding a characteristic fluttering dynamic (video inset and arrowheads). LN capsule appears blue. LN, Lymph node; SCS, Subcapsular sinus.
Video 5
Increased movement of SCS Cxcr6-GFP+ cells after CD169 blockade and in CD169–/– mice.
Representative time-lapse images of Cxcr6GFP/+ mice 4 hr after treatment with CD169 blocking antibody, as well as Cxcr6GFP/+ CD169–/– mice. In both conditions, there appeared to be an increased frequency of Cxcr6-GFP+ cell (green) crossing events, both from the SCS into the LN parenchyma and from the parenchyma into the SCS. LN capsule appears blue and SCS macrophages (CD11b) red. LN, Lymph node; SCS, Subcapsular sinus.
Video 6
Decreased Cxcr6-GFP+ cell frequency in SCS following αL and CD169 double blockade.
Decreased numbers of Cxcr6-GFP+ cells (green) are observed in the SCS and LN parenchyma following dual antibody blockade of αL and CD169. Time-lapse imaging in a Cxcr6GFP/+ mouse beginning 4 hr post treatment. LN capsule appears blue and SCS macrophages (CD11b) red. LN, Lymph node; SCS, Subcapsular sinus.
Video 7
Addition of CD169 blockade causes release of Cxcr6-GFP+ cells from floor of SCS when pre-treated with αL blocking antibody.
Representative time-lapse imaging beginning 5 min after treatment with CD169 blocking antibody in Cxcr6GFP/+ mice pretreated 4 hr before with αL blocking antibody. Upon addition of CD169 blockade, Cxcr6-GFP+ cells (green) detached from the floor of the SCS and entered the bulk lymph flow, rapidly moving away from the field of view (inset and arrowheads). LN capsule appears blue and SCS macrophages (CD11b) red. LN, Lymph node; SCS, Subcapsular sinus.
Additional files
-
Source code 1
Matlab and R source code files used for computational analysis.
Three files are enclosed with the Matlab and R code used for the compuational analysis in the present paper: 1) spotsMinDistanceToSurface.m - Matlab File encoding an ImarisXT extension that can be used to find the minimum distance between a spot object and a surface object (used in the present paper to find the minimum distance between cells and the lymph node capsule); 2) SCSAnalyzeR_Core.R - R script containing code to import raw Imaris track lists (including depth statistic added by spotsMinDistanceToSurface.m), preform data processing, and create the plots displayed in the main and supplementary figures; 3) SCSAnalyzeR_Core_Functions.R - R script containing functions called by the main SCSAnalyzeR_Core.R script
- https://doi.org/10.7554/eLife.18156.027
Download links
A two-part list of links to download the article, or parts of the article, in various formats.
Downloads (link to download the article as PDF)
Open citations (links to open the citations from this article in various online reference manager services)
Cite this article (links to download the citations from this article in formats compatible with various reference manager tools)
Migratory and adhesive cues controlling innate-like lymphocyte surveillance of the pathogen-exposed surface of the lymph node
eLife 5:e18156.
https://doi.org/10.7554/eLife.18156


