SF-1 expression in the hypothalamus is required for beneficial metabolic effects of exercise
- University of Texas Southwestern Medical Center, United States
- Wonju College of Medicine, Yonsei University, South Korea
Figures
Figure 1 with 3 supplements
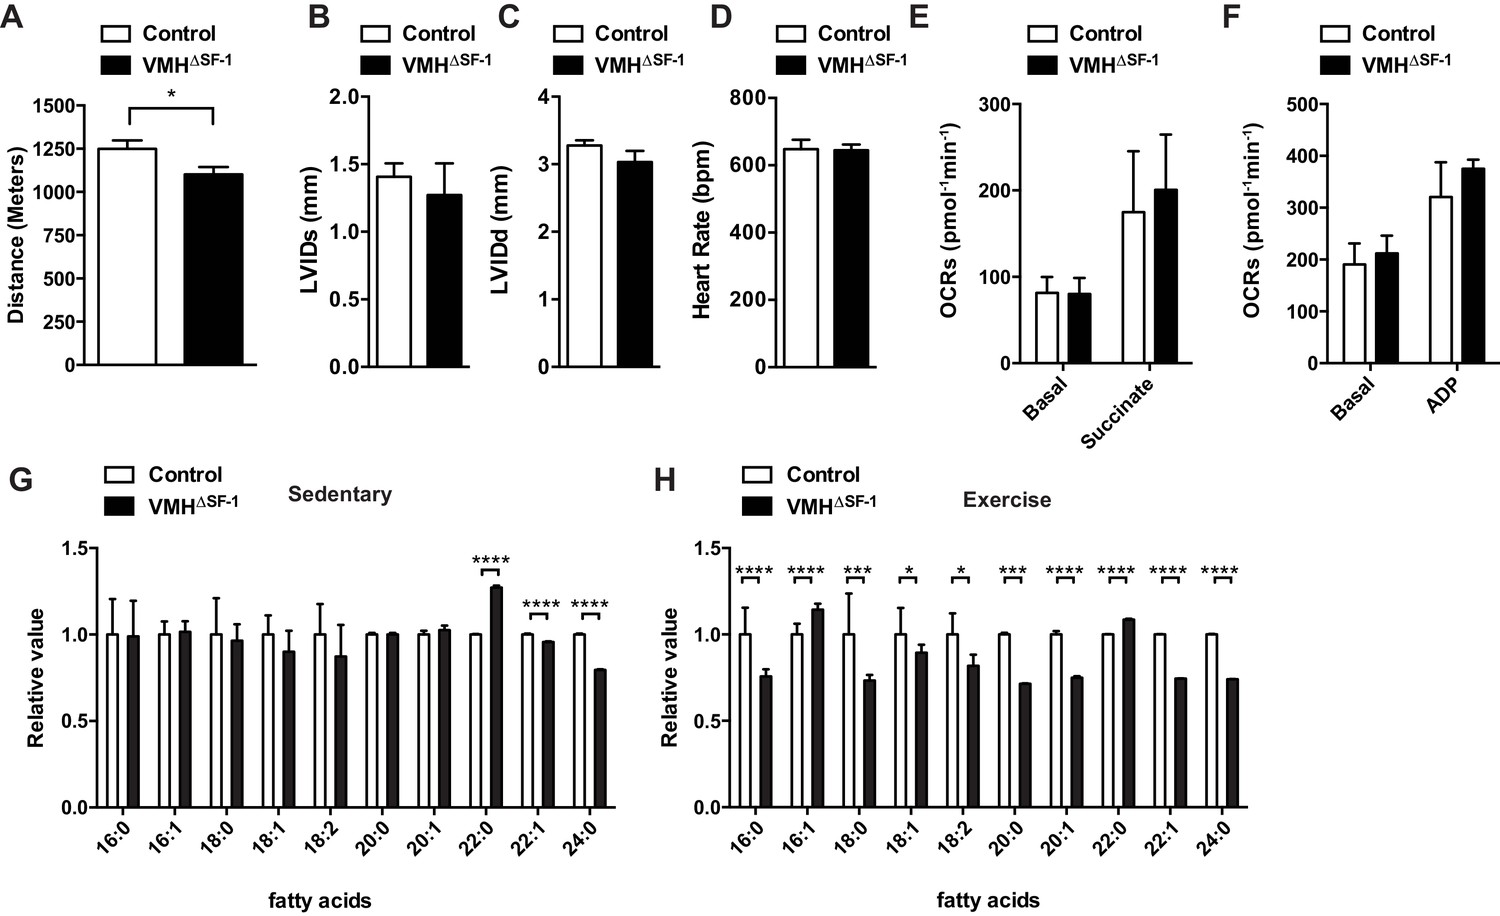
Deletion of SF-1 in the VMH attenuates endurance exercise capacity.
(A) Distance run during an endurance capacity test in mice lacking SF-1 only in the VMH (VMH∆SF-1) and control mice (age = 12–16 weeks). (B) Heart rate, (C) left ventricle end-diastolic diameters (LVEDD), and (D) left ventricle end-systolic diameters (LVESD) was determined by echocardiography (age = 20–28 weeks) in sedentary VMH∆SF-1 and control mice. Oxygen-consumption rates (OCRs) in mitochondria isolated from TA muscle, in response to sequential (E) succinate- and (F) ADP-stimulation, were used for mitochondrial respiratory function (n = 5; age = 12–16 weeks). (G) Free fatty acid levels in the plasma in sedentary mice, and (H) after a single exercise (n = 8–11). Plasma was collected immediately after the exercise session (15 m/min for 60 min). Mice were fed with chow diet. Values are mean ± S.E.M. ****p<0.0001, ***p<0.001, **p<0.01, *p<0.05.
Figure 1—figure supplement 1
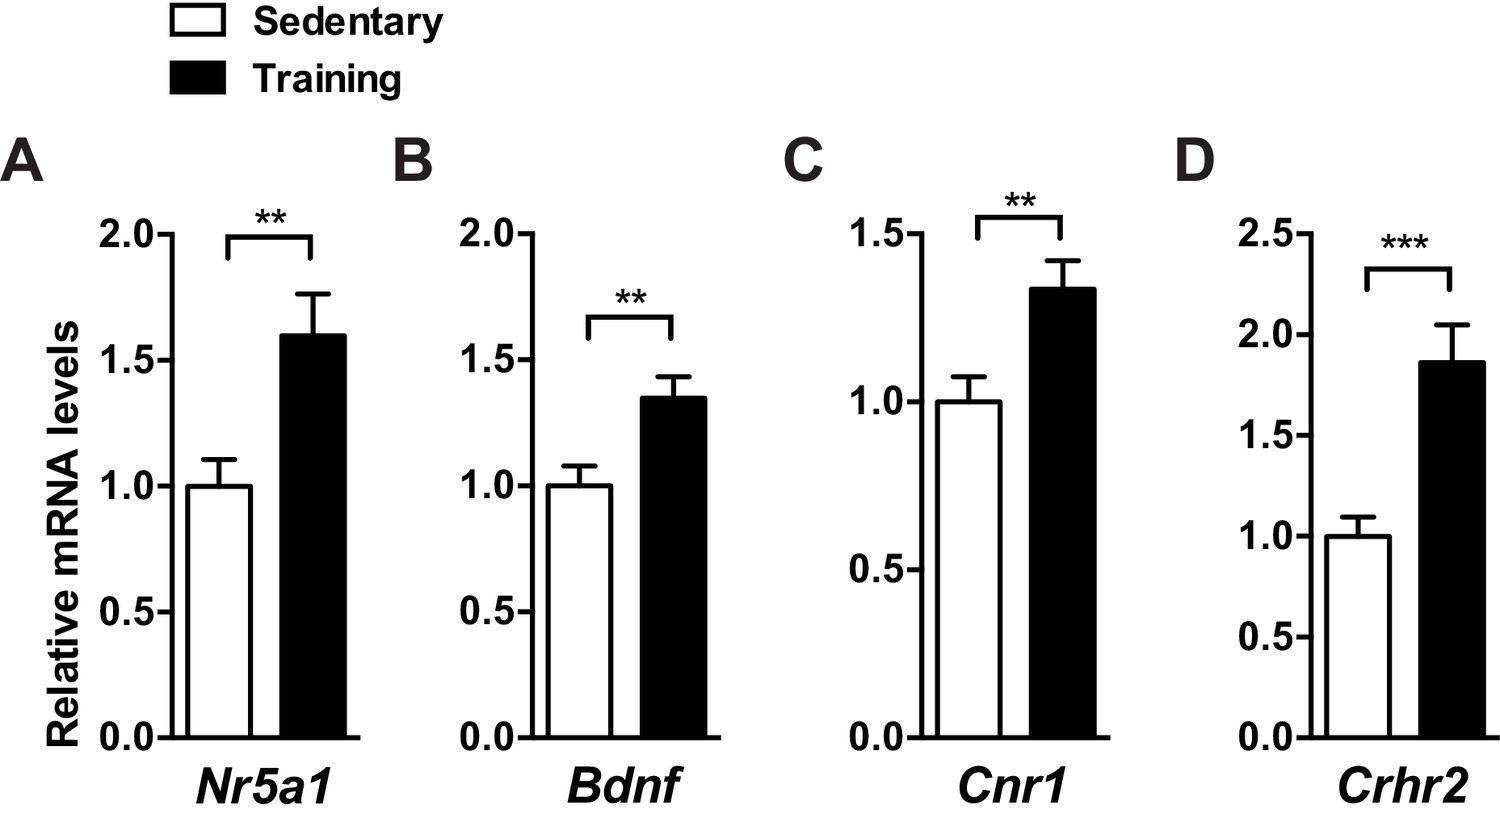
Exercise training increases mRNA levels of SF-1 and SF-1 target genes in the mediobasal hypothalamus.
Two weeks of exercise training (15 m/min for 60 min per day, five days per week) increases mRNA levels of (A) Nr5a1 (SF-1), (B) Bdnf, (C) Cnr1, and (D) Crhr2 in the mediobasal hypothalamus of C57BL/6J mice. The mediobasal hypothalamus was collected 2 hr after the last bout of exercise training. Values are mean ± S.E.M. **p<0.01, ***p<0.001
Figure 1—figure supplement 2
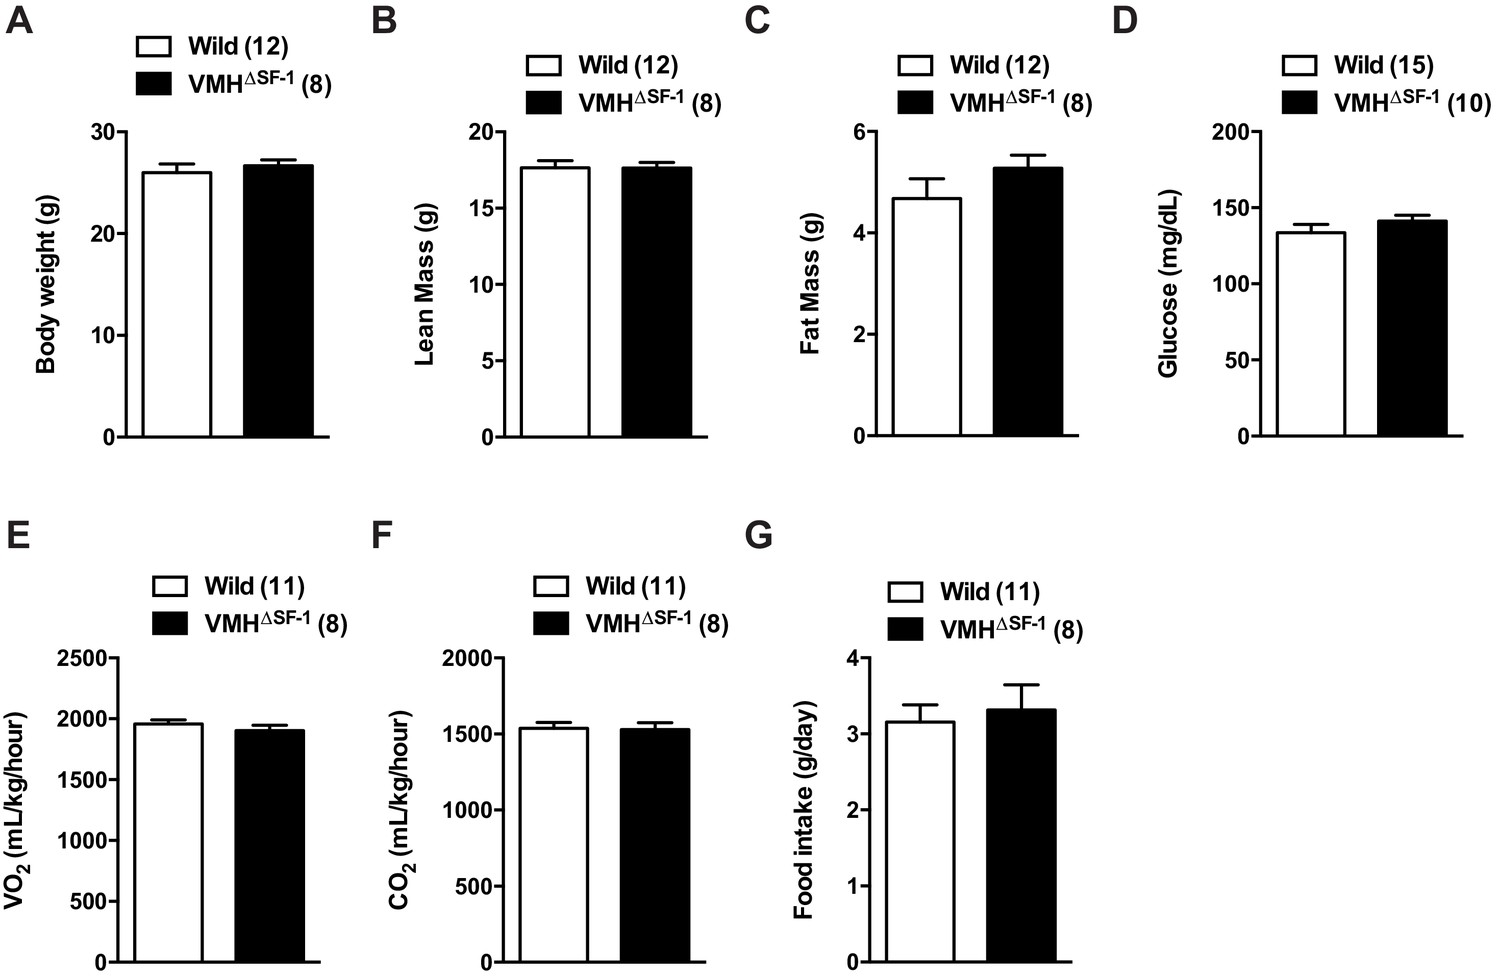
Deletion of SF-1 in the VMH does not affect basal metabolic rate in chow-fed sedentary mice.
(A) Body weight, (B) lean mass, (C) fat mass, (D) blood glucose, (E) oxygen consumption, (F) CO2 production, and (G) food intake were measured. All mice were fed with a chow diet under sedentary conditions. Values are mean ± S.E.M
Figure 1—figure supplement 3
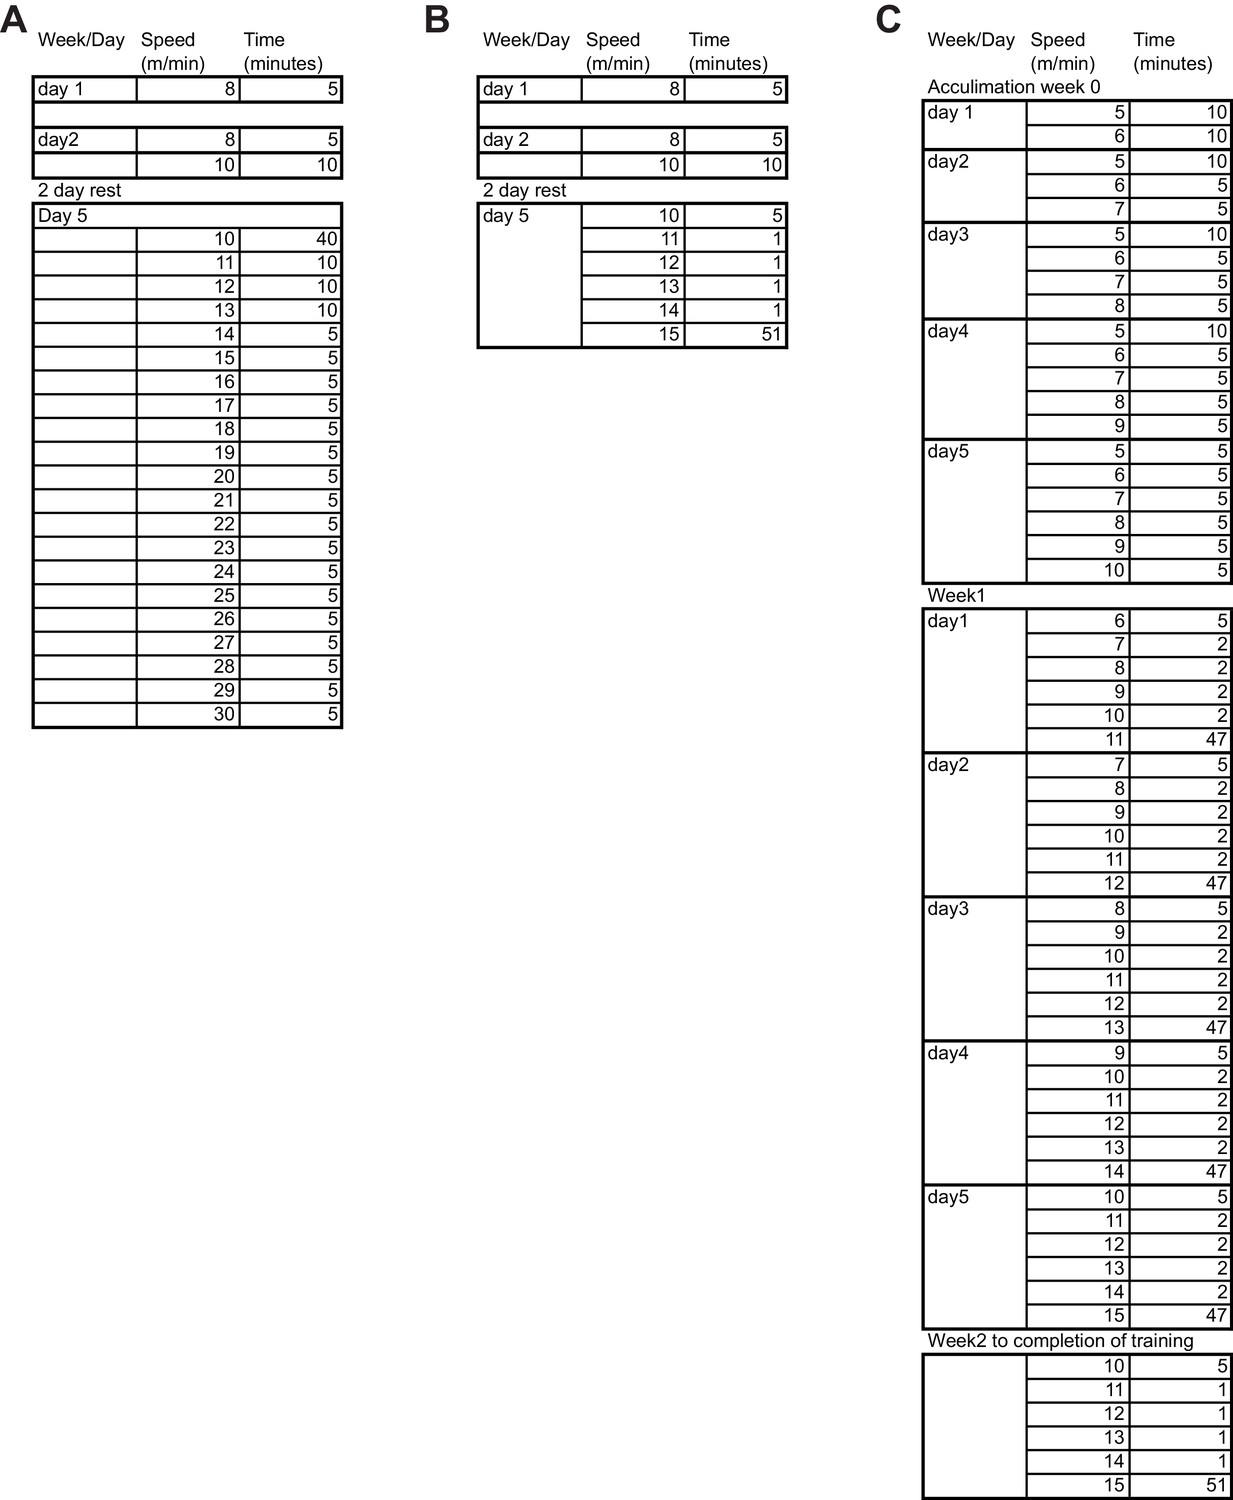
Exercise training regimen.
Detailed outline of the exercise regimens used for (A) endurance capacity test, (B) single bout of exercise, and (C) prolonged exercise training.
Figure 2
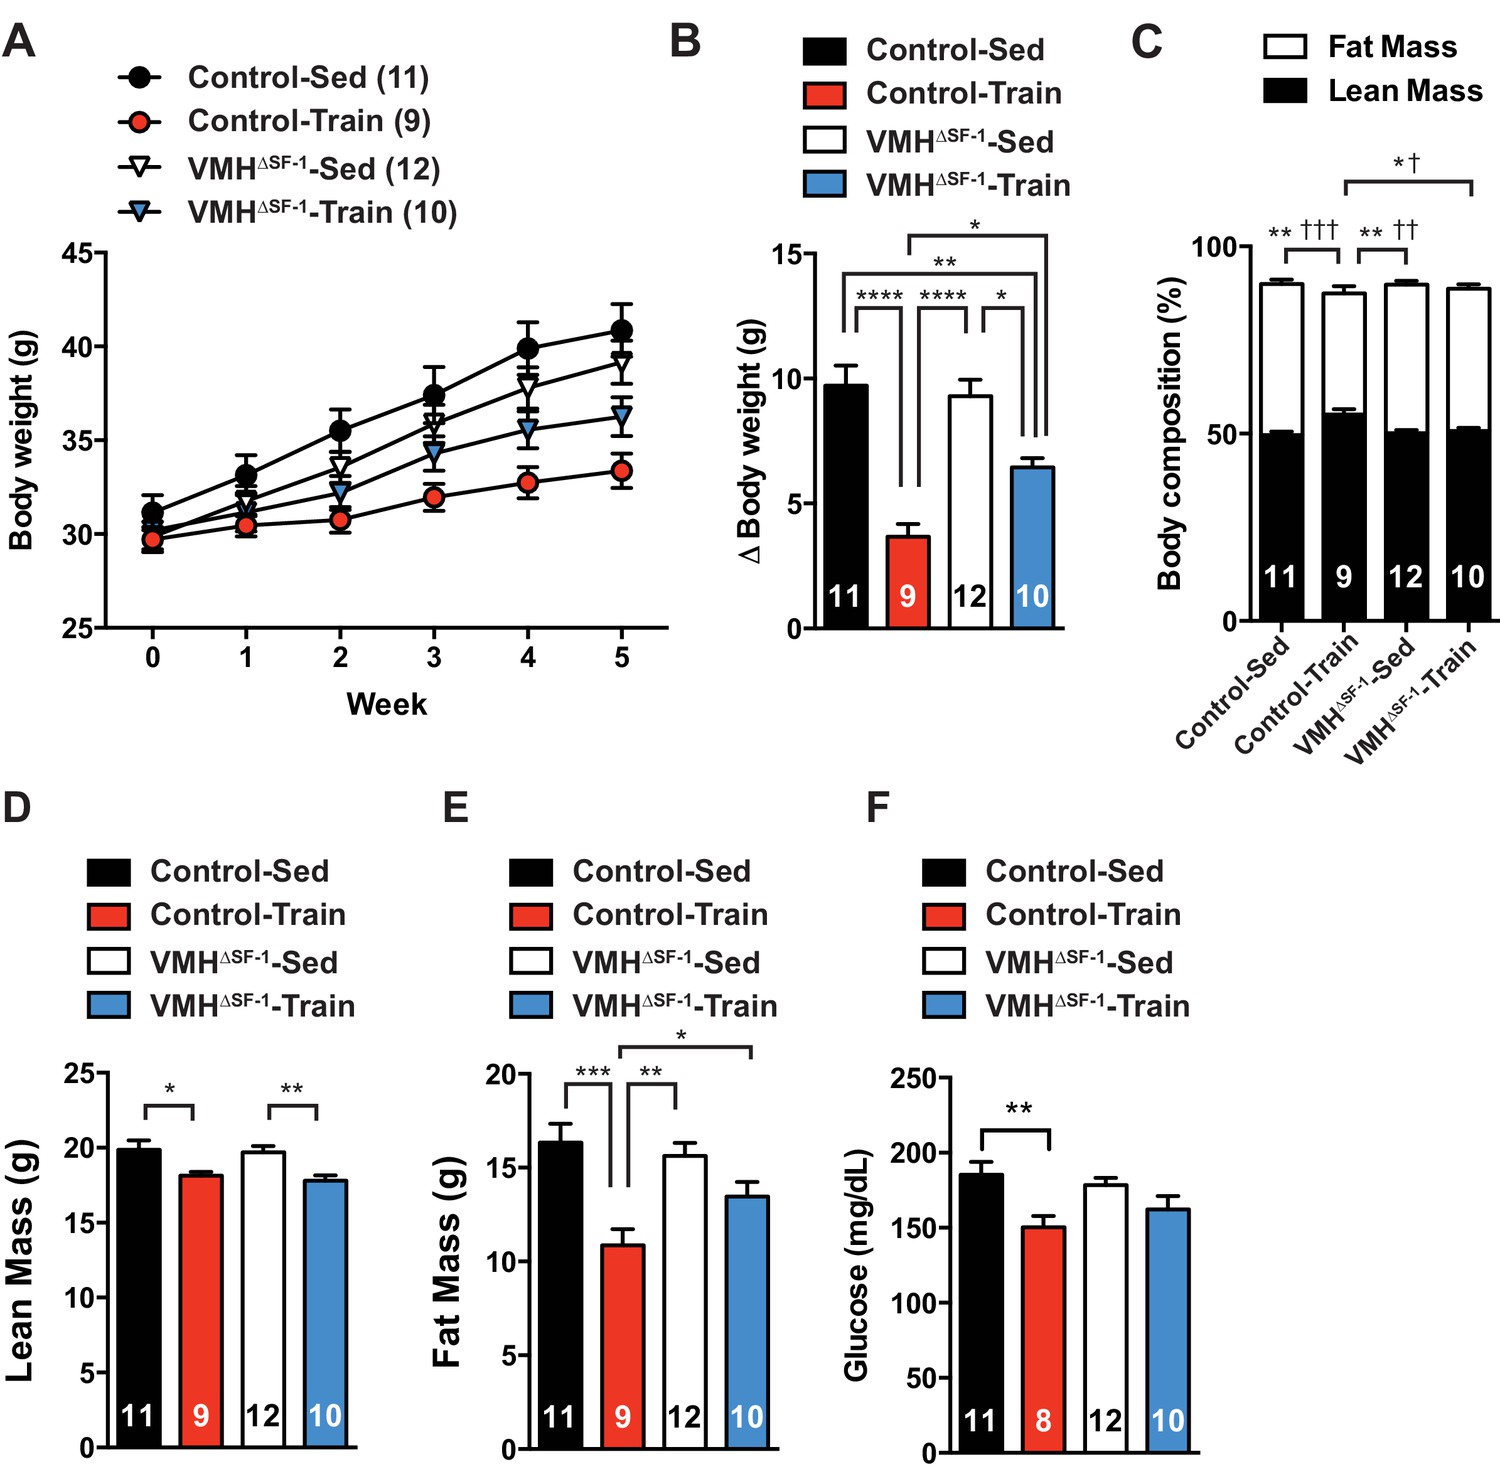
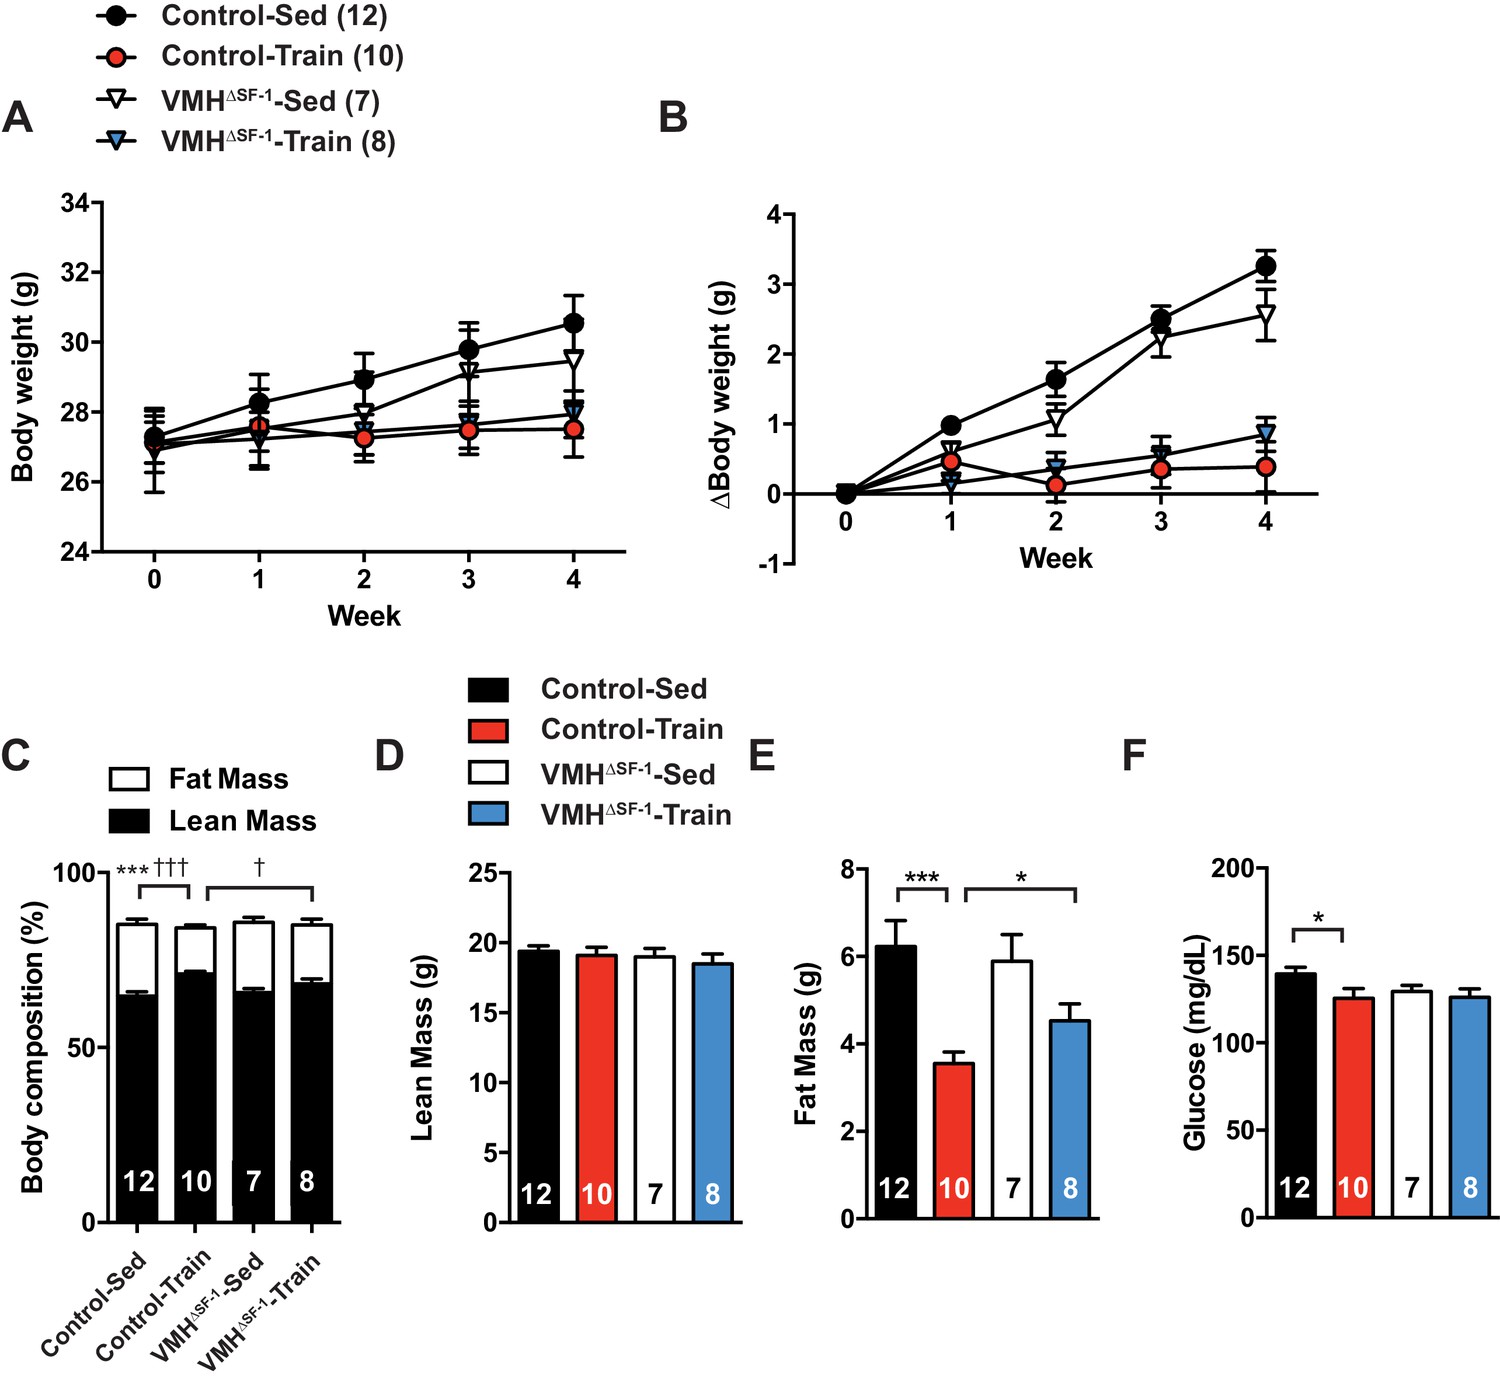
Deletion of SF-1 in the VMH attenuates exercise-mediated reductions in fat mass.
(A) Weekly body weight, (B) the change (Δ) in body weight between baseline (week 0) to post-exercise training (week 5), (C) body composition, (D) lean mass, (E) fat mass, and (F) glucose in the blood during the post-exercise training period for control and VMH∆SF-1 mice that either remained sedentary (Control-Sed and VMH∆SF-1-Sed) or were exercised (Control-Train and VMH∆SF-1-Train). Exercised and sedentary mice were housed together and all mice were fed with high-fat diet beginning at week −1 (age = 8–12 weeks). Exercise training was conducted on a treadmill at a speed of 15 m/min (incline 10°) for 60 min per day, five days per week for weeks 0–5 (Figure 1—figure supplement 3C). For body composition (C), * indicates statistical analysis for % lean mass and † indicates statistical analysis for % fat mass. Values are mean ± S.E.M. ****p<0.0001, ***p<0.001, **p<0.01, *p<0.05; †††p<0.001, ††p<0.01, and †p<0.05.
Figure 3 with 2 supplements
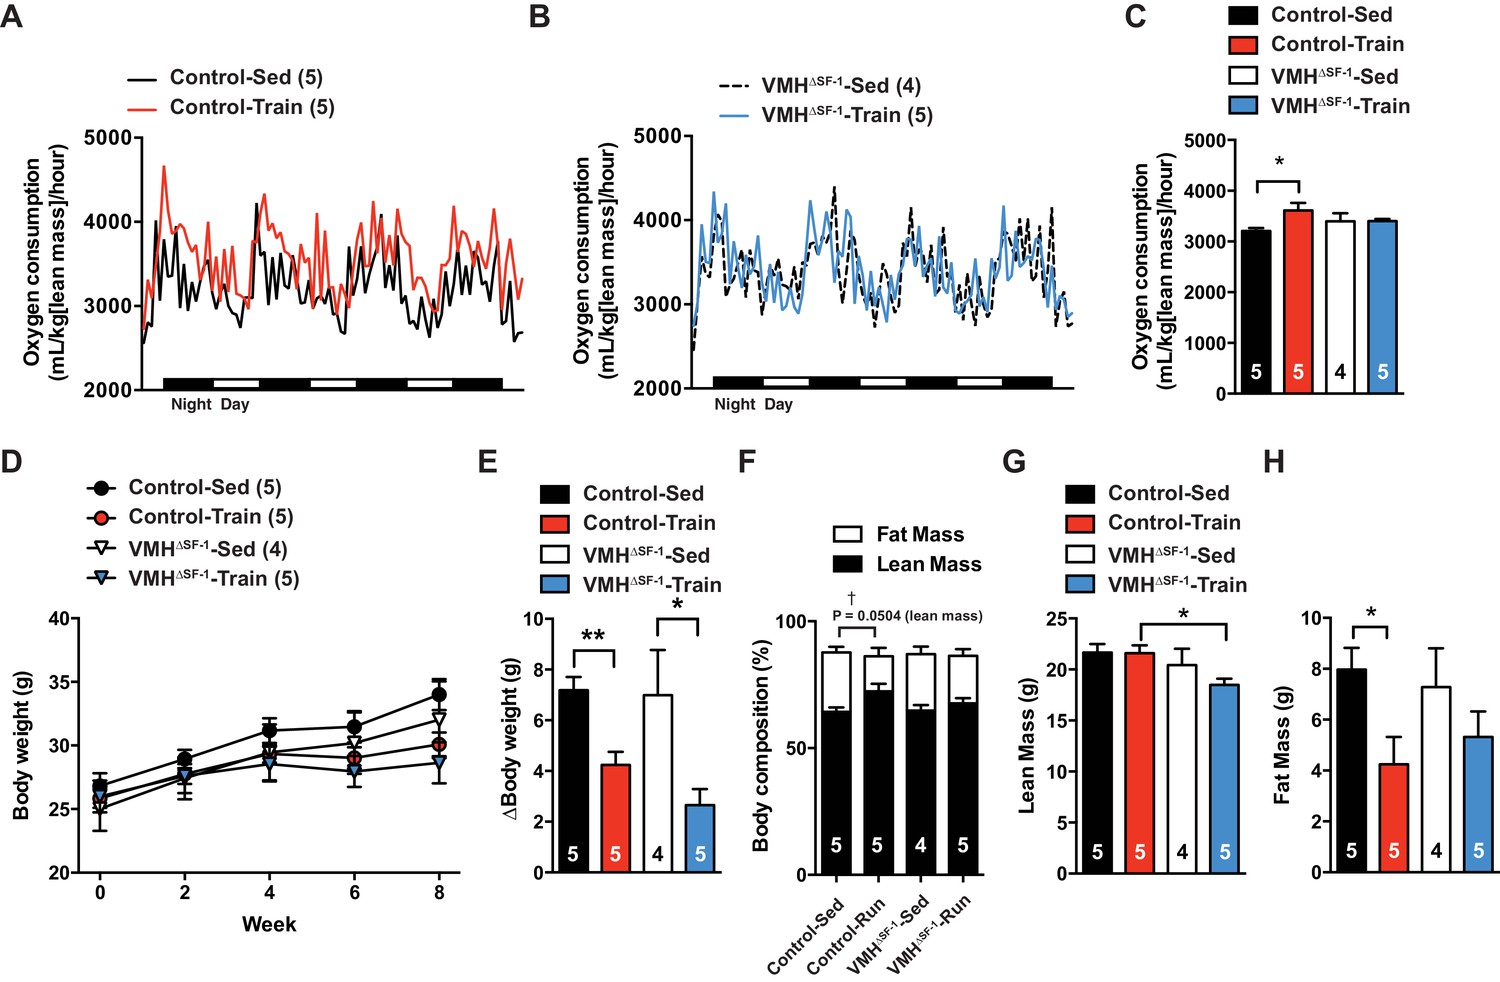
Deletion of SF-1 in the VMH blunts increases in basal metabolic rate and decreases lean mass in response to exercise training.
The metabolic analysis was performed following eight weeks of exercise training. (A–B) Oxygen consumption. (C) The area under the curve for oxygen consumption over 24 hr (54 to 78 hr after the last bout of exercise). (D) Weekly body weight, (E) body weight differences [from baseline (week 0) vs. week 8], (F) body composition, (G) lean mass, and (H) fat mass after eight weeks of exercise training for control and VMH∆SF-1 mice that either remained sedentary (Control-Sed and VMH∆SF-1-Sed) or were exercised (Control-Train and VMH∆SF-1-Train). The same exercise regime as described in Figure 2 (See also Figure 1—figure supplement 3C) was used. All mice were fed with chow diet. For body composition (F), † indicates statistical analysis for % fat mass. Values are mean ± S.E.M. *p<0.05 and †p<0.05.
Figure 3—figure supplement 1
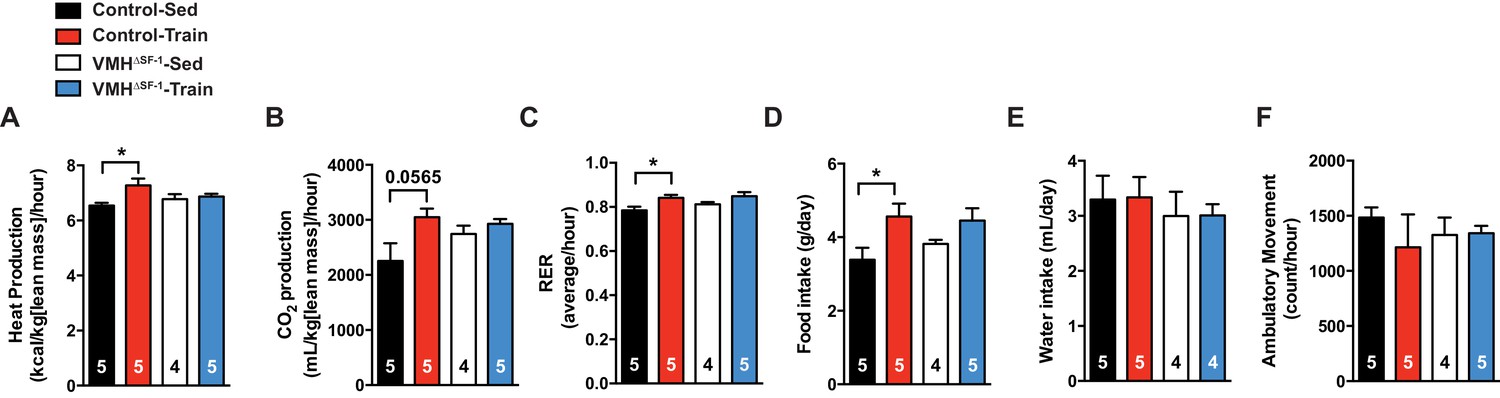
Deletion of SF-1 in the VMH does not affect food intake, water intake and ambulatory movement after exercise training.
(A) Heat production, (B) CO2 production, (C) food intake, (D) respiratory exchange ratio, (E) water intake and (F) ambulatory movement were measured after eight weeks of exercise training in the VMH∆SF-1 mice (54 to 78 hr after the last bout of exercise, as described in Figure 3). All mice were fed with chow diet. Values are mean ± S.E.M. *p<0.05
Figure 3—figure supplement 2
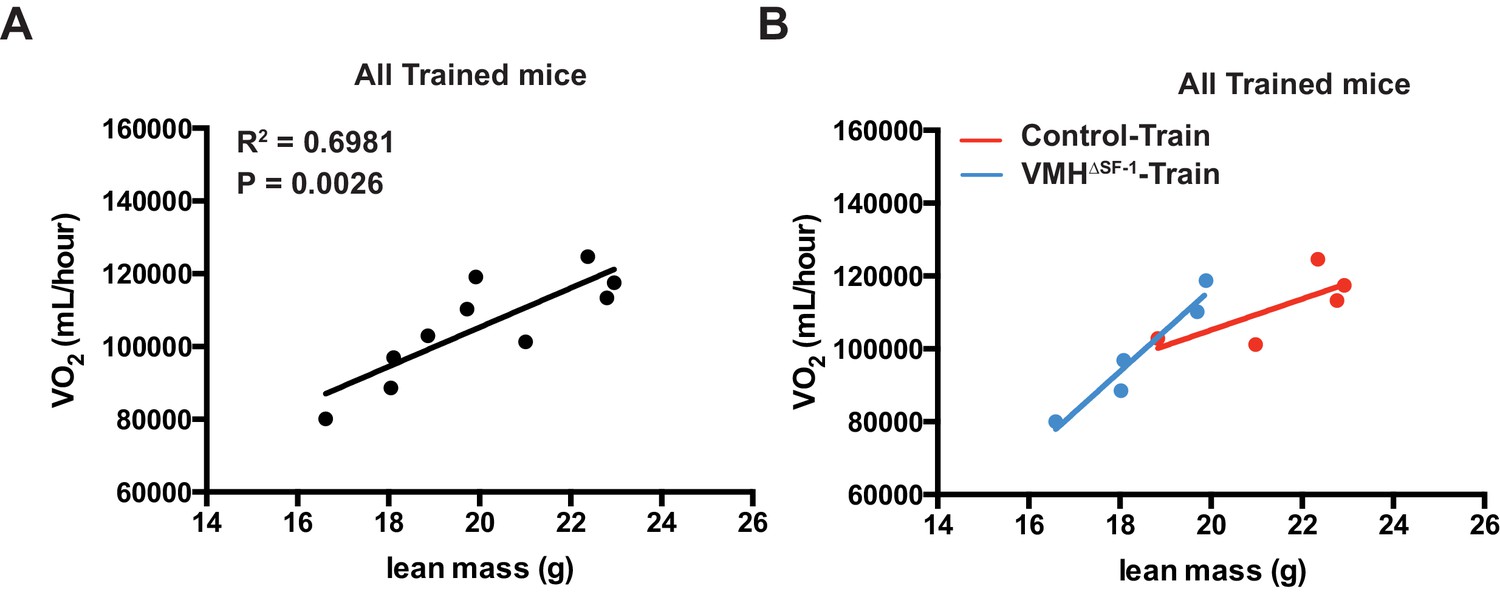
Correlation between lean mass and oxygen consumption after eight weeks of training.
(A) Correlation plots in all trained mice (combined Control-Train and VMH∆SF-1-Train mice) three days following the last training session, and (B) the corresponding correlation plots of trained mice separated by genotype (Control-Train and VMH∆SF-1-Train mice).
Figure 4 with 5 supplements
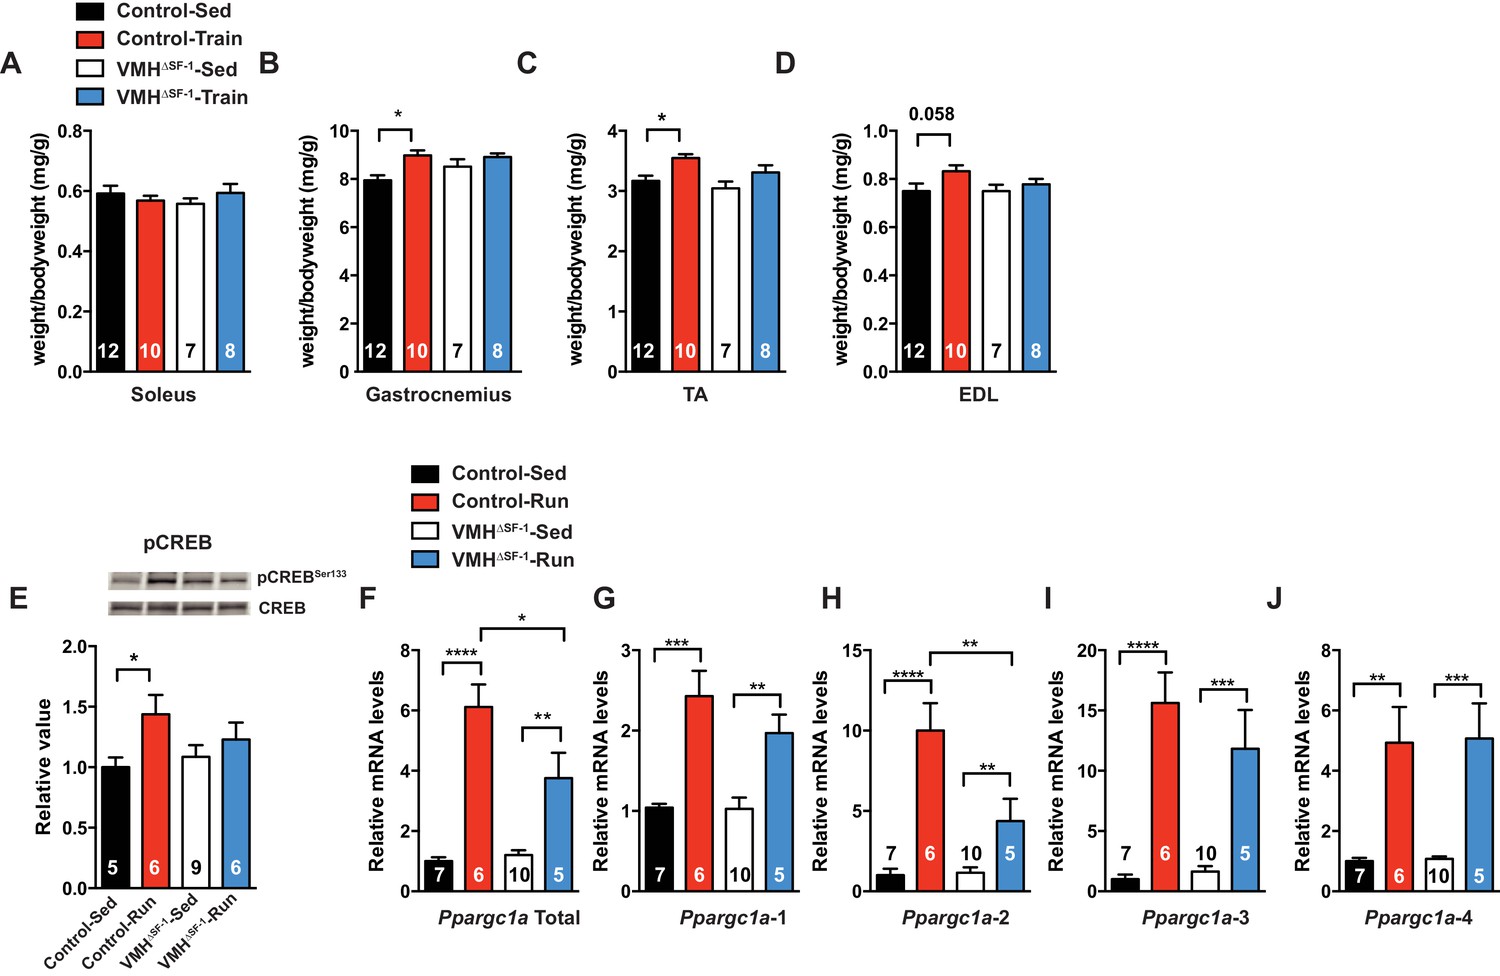
Deletion of SF-1 in the VMH blunts skeletal muscle adaptations to exercise training.
(A–D) Following four weeks of exercise training, muscle weights for (A) soleus, (B) gastrocnemius, (C) tibialis anterior (TA), and (D) extensor digitorum longus (EDL) from sedentary (Control-Sed and VMH∆SF-1-Sed) or exercised (Control-Train and VMH∆SF-1-Train) mice were determined. Tissues were collected 72 hr after the last bout of exercise. The same exercise regime as described in Figure 2 (see also Figure 1—figure supplement 3C) was used. (E–J) Tibialis anterior muscles were analyzed from mice two hours following a single exercise session (Control-Run and VMH∆SF-1-Run) and from time-matched sedentary controls (Control-Sed and VMH∆SF-1-Sed) to determine (E) phosphorylation of CREB Ser 133 (pCREBSer133) levels, and mRNA levels for Ppargc1a (PGC-1α) isoforms: (F) total, (G) α−1, (H) α−2, (I) α−3, and (J) α−4. All mice were fed chow diet. Values are mean ± S.E.M. *p<0.05.
Figure 4—figure supplement 1
Deletion of SF-1 in the VMH blunts improvement in body composition and glycemia of chow-fed mice in response to exercise training.
(A) Weekly body weight, (B) the change (Δ) in body weight between baseline (week 0) to post-exercise training (week 4), (C) body composition, (D) lean mass, (E) fat mass, and (F) glucose levels in the blood after four weeks of exercise training in control and VMH∆SF-1 mice. The same exercise regimen described in Figure 1 was used. All mice were fed with chow diet. For body composition (A), † indicates statistical analysis for % fat mass. Values are mean ± S.E.M. ***p<0.001, *p<0.05 and †††p<0.001, †p<0.05.
Figure 4—figure supplement 2
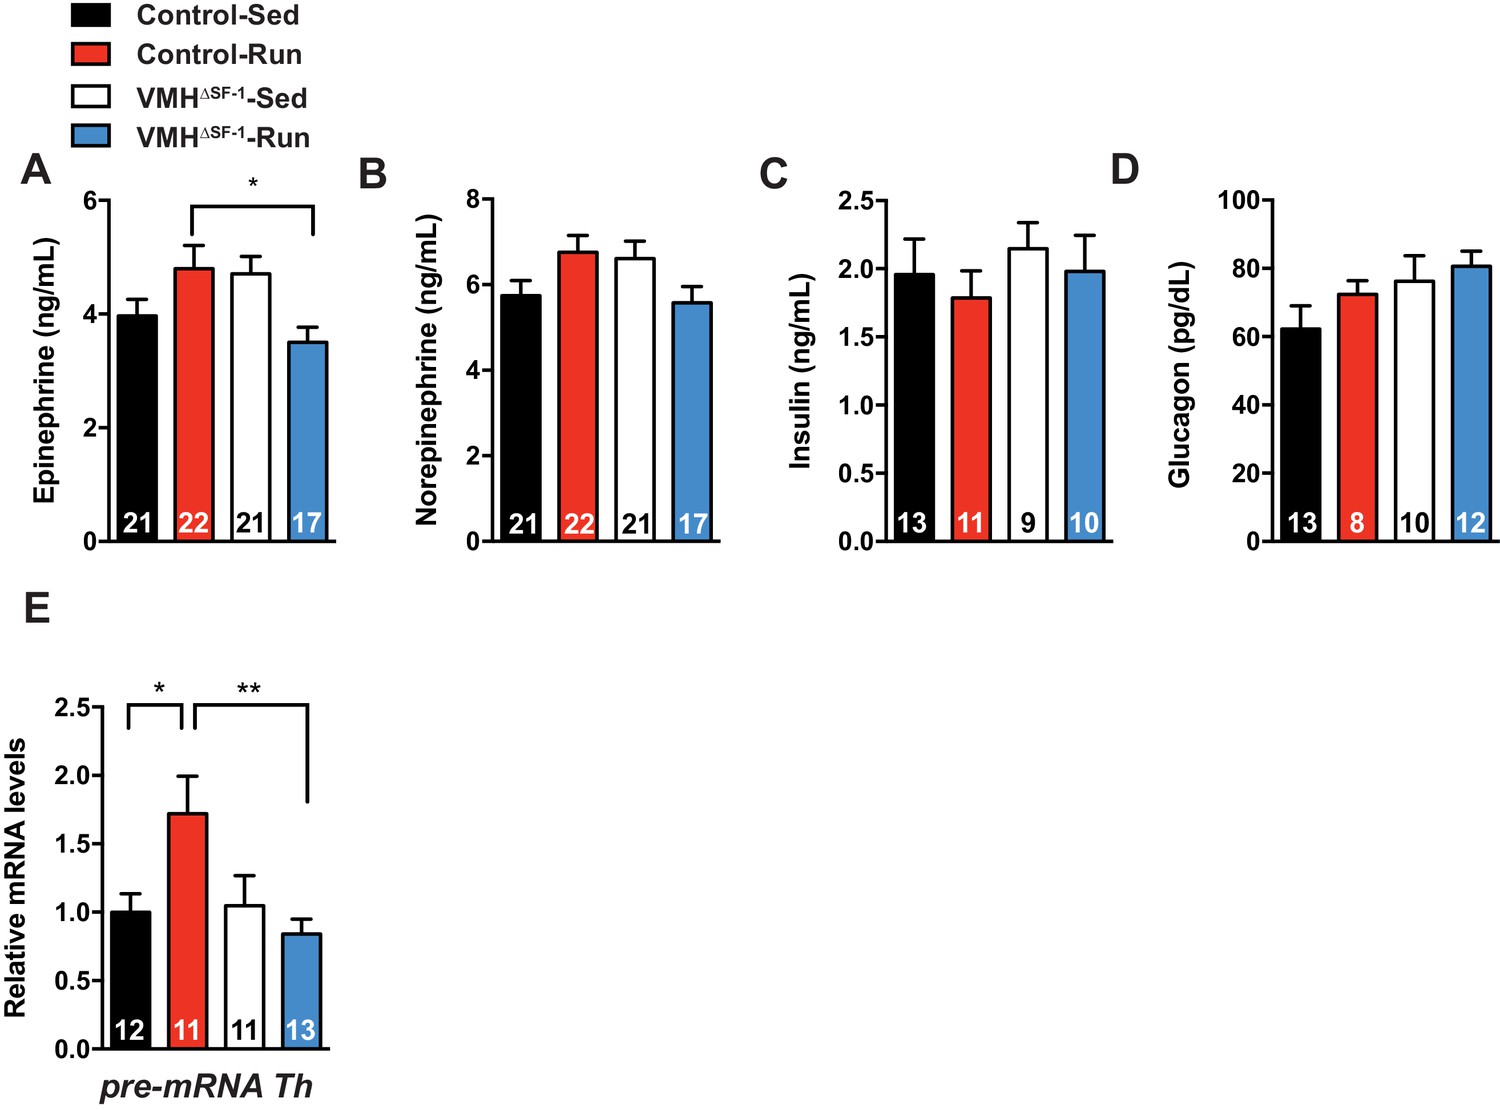
Deletion of SF-1 in the VMH blunts sympathetic drives to the adrenal gland.
Circulating (A) epinephrine, (B) norepinephrine, (C) insulin, and (D) glucagon levels immediately after exercise. (E) pre-mRNA levels of tyrosine hydroxylase (TH) in the adrenal gland 2 hr after a single bout of exercise. All mice were fed with chow diet. Values are mean ± S.E.M. **p<0.01, *p<0.05
Figure 4—figure supplement 3
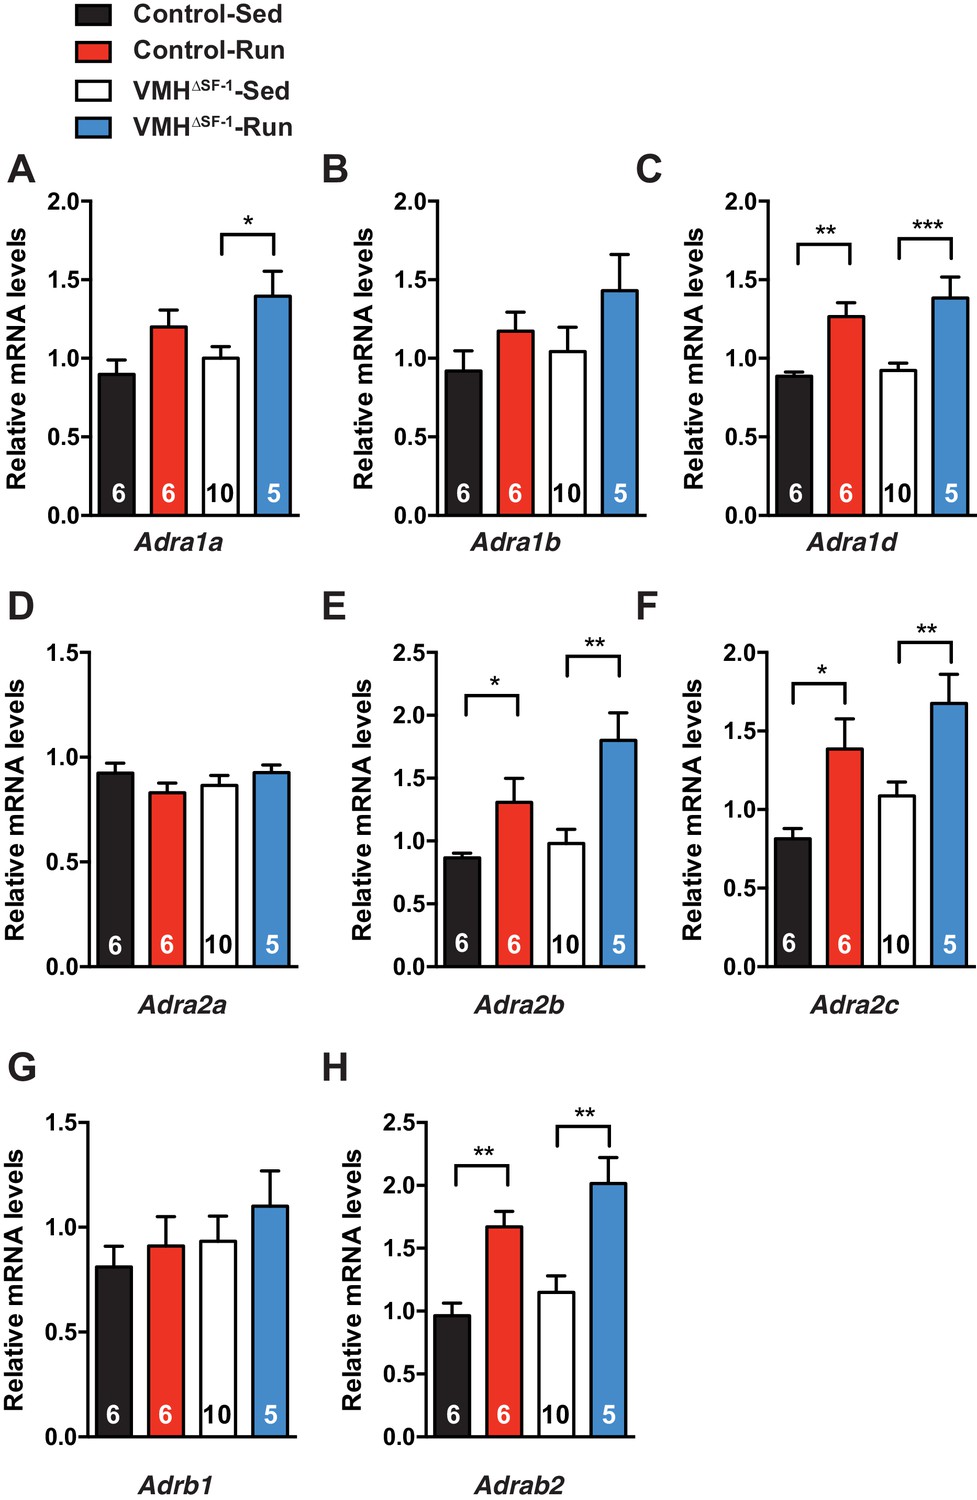
Deletion of SF-1 in the VMH does not affect mRNA levels of adrenergic receptors in the skeletal muscle.
mRNA expression levels of (A) Adra1a, (B) Adra1b, (C) Adra1d, (D) Adra2a, (E) Adra2b, (F) Adra2c, (G) Adrb1, and (H) Adrab2, in TA muscle 2 hr after one bout of exercise. Adrb3 mRNA was not detectable in TA muscle. Values are mean ± S.E.M. **p<0.01, *p<0.05
Figure 4—figure supplement 4
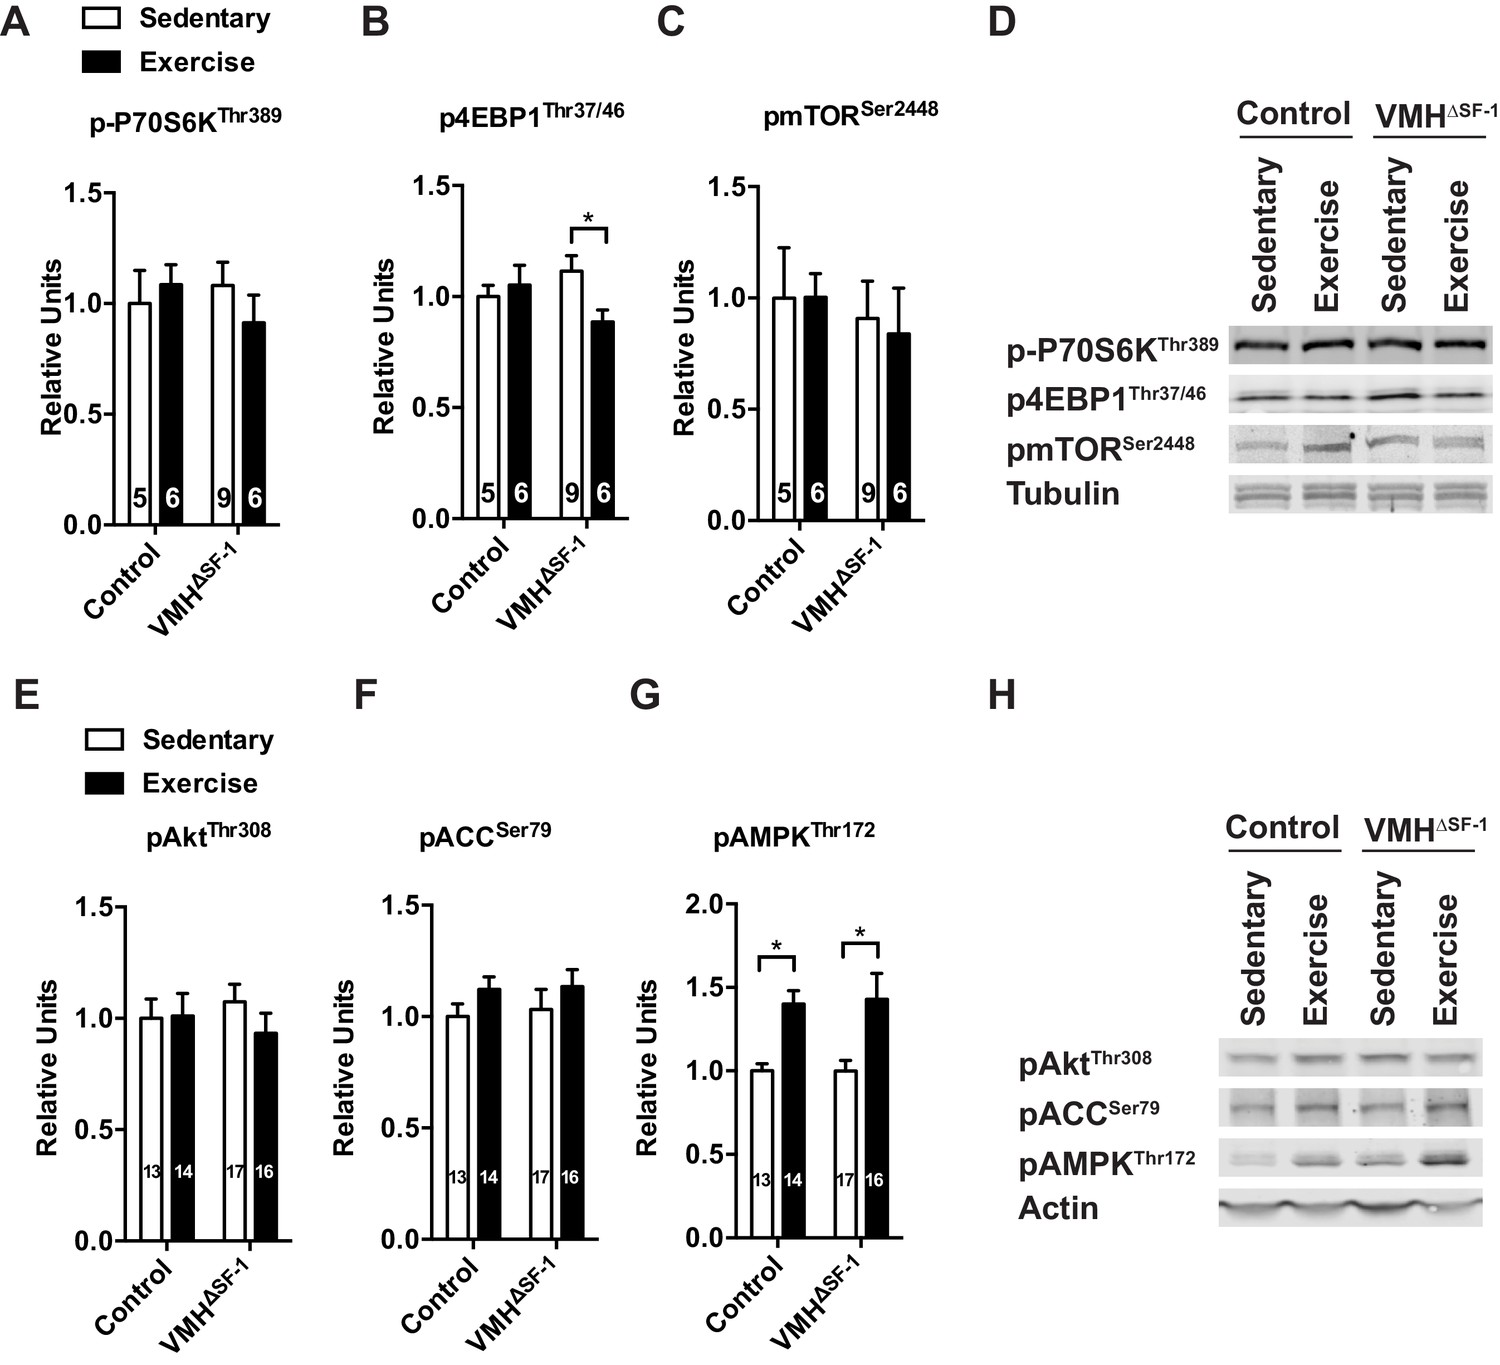
Deletion of SF-1 in the VMH does not affect the mTOR and AKT signaling pathways in TA skeletal muscle in response to exercise training or acute exercise.
Phosphorylation of (A) P70S6K (Thr 389), (B) 4EBP1 (Thr37/46), (C) mTOR (Ser 2448) levels in TA muscle 2 hr after one bout of exercise. (D) Representative immunoblots for (A–C). (E) AKT (Thr308), (F) ACC (Ser79), (G) AMPK (Thr172) levels in TA muscle 2 hr after one bout of exercise. (H) Representative immunoblots for (E–G). Values are mean ± S.E.M. *p<0.05
Figure 4—figure supplement 5
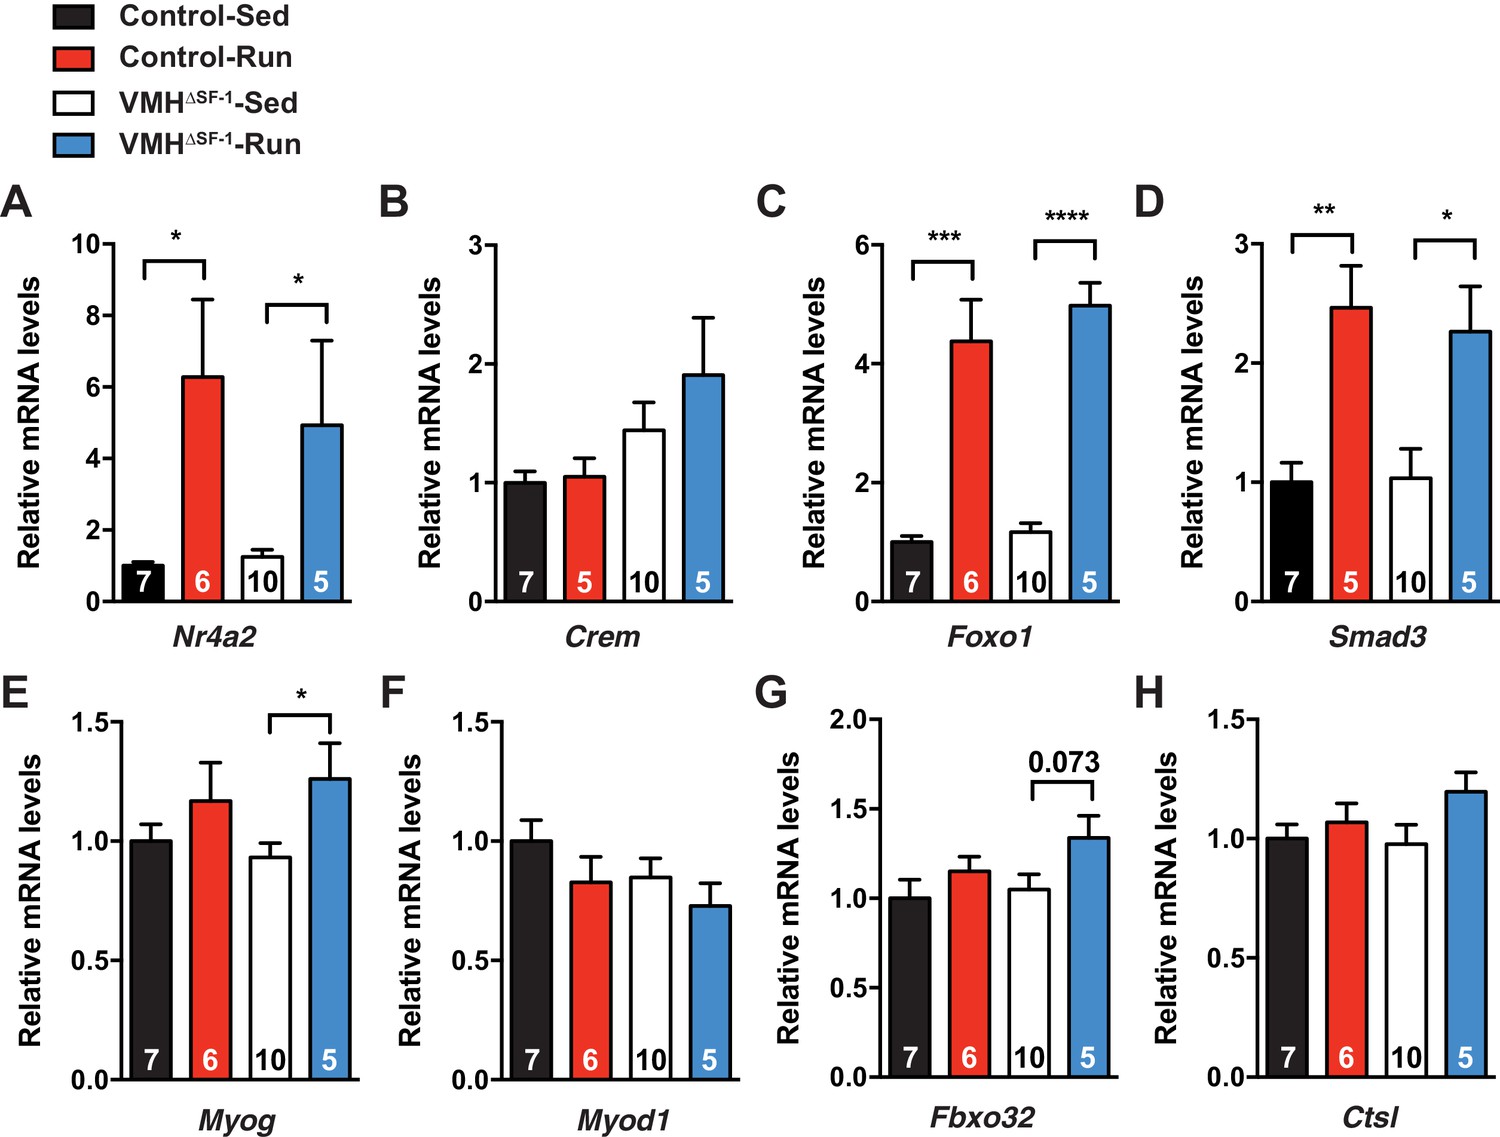
Deletion of SF-1 in the VMH alters mRNA levels of genes regulating protein turnover in the skeletal muscle.
mRNA expression levels of (A) Nr4a2, (B) Crem, (C) Foxo1, (D) Smad3, (E) Myog, (F) Myod1, (G) Fbxo32, and (H) Ctsl, in TA muscle 2 hr after one bout of exercise. Values are mean ± S.E.M. ****p<0.001, p<0.001, **p<0.01, *p<0.05
Additional files
-
Supplementary file 1
The detailed statistical analysis of figures.The table shows the statistics test, number of N, comparison, p value, and degrees of freedom and F/t/z/R/ETC value in each figure panel.
- https://doi.org/10.7554/eLife.18206.016
Download links
A two-part list of links to download the article, or parts of the article, in various formats.
Downloads (link to download the article as PDF)
Open citations (links to open the citations from this article in various online reference manager services)
Cite this article (links to download the citations from this article in formats compatible with various reference manager tools)
SF-1 expression in the hypothalamus is required for beneficial metabolic effects of exercise
eLife 5:e18206.
https://doi.org/10.7554/eLife.18206


