Accelerated remyelination during inflammatory demyelination prevents axonal loss and improves functional recovery
- University of California, San Francisco, United States
- Third Military Medical University, China
- Inception Sciences, United States
- University of Vermont, United States
- National Institute of Diabetes and Digestive and Kidney Diseases, National Institutes of Health, United States
- Texas Tech University Health Sciences Center, School of Medicine, United States
Figures
Figure 1

Axonal degeneration and remyelination after inflammatory demyelination in EAE.
Representative spinal cord sections were stained for OsO4 (black) showing myelin in the naïve (a), and EAE mice at the peak (b) and late stages (c) of EAE. Demyelination is indicated as unstained regions in the white matter tracts. Representative cross sections of spinal cord were immunostained for MOG (green) and NF (red) (d–f) showing myelin and axons in the naïve (d) and the EAE mice at the peak (e) and at late stages of disease (f). (g) Representative transmission electron microscopic images showing normally myelinated axons in naïve mice. h, (i) Representative transmission electron microscopic images showing demyelinated (A1), remyelinated (A2) and possibly degenerating axons (*; diffuse cytoplasmic staining) at the late stage of EAE in spinal cord white matter.
Figure 2
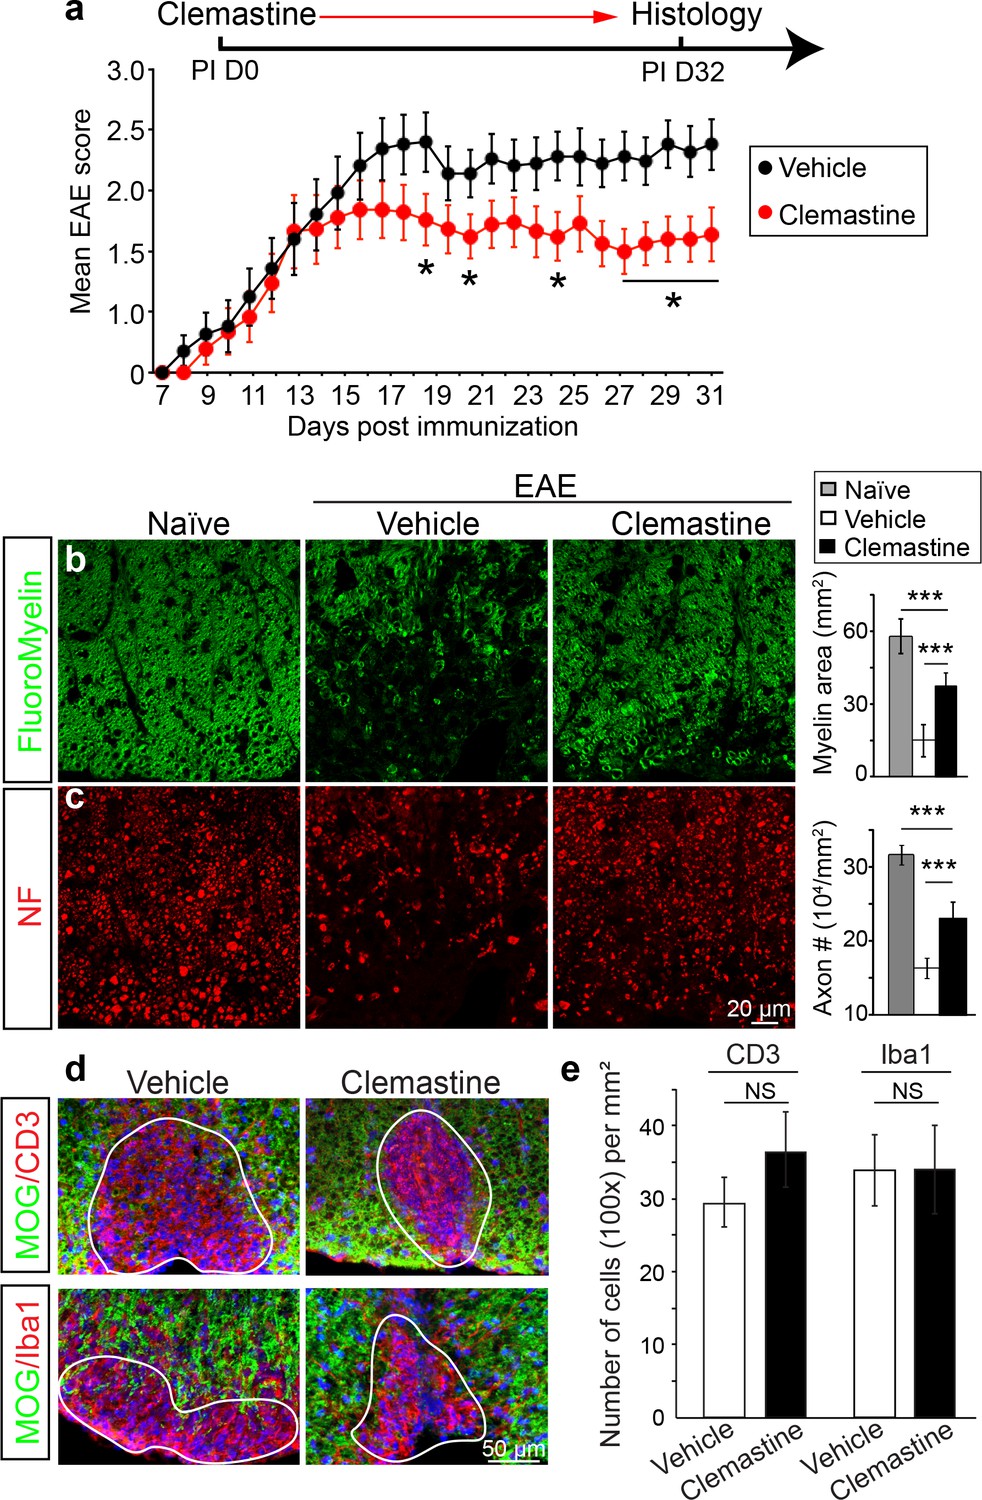
Administration of clemastine attenuates EAE clinical scores and prevents axonal loss.
(a) Daily treatment of clemastine (10 mg/kg, n = 25) from day 0 decreases the clinical severity in the MOG35-55 induced EAE model. Error bars represent mean ± s.e.m. Significance of data is based on the Mann-Whitney test for individual days comparing vehicle (n = 25) to clemastine treated (*p<0.05). (b, c) FluoroMyelin (green, b) and NF immunostaining (red, c) illustrates that clemastine promotes myelin positive staining and prevents axonal loss in the white matter tracts of the spinal cord cross sections compared to the vehicle control. FluoroMyelin positive areas and NF positive axons were quantified. Error bars represent mean ± s.e.m. and all experiments were performed in triplicate. ***p<0.001, significance based on Student’s t-test with the respective controls. n = 3 for all experiments. (d) Demyelinated lesions from spinal cord sections from clemastine treated and vehicle control mice were analyzed for T-cells and macrophages/microglia. Sections were immunostained for MOG (green), CD3 (T-cells; red), and Iba1 (macrophages and microglia; red). (e) Density of CD3 and Iba1 positive cells were quantified in demyelinated lesions from vehicle control and clemastine treated mice at the late stage of EAE. Error bars represent mean ± s.e.m. (experiments were performed in triplicate).
Figure 3 with 1 supplement

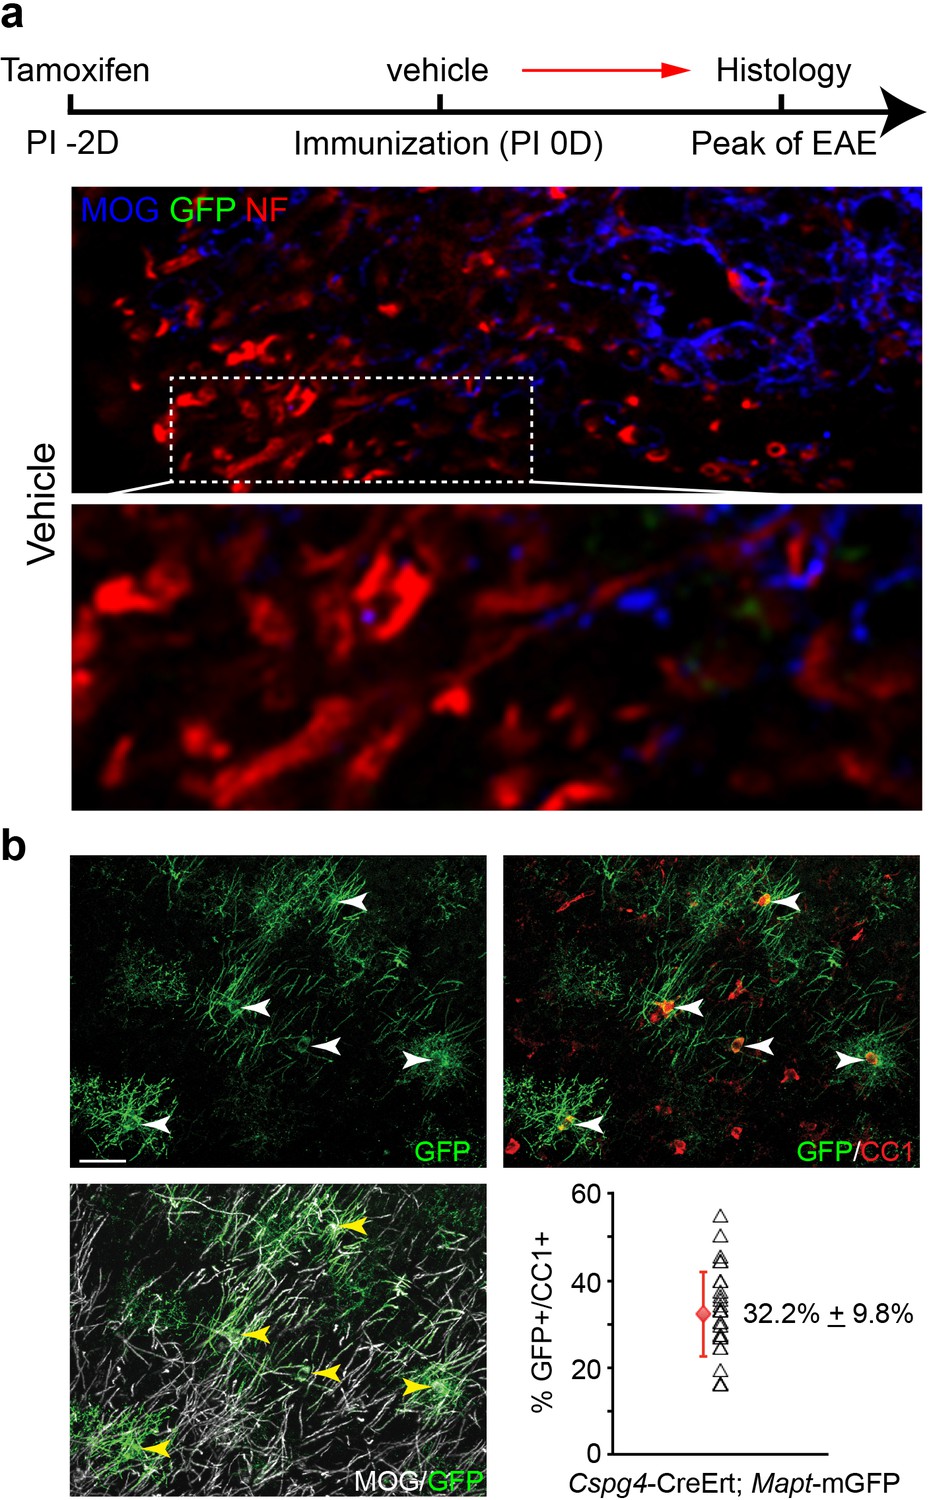
Lineage-specific tracing of remyelination by newly-formed oligodendrocytes in EAE.
Lineage-specific tracing of remyelination by newly-formed oligodendrocytes was accomplished using the Cspg4-CreErt; Mapt-mGFP line. Recombination is induced by a single dose of tamoxifen in NG2 cells (OPCs), two days prior to immunization and clemastine administration (a). As OPCs do not express tau, only the newly differentiated OLs express mGFP. (b) MOG and NF immunostaining display a number of GFP positive myelin sheaths wrapping demyelinated axons (NF+/MOG-) after clemastine treatment. Additionally, a number of axons undergoing remyelination are surrounded by thin GFP membrane that are still yet negative for MOG expression (c).
Figure 3—figure supplement 1
Oligodendroglial lineage-specific tracing of remyelination in EAE treated with vehicle.
Cspg4-CreErt; Mapt-mGFP recombination is induced with a single dose of tamoxifen at two days prior to immunization. (a) MOG and NF immunostaining showing demyelinated axons without GFP positive myelin sheaths. (b) Recombination efficiency of the Cspg4-CreErt; Mapt-mGFP mice was examined in 14-day old mice by administration of tamoxifen at postnatal day 8. By examining cortical regions where myelination is sparse at postnatal day 14, we immunostained for GFP, CC1 (oligodendrocytes) and MOG (myelin) and quantified the percentage of GFP positive, CC1 positive oligodendrocytes. The mean recombination percentage is presented with an error bar that represents s.d (red). Three mice were used for quantification of recombination efficiency.
Figure 4 with 1 supplement
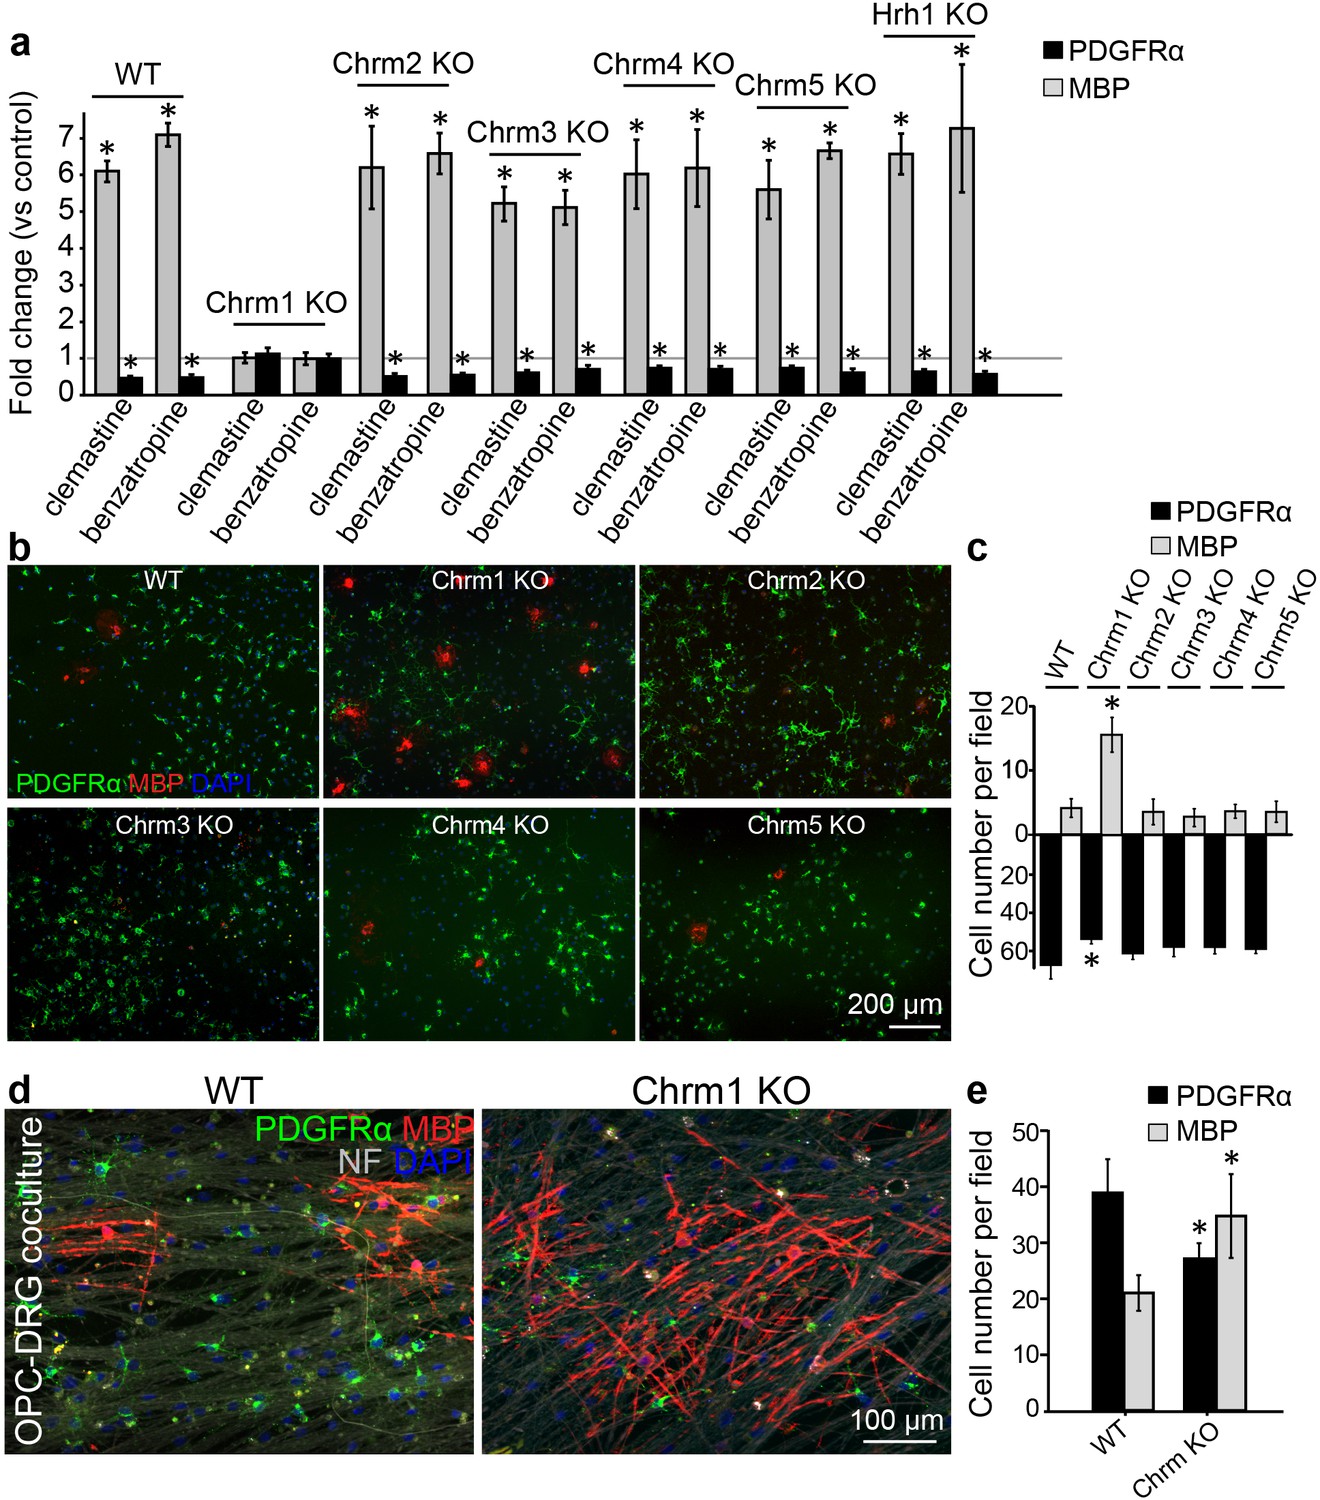
Identification of the M1 muscarinic acetylcholine receptor as a target for remyelination.
(a,b) OPC cultures from Chrm1, Chrm2, Chrm3, Chrm4, Chrm5 or Hrh1 knockout mice are immunostained for MBP (red) and PDGFRα (green). MBP and PDGFRα positive cells are quantified and normalized to the vehicle control in each OPC culture upon 48 hr treatment with clemastine or benzatropine (a). Representative images of individual knockout OPC cultures without any treatment (b). (d) Rat DRG neuron cocultures with Chrm1 null OPCs were cultured for 9 days and immunostained for MBP (red), PDGFRα for OPCs (green) and neurofilament for axons (white). Cell nuclei are identified by DAPI (blue). Quantification of the percentages of MBP- and PDGFRα- positive cells from the purified OPC cultures (c) or DRG cocultures (e). Error bars represent mean ± s.e.m. and all experiments were performed in triplicate. *p<0.05, significance based on Student’s t-test with the respective controls. n = 3 for all experiments.
Figure 4—figure supplement 1
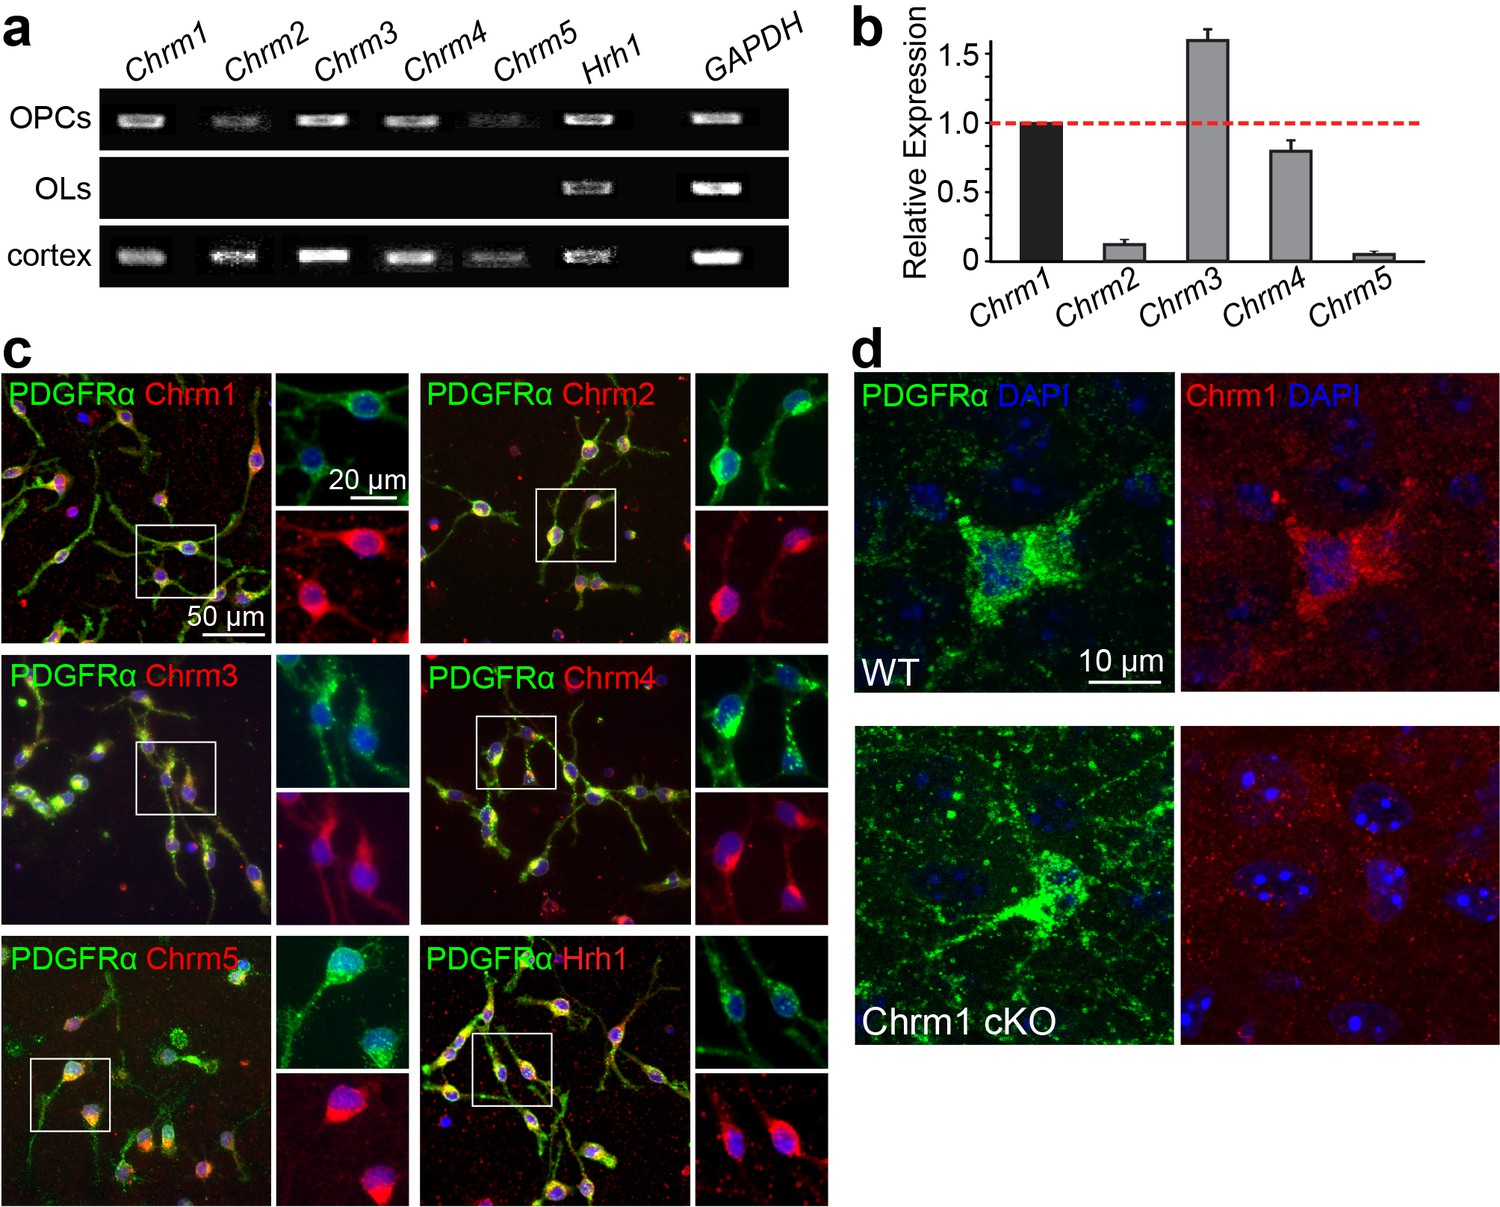
Expression of muscarinic acetylcholine receptors on oligodendroglia.
(a) Detection of Chrm1, Chrm2, Chrm3, Chrm4, Chrm5 and Hrh1 mRNA in rat OPC and OL cultures by RT-PCR. Rat cortex cDNA at P8 was used as a positive control and GAPDH as an internal control. (b) mRNA levels for Chrm1, Chrm2, Chrm3, Chrm4, and Chrm5 were quantified by qPCR. in pufiried OPC cultures. (c) Purified OPC cultures were immunostained for Chrm1 (red), Chrm2 (red), Chrm3 (red), Chrm4 (red), Chrm5 (red) or Hrh1 (red) and PDGFRα positive OPCs (green). Cell nuclei are identified by DAPI (blue). (d) The Chrm1 antibody was validated in the Chrm1 cKO mouse in OPCs. Spinal cord sections from WT and Chrm1 cKO mice were immunostained for PDGFRα (green) and Chrm1 (red).
Figure 5
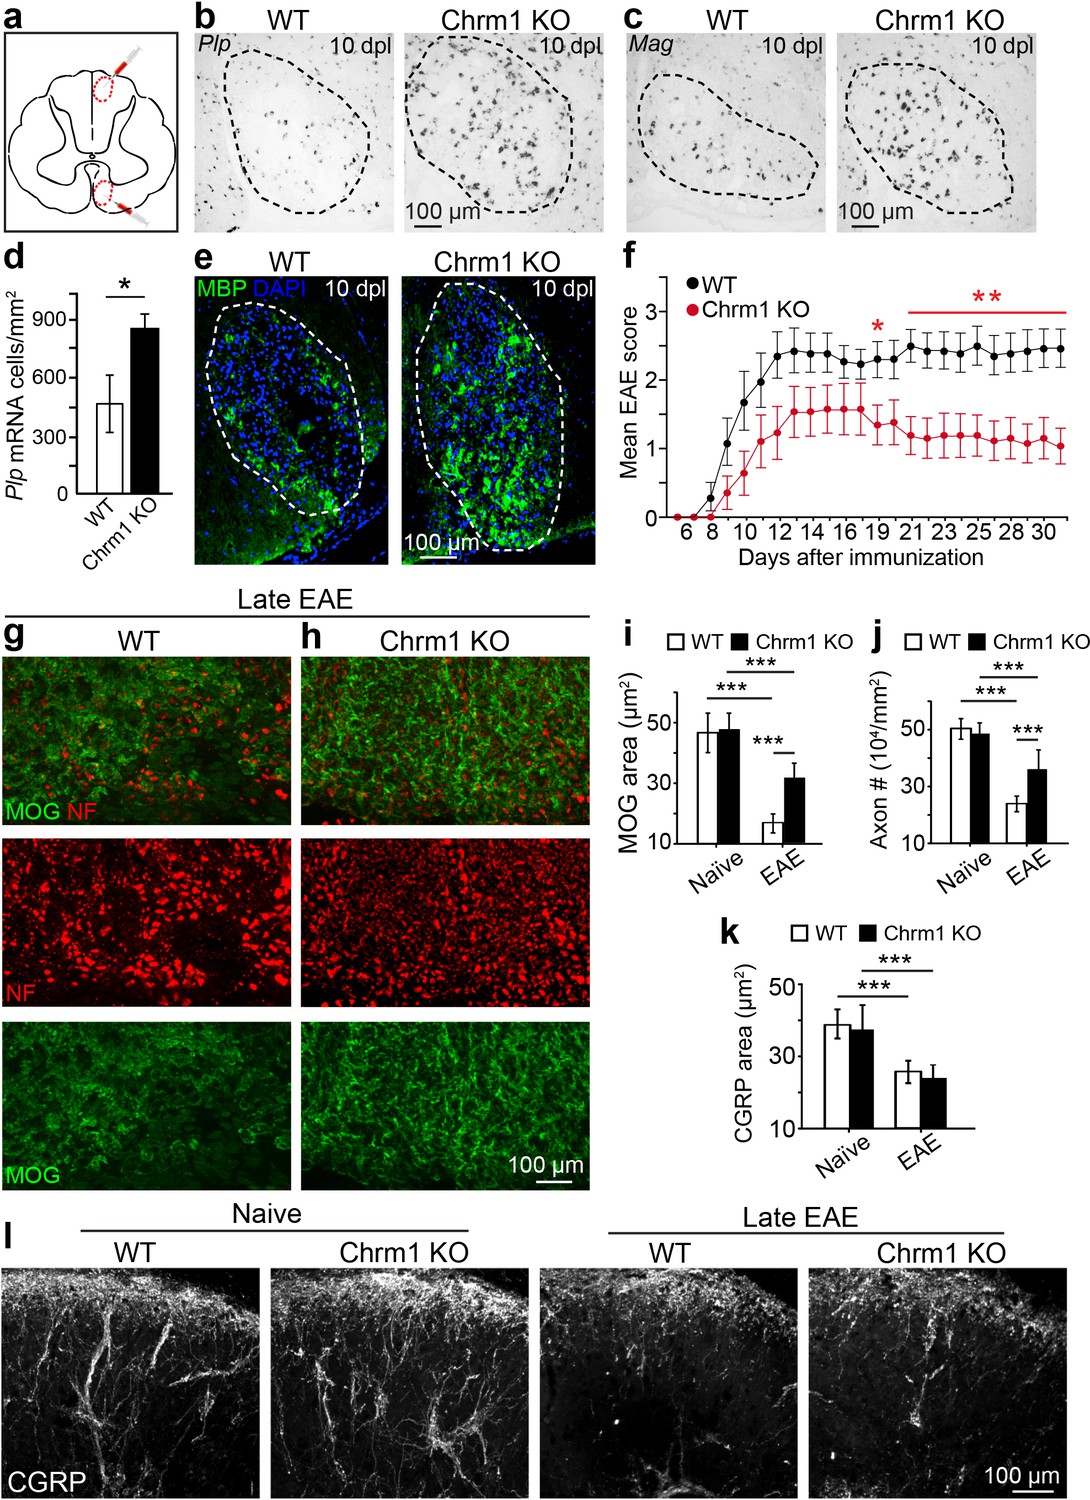
Chrm1 deletion accelerates remyelination and attenuates EAE clinical scores.
(a) Schematic diagram displays the focal demyelinated lesions in the dorsal funiculus and ventrolateral white matter of mouse spinal cord. (b–e) Mice were analyzed by in situ hybridization of Plp (b) or Mag (c) and by MBP staining (e) at 10 days post lesion (dpl). (d) Quantification of Plp in situ hybridization displays a two-fold increase in Plp positive OLs. Error bars represent mean ± s.d. (4 animals in each group), and all experiments were performed in quadruplicate. (f) The clinical severity in MOG35-55 induced EAE was reduced in Chrm1 null mice (n = 14) as compared to sex matched wildtype (n = 15) littermates. Cumulative data shown represent mean ± s.e.m. from two independent experiments. Significance based on Mann-Whitney test for individual days, *p<0.05 or **p<0.01. (g, h) Spinal cord sections immunostained for MOG (green) and NF (red) showing myelin and axonal staining in wildtype and Chrm1 null mice. (i, j) Quantification of MOG+ areas (i) and NF+ axons (j) from Chrm1 knockout and wildtype mice with or without EAE induction. (k) Quantification of CGRP+ areas in the dorsal spinal cord from Chrm1 knockout and wildtype mice. (l) Staining and quantification of CGRP+ fibers in Chrm1 knockout and wildtype mice before and after EAE. Error bars (k) represent mean ± s.e.m. (from 3 representative animals in each group) and all experiments were performed in triplicate. *p<0.05; ***p<0.001, significance based on Student’s t-test with the respective controls.
Figure 6
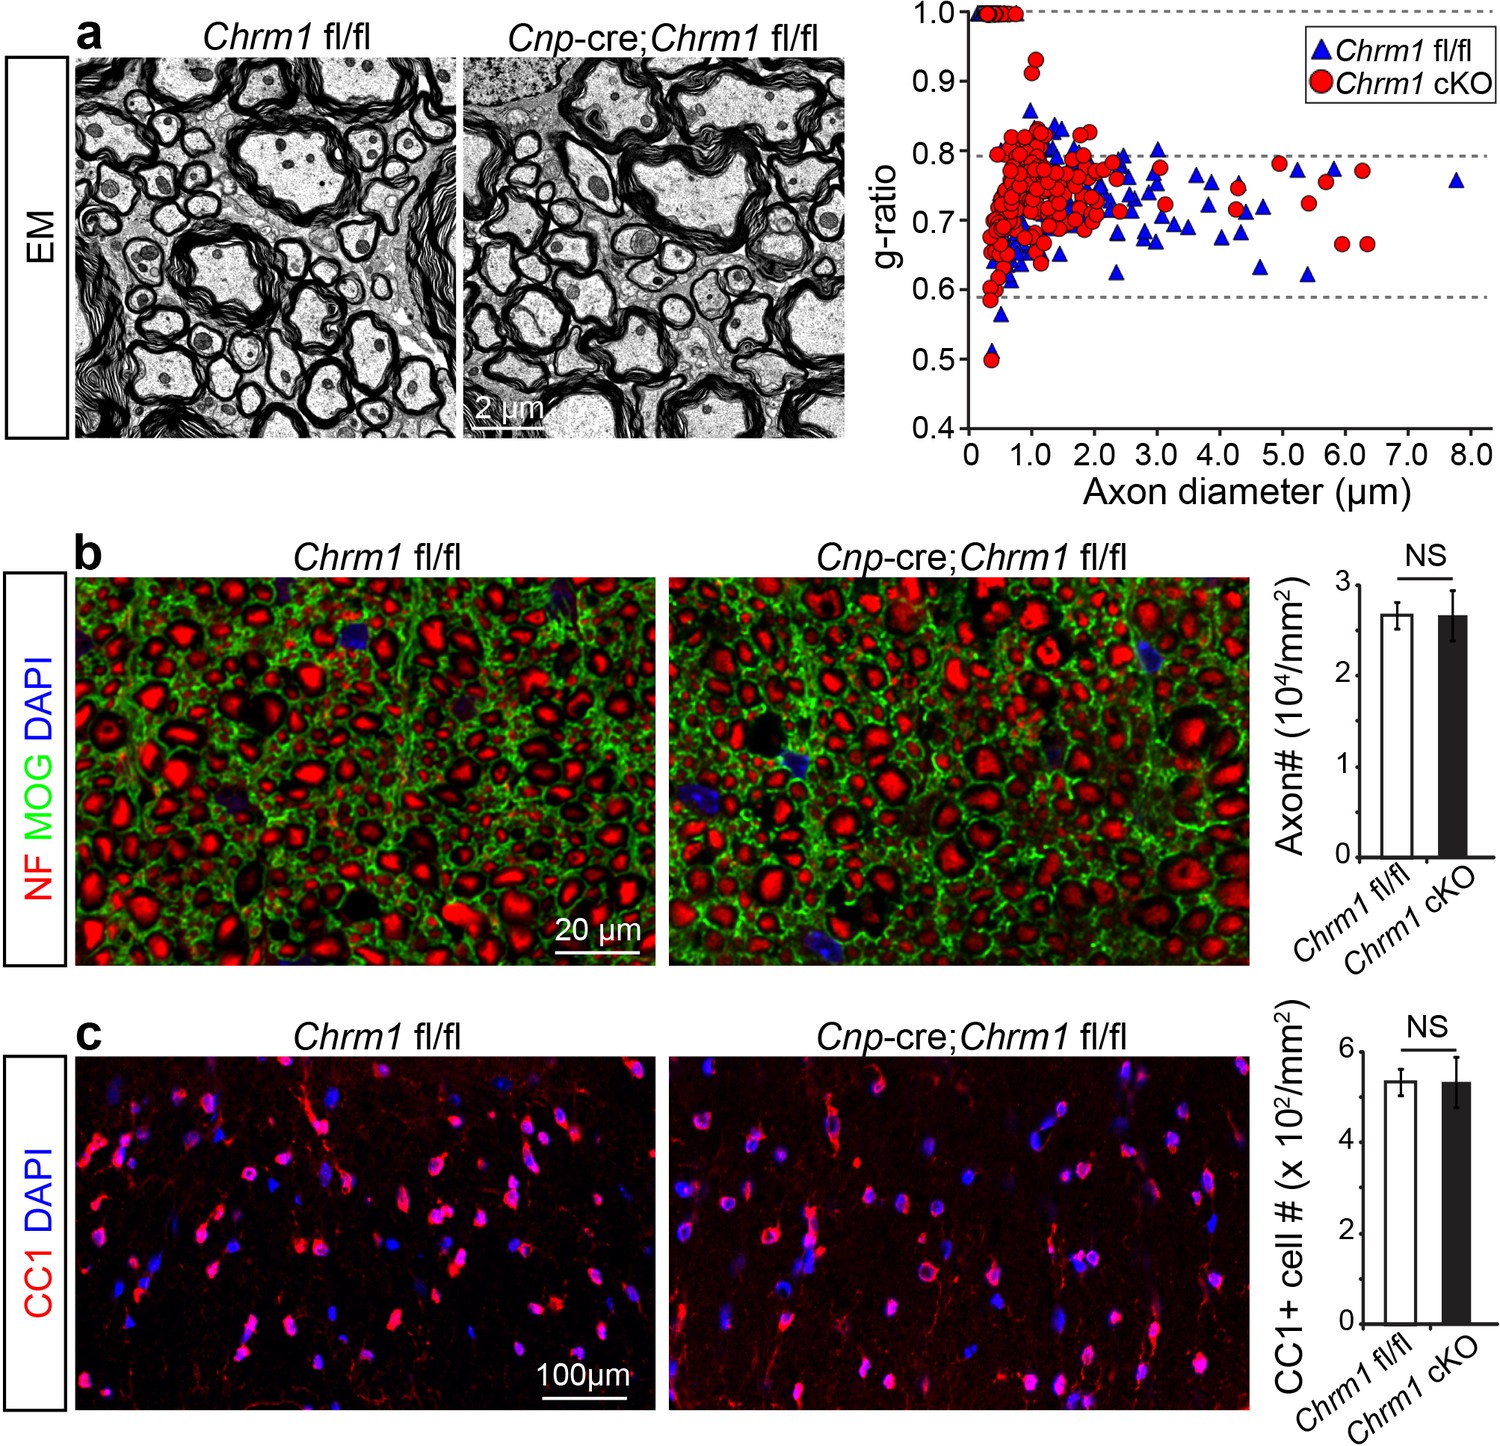
Myelin ultrastructure in Chrm1 cKO spinal cords is normal in adult mice.
(a) Representative electron microscopic images of spinal cord white matter tracts from control (Chrm1 fl/fl) and Chrm1 cKO mice at 8 weeks of age. The scatterplot displays g-ratios of individual axons as a function of axonal diameter. All g-ratios were analyzed from transmission electron microscopic images. (b) Analysis of MOG and NF immunostaining of the spinal cord white matter tracts from control and Chrm1 cKO mice. Myelinated axons in the spinal cord white matter tracts were quantified. (c) Immunostaining for CC1 displays mature oligodendrocytes in the spinal cord white matter tracts of control and Chrm1 cKO mice. Quantification of CC1 positive cell numbers in the spinal cord white matter tracts. Error bars represent mean ± s.e.m. (3 representative mice from each group), and all experiments were performed in triplicate. Significance based on Student’s t-test with the respective controls.
Figure 7 with 1 supplement
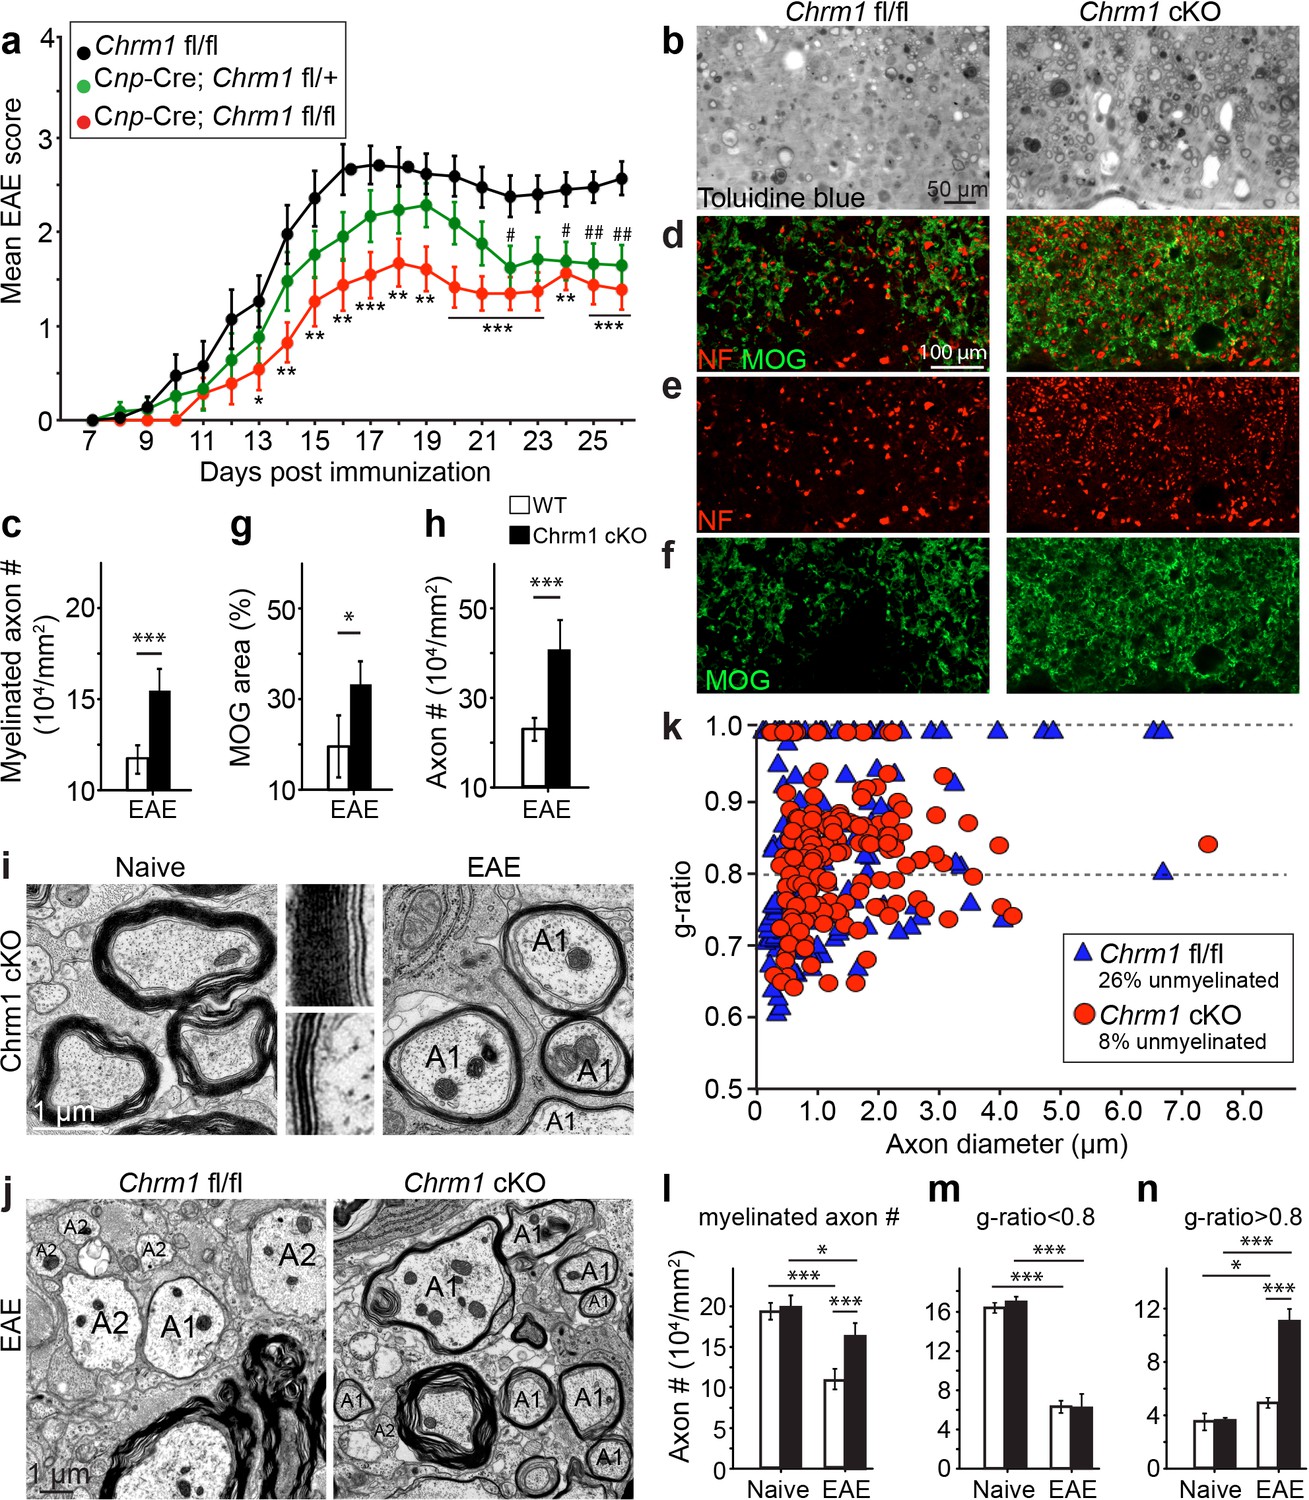
Accelerated remyelination prevents axonal loss and restores neuronal function in EAE.
(a) The clinical severity in MOG35-55 induced EAE was reduced in the Chrm1 conditional knockout mice (Cnp-cre; Chrm1 fl/fl, n = 27) and Chrm1 conditional knockout heterozygotes (Cnp-cre; Chrm1 fl/+, n = 24) as compared to control (Chrm1 fl/fl, n = 23) littermates. Cumulative data shown represent mean ± s.e.m. from four independent experiments. Significance based on the Mann-Whitney test for individual days, *p or # < 0.05, **p or ## < 0.01 or ***p< 0.001. (b) Spinal cord semi-thin sections stained with toluidine blue from Chrm1 cKO and control EAE mice. (d–f) Spinal cord cross sections stained with MOG (green) and NF (red) showing myelin and axonal density in Chrm1 cKO and control EAE mice (d–f). (c, g, h) Quantification of myelinated axons (c), MOG+ density (g) and NF+ axon numbers (h) from the Chrm1 cKO and control EAE mice. (i) Representative electron microscopic image of pre-existing myelinated axons and remyelinated axons (A1) in the spinal cord white matter tracts of Chrm1 cKO naïve and EAE mice respectively. (j) Remyelinated (A1) and demyelinated (A2) axons in the EAE Chrm1 cKO and control mice. (k) Quantification of myelin sheath thickness and the proportion of myelinated and unmyelinated axons in Chrm1 cKO (red) and control (blue) EAE mice. The scatterplot displays g-ratios of individual axons as a function of axonal diameter. Quantification of myelinated axons (i), and axons with g-ratio < 0.8 (m) or > 0.8 (n) in the EAE and naïve spinal cord of Chrm1 cKO and control mice. Error bars represent mean ± s.e.m. (3 representative animals in each group), and all experiments were performed in triplicate. Significance based on Student’s t-test with the respective controls.
Figure 7—figure supplement 1
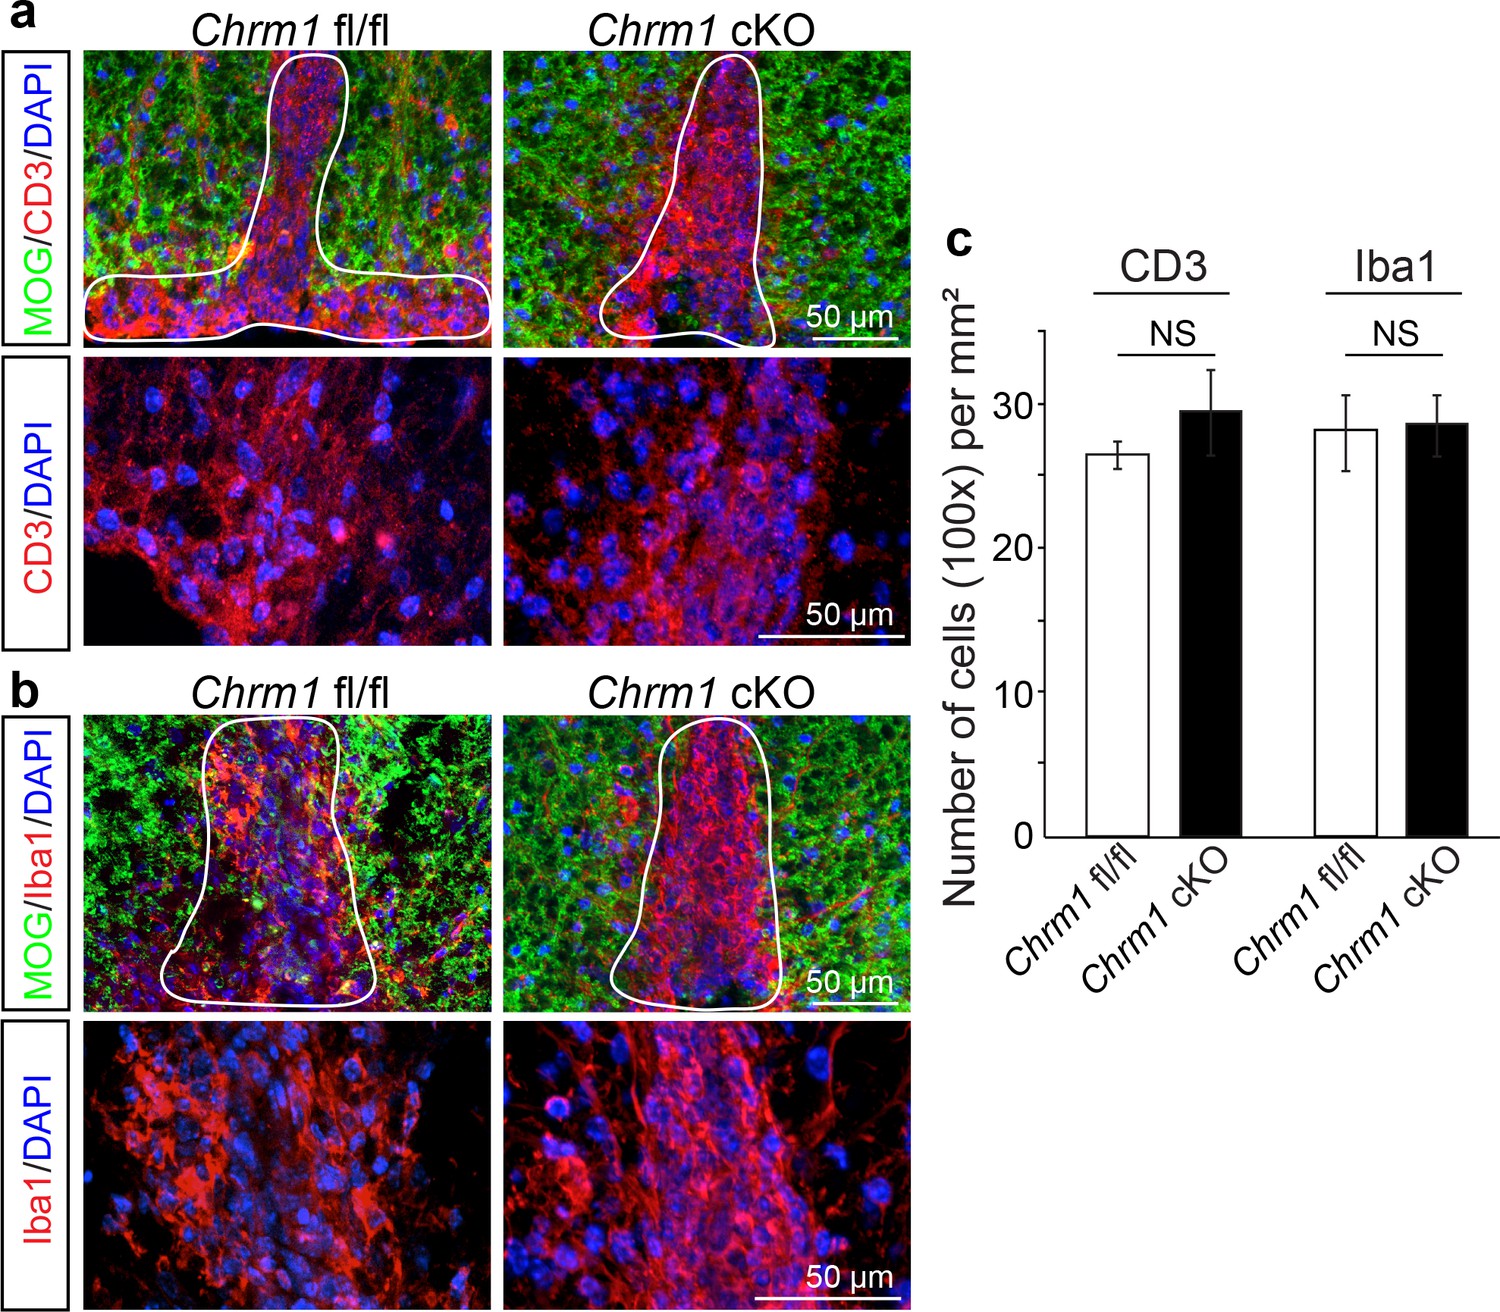
Chrm1 deletion from oligodendroglia does not influence T-cell/macrophage infiltration or microglial activation.
(a) Demyelinated lesions from spinal cord sections from Chrm1 cKOs and control littermates (Chrm1 fl/fl) at the late stage of EAE were analyzed for T-cells and macrophages/microglia. Sections were immunostained for MOG (green), CD3 (T-cells; red), and Iba1 (macrophages and microglia; red). (b) Density of CD3 and Iba1 positive cells were quantified in demyelinated lesions from control and Chrm1 cKO littermate mice at the late stage of EAE. Error bars represent mean ± s.e.m. (experiments were performed in triplicate).
Download links
A two-part list of links to download the article, or parts of the article, in various formats.
Downloads (link to download the article as PDF)
Open citations (links to open the citations from this article in various online reference manager services)
Cite this article (links to download the citations from this article in formats compatible with various reference manager tools)
Accelerated remyelination during inflammatory demyelination prevents axonal loss and improves functional recovery
eLife 5:e18246.
https://doi.org/10.7554/eLife.18246


