Distinct neural mechanisms underlie the success, precision, and vividness of episodic memory
- University of Cambridge, United Kingdom
Figures
Figure 1
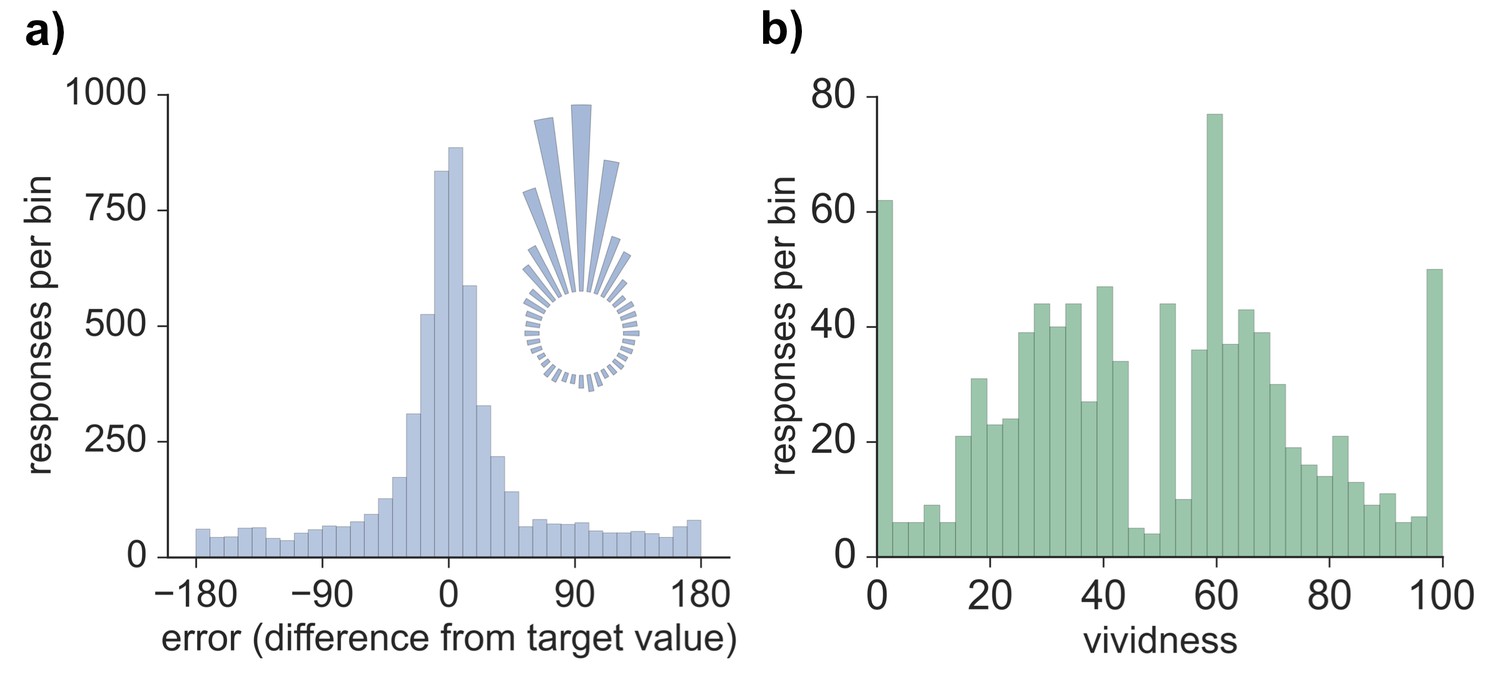
Behavioral responses for all retrieval trials.
(a) Distribution of errors (difference between reported feature value and target feature value), across all 5724 trials across all participants, also visualized in circular space by wrapping the distribution around a circle. (b) Distribution of vividness responses across all 954 vividness ratings for all participants.
-
Figure 1—source data 1
Data associated with the error distribution and vividness rating analyses.
- https://doi.org/10.7554/eLife.18260.004
Figure 2
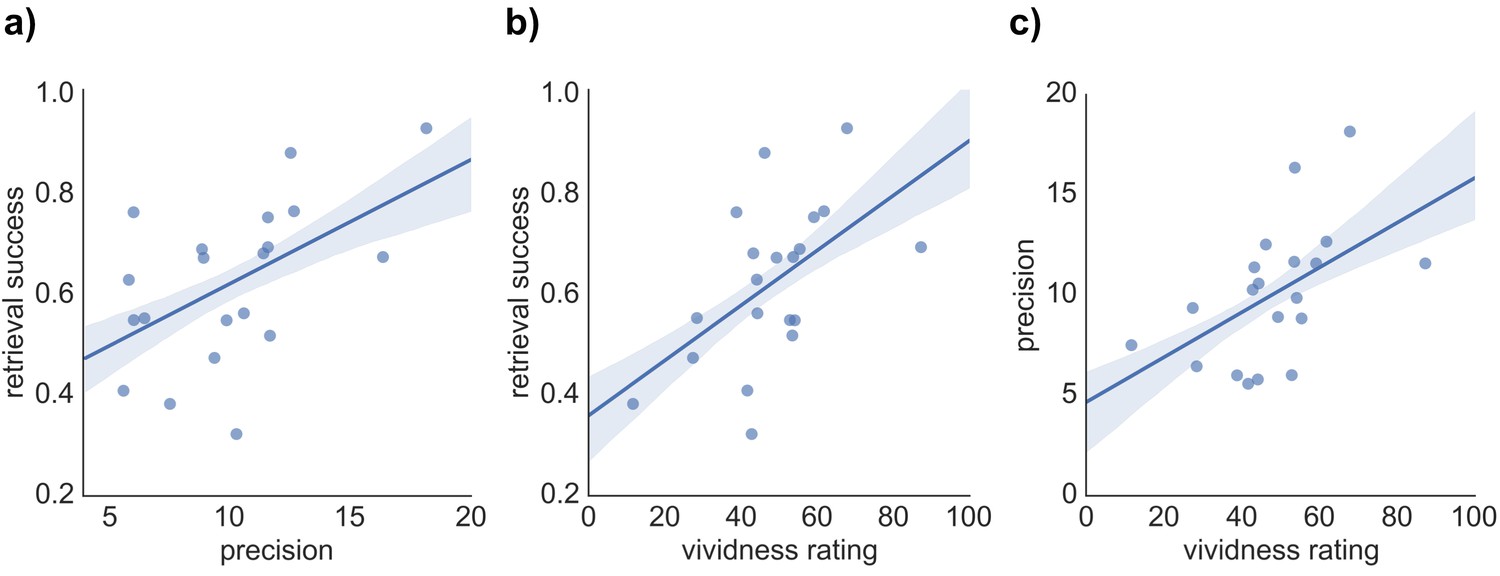
Relationship between the three measures of retrieval performance.
Correlation between (a) retrieval success and precision, (b) retrieval success and vividness ratings, and (c) precision and vividness ratings. Shaded areas indicate the standard error of the correlation.
-
Figure 2—source data 1
Data associated with the pairwise correlation analyses.
- https://doi.org/10.7554/eLife.18260.006
Figure 3
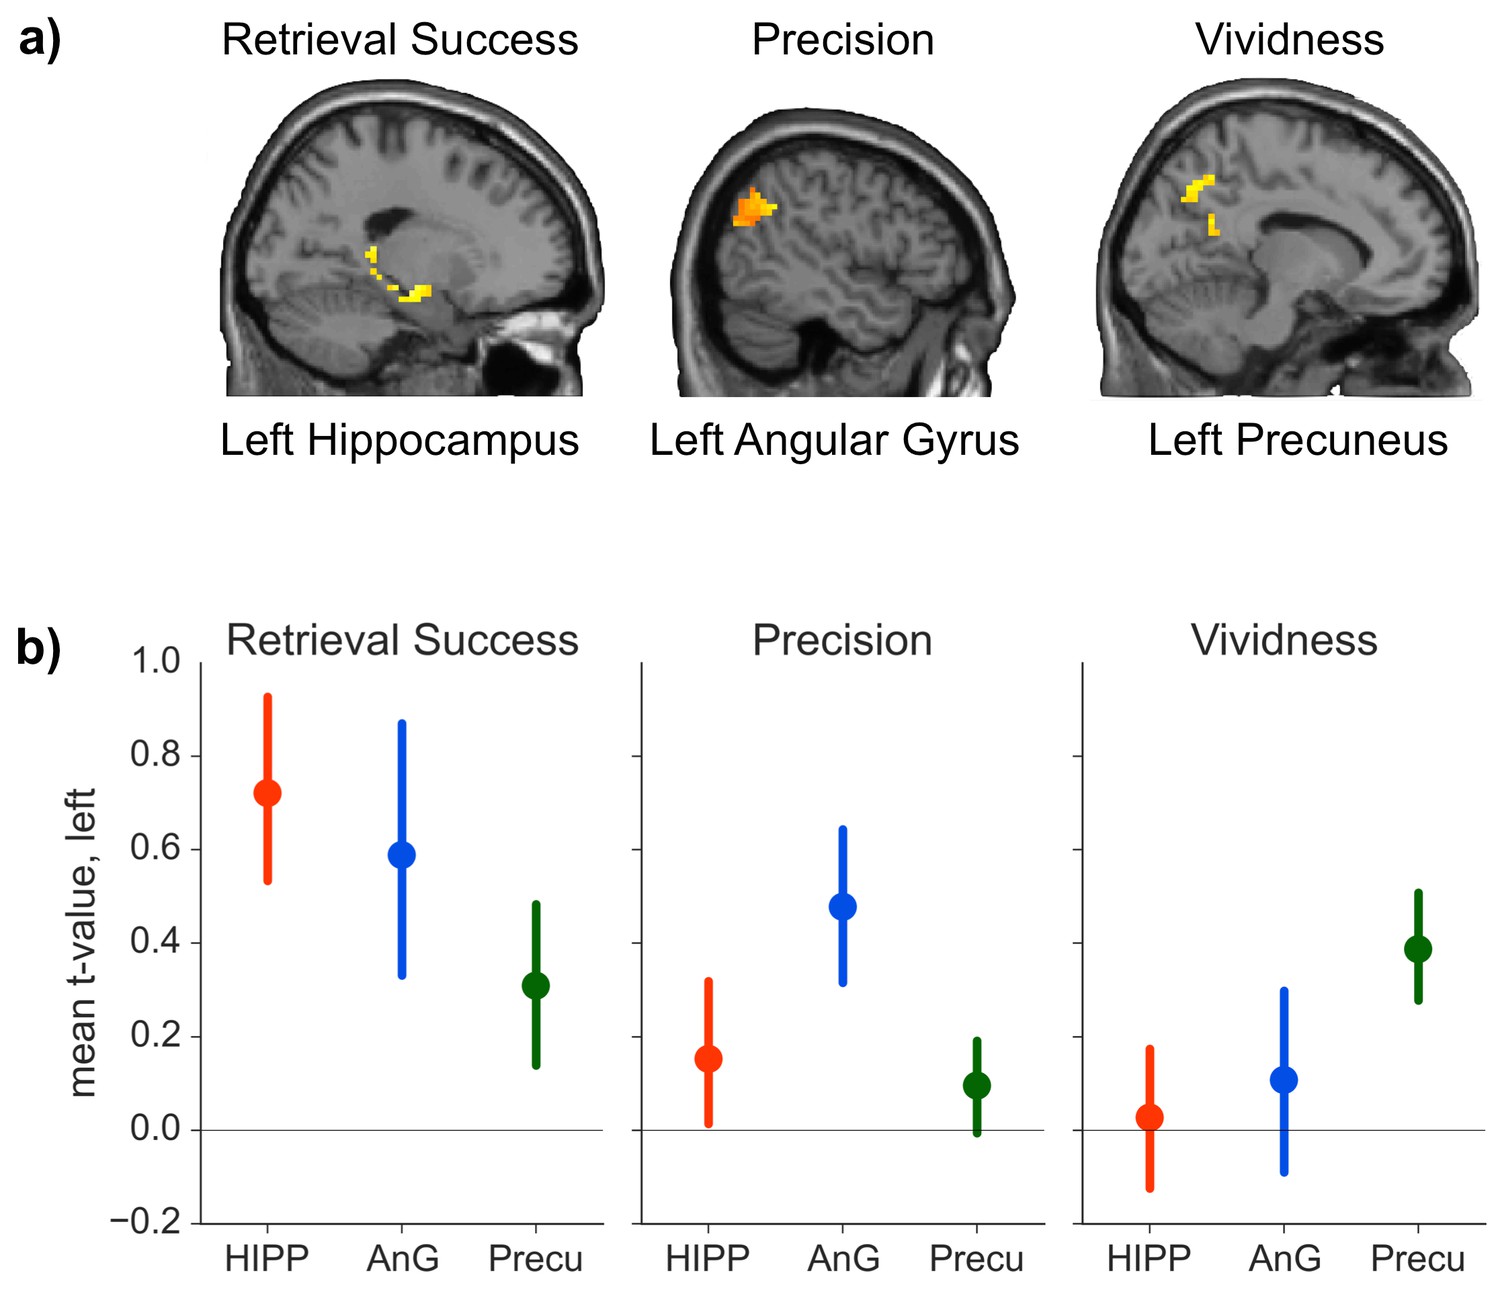
ROI analyses.
(a) Significant effects of the general linear model (GLM) as revealed by the ROI analyses. Each contrast was assessed in each of the a priori defined ROIs by determining the significance of peak ROI activity using small-volume correction at p < 0.05. Significant effects of retrieval success were found in the hippocampal ROI, of precision in the AnG ROI, and of vividness in the precuneus ROI. (Contrasts displayed at p < 0.01, uncorrected, for visualization.) (b) Mean first level t-values observed across voxels in each anatomical ROI for the three measures of retrieval performance. Error bars show standard error of the mean.
-
Figure 3— source data 1
Data associated with the ROI analyses.
- https://doi.org/10.7554/eLife.18260.008
Figure 4

Activity for each contrast of interest.
Activity was assessed throughout the brain to reveal any areas of overlap (at a liberal statistical threshold of p < 0.001, uncorrected). Activations are displayed on the cortical surface using Pysurfer software (https://pysurfer.github.io), visualized at an even more liberal threshold of p < 0.01 (uncorrected). Red = Retrieval Success; Blue = Precision; Green = Vividness. Greater activity is indicated by increasing brightness of the color. Purple = overlap between Retrieval Success and Precision; Cyan = overlap between Precision and Vividness; Yellow = Overlap between Retrieval Success and Vividness.
Figure 5

Task design.
(a) Examples of displays learnt during encoding and (b) part of the sequence of retrieval questions for a single display illustrating the manipulation of the objects with the continuous dial. During retrieval, the order in which features (color/orientation/location) were tested was counterbalanced. Two out of the three objects associated with an encoded display were tested during retrieval. A video of an example retrieval trial can be accessed online (Video 1).
Figure 6
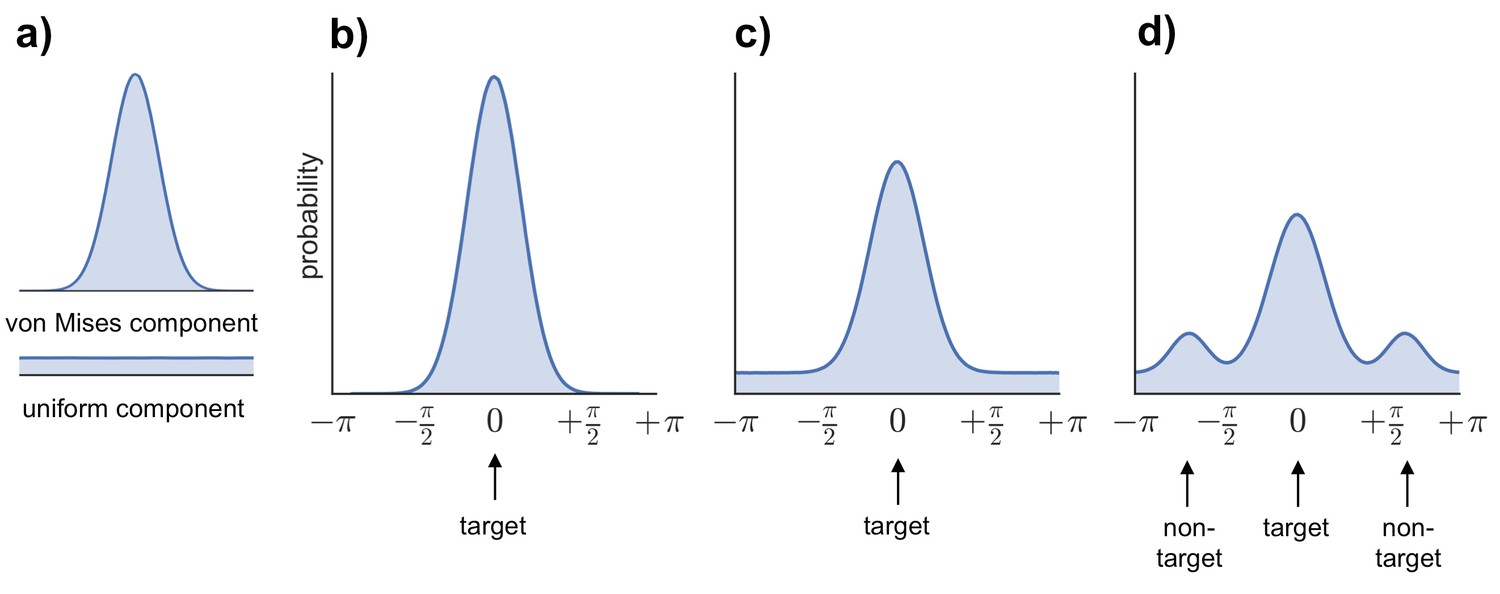
Models fitted to the error distribution.
(a) Components used to model the error data. (b–d) Illustrations of the three models compared to analyze participants’ error distributions, including von Mises alone (b), von Mises + uniform (c), and von Mises + uniform + additional von Mises distributions modeling non-target errors (d).
Figure 7
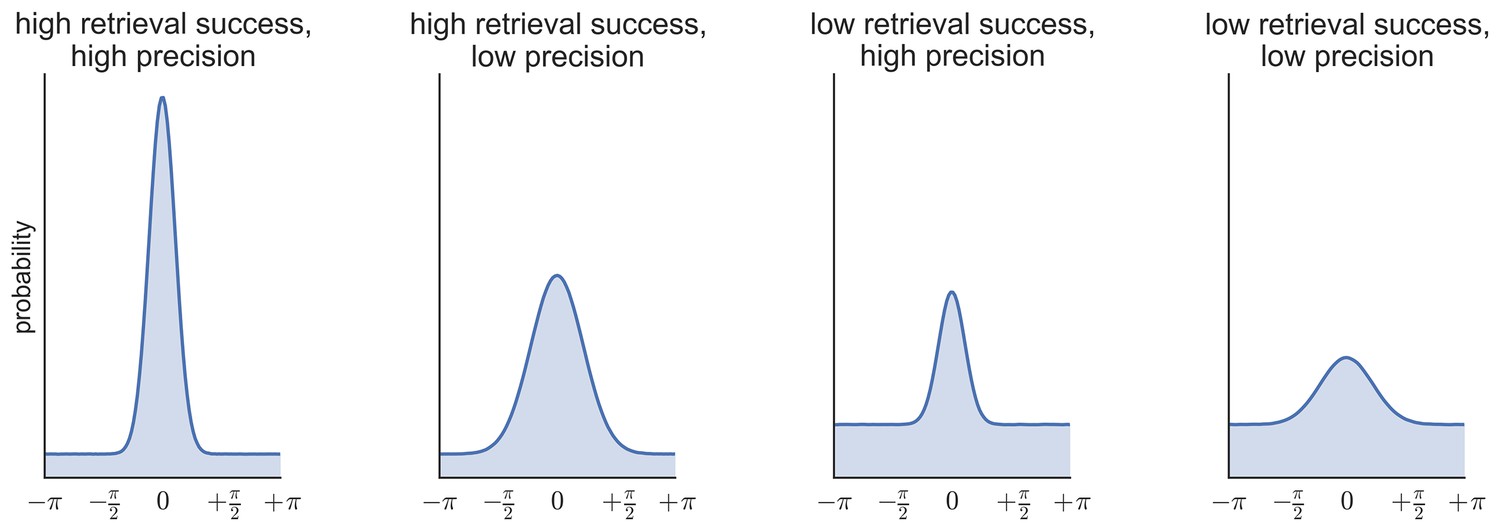
Simulated data illustrating the possibility of statistical independence of retrieval success (proportion of responses in the von Mises distribution vs. the uniform distribution) and retrieval precision (the concentration of the von Mises distribution).
https://doi.org/10.7554/eLife.18260.012Videos
Video 1
Example of a retrieval trial.
The video demonstrates the use of the continuous response options for the vividness question (00:01–00:09), and the three feature questions for the first (00:09–00:29), as well as the second object (00:30–00:51). Participants were able to adjust their responses continuously by moving around the slider (vividness question) or the circular dial (feature questions). Once they were happy with their response, they locked their response with a button press. For the first five feature questions in the example the participant entered their response within the first 4 s of the question, and therefore the font color of the cue word ('Orientation'/'Colour'/'Location') remains white. For the last feature question, the color of the cue changes to red as no response was given within the first 4 s of the question interval, indicating to the participant that 2 s remain to respond.
Download links
A two-part list of links to download the article, or parts of the article, in various formats.
Downloads (link to download the article as PDF)
Open citations (links to open the citations from this article in various online reference manager services)
Cite this article (links to download the citations from this article in formats compatible with various reference manager tools)
Distinct neural mechanisms underlie the success, precision, and vividness of episodic memory
eLife 5:e18260.
https://doi.org/10.7554/eLife.18260


