Folded gastrulation and T48 drive the evolution of coordinated mesoderm internalization in flies
- Heidelberg University, Germany
Figures
Figure 1

To assess gastrulation differences between C.riparius and D.melanogaster, nuclear position and embryonic axis elongation provide faithful proxies for cell position and stage of mesoderm internalization.
(A,B) Mesoderm internalization shown for C.riparius (A) and D.melanogaster (B) in transversal embryonic sections stained for DNA (DAPI) and F-actin (phalloidin). (C) Cell positions as a readout of cell behavior were determined in transversal sections and whole embryos based on staining of DNA (cell nucleus) and F-actin (cell outline), cell length was measured along the yellow bar. (D) The centre of masses determined in embryo sections is indicated as circles overlaid on an F-actin stained micrograph (colors indicate identical cells). (E,E’) Differences in the approximation of the cell position by cell nucleus and outline were assessed as a deviation along cell height, width, and breadth for sections (E) and whole embryos (E’). The percentage of cells for which the two methods deviated by more than 10% cell length are indicated (blue dashed area). (F) Progression of germband extension (GBE) in C.riparius and D.melanogaster served as measure to stage mesoderm internalization. The extension was measured as displacement of the invaginating posterior midgut from the posterior pole in percent egg length (0% corresponds to the non-extended germband). Gastrulating embryos of C.riparius and D.melanogaster were classified according to the degree of GBE. To enable automated image segmentation routines to extract the ventral embryo surface, embryos in which the ventral opening was equal or smaller than one nucleus size (red asterisk) were considered as closed along the ventral midline. In C.riparius, embryos with less than 10% GBE showed no internalization, mesoderm internalization was observed in embryos showing 13 to 25% GBE, and embryos with more than 25% GBE were closed along the ventral midline. In these embryos, putative mesoderm nuclei were barely detectable (arrow heads), presumably because they were few and adhered closely to the ectoderm. In D.melanogaster, mesoderm internalization was observed in embryos before and after the onset of GBE, and embryos with more than 15% GBE were closed along the ventral midline (classes and number of embryos within class indicated as grey bars). For subsequent quantification of mesoderm internalization, C.riparius embryos were staged between 13–22% GBE, and D.melanogaster embryos between onset and 10% GBE. Mitosis in C.riparius was observed in spatially distinct and temporally successive domains similar as in D.melanogaster (Foe, 1989). Scale bars, 50 µm.
Figure 2 with 1 supplement
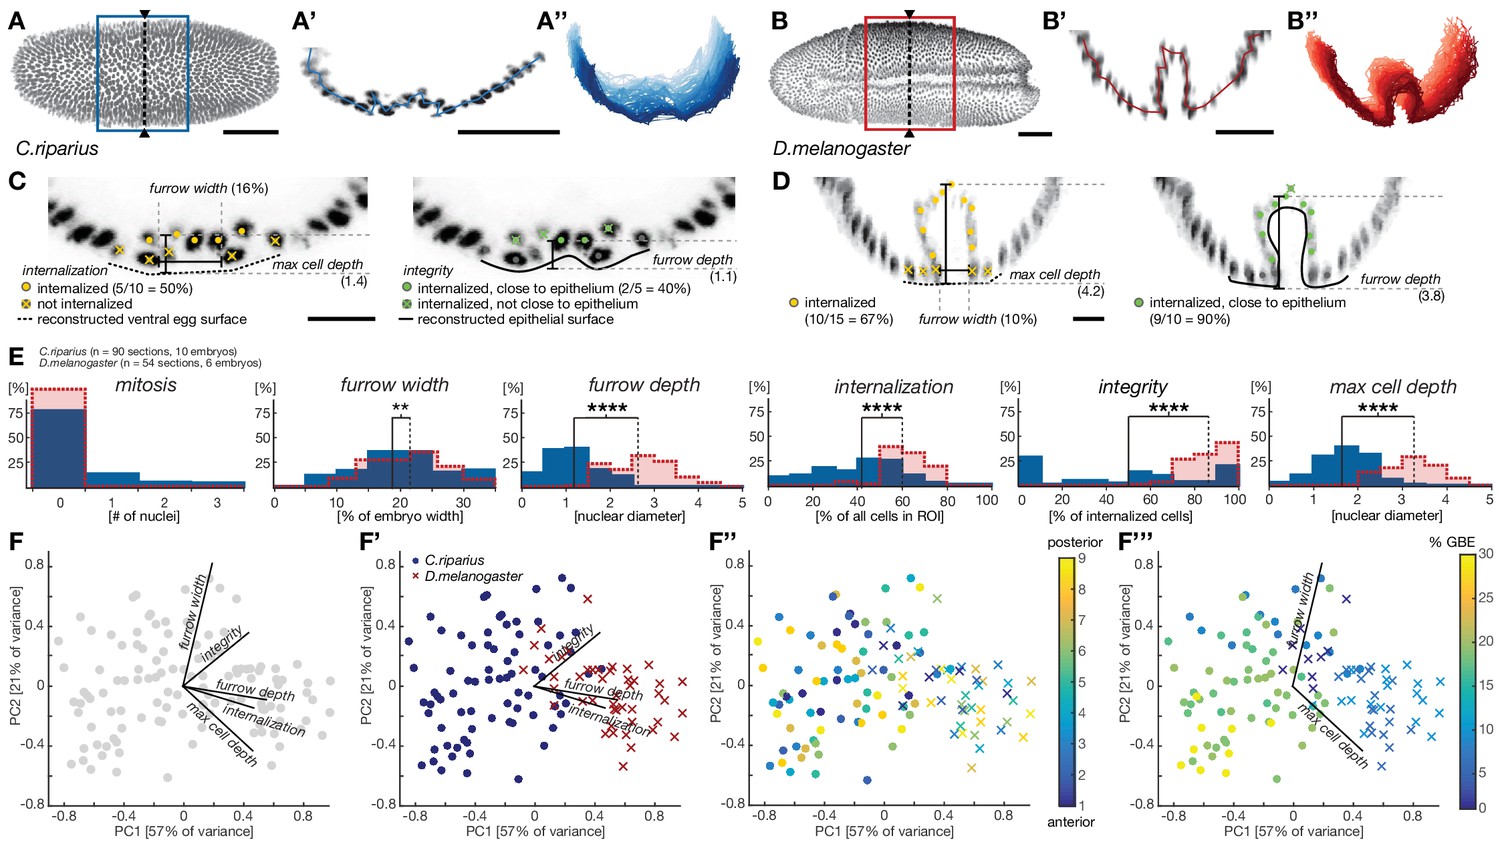
Quantitative analysis of mesoderm internalization in C.riparius and D.melanogaster characterizes differences between mesoderm ingression and invagination.
(A–B’’) Ventral view (A,B) transversal sections (A’,B’) and stacks of transverse centerlines (A’’,B’’) at comparable positions and corresponding stages of mesoderm internalization in C.riparius (A–A’’, blue; 17% GBE) and D.melanogaster (B–B’’, red; 17% GBE). (A,B) Boxes indicate the region for which stack centerlines were calculated, arrowheads and dashed lines indicate the position of selected transversal section (A’,B’). The stacks of transverse centerlines provide a visual measure for variation of cell behavior along the anterior-to-posterior axis of the embryo. (C,D) Exemplary quantitative analysis of cell behavior based on nuclear position as outlined in Figure 2—figure supplement 1 on transversal sections of C.riparius (C) and D.melanogaster (D). Cell position based on segmented nuclei within a defined region of interest (ROI, see Materials and methods) are indicated as circles, lines are used to indicate the computationally reconstructed ventral egg surface and the outline of ventral epithelium. Automated classification of cells is indicated as color code (legend in C). Measures of furrow depth, and max cell depth were based on cell position and measured in nuclear diameter, furrow width was measured as a proportion of total embryo width (see Materials and methods). (E) Collective quantitative analysis of cell behavior for mesoderm internalization in transversal sections of C.riparius (blue) and D.melanogaster (red) embryos that separate mesoderm ingression from invagination. Medians of the distributions are indicated (solid line, C.riparius; dashed line, D.melanogaster). The significance of differences in the median was assessed by a Wilcoxon rank sum test. (F–F’’’) Biplots of a principal component analysis for all transversal sections of all analyzed C.riparius and D.melanogaster embryos. Shown is the contribution for each feature to the two first principal components (F), the separation of the two species and how they are most sensitively separated along integrity, furrow depth, and internalization (F’), the position of individual transversal sections along the anterior-posterior axis of the embryo (F’’), and progression of gastrulation measured by % GBE (F’’’, Figure 1F). Furrow width and maximal cell depth align with the progression of gastrulation and were thus not considered as time-independent parameters of mesoderm internalization in C.riparius and D.melanogaster, respectively. Scale bars, 50 µm (A,A’,B,B’) and 20 µm (C,D). **p≤0.01; ****p≤0.0001.
Figure 2—figure supplement 1
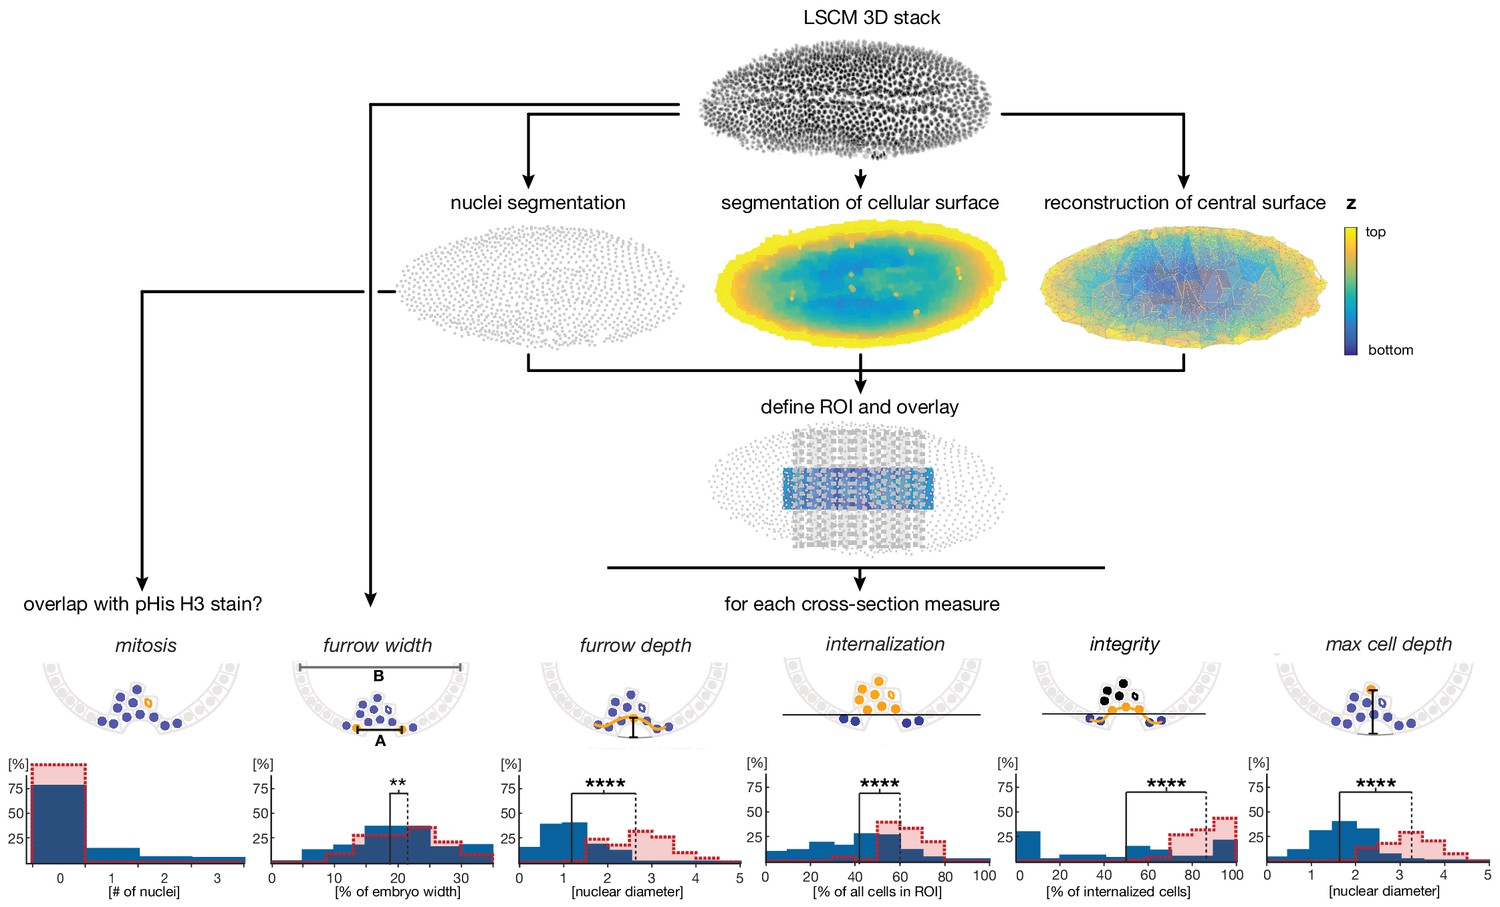
Cartoon summarizing image processing and analysis pipeline for the quantification of ventral cell behavior.
High resolution laser scanned confocal microscope (LSCM) image stacks were acquired from embryos stained for DNA and phosphorylated Histone H3 (pHis H3). Nuclei, cell surface and the ventral egg surface (corresponding to the vitelline membrane) were segmented using iLastik (Sommer et al., 2011) and Matlab routines (see Materials and methods). Parameters for cell internalization were analyzed in the region of interest (ROI), defined by the central 50% of the embryo length and 30% of the embryo width. Internalization, maximal depth, epithelial integrity, and furrow depth were quantified using Matlab scripts based on segmented image data for nine transversal sections; the furrow width was measured manually on raw images (see Materials and methods). Critical features for the quantitative analysis are indicated in yellow: 'mitosis' was measured by overlap of nuclear position with a positive pHis H3 staining, 'furrow width' was measured as distance between edges of furrow abutting nuclei (furrow width, 'A') relative to embryo width (embryo width, 'B'), 'furrow depth' was measured as maximal distance between reconstructed egg surface and nuclei within ventral epithelium, 'internalization' was measured as number of nuclei inside the embryo with a minimal distance of one nuclear diameter to the reconstructed egg surface (threshold indicated by the black line), 'integrity' was measured by the number of nuclei within the ventral epithelium divided by the total number of internalized nuclei, and 'max cell depth' was measured as the maximal distance between the deepest internalized nucleus and the reconstructed egg surface (indicated as grey line beneath furrow). The calculation of integrity was adapted in case of Cri-sna knockdown to account for high tissue integrity without internalization (see Materials and methods).
Figure 3 with 2 supplements
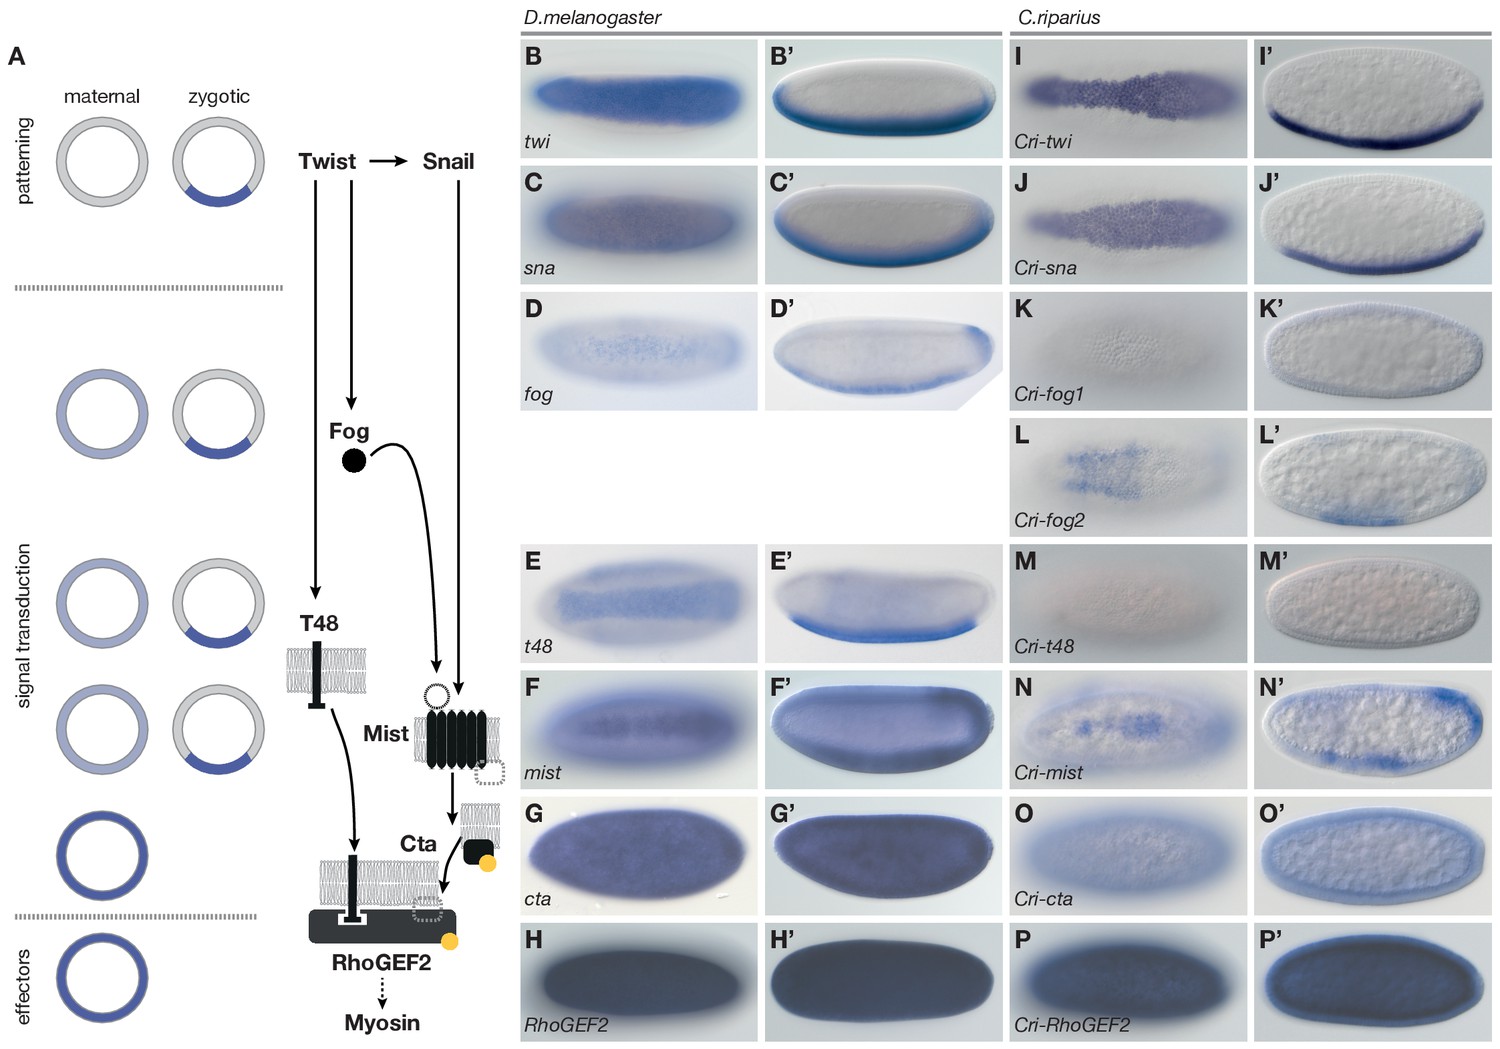
Mesoderm internalization in C.riparius lacks input by fog and t48.
(A) Genetic regulation of mesoderm formation in D.melanogaster relays spatial instructions provided by the transcription factors Twi and Sna to RhoGEF2-dependent activation of non-muscle myosin via a GPCR signaling cascade with the ligand Fog, the G protein coupled receptor Mist, and its associated Gα subunit Cta; T48 functions as an apical anchor of RhoGEF2. The expression domains for each gene are indicated in schematized transversal sections for maternal (left) and zygotic (right) contribution (blue). (B–P’) The comparison of blastoderm expression patterns of twi (B,B’), sna (C,C’), fog (D,D’), t48 (E,E’), mist (F,F’), cta (G,G’), and RhoGEF2 (H,H’) in D.melanogaster with the expression of the C.riparius orthologues Cri-twi (I,I’), Cri-sna (J,J’), Cri-fog1 (K,K’), Cri-fog2 (L,L’), Cri-t48 (M,M’), Cri-mist (N,N’), Cri-cta (O,O’), and Cri-RhoGEF2 (P,P’) indicated potentially crucial differences in the expression of fog and t48 in the future mesoderm.
Figure 3—figure supplement 1

Phylogenetic occurrence of morphogenetic key players of D.melanogaster mesoderm invagination.
Genes were considered as present in the last common ancestor of insects if they were included in the insect (i) as well as the metazoan (m) or arthropod (a) OrthoDB orthology group (Waterhouse et al., 2013): cta, EOG7HF1JF (mai), evolutionary rate 0.81; mist, EOG7J70G6 (mi), evolutionary rate 1.04; RhoGEF2, EOG75J0M5 (mai), evolutionary rate 1.18; twist, EOG7TJ3M9 (mai), evolutionary rate 0.79. Because snail originated from a dipteran-specific gene duplication and belongs to a family of three genes with redundant functionality (snail, escargot, and worniu) (Ashraf et al., 1999), its presence in the last common ancestor of insects was assessed by the snail family representing orthology group (EOG7P2XSG (mai), evolutionary rate 0.71). t48 was restricted to the insect orthology group (EOG7RC98C, evolutionary rate 1.27), and fog to the dipteran orthology group (EOG7HQZRP, evolutionary rate 1.44). OrthoDB attributed higher evolutionary rates to t48 and fog than to the other morphogenetic key players of D.melanogaster gastrulation, suggesting that the identification of additional orthologues within insects was affected fast sequence turnover. To identify additional insect orthologues of t48 and fog despite fast sequence evolution, we followed previously described position weight matrix based blast searches aimed to test for the presence of orthologues in representative insect genomes (Materials and methods) (Klomp et al., 2015). Phylogenetic tree and age estimates of branching as described previously (Misof et al., 2014).
Figure 3—figure supplement 2

Evidence for maternal contribution of selected GPCR signaling components in D.melanogaster.
(A) Summary of modENCODE expression profiles of cta, fog, mist, RhoGEF2, t48, twi, and sna at various stages of development, (Attrill et al., 2016), expression levels shown as RPKM values. (B–E’) Expression of fog at pole bud formation (B,B’), during blastoderm cellularization (C,C’), at the onset of gastrulation (D,D’) and during germband extension (E,E’). Expression of t48 at pole bud formation (F,F’), during blastoderm cellularization (G,G’), at the onset of gastrulation (H,H’) and during germband extension (I,I’). Expression of fog and t48 at pole bud formation was strong, ubiquitous, and not restricted to 'nuclear dots' of possibly early zygotic expression (Pritchard and Schubiger, 1996). (J–K’) Expression of Cri-fog1 (J,J’) and Cri-t48 (K,K’) during germband extension. Expression of fog and t48 during germband extension in the presumptive neuroectoderm is conserved in D.melanogaster (E,E’,I,I’) and C.riparius (J,J’,K,K’).
Figure 4
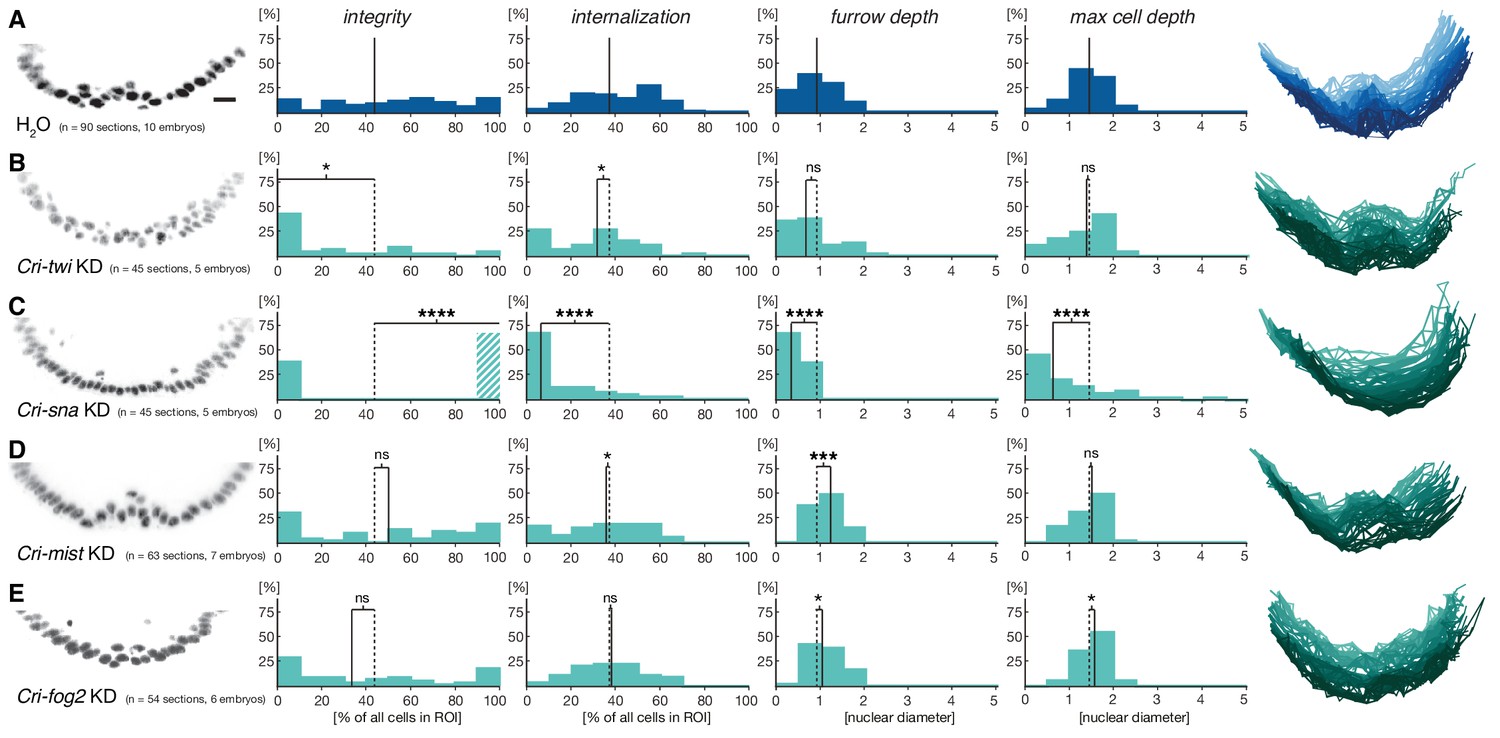
Mesoderm internalization in C.riparius depends on conserved patterning by Cri-twi and Cri-sna.
(A–C) Compared to control injections with water (A), proper mesoderm internalization in C.riparius relied on patterning by Cri-twi and Cri-sna. Knockdown (KD) of Cri-twi showed a slight decrease in cell internalization but was mostly characterized by an absence of the shallow groove and seemingly random ingression throughout the ventral 10% of the embryonic circumference (B). Knockdown of Cri-sna produced embryos that failed to internalize the mesoderm, reflected by a highly significant decrease in furrow depth and max cell depth, as well as a highly significant increase in integrity when using a modified algorithm to account for lack of internalization (indicated as dashed bar, see Materials and methods) (C). (D–E) Knockdown of Cri-mist (knockdown efficiency 90%) appeared very similar to control injection, with a slight decrease in overall internalization and a small but significant increase in furrow depth (D); knockdown of Cri-fog2 (knockdown efficiency 60%) was similar to control injections with a small but significant increase in furrow depth and maximal cell depth (E). Representative transversal sections, quantification of parameters, statistical analyses, and nuclear centerlines as in Figure 2. Scale bar, 20 µm. ns, p>0.05; *p≤0.05; **p≤0.01; ***p≤0.001; ****p≤0.0001.
Figure 5 with 1 supplement
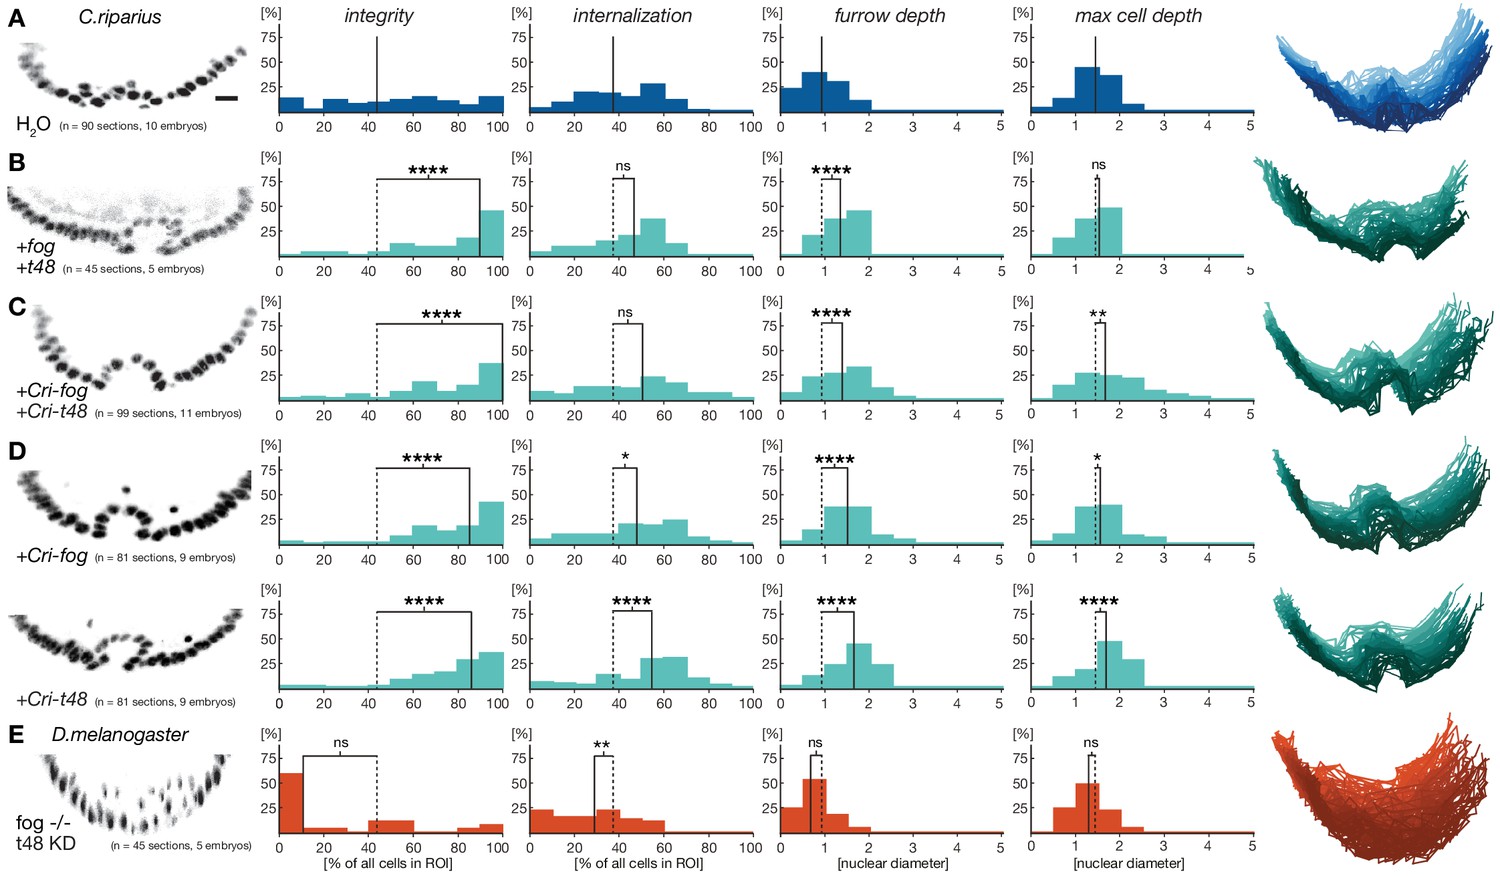
Ubiquitous expression of fog and t48 promotes Drosophila-like mesoderm internalization in C.riparius embryos.
(A) Mesoderm internalzation was characterized by a shallow furrow and little overall epithelial integrity in individual transversal section in control injected embryos (raw data as in Figure 4A). (B–D) Ubiquitous expression of fog and t48 (B), Cri-fog and Cri-t48 (C), or either gene alone (D) increased epithelial integrity. (E) In D.melanogaster embryos, knockdown of t48 activity in embryos without ventral fog expression led to loss of epithelial integrity and tissue coherence comparable to C.riparius wildtype. Representative transversal sections, quantification of parameters, statistical analyses, and nuclear centerlines as in Figure 2. Scale bar, 20 µm. ns, p>0.05; *p≤0.05; **p≤0.01; ***p≤0.001; ****p≤0.0001.
Figure 5—figure supplement 1

Comparison of individual embryos after either Cri-fog or Cri-t48 injection suggests differences in the within-embryo variation of epithelial integrity.
(A,B) Distribution of epithelial integrity in transversal sections following Cri-fog injections (A, n=9) and Cri-t48 injections (B, n=9). Pink dot: mean; pink line: standard deviation. (C) Distribution of standard deviations with mean indicated by dotted line.
Figure 6
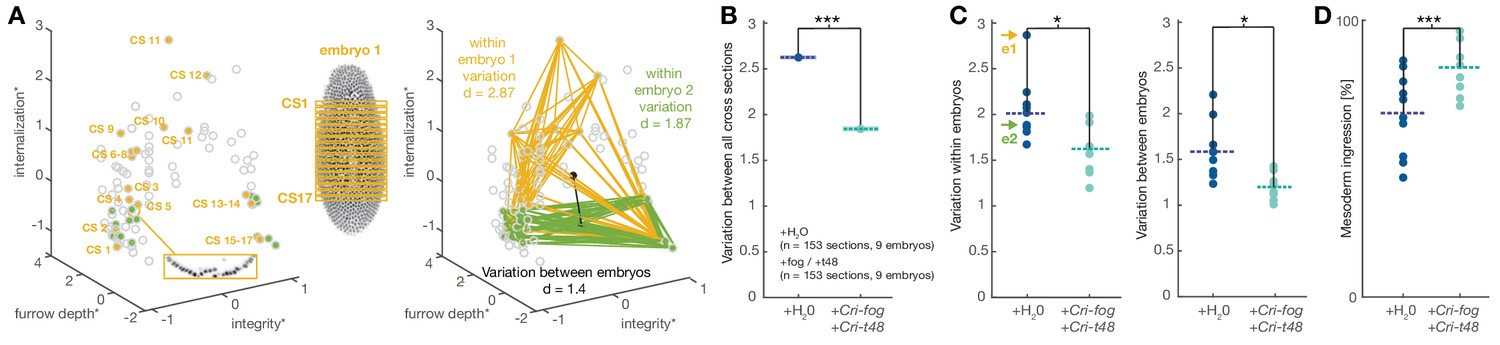
Experimentally induced invagination increases developmental robustness and efficiency of mesoderm internalization in C.riparius.
Variation in gastrulation was assessed for each embryo by sampling the complete ventral ROI in seventeen transversal sections along the anterior-posterior axis. Each section was characterized by the time-independent parameters internalization, furrow depth, maximal cell depth, and integrity and takes one point in that 4D space. The similarity of cell behavior in different sections was calculated as the Euclidean distance between points. (A) Example of variation for two embryos in a reduced 3D data space (internalization, furrow depth, integrity; asterisk indicates normalization of parameter values by z-score normalization): each embryo was characterized by 17 cross sections (yellow and green points in 3D space), the Euclidean distance provided a measure for variation within the two embryos. Variation between embryos (black line) was computed as the Euclidean distance between the embryo centroids (black dots: calculated as the mean value for all sections in an embryo). (B) Variation across all transversal sections was significantly decreased after ectopic expression of Cri-fog and Cri-t48. (C) Both variations within individual embryos (values for embryos shown in A are indicated by arrows) as well as variation between embryos was decreased. (D) Ectopic expression of Cri-fog and Cri-t48 increased the efficiency of mesoderm internalization and was measured as the percentage of internalized cells in the ROI at a comparable stage of GBE.
Figure 7
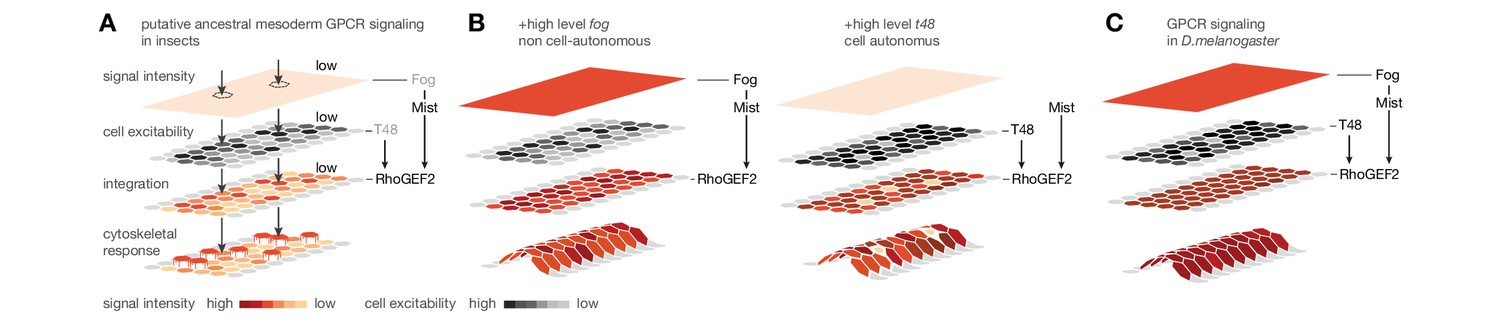
Evolutionary scenario for cell-biological changes underlying the origin of coordinated mesoderm invagination in D.melanogaster.
(A) Cartoon model of putative ancestral mesoderm GPCR signaling based on findings in C.riparius. According to the model, ancestral mesoderm ingression in insects is characterized by low-level RhoGEF2 activity in the absence of high level fog and t48 activity. (B,C) Evolutionary gain of either high fog or high t48 expression levels elevates RhoGEF2 activity (B) and thus invokes tissue-level coordination of mesoderm cell behavior as in D.melanogaster (C).
Download links
A two-part list of links to download the article, or parts of the article, in various formats.
Downloads (link to download the article as PDF)
Open citations (links to open the citations from this article in various online reference manager services)
Cite this article (links to download the citations from this article in formats compatible with various reference manager tools)
Folded gastrulation and T48 drive the evolution of coordinated mesoderm internalization in flies
eLife 5:e18318.
https://doi.org/10.7554/eLife.18318


