Asymmetric effects of activating and inactivating cortical interneurons
- University of California, San Francisco, United States
- University of California San Francisco, United States
Figures
Figure 1 with 2 supplements
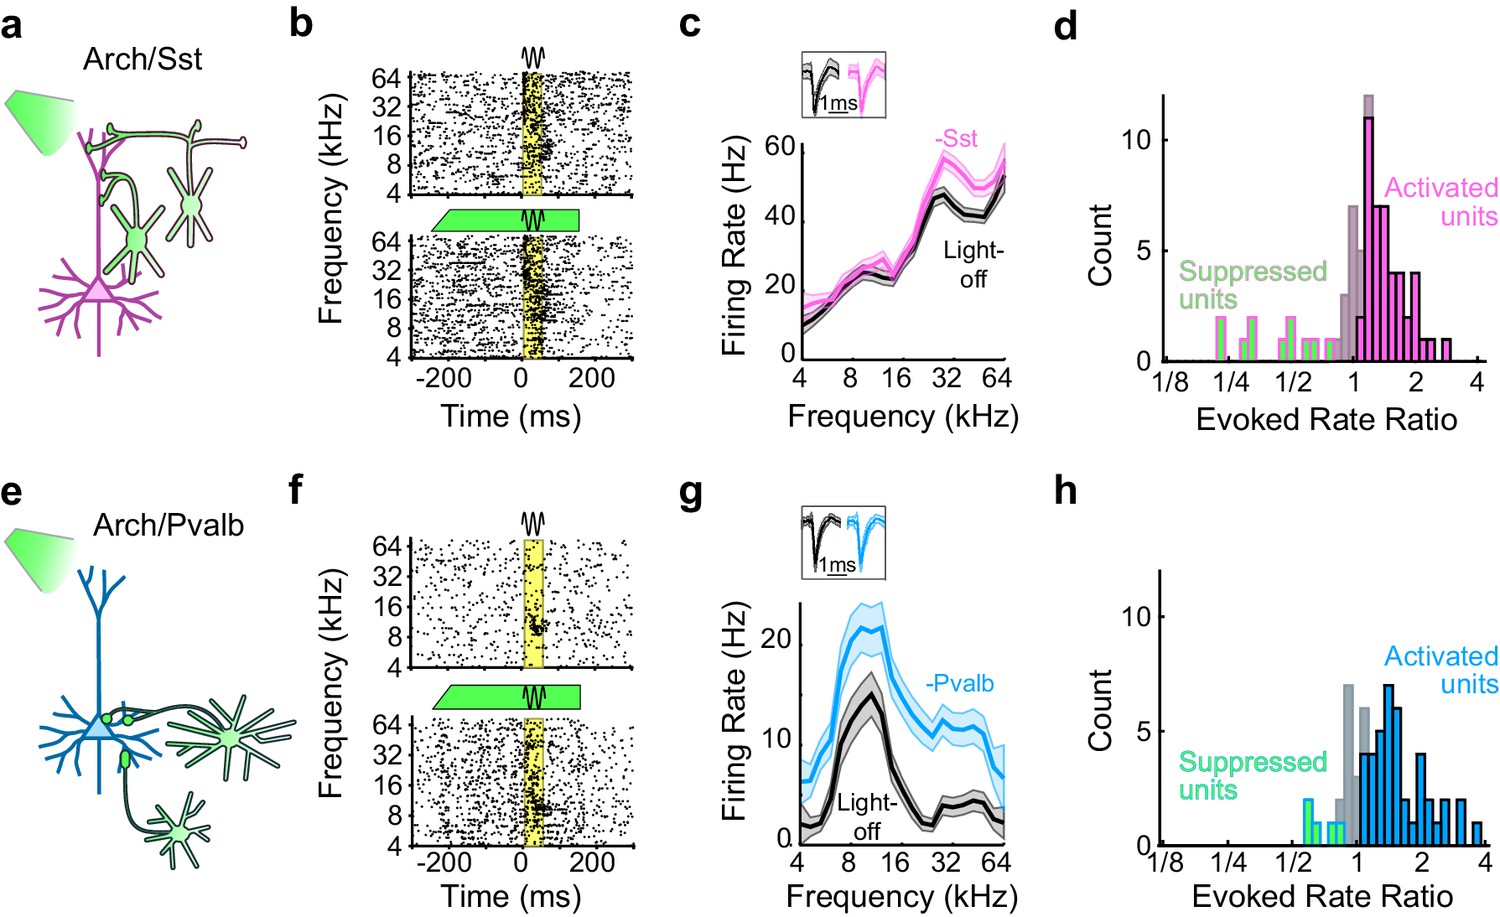
Optogenetic inactivation of Sst+ or Pvalb+ interneurons.
(a) Schematic of optogenetic manipulation in Arch/Sst mice in which green light directly hyperpolarizes Sst+ cells (green cells). (b) Rasters of tone-evoked action potentials for a representative indirectly activated unit without (top) and with (bottom) inactivation of Sst+ cells. The black sine wave represents the duration of the sound, the green bar represents the duration and power of the light, and the yellow bar indicates the response period used to construct frequency tuning curves (FTCs). (c) FTCs (mean ± SEMs) derived from tone-evoked firing rates (FRs) without (black) and with (pink) inactivation of Sst+ cells for the representative unit in (b). Inset shows unit waveforms on trials without (black) and with (pink) inactivation of Sst+ cells. (d) Distribution of the light-on to light-off tone-evoked FR ratios during the response period for frequency-tuned units. Green bars with pink outline indicate units with significantly suppressed FRs (n = 11 of 70 units), grayish pink bars indicate units with no significant change in FR (n = 15 of 70 units), and pink bars with black outline indicate units with significantly increased FRs (n = 44 of 70 units). (e–h) As (a–b), but in Arch/Pvalb mice, in which green light directly hyperpolarizes Pvalb+ cells (e). (f,g) show the rasters and FTCs of a representative, indirectly-activated unit with and without inactivation of Pvalb+ cells. In (h), green bars with light blue outline indicate units with significantly suppressed FRs (n = 5 of 59 units), grayish blue bars indicate units with no significant change in FR (n = 13 of 59 units), and light blue bars with black outline indicate units with significantly increased FRs (n = 41 of 59 units).
Figure 1—figure supplement 1
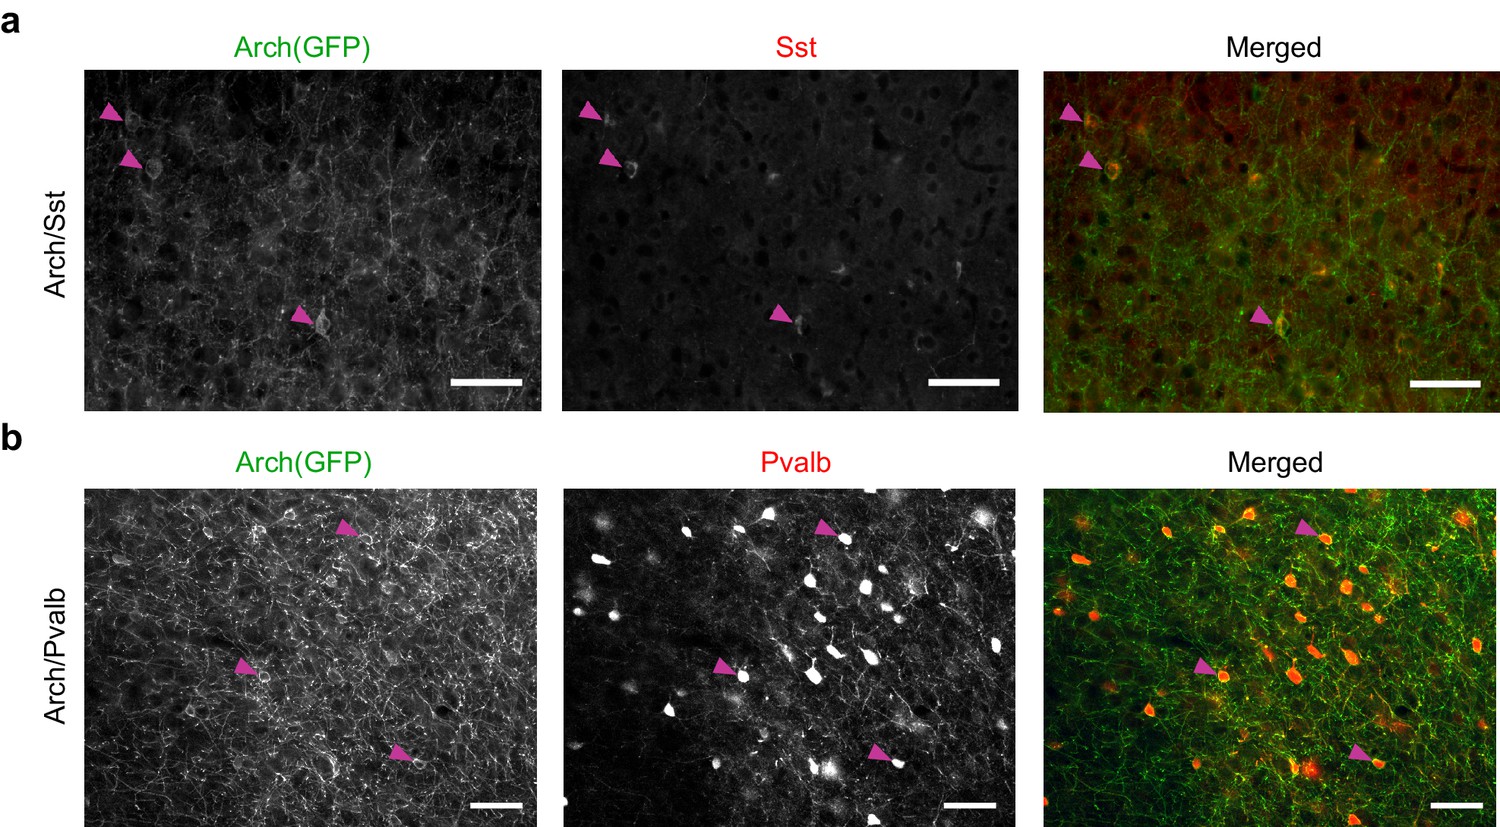
Arch(GFP) co-localizes with somatostatin in Arch/Sst mice and with parvalbumin in Arch/Pvalb mice.
(a) Immunostaining of a brain slice from an Arch/Sst mouse. (Left) Grayscale image of GFP stain. (Middle) Grayscale image of somatostatin stain. (Right) Merged image of GFP (green) and somatostatin (red) stains. Magenta arrows indicate three examples of putative Sst+ cells. Note that red and green somata mostly overlap. Scale bars are 50 microns. (b) Immunostaining of a brain slice from an Arch/Pvalb mouse. (Left) Grayscale image of GFP stain. (Middle) Grayscale image of Pvalb stain. (Right) Merged image of GFP (green) and Pvalb (red) stains. Magenta arrows indicate three examples of putative Pvalb+ cells. Note that red and green somata mostly overlap. Scale bars are 50 microns.
Figure 1—figure supplement 2

Interneuron inactivation increases firing rates and decreases signal to noise ratio.
(a) An example unit’s mean firing rate (FR) ± SEMs relative to sound onset, without (black) and with (pink) inactivation of Sst+ interneurons. The black sine wave represents the duration of the sound, the green bar represents the duration and power of the light, the orange bar indicates the 50 ms time period used to calculate spontaneous FR, and the yellow bar indicates the 50 ms response period used to calculate tone-evoked FR. (b) Same as (a), for an example unit recorded from an Arch/Pvalb mouse without (black) and with (light blue) inactivation of Pvalb+ interneurons. (c) The spontaneous FR with versus without light for each tuned unit whose sound-evoked FR was increased by light. Left: Arch/Sst, n = 44 units; right: Arch/Pvalb, n = 41 units. (d) Spontaneous rate ratio (defined as light-on FR divided by light-off FR) for the units in (c). Inactivation of Sst+ interneurons increases the spontaneous rate ratio (signrank p=7.6 × 10⁻⁹), as does inactivation of Pvalb+ interneurons (signrank p=2.4 × 10⁻⁸), but these ratios are not different from each other (ranksum p=0.054). (e) Same as (c), but for sound-evoked FRs (calculated as average spikes/second in the 50 ms after response onset). (f) Sound-evoked rate ratio for the units in (e). Inactivation of Sst+ interneurons increases the sound-evoked rate ratio (signrank p=7.5 × 10⁻⁹), as does inactivation of Pvalb+ interneurons (signrank p=2.2 × 10⁻⁸), but these ratios are not different from each other (ranksum p=0.26). (g) Same as (c), but for baseline-subtracted sound-evoked FRs (defined as evoked FR minus spontaneous FR). (h) Baseline-subtracted sound-evoked ratio for the units in (g). Inactivation of Sst+ interneurons increases the baseline-subtracted sound-evoked ratio (signrank p=8.0 × 10⁻⁷), as does inactivation of Pvalb+ interneurons (signrank p=5.2 × 10⁻⁶), but these ratios are not different from each other (ranksum p=0.77). (i) Same as (c), but for signal to noise ratio (SNR: defined as sound-evoked FR divided by spontaneous FR). (j) SNR ratio for the units in (i). Inactivation of Sst+ interneurons decreases SNR ratio (signrank p=2.6 × 10⁻¹⁰), as does inactivation of Pvalb+ interneurons (signrank p=1.9 × 10⁻⁸), but these ratios are not different from each other (ranksum p=0.081).
Figure 2
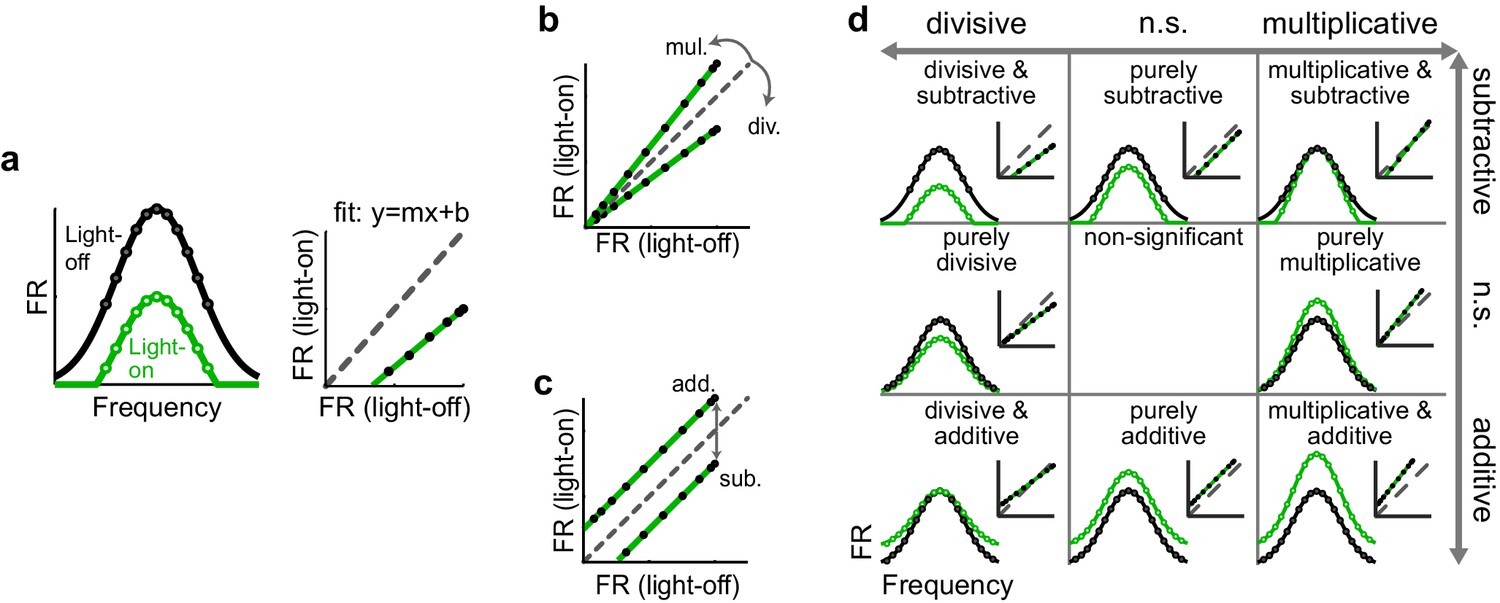
Identifying multiplicative/divisive and additive/subtractive changes in frequency tuning curves with linear regression.
(a) (Left) Schematic of a neuron’s FTC in the light-off (black) and light-on (green) conditions. (Right) Linear regression of light-off versus light-on firing rates (FRs) (measurements: black; fit: green; unity line: dashed gray). (b) Multiplicative/divisive changes produce significant slopes (≠ 1). (c) Additive/subtractive changes produce significant intercepts (≠ 0). (d) Table showing all combinations of linear transformations of frequency tuning curves and their associated linear fits.
Figure 3 with 5 supplements
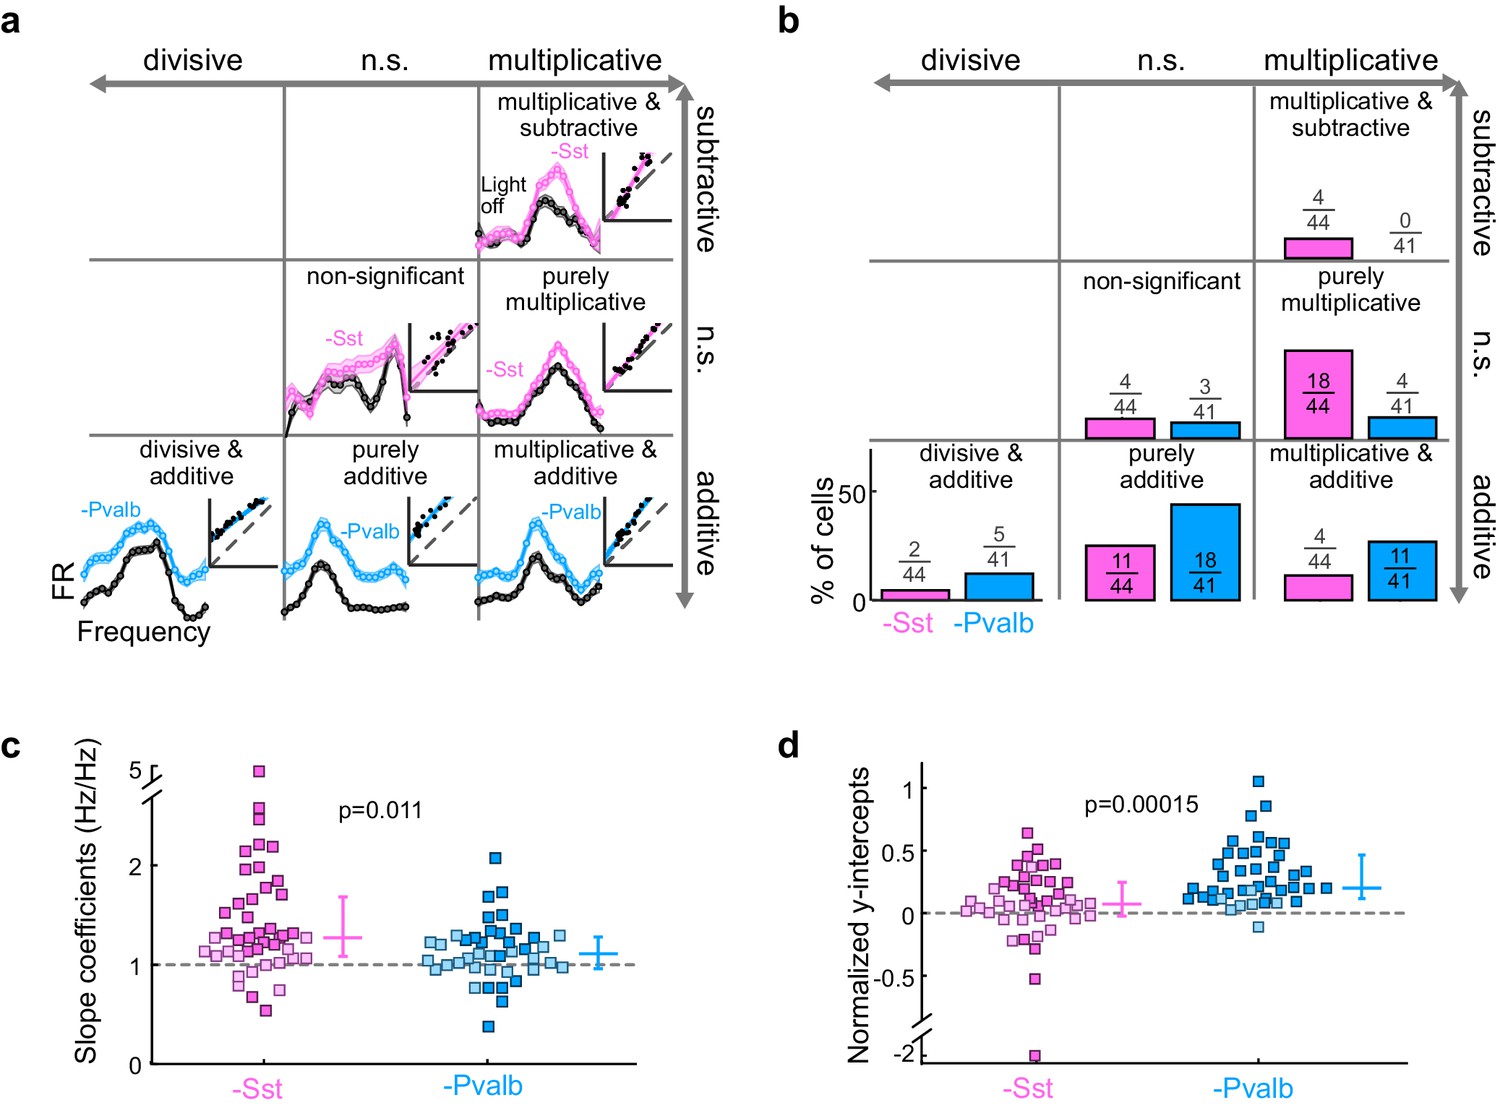
Optogenetically inactivating Sst+ interneurons, compared to inactivating Pvalb+ interneurons, produces different linear transformations of FTCs.
(a) FTCs (mean ± SEMs) of representative units demonstrating all the combinations of linear transformations observed with inactivation of either Sst+ cells (pink) or Pvalb+ cells (light blue). (b) Fraction of units that showed each kind of linear transformation with inactivation of Sst+ cells (pink) and inactivation of Pvalb+ cells (light blue). These proportions are significantly different between groups (Arch/Sst: n = 44 units from 12 mice; Arch/Pvalb: n = 41 units from 11 mice; Fisher’s exact test p=1.5 × 10⁻³). (c) Population best-fit slope coefficients with inactivation of Sst+ cells (pink) and inactivation of Pvalb+ cells (light blue). Slopes were significantly different between groups (rank-sum p=0.01). Dark/light squares indicate units for which the slope was/was not significantly different from 1, respectively. Lines indicate population medians and lower/upper quartiles. (d) Population best-fit y-intercepts, normalized by maximum firing rate, with inactivation of Sst+ cells (pink) and inactivation of Pvalb+ cells (light blue). Y-intercepts were significantly different between groups (rank-sum p=1.5 × 10⁻⁴). Dark/light squares indicate units for which the y-intercept was/was not significantly different from 0, respectively. Lines indicate population medians and lower/upper quartiles.
Figure 3—figure supplement 1

Effects of inactivating Sst+ or Pvalb+ cells are mainly linear.
(a) Distribution of the R2 values from the linear regression analysis from units with activation of Sst+ cells (pink) and activation of Pvalb+ cells (light blue). High median R2 values demonstrate that in most units the effects of decreased inhibition are fit well by a linear framework (ChR2/Sst: median R2 = 0.81; ChR2/Pvalb: median R2 = 0.80).
Figure 3—figure supplement 2

Differences between inactivating Sst+ or Pvalb+ cells are present among broad-spiking, but not narrow-spiking, units.
(a) Best-fit slope coefficients for each unit as a function of action potential (AP) duration (trough-to-peak duration). Among the units with narrow-spiking waveforms (≤450 μs) whose activity was increased by light (Arch/Sst: n = 15; Arch/Pvalb: n = 15), Sst+ cell inactivation (pink) and Pvalb+ cell inactivation (light blue) produced slopes that were not significantly different (ranksum p=0.12). However, among the units with broad-spiking waveforms (>450 μs) whose activity was increased by light (Arch/Sst: n = 29; Arch/Pvalb: n = 26), Sst+ cell inactivation produced significantly larger slopes (rank-sum p=0.046) than Pvalb+ cell inactivation. Darker squares represent units for which the slope was significant. (b) Normalized best-fit y-intercepts for each unit as a function of change in sound-evoked firing rate. Among the units with narrow-spiking waveforms (≤450 μs) whose activity was increased by light (Arch/Sst: n =15; Arch/Pvalb: n = 15), Sst+ cell inactivation (pink) and Pvalb+ cell inactivation (light blue) produced y-intercepts that were not significantly different (rank-sum p=0.23). However, among the units with broad-spiking waveforms (>450 μs) whose activity was increased by light (Arch/Sst: n = 29; Arch/Pvalb: n = 26), Pvalb+ cell inactivation produced larger y-intercepts (rank-sum p=0.00012) than Sst+ cell inactivation. Darker squares represent units for which the normalized y-intercept was significant.
Figure 3—figure supplement 3
Effects of inactivating Sst+ or Pvalb+ cells are not explained entirely by increases in spontaneous activity.
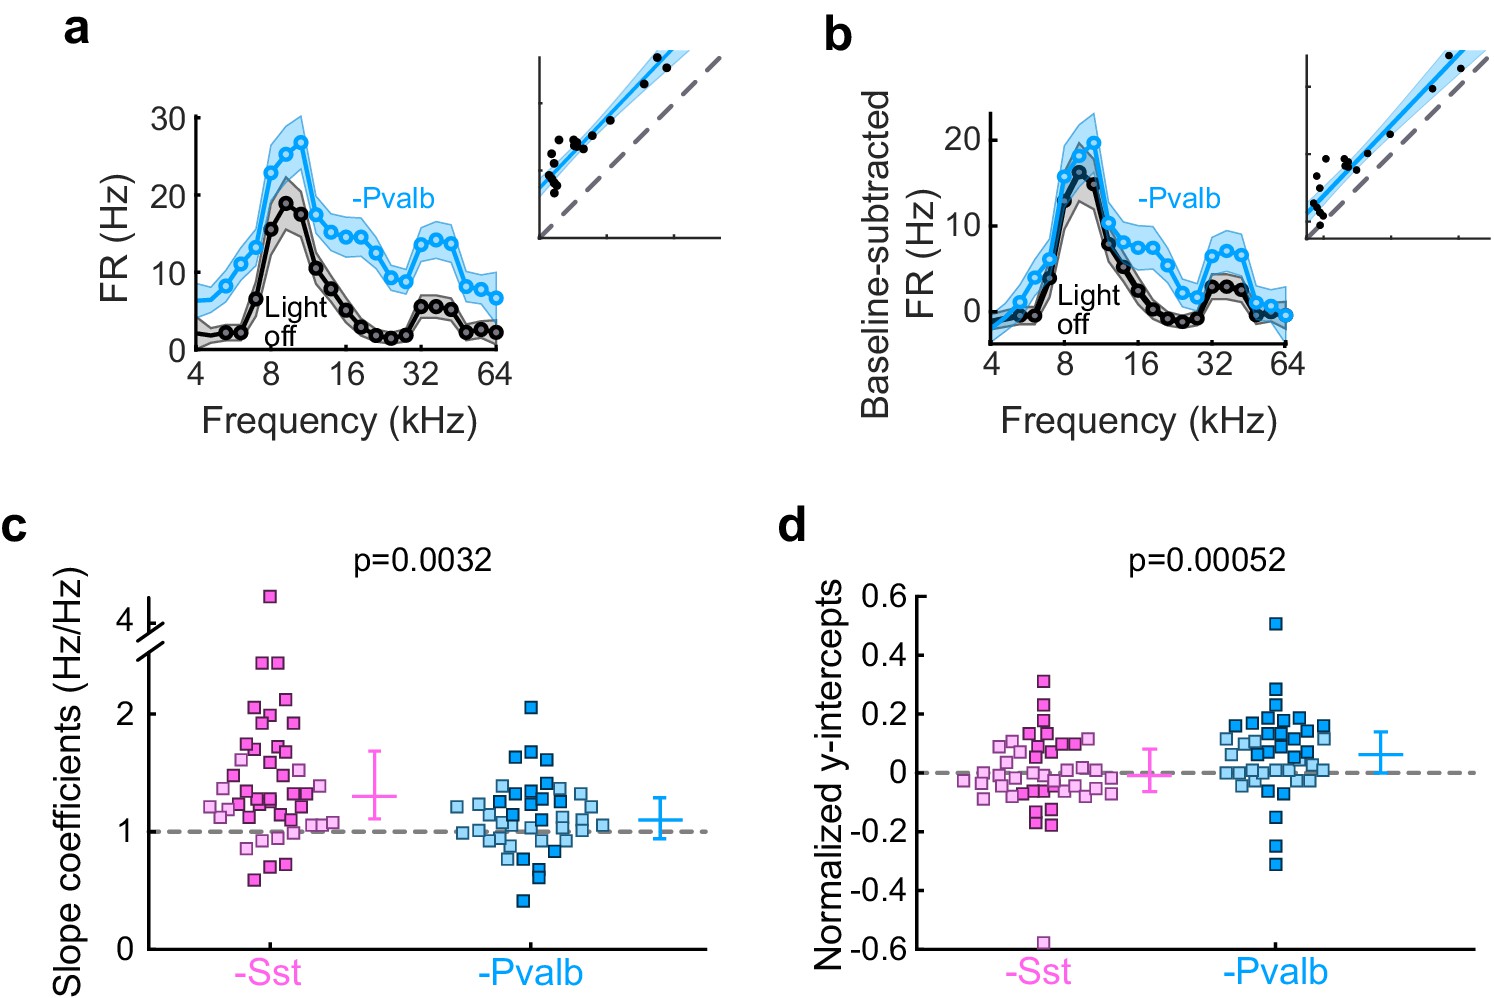
(a) An example unit’s FTC (mean ± SEMs) with (light blue) and without (black) inactivation of Pvalb+ cells. Inset shows the linear regression for light-off versus light-on firing rates (FRs) (measured FRs: black dots; fit: light blue line; confidence intervals: light blue shading; unity line: dashed gray line). (b) Baseline-subtracted FTCs from the same unit in (a). Note that the additive component (y-intercept) is still significant after baseline-subtraction, albeit smaller. (c) Best-fit slope coefficients from baseline-subtracted units with inactivation of Sst+ cells (pink) and inactivation of Pvalb+ cells (light blue) were significantly different from each other (rank-sum p=0.0032). Dark/light squares indicate units for which the slope was/was not significantly different from 0, respectively. Lines indicate population medians and lower/upper quartiles. (d) Normalized best-fit y-intercepts from baseline-subtracted units with inactivation of Sst+ cells (pink) and inactivation of Pvalb+ cells (light blue) were significantly different from each other (rank-sum, p=0.00052). Dark/light squares indicate units for which the y-intercept was/was not significantly different from 0, respectively. Lines indicate population medians and lower/upper quartiles.
Figure 3—figure supplement 4
Differences between inactivating Sst+ or Pvalb+ cells are present even in unit populations whose firing rates are weakly affected by interneuron inactivation, as well as in strongly affected unit populations.
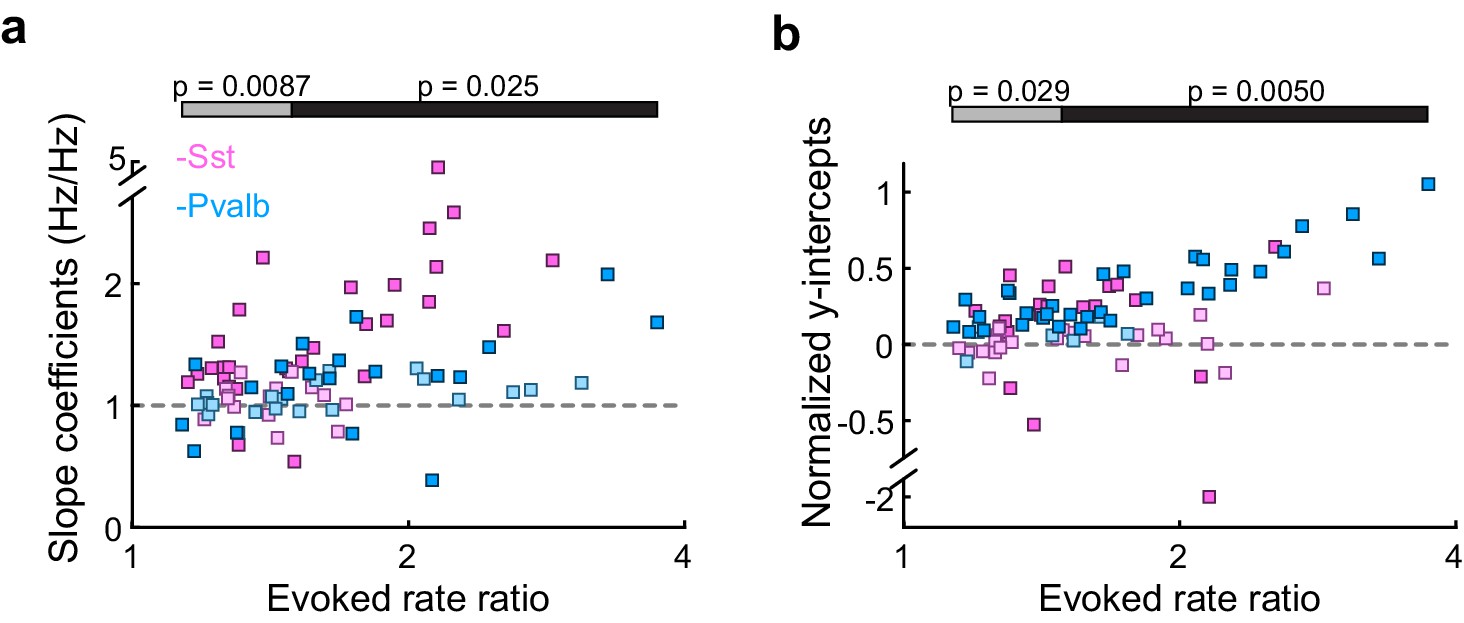
(a) Best-fit slope coefficients for each unit as a function of change in sound-evoked firing rate between the light-on and light-off conditions. Among the half of the units that were more weakly affected by interneuron inactivation (Arch/Sst: n = 25, pink; Arch/Pvalb: n = 18, light blue), Pvalb+ cell inactivation produced smaller slopes than Sst+ cell inactivation (rank-sum p=0.0087). Among the half of the units that were more strongly affected by interneuron inactivation (Arch/Sst: n = 19; Arch/Pvalb: n = 23), Pvalb+ cell inactivation produced smaller slopes than Sst+ cell inactivation (rank-sum p=0.025). Darker squares represent units for which the slope was significant. (b) Normalized best-fit y-intercepts for each unit as a function of change in sound-evoked firing rate. Among the half of the units that were more weakly affected by interneuron inactivation (Arch/Sst: n = 25, pink; Arch/Pvalb: n = 18, light blue), Pvalb+ cell inactivation produced larger y-intercepts than Sst+ cell inactivation (rank-sum p=0. 029). Among the half of the units that were more strongly affected by interneuron inactivation (Arch/Sst: n = 19; Arch/Pvalb: n = 23), Pvalb+ cell inactivation produced larger y-intercepts than Sst+ cell inactivation (rank-sum p=0.005). Darker squares represent units for which the y-intercept was significant.
Figure 3—figure supplement 5
Inactivation of Sst+ cells, compared to inactivation of Pvalb+ cells, produces different proportions of linear effects, even after matching unit populations based on firing rate ratios.
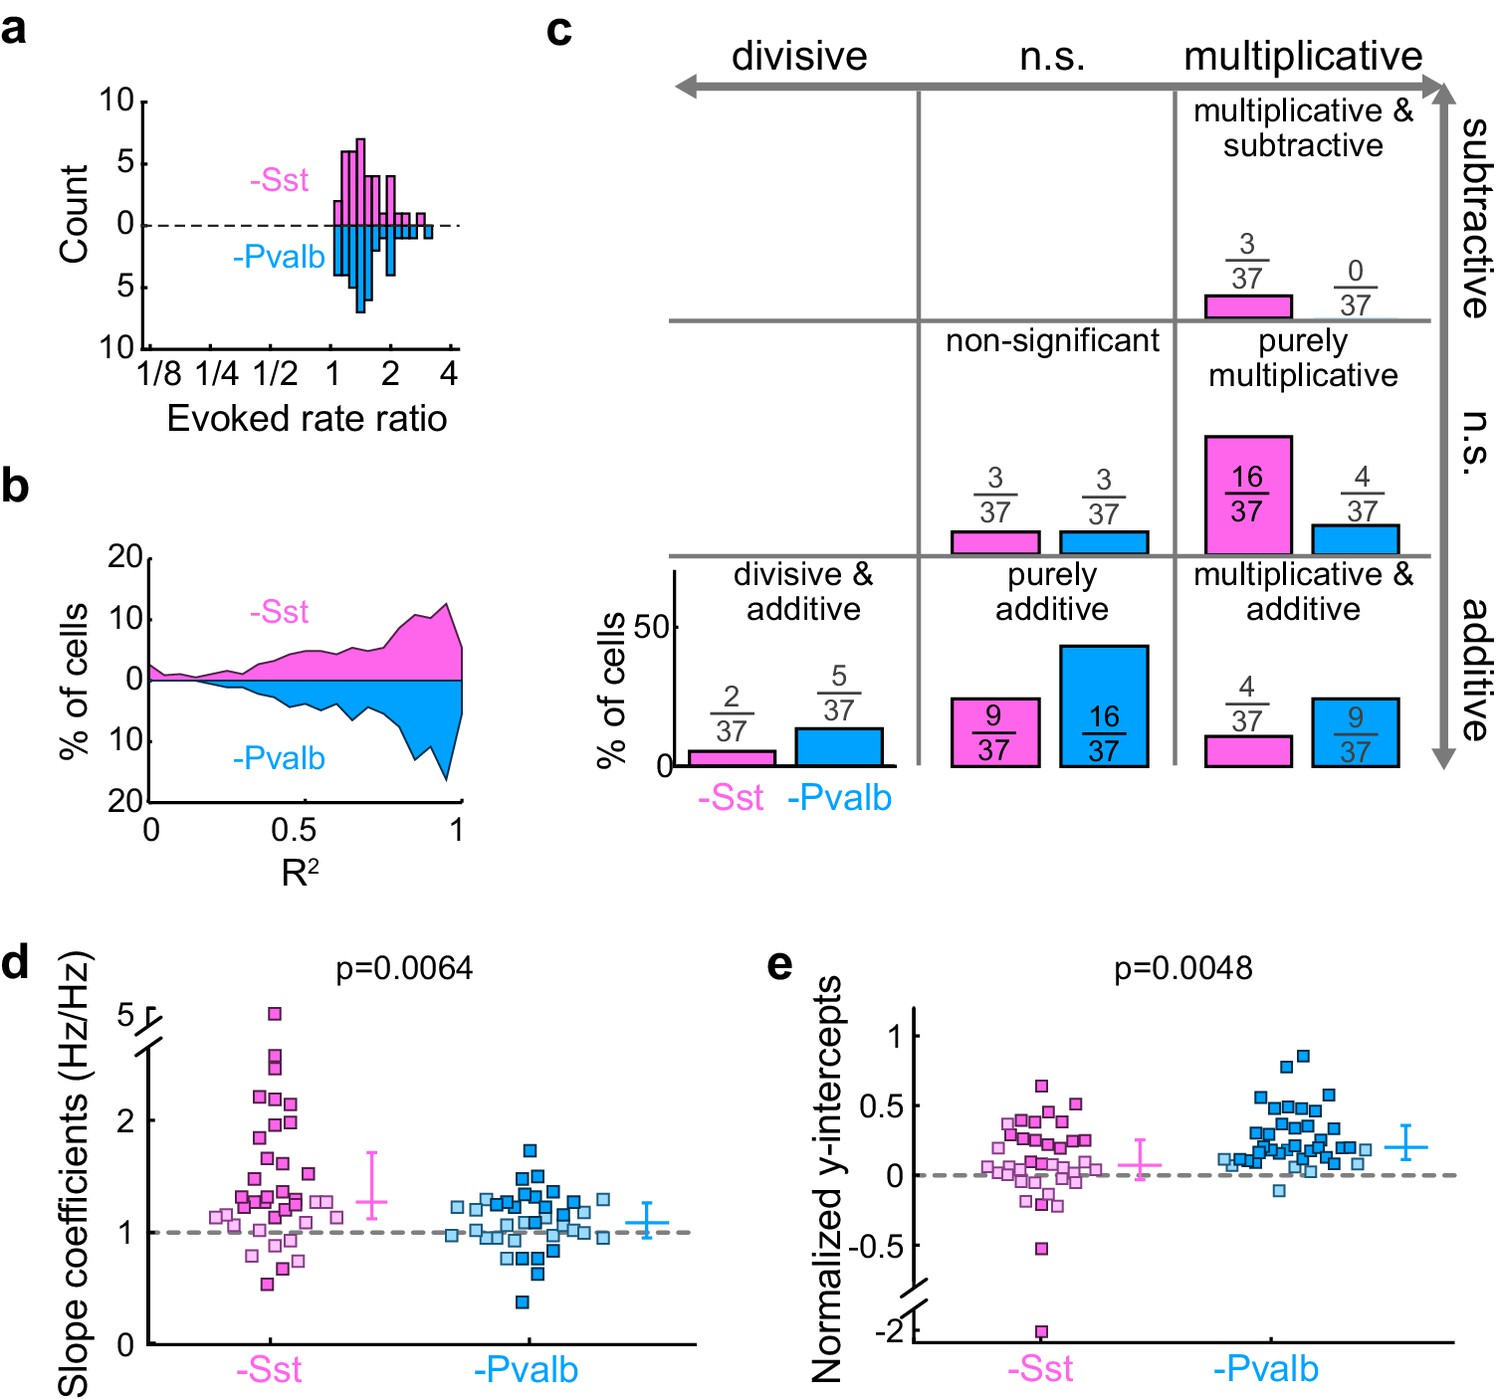
(a) The linear regression analysis is limited to units from Arch/Sst mice and Arch/Pvalb mice that have similar sound-evoked firing rate ratios (Arch/Sst: n = 37 units from 12 mice; Arch/Pvalb: n = 37 units from 11 mice). (b) Distribution of the R2 values from the linear regression analysis from ratio-matched units with inactivation of Sst+ cells (pink) and inactivation of Pvalb+ cells (light blue). High median R2 values demonstrate that most ratio-matched units are fit well by a linear framework (Arch/Sst: median R2 = 0.78; Arch/Pvalb: median R2 = 0.87) (c) Fraction of units that showed each kind of linear transformation with inactivation of Sst+ cells (pink) or inactivation of Pvalb+ cells (light blue) were significantly different from each other (Arch/Sst: n = 37 units; Arch/Pvalb: n = 37 units; Fisher’s exact test p=0.0058). (d) Best-fit slope coefficients from ratio-matched units with inactivation of Sst+ cells (pink) and inactivation of Pvalb+ cells (light blue) were significantly different from each other (rank-sum p=0.0064). Dark/light squares indicate units for which the slope was/was not significantly different from 0, respectively. Lines indicate population medians and lower/upper quartiles. (e) Normalized best-fit y-intercepts from ratio-matched units with inactivation of Sst+ cells (pink) and inactivation of Pvalb+ cells (light blue) were significantly different from each other (rank-sum, p=0.0048). Dark/light squares indicate units for which the y-intercept was/was not significantly different from 0, respectively. Lines indicate population medians and lower/upper quartiles.
Figure 4 with 2 supplements
Optogenetic activation of Sst+ or Pvalb+ interneurons.
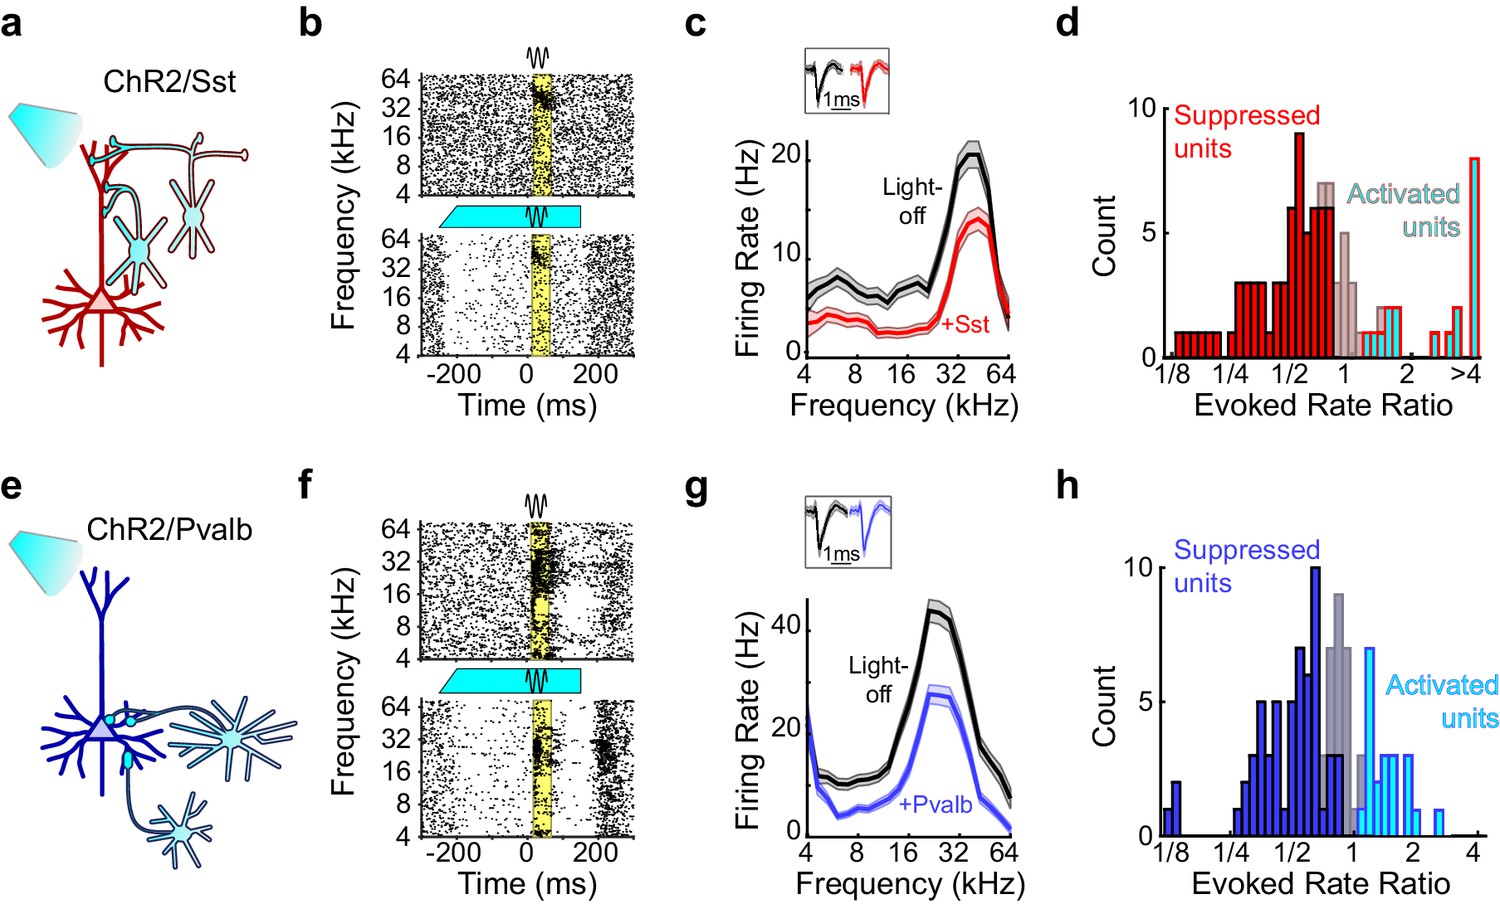
(a) Schematic of optogenetic manipulation in ChR2/Sst mice in which blue light directly activates Sst+ cells (cyan cells). (b) Rasters of tone-evoked action potentials for a representative suppressed unit without (top) and with (bottom) activation of Sst+ cells. The black sine wave represents the duration of the sound, the cyan bar represents the duration and power of the light, and the yellow bar indicates the response period used to construct FTCs. (c) FTCs (mean ± SEMs) derived from tone-evoked firing rates (FRs) without (black) and with (red) activation of Sst+ cells for the representative unit in (b). Inset shows unit waveforms on trials without (black) and with (red) activation of Sst+ cells. (d) Distribution of the ratio of light-on to light-off FRs during the response period in ChR2/Sst mice for frequency tuned units. Red bars indicate units with significantly suppressed FRs (n = 64 of 97 units), grayish red bars indicate units with no significant change in FR (n = 19 of 97 units), and cyan bars with red outline indicate units with significantly increased FRs (n = 14 of 97 units). (e–h) As (a–b), but in ChR2/Pvalb mice, in which blue light directly activates Pvalb+ cells (e). (f,g) show the rasters and FTCs of a representative suppressed unit with and without activation of Pvalb+ cells. In (h), blue bars indicate units with significantly suppressed FRs (n = 62 of 103 units), grayish blue bars indicate units with no significant change in FR (n = 20 of 103 units), and cyan bars with blue outline indicate units with significantly increased FRs (n = 19 of 103 units).
Figure 4—figure supplement 1
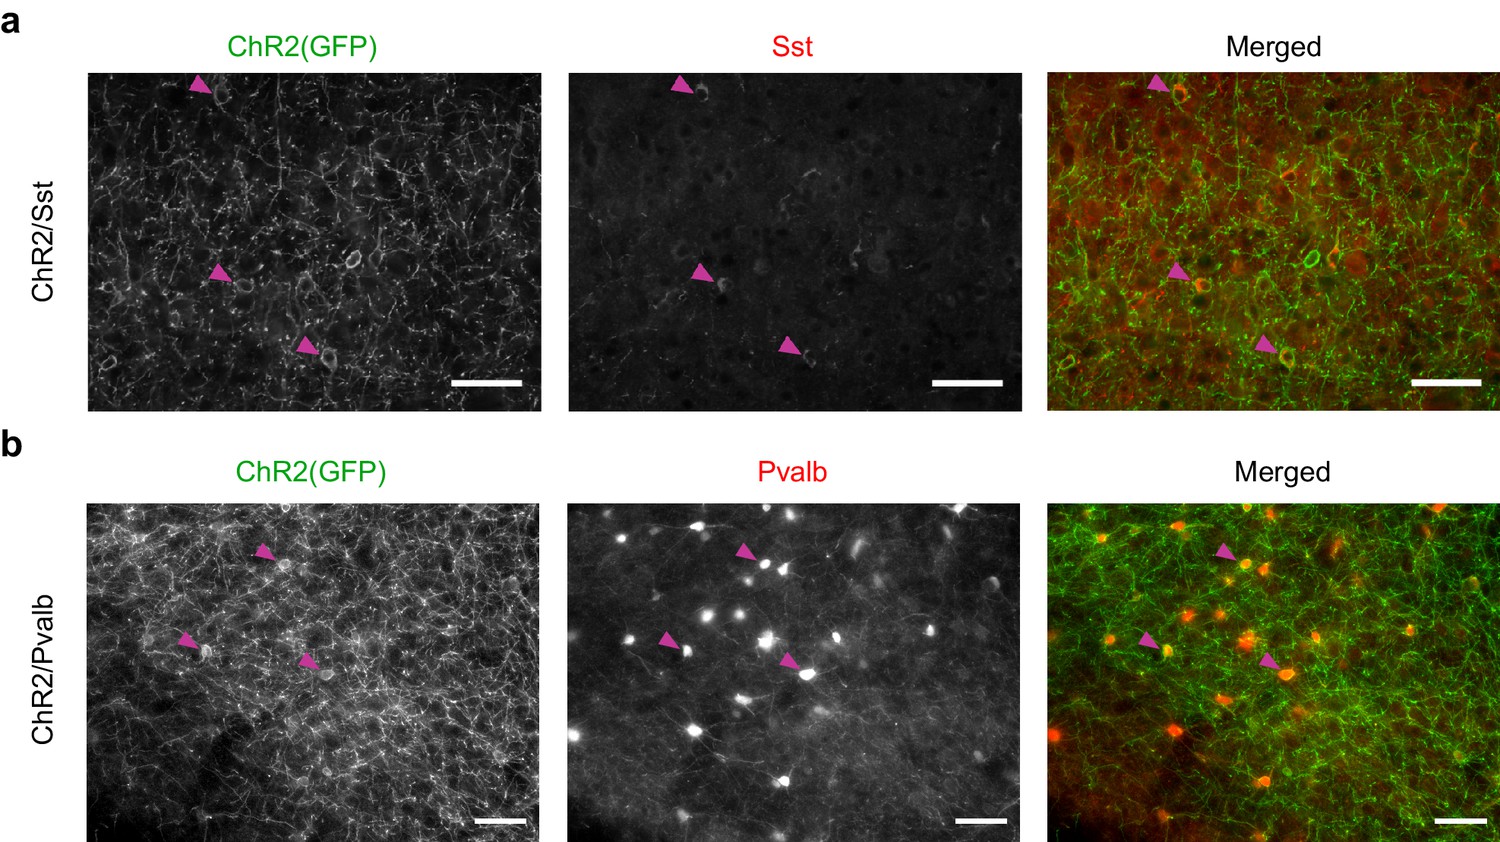
ChR2(GFP) co-localizes with somatostatin in ChR2/Sst mice and with parvalbumin in ChR2/Pvalb mice.
(a) Immunostaining of a brain slice from a ChR2/Sst mouse. (Left) Grayscale image of GFP stain. (Middle) Grayscale image of somatostatin stain. (Right) Merged image of GFP (green) and somatostatin (red) stains. Magenta arrows indicate three examples of putative Sst+ cells. Note that red and green somata mostly overlap. Scale bars are 50 microns. (b) Immunostaining of a brain slice from a ChR2/Pvalb mouse. (Left) Grayscale image of GFP stain. (Middle) Grayscale image of parvalbumin stain. (Right) Merged image of GFP (green) and parvalbumin (red) stains. Magenta arrows indicate three examples of putative Pvalb+ cells. Note that red and green somata mostly overlap. Scale bars are 50 microns.
Figure 4—figure supplement 2

Interneuron activation decreases firing rates and increases signal to noise ratio.
(a) An example unit’s mean firing rate (FR) ± SEMs relative to sound onset, without (black) and with (red) activation of Sst+ interneurons. The black sine wave represents the duration of the sound, the green bar represents the duration and power of the light, the orange bar indicates the 50 ms time period used to calculate spontaneous FR, and the yellow bar indicates the 50 ms response period used to calculate tone-evoked FR. (b) Same as (a), but of an example unit recorded from a ChR2/Pvalb mouse without (black) and with (blue) activation of Pvalb+ interneurons. (c) The spontaneous firing rate (FR) (calculated as average spikes/second in the 50 ms before the stimulus) with versus without light for each tuned unit whose sound-evoked FR was increased by light. Left: ChR2/Sst, n = 64 units; right: ChR2/Pvalb, n = 62 units. (d) Spontaneous rate ratio (defined as light-on FR divided by light-off FR) for the units in (a). Activation of Sst+ interneurons decreases the spontaneous rate ratio (signrank p=1.1 × 10⁻¹¹), as does activation of Pvalb+ interneurons (signrank p=5.1 × 10⁻¹¹), but these ratios are not different from each other (ranksum p=0.56). (e) Same as (c), but for sound-evoked FRs (calculated as average spikes/second in the 50 ms after response onset). (f) Sound-evoked rate ratio for the units in (e). Activation of Sst+ interneurons decreases the sound-evoked rate ratio (signrank p=3.5 × 10⁻¹²), as does activation of Pvalb+ interneurons (signrank p=7.6 × 10⁻¹²), but these ratios are not different from each other (ranksum p=0.76). (g) Same as (c), but for baseline-subtracted sound-evoked FRs (defined as evoked FR minus spontaneous FR). (h) Baseline-subtracted sound-evoked ratio for the units in (g). Activation of Sst+ interneurons decreases the baseline-subtracted sound-evoked ratio (signrank p=2.2 × 10⁻¹⁰), as does activation of Pvalb+ interneurons (signrank p=7.6 × 10⁻¹²), but these ratios are not different from each other (ranksum p=0.31). (i) Same as (c), but for signal to noise ratio (SNR: defined as sound-evoked FR divided by spontaneous FR). (j) SNR ratio for the units in (i). Activation of Sst+ interneurons increases SNR ratio (signrank p=5.2 × 10⁻¹²), as does activation of Pvalb+ interneurons (signrank p=1.6 × 10⁻¹¹), but these ratios are not different from each other (ranksum p=0.20).
Figure 5 with 6 supplements
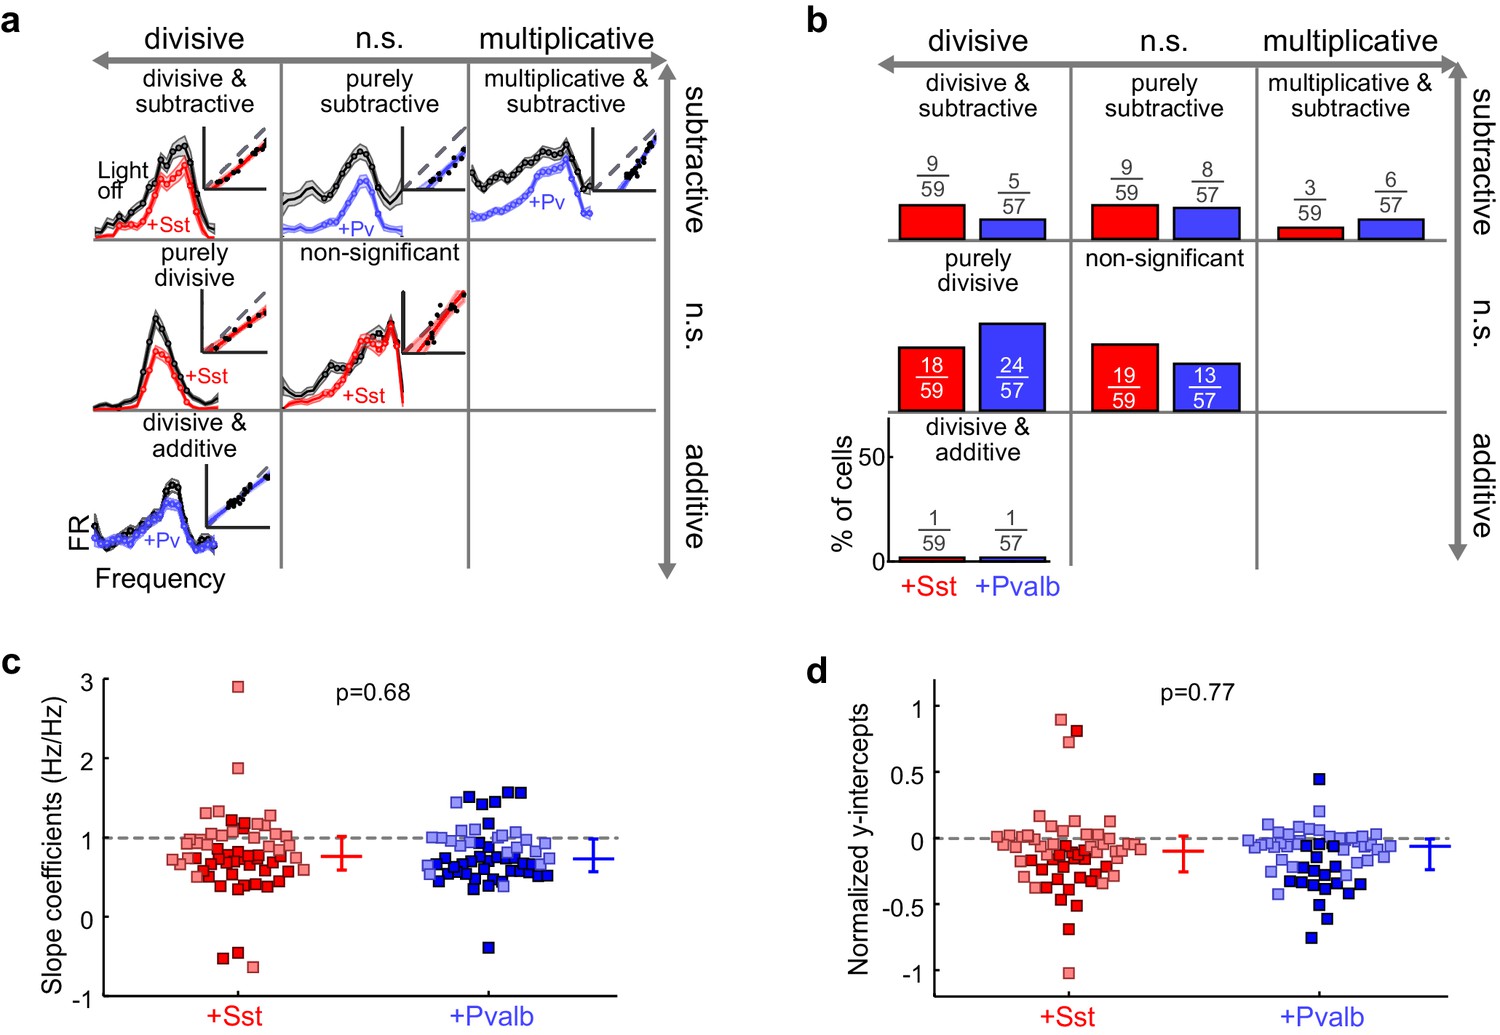
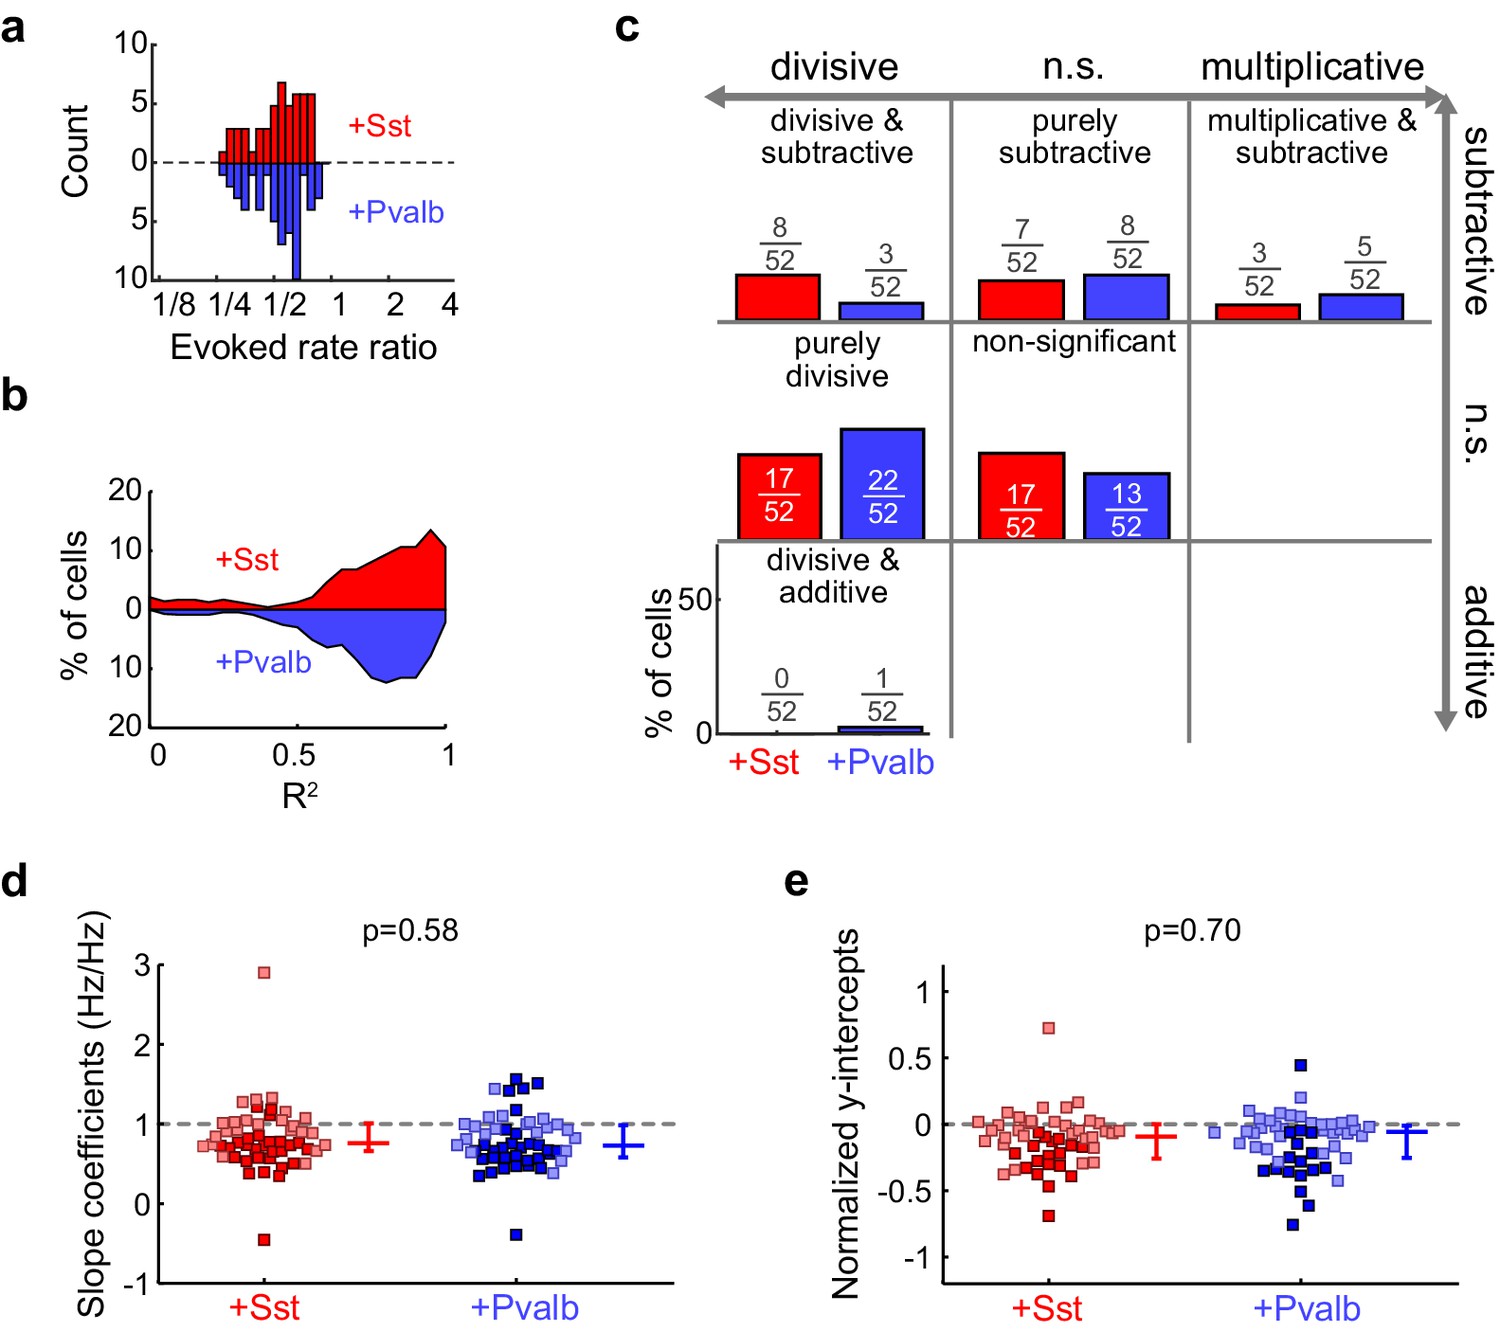
Optogenetically activating Sst+ interneurons, compared to activating Pvalb+ interneurons, produces similar linear transformations of frequency tuning curves.
(a) FTCs (mean ± SEMs) of representative units demonstrating all the combinations of linear transformations observed with activation of either Sst+ cells (red) or Pvalb+ cells (blue). (b) Fraction of units that showed each kind of linear transformation with activation of Sst+ cells (red) and activation of Pvalb+ cells (blue). Distribution of proportions is not significantly different between groups (ChR2/Sst: n = 59 units from 25 mice; ChR2/Pvalb: n = 57 units from 26 mice; Fisher’s exact test p=0.51). (c) Best-fit slope coefficients for activation of Sst+ cells (red) and activation of Pvalb+ cells (blue). Slopes were not significantly different between groups (rank-sum p=0.68). Dark/light squares indicate units for which slope was/was not significantly different from 1, respectively. Lines indicate population medians and lower/upper quartiles. (d) Best-fit y-intercepts, normalized by maximum firing rate, for activation of Sst+ cells (red) and activation of Pvalb+ cells (blue). Y-intercepts were not significantly different between groups (rank-sum, p=0.77). Dark/light squares indicate units for which y-intercept was/was not significantly different from 0, respectively. Lines indicate population medians and lower/upper quartiles.
Figure 5—figure supplement 1

Effects of activating Sst+ or Pvalb+ cells are mainly linear.
(a) Distribution of the R2 values from the linear regression analysis from units with activation of Sst+ cells (red) and activation of Pvalb+ cells (blue). High median R2 values demonstrate that response changes in most units are fit well by a linear framework (ChR2/Sst: median R2 = 0.81; ChR2/Pvalb: median R2 = 0.80).
Figure 5—figure supplement 2

Broad- and narrow-spiking units are similarly affected by interneuron activation.
(a) Best-fit slope coefficients for each unit as a function of action potential (AP) duration (trough-to-peak duration). Among the units with narrow-spiking waveforms (≤450 μs) whose activity was suppressed by light (ChR2/Sst: n =29; ChR2/Pvalb: n = 12), Sst+ cell activation (red) and Pvalb+ cell activation (blue) produced similar slopes (ranksum p=0.85). Likewise, among the units with broad-spiking waveforms (>450 μs) whose activity was suppressed by light (ChR2/Sst: n = 30; ChR2/Pvalb: n = 45), Sst+ activation and Pvalb+ cell activation produced similar slopes (rank-sum p=0.51). Darker squares represent units for which the slope was significant. (b) Normalized best-fit y-intercepts for each unit as a function of change in sound-evoked firing rate. Among the units with narrow-spiking waveforms (≤450 μs) whose activity was suppressed by light (ChR2/Sst: n = 29; ChR2/Pvalb: n = 12), Sst+ cell activation (red) and Pvalb+ cell activation (blue) produced similar y-intercepts (rank-sum p=0.22). Likewise, among the units with broad-spiking waveforms (>450 μs) whose activity was suppressed by light (ChR2/Sst: n = 30; ChR2/Pvalb: n = 45), Sst+ activation and Pvalb+ cell activation produced similar y-intercepts (rank-sum p=0.58). Darker squares represent units for which the normalized y-intercept was significant.
Figure 5—figure supplement 3
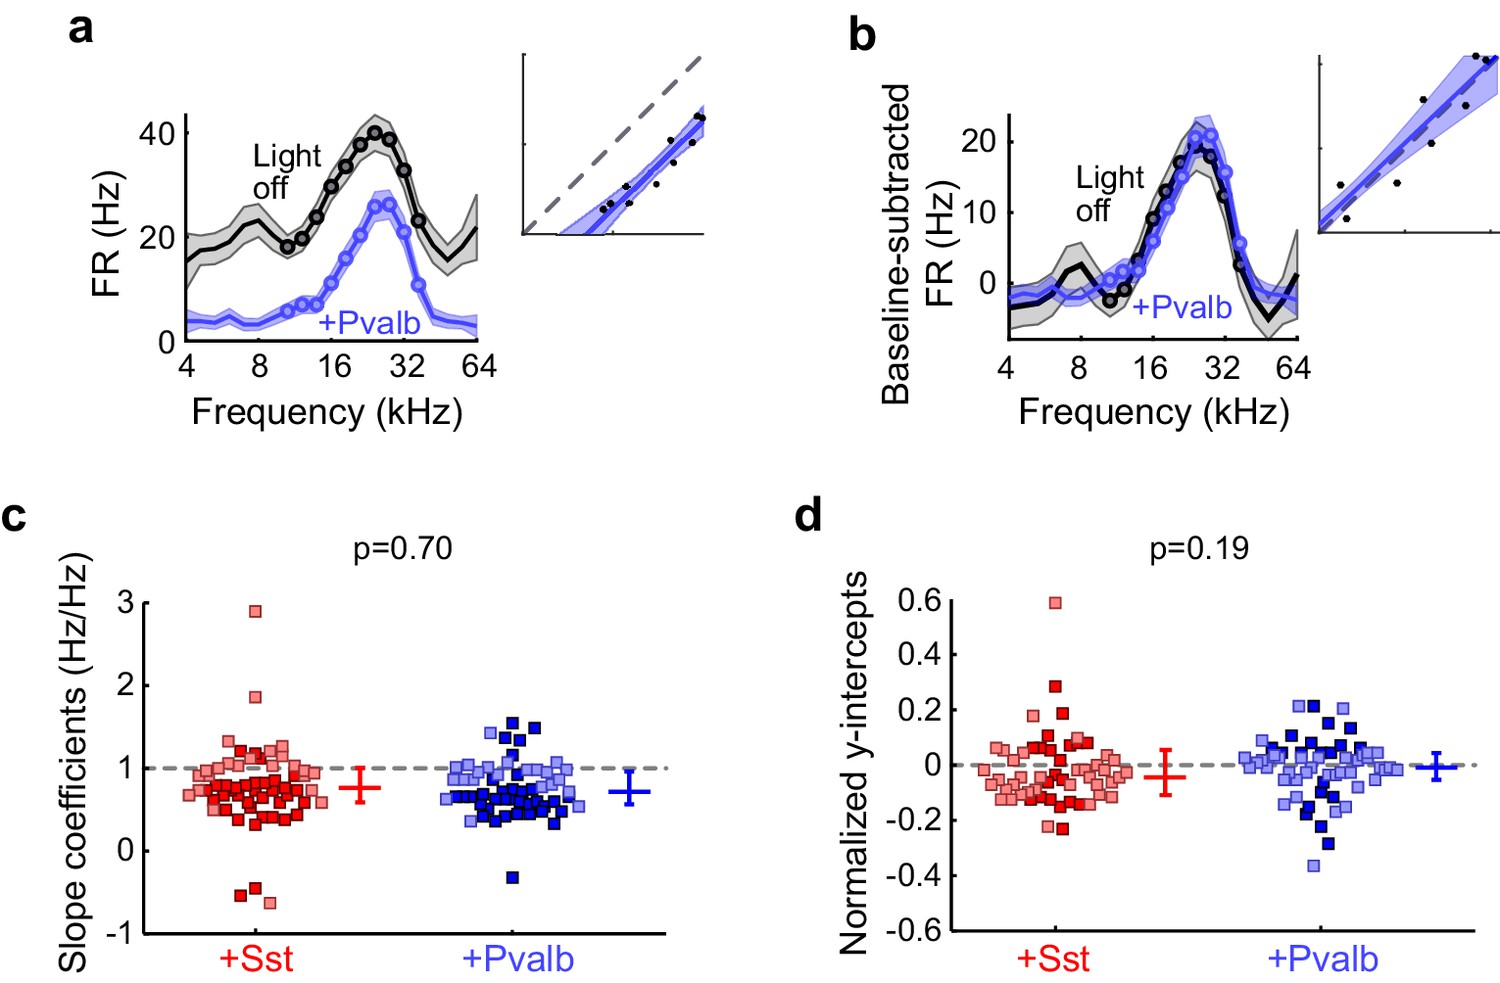
Similar effects of activating Sst+ or Pvalb+ cells remain after baseline subtraction.
(a) An example unit’s FTC (mean ± SEMs) with (blue) and without (black) activation of Pvalb+ cells. Inset shows the linear regression for light-off versus light-on firing rates (FRs) (measured FRs: black dots; fit: blue line; confidence intervals: blue shading; unity line: dashed gray line). (b) Baseline-subtracted FTCs from the same unit in (a). Note that the subtractive component (y-intercept) is no longer significant after baseline-subtraction. (c) Best-fit slope coefficients from baseline-subtracted units with activation of Sst+ cells (red) and activation of Pvalb+ cells (blue) were similar to each other (rank-sum p=0.70). Dark/light squares indicate units for which slope was/was not significantly different from 0, respectively. Lines indicate population medians and lower/upper quartiles. (d) Normalized best-fit y-intercepts from baseline-subtracted units with activation of Sst+ cells (red) and activation of Pvalb+ cells (blue) were similar to each other (rank-sum, p=0.19). Dark/light squares indicate units for which y-intercept was/was not significantly different from 0, respectively. Lines indicate population medians and lower/upper quartiles.
Figure 5—figure supplement 4
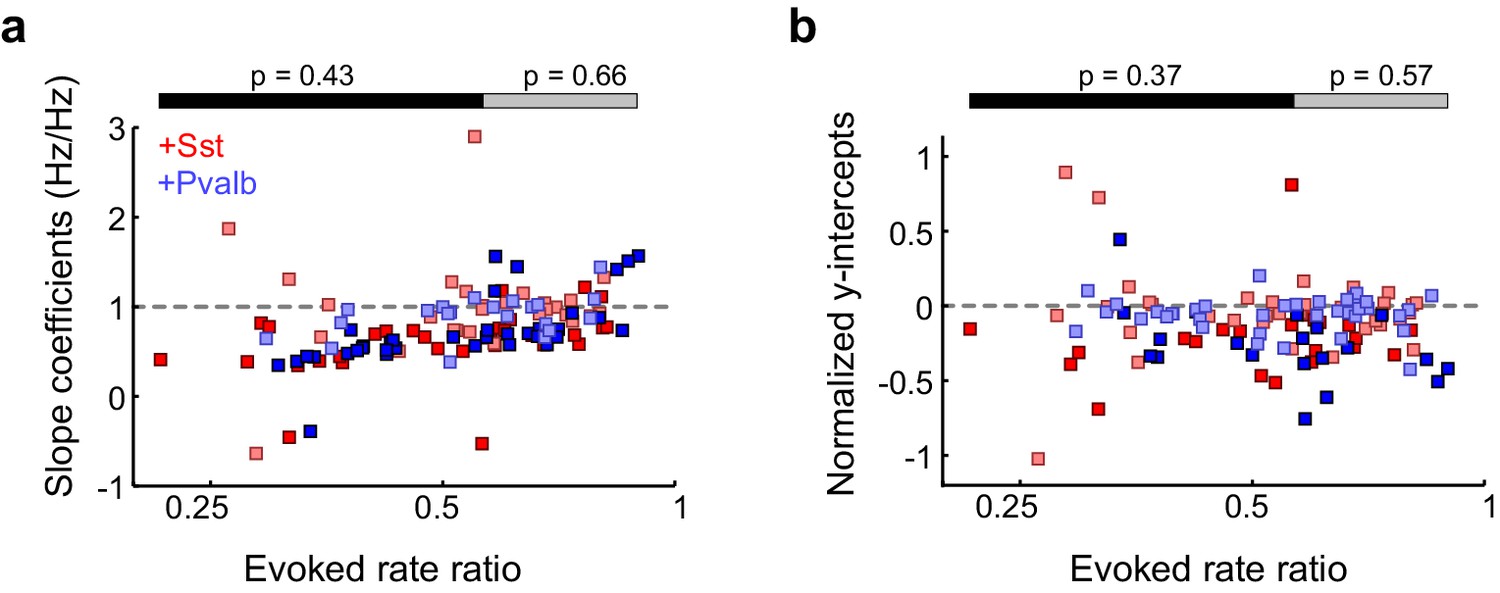
Similarities between activating Sst+ or Pvalb+ cells are present even in unit populations whose firing rates are strongly suppressed, as well as in weakly-suppressed unit populations.
(a) Slope coefficients for each unit as a function of change in sound-evoked firing rate between the light-on and light-off conditions. Among the half of the units that were more weakly affected by interneuron activation (ChR2/Sst: n = 28, red; ChR2/Pvalb: n = 30, blue), Pvalb+ cell activation produced similar slopes to Sst+ cell activation (rank-sum p=0.66). Among the half of the units that were more strongly affected by interneuron activation (ChR2/Sst: n = 31; ChR2/Pvalb: n = 27), Pvalb+ cell activation produced similar slopes to Sst+ cell activation (rank-sum p=0.43). Darker squares represent units for which the slope was significant. (b) Normalized y-intercepts for each unit as a function of change in FR. Among the half of the units that were more weakly affected by interneuron activation (ChR2/Sst: n = 28, red; ChR2/Pvalb: n = 30, blue), Pvalb+ cell activation produced similar y-intercepts to Sst+ cell activation (rank-sum p=0.57). Among the half of the units that were more strongly affected by interneuron activation (ChR2/Sst: n = 31; ChR2/Pvalb: n = 27), Pvalb+ cell activation produced similar y-intercepts to Sst+ cell activation (rank-sum p=0.37). Darker squares represent units for which the y-intercept was significant.
Figure 5—figure supplement 5
Activation of Sst+ cells, compared to activation of Pvalb+ cells, produces similar linear effects, even after matching unit populations based on firing rate suppression ratios.
(a) Only units from both populations that have similar firing rate suppression ratios are kept for the analysis (ChR2/Sst: n = 52 units from 24 mice; ChR2/Pvalb: n = 52 units from 25 mice). (b) Distribution of the R2 values from the linear regression analysis from ratio-matched units with activation of Sst+ cells (red) and activation of Pvalb cells (blue). High median R2 values demonstrate that most ratio-matched units are fit well by a linear framework (ChR2/Sst: median R2 = 0.84; ChR2/Pvalb: median R2 = 0.80). (c) Fraction of units that showed each kind of linear transformation with activation of Sst+ cells (red) or activation of Pvalb+ cells (blue). These proportions are not significantly different between groups (ChR2/Sst: n = 52 units; ChR2/Pvalb: n = 52 units; Fisher’s exact test p=0.42). (d) Best-fit slope coefficients from ratio-matched units with activation of Sst+ cells (red) and activation of Pvalb+ cells (blue). Slopes were not significantly different between groups (rank-sum p=0.58). Dark/light squares indicate units for which slope was/was not significantly different from 0, respectively. Lines indicate population medians and lower/upper quartiles. (e) Normalized best-fit y-intercepts from ratio-matched units with activation of Sst+ cells (red) and activation of Pvalb+ cells (blue). Y-intercepts were not significantly different between groups (rank-sum, p=0.70). Dark/light squares indicate units for which y-intercept was/was not significantly different from 0, respectively. Lines indicate population medians and lower/upper quartiles.
Figure 5—figure supplement 6

Optogenetic activation of Sst+ and Pvalb+ interneurons increases stimulus-independent activity.
(a) Left: Waveforms (mean ± SD) from a putative Sst+ interneuron without (black) and with (red line, cyan outline) optogenetic activation. Middle: Peri-stimulus time histogram (mean ± SE) of the putative Sst+ interneuron without (black) and with (red line, cyan outline) optogenetic activation. Time zero indicates sound onset. Right: Frequency tuning curves (mean ± SE) without (black) and with (red line, cyan outline) optogenetic activation. Dotted lines indicate baseline firing rate without (black) and with (red) optogenetic activation. (b,c) Same as (a) for two other putative interneurons. In (c), note that the putative Sst+ interneuron barely increases firing to the stimulus without optogenetic activation; but with optogenetic activation, its firing rate is often above 60 Hz. (d–f) Same as (a–c) for three putative Pvalb+ interneurons.
Figure 6
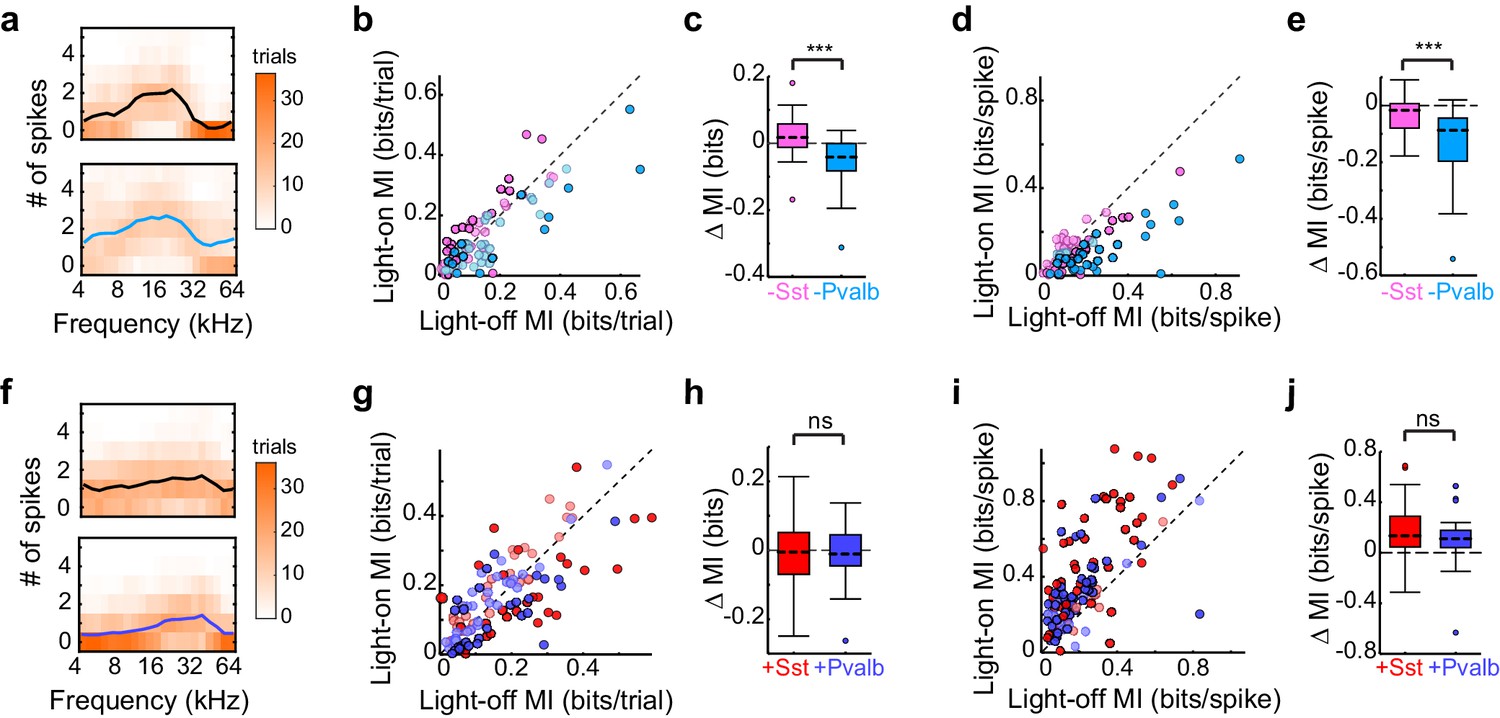
Optogenetically inactivating Sst+ versus Pvalb+ cells produces different effects on mutual information (MI), whereas activating these interneurons produces similar effects on MI.
(a) Responses of a representative unit recorded in an Arch/Pvalb mouse to tones of different frequencies on trials without (top) and with (bottom) inactivation of Pvalb+ cells (orange heat map: trial counts; line: mean spikes-per-trial). In this unit, information-per-trial between the stimulus and response decreased when Pvalb+ cells were inactivated. (b) Information-per-trial with versus without inactivation of Sst+ cells (pink) or Pvalb+ cells (light blue). Darker circles represent units for which the change in information-per-trial was significant (Arch/Sst: n = 44 units from 17 mice; Arch/Pvalb: n = 41 units from 24 mice). (c) Box-and-whisker plots of the change in information-per-trial with inactivation of Sst+ cells or Pvalb+ cells. Inactivating Sst+ cells significantly increased information-per-trial (sign-rank p=0.022), inactivating Pvalb+ cells significantly decreased information-per-trial (sign-rank p=1.3 × 10⁻⁴), and these effects were significantly different from each other (rank-sum p=7.1 × 10⁻⁶). (d) As (b) but for information-per-spike, to account for possible differences in the number of spikes available to represent information. (e) As (c) but for information-per-spike. Inactivating Sst+ cells (sign-rank p=3.5 × 10⁻³) and inactivating Pvalb+ cells (sign-rank p=4.1 × 10⁻⁸) both significantly decreased information-per-spike, but these effects were significantly different from each other (rank-sum p=1.2 × 10⁻⁵), indicating that differences in information-per-trial were not due to differences in the number of spikes available to represent information. (f) As (a) but from a unit recorded in a ChR2/Pvalb mouse. In this unit, information-per-trial between the stimulus and response increased when Pvalb+ cells were activated. (g) Information-per-trial with versus without activation of Sst+ cells (red) or Pvalb+ cells (blue). Darker circles represent units for which the change in information-per-trial was significant (ChR2/Sst: n = 59 units from 25 mice; ChR2/Pvalb: n = 57 units from 27 mice). (h) Box-and-whisker plots of the change in information-per-trial with activation of Sst+ cells (red) or Pvalb+ cells (blue). Neither activation of Sst+ cells (sign-rank p=0.53) nor activation of Pvalb+ cells (sign-rank p=0.63) changed information-per-trial, and their activation did not produce significantly different effects on information-per-trial (rank-sum p=0.85). (i) As (g) but for information-per-spike. (j) As (h) but for information-per-spike. Activating Sst+ cells (sign-rank p=3.9 × 10⁻⁹) and activating Pvalb+ cells (sign-rank p =1.5 × 10⁻⁸) both significantly increased the information-per-spike, but these effects were not significantly different from each other (rank-sum p=0.20).
Figure 7
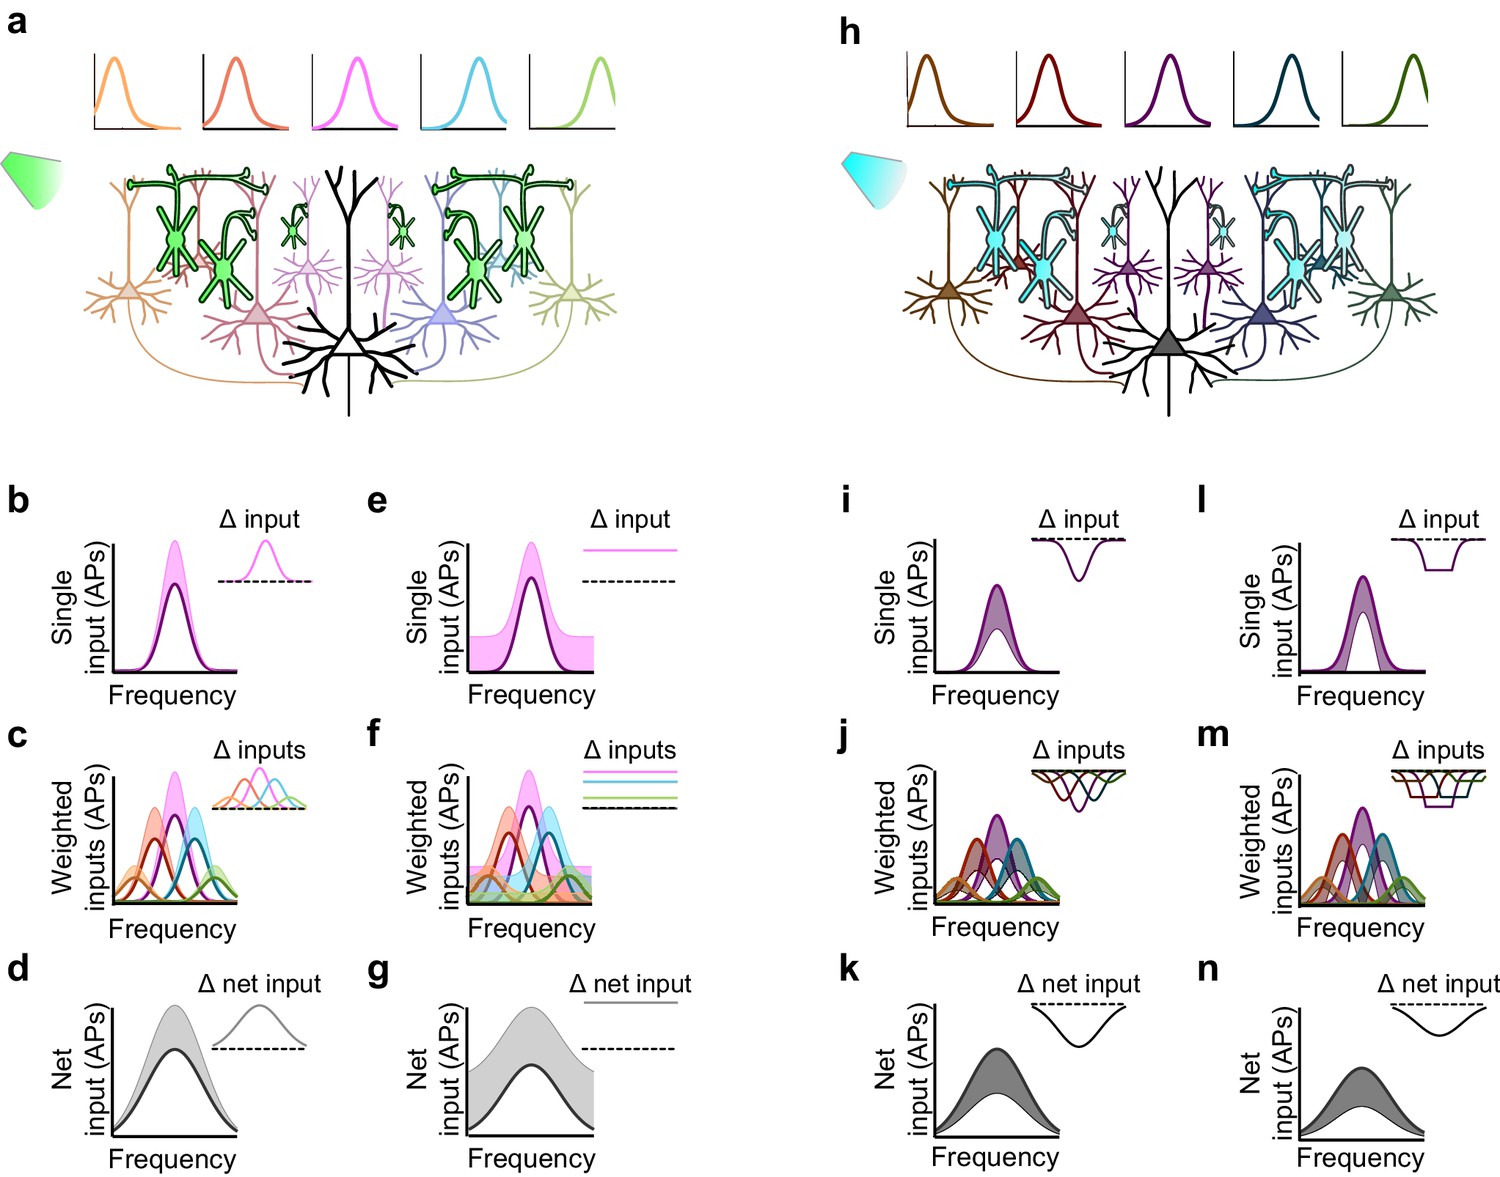
Inactivation versus activation of interneurons can have asymmetrical effects on response gain in a simple network model.
(a) A population of neurons tuned to different frequencies (light colored cells) provides input to a downstream neuron (large black neuron) in a weighted fashion, such that neurons with more similar tuning to that of the downstream neuron are more strongly connected to it (indicated by color and axon thickness). Interneurons that inhibit these input neurons (green cells) are inactivated, which increases the activity of the input neurons. Number of input neurons: 101; maximum connection weight: 0.2; connection weight falloff: Gaussian with 2SD; input neuron threshold: 0. (b) The frequency tuning curve (FTC) of a single neuron in the input layer (light-off: purple curve) is multiplicatively increased by interneuron inactivation (light-on: light purple shading). Inset shows the change in firing. Scaling factor: 1.5. (c) As (b), but with many weighted inputs. (d) The net input to the downstream neuron (i.e., the sum of the weighted inputs) without (black curve) and with (light gray shading) multiplicative scaling of the inputs shows multiplicative scaling. Inset shows the change in net input to the downstream neuron. (e–g) As (b–d), but demonstrating additive increases in the FTC of a single input (e), many weighted inputs (f), and the net input to the downstream neuron (g). Note that when inactivating interneurons, the linear effects of multiplication and addition at the single-input level are preserved in the net input of the downstream neuron. Shifting factor: 0.15. (h) As (a), but with activation of interneurons (blue cells), which suppresses the activity of the input neurons (dark colored cells). (i–k) As (b–d), but demonstrating the effects of division in a single input (i), many weighted inputs (j), and the net input to the downstream neuron (k). Scaling factor: 0.5. (l–n) As (b–d), but demonstrating the effects of subtraction in the FTC of a single input (l), many weighted inputs (m), and the net input to the downstream neuron (n). Note that the change in net input in the downstream neuron caused by subtraction of inputs appears similar to the change caused by division of inputs. This is due to responses of single input neurons that are suppressed below threshold with subtractive inhibition, causing smaller changes in firing at the edges of the tuning curve than at the center. Shifting factor: -0.15.
Figure 8
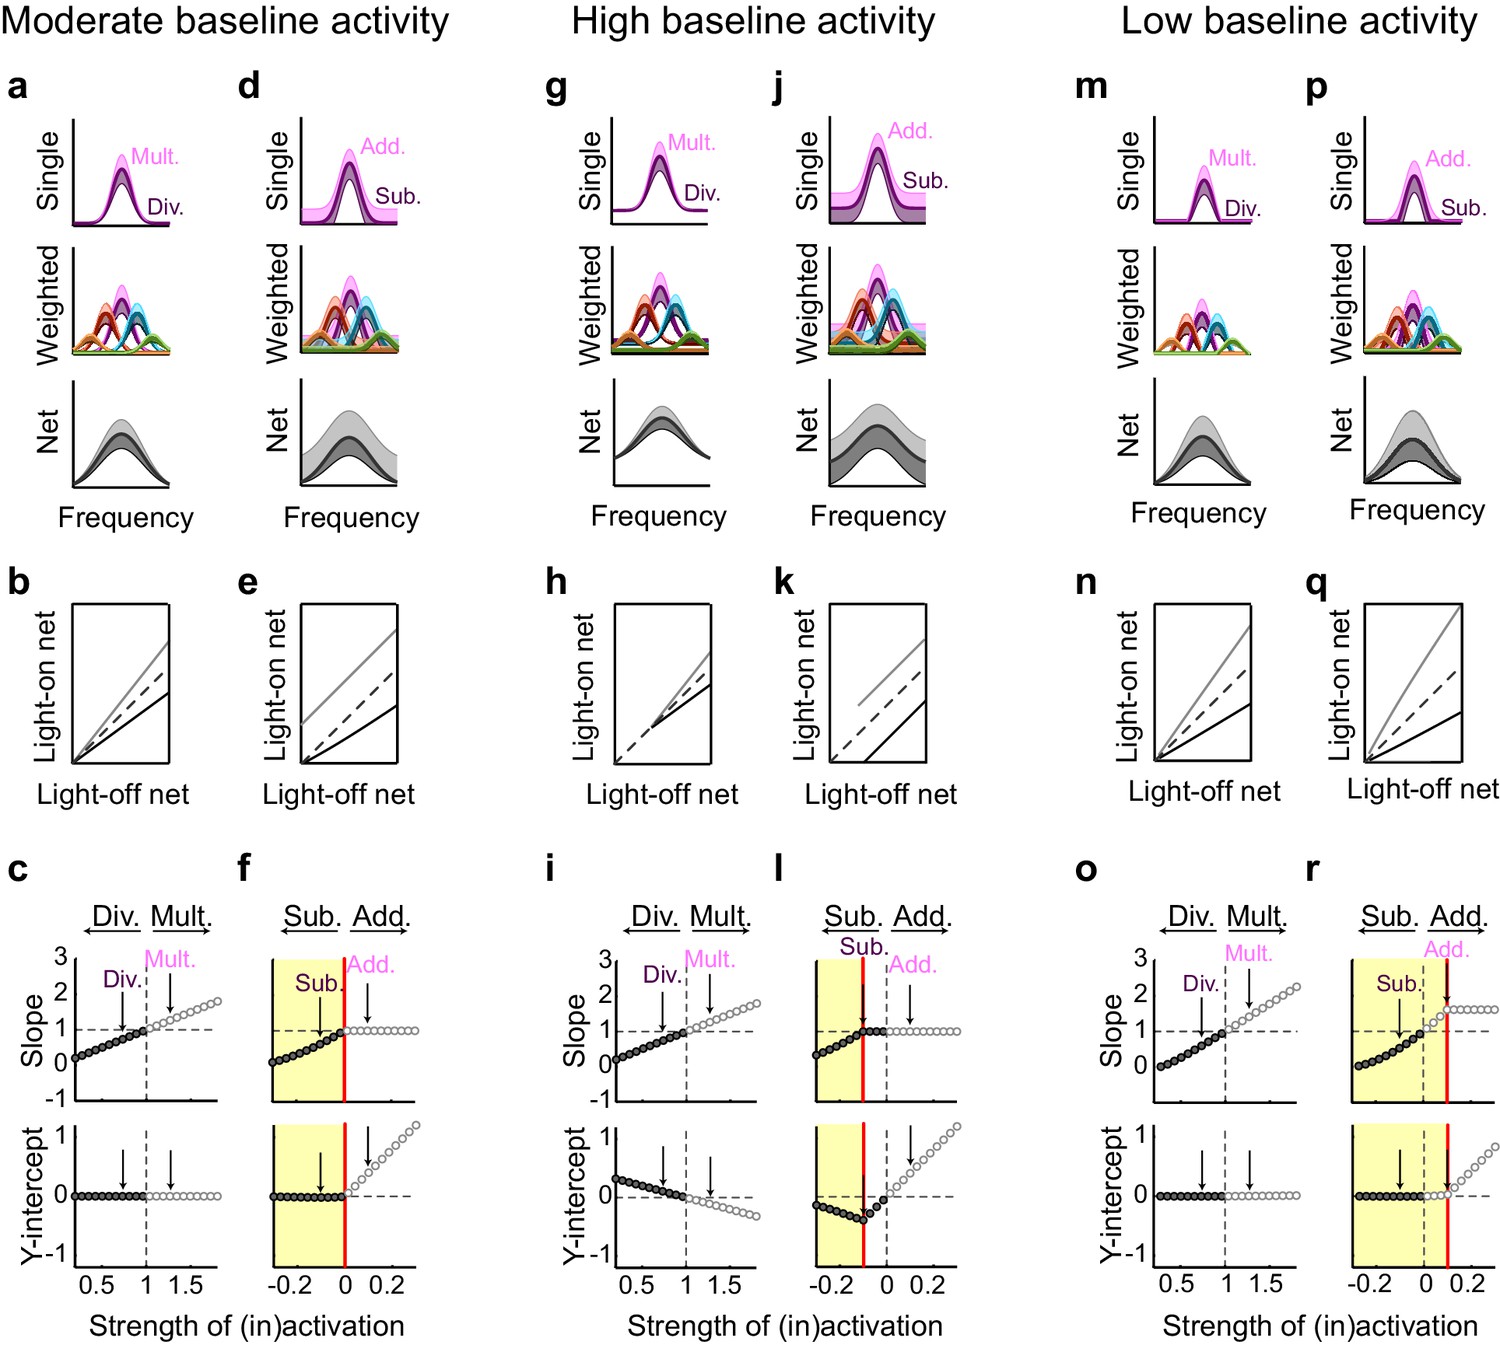
Small changes in key parameters determine whether interneuron manipulations will produce consistent or paradoxical conclusions regarding interneuron function.
(a) Top row: In a network with moderate baseline activity (threshold = 0), the frequency tuning curve (FTC) of a single input (light-off: medium purple curve) undergoes multiplication (light-purple shading) or division (dark-purple shading). Middle row: The FTCs of many inputs (light-off: medium colored curves), weighted by a Gaussian connectivity function, undergo multiplication (light colored shading) or division (dark colored shading). Bottom row: These weighted inputs sum to produce the downstream neuron’s net input. (b) The net input to the downstream neuron without light versus with light (multiplication: light gray line; division: black line). The best-fit slopes and y-intercepts of these measurements represent the magnitudes of the multiplicative/divisive and additive/subtractive effects, respectively, on the downstream neuron’s net input. (c) The best-fit slopes and y-intercepts from regressions on the measurements in (b) as a function of the strength of (in)activation (i.e., the magnitudes of the linear effects on the downstream neuron’s net input as a function of the magnitudes of the linear effects on the input neurons’ FTCs). Arrows indicate the strengths of interneuron (in)activation represented in (a). Under these conditions, interneuron inactivation and activation result in multiplication and division, respectively, of the downstream neuron’s net input. (d–f) Same as (a–c), except the FTCs of the inputs undergo either addition (light-purple shading) or subtraction (dark-purple shading). Yellow highlighted area in (f) indicates the range of interneuron manipulation that interacts with threshold nonlinearities. Interneuron activation interacts with threshold nonlinearities to transform subtraction of the inputs’ FTCs into division of the downstream neuron’s net input, resulting in asymmetric results between activation and inactivation. (g–l) Same as (a–f), after changing one model parameter: increasing the baseline activity level of the model neurons (threshold = -0.1). Increased baseline activity levels require stronger interneuron activation to cause subtraction of the inputs to appear division-like in the downstream neuron’s net input. This increases the range over which activation/inactivation will produce internally consistent conclusions. (m–r) Same as (a–f), after changing one model parameter: decreasing the baseline activity level of the model neurons (threshold = 0.1). The weaker responses in (m,p) now lie below spiking threshold; this decreases the strength of interneuron activation required for subtraction of the inputs to appear division-like in the downstream neuron’s net input (p–r). This decreases the range over which activation/inactivation will produce consistent conclusions.
Download links
A two-part list of links to download the article, or parts of the article, in various formats.
Downloads (link to download the article as PDF)
Open citations (links to open the citations from this article in various online reference manager services)
Cite this article (links to download the citations from this article in formats compatible with various reference manager tools)
Asymmetric effects of activating and inactivating cortical interneurons
eLife 5:e18383.
https://doi.org/10.7554/eLife.18383


