Similar GABAA receptor subunit composition in somatic and axon initial segment synapses of hippocampal pyramidal cells
- Institute of Experimental Medicine, Hungarian Academy of Sciences, Hungary
Figures
Figure 1
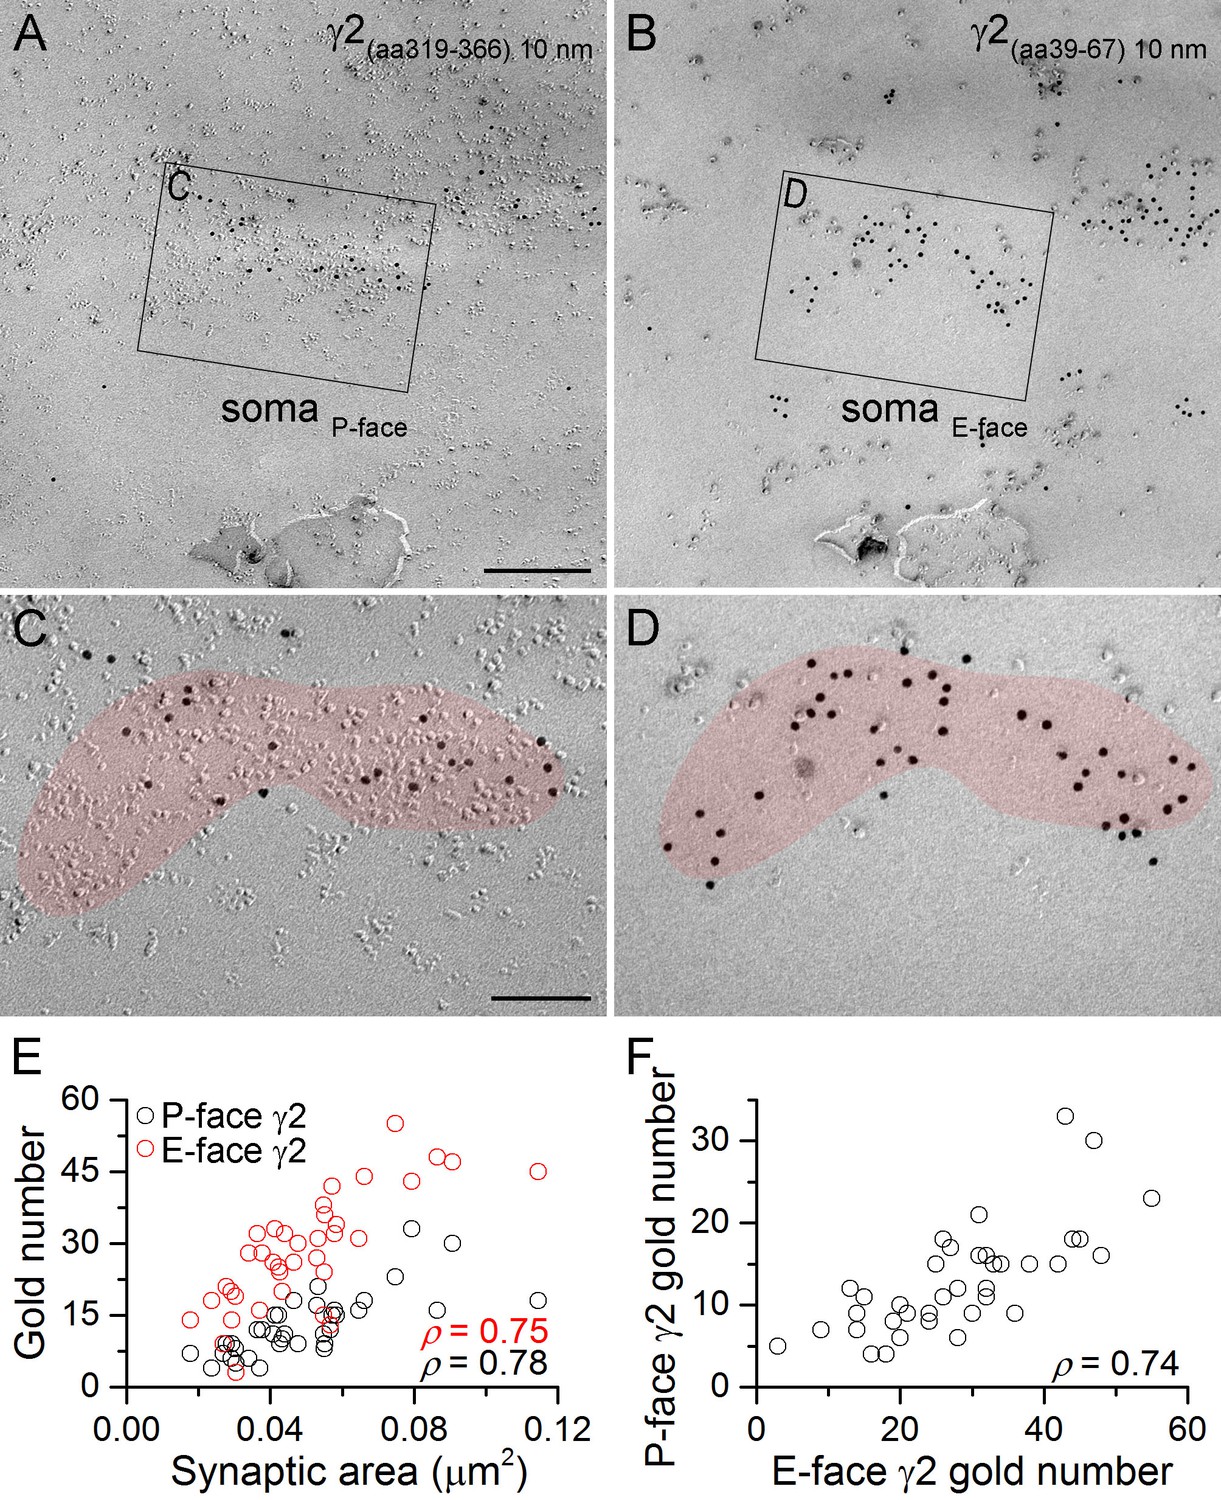
GABAA receptors fracture to both sides of the plasma membrane.
(A, B) Face-matched mirror replica image of a CA1 pyramidal cell (PC) soma containing two GABAergic synapses identified on the P-face by an antibody directed against an intracellular epitope (A) and on the E-face by an antibody recognizing an extracellular epitope (B) of the γ2 subunit. (C, D) High magnification images of the boxed areas in (A) and (B). (E) The number of gold particles labeling the γ2 subunit scales with the synaptic area (Spearman correlation, ρ = 0.78 for the P-face γ2 and ρ = 0.75 for the E-face γ2, p<0.001 for both antibodies, n = 37 synapses, one rat). (F) The number of gold particles labeling the γ2 subunit on the P-face shows a strong positive correlation with the number of gold particles labeling the γ2 subunit on the E-face (ρ=0.74, p<0.001). Scale bars: (A, B) 250 nm; (C, D) 100 nm.
Figure 2
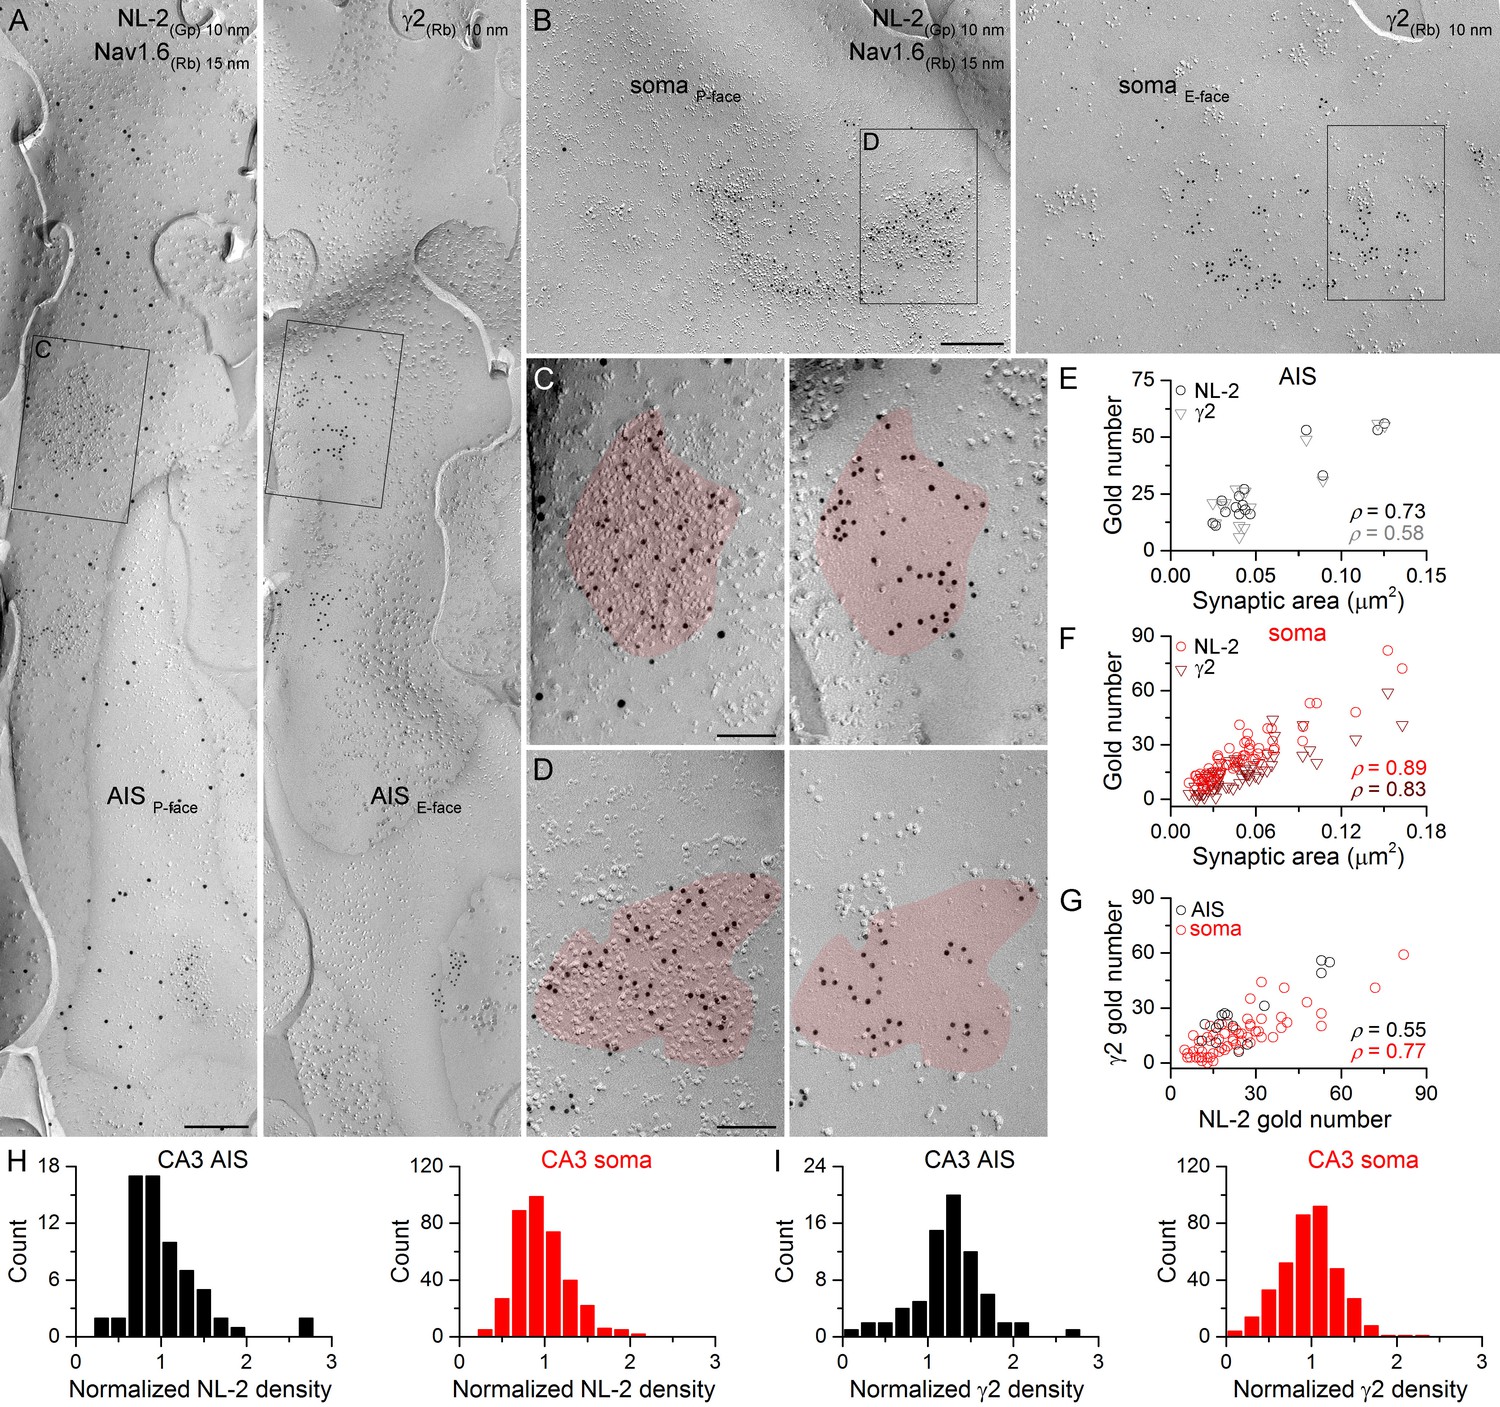
Identification of axon initial segment (AIS) and somatic GABAergic synapses in CA3 PCs using replica immunolabeling.
(A) Mirror replica image of an AIS identified by immungold labeling for the Nav1.6 subunit (15 nm gold) on the P-face. Immunogold particles labeling neuroligin-2 (NL-2; 10 nm gold) are accumulated over dense intramembrane particle clusters characteristic for GABAergic synapses on the P-face of the AIS. The complementary E-face of the same membrane fragment contains clusters of gold particles labeling the γ2 subunit (10 nm gold). (B) A face-matched replica pair showing a fragment of a somatic plasma membrane containing two GABAergic synapses labeled for NL-2 on the P-face and the γ2 subunit on the E-face. (C, D) High magnification views of the boxed areas in (A) and (B). (E, F) The number of gold particles labeling for NL-2 and the γ2 subunit shows positive correlation with the synaptic area of AIS (E; Spearman correlation, ρ = 0.73, p=0.002 for NL-2 and ρ = 0.58,p=0.024 for γ2, n = 15 synapses, one rat) and somatic (F; ρ = 0.89 for NL-2 and ρ = 0.83 for γ2, p<0.001, n = 65 synapses, one rat) synapses of CA3 PCs. (G) Correlation between immunogold labeling for NL-2 and the γ2 subunit in AIS and somatic synapses (AIS: ρ = 0.55, p=0.035; soma: ρ=0.77, p<0.001, one rat). (H, I) Distributions of AIS (black) and somatic (red) synapses based on their normalized NL-2 (H; n = 65 for AIS and n = 369 for somatic synapses, data from five rats) and γ2 subunit (I; n = 72 for AIS and n = 367 for somatic synapses, data from three rats) densities. Scale bars: (A, B) 250 nm; (C, D) 100 nm.
-
Figure 2—source data 1
Data containing normalized NL-2 and γ2 subunit densities in CA3 AIS and somatic synapses are shown.
- https://doi.org/10.7554/eLife.18426.004
Figure 3
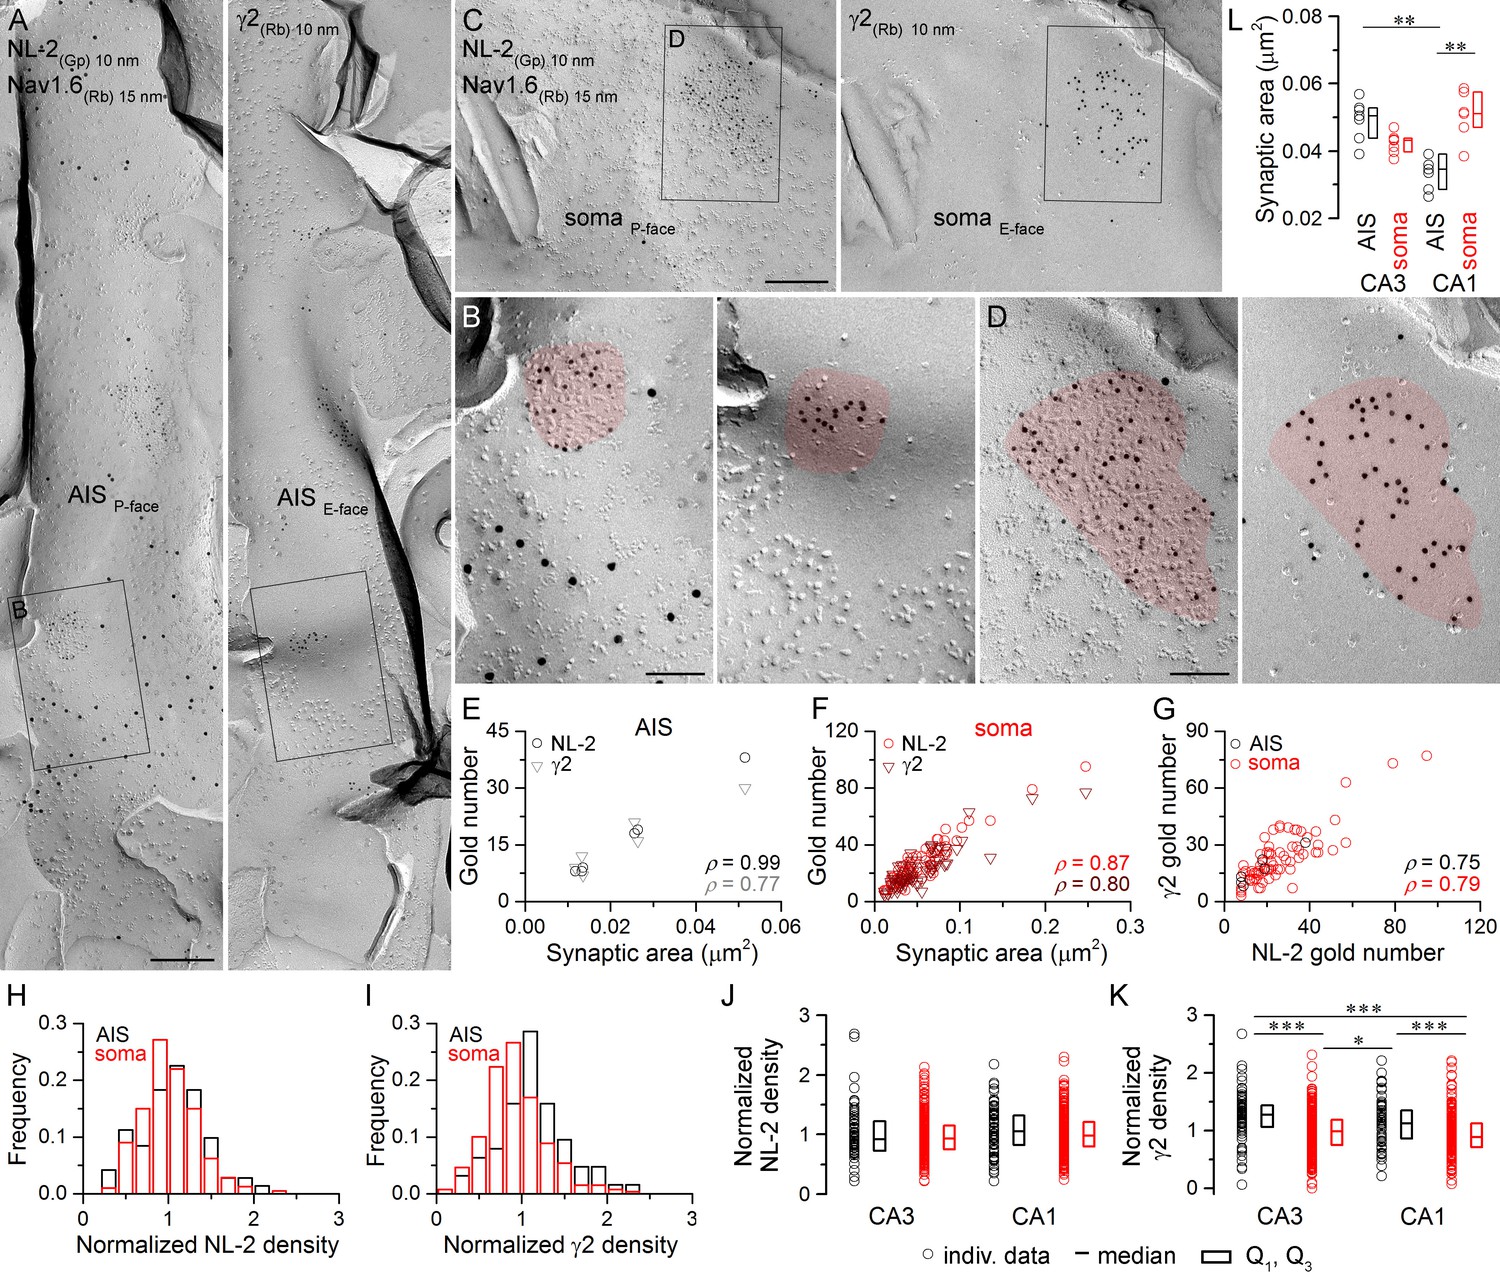
Identification of AIS and somatic GABAergic synapses in CA1 PCs with SDS-FRL.
(A) Mirror replica image of an AIS double-labeled for Nav1.6 (15 nm gold) and NL-2 (10 nm gold) on the P-face, and the γ2 subunit (10 nm gold) on the complementary E-face of the same fragment of the plasma membrane. (B) High magnification view of the boxed areas shown in (A). (C) Mirror replica images showing a fragment of a somatic plasma membrane containing a GABAergic synapse labeled for NL-2 (10 nm gold) on the P-face and the γ2 subunit on the E-face (10 nm gold). (D) High magnification views of the boxed areas in (C). (E, F) The number of gold particles labeling for NL-2 and the γ2 subunit scales with synaptic area of AIS (E; Spearman correlation, ρ = 0.99, p<0.001 for NL-2 and ρ = 0.77,p=0.072 for γ2, n = 6 synapses, one rat) and somatic (F; ρ = 0.87 for NL-2 and ρ = 0.80 for γ2, p<0.001, n = 74 synapses, one rat) synapses of CA1 PCs. (G) Correlation between gold particle number for NL-2 and the γ2 subunit in AIS and somatic synapses (ρ=0.75, p=0.084 for AIS synapses and ρ = 0.79, p<0.001 for somatic synapses, respectively, one rat). (H, I) Distributions of normalized NL-2 (H; n = 71 AIS and n = 387 somatic synapses, data pooled from five rats) and γ2 subunit densities (I; n = 63 AIS and n = 259 somatic synapses, data pooled from three rats) in AIS (black) and somatic synapses (red). (J) Normalized density of NL-2 was not significantly different in AIS and somatic synapses in the CA3 and CA1 regions (Kruskal-Wallis test, p=0.064; pooled individual synaptic density values from five rats). (K) Normalized density of the γ2 subunit was significantly higher in AIS compared to somatic synapses in both CA3 and CA1 regions (Kruskal-Wallis test, p<0.001; Multiple comparisons of mean ranks, p<0.001 for both CA3 and CA1 regions; pooled individual synaptic density values from three rats). In addition, the γ2 subunit density was significantly higher in CA3 and CA1 AIS synapses compared to CA1 and CA3 somatic synapses (p<0.001 for CA3 AIS vs CA1 soma and p=0.029 for CA1 AIS vs CA3 soma). Plots show individual data (circles), medians (horizontal line) and lower and upper quartiles (Q1, Q3; boxes). (L) The area of AIS synapses was significantly smaller in the CA1 compared to the CA3 region (Kruskal-Wallis test, p<0.001; Multiple comparisons of mean ranks, p=0.005; n = 7 rats), and somatic synapses were significantly larger than AIS synapses in the CA1 region (p= 0.002). Open circles denote median synaptic areas from each rat, and the medians (horizontal line) and lower and upper quartiles (Q1, Q3; boxes) of animals are shown. Scale bars: (A, C) 250 nm; (B, D) 100 nm.
-
Figure 3—source data 1
Data containing normalized NL-2 and γ2 subunit densities in CA1 AIS and somatic synapses, and summary data for synaptic area measurements are shown.
- https://doi.org/10.7554/eLife.18426.006
Figure 4
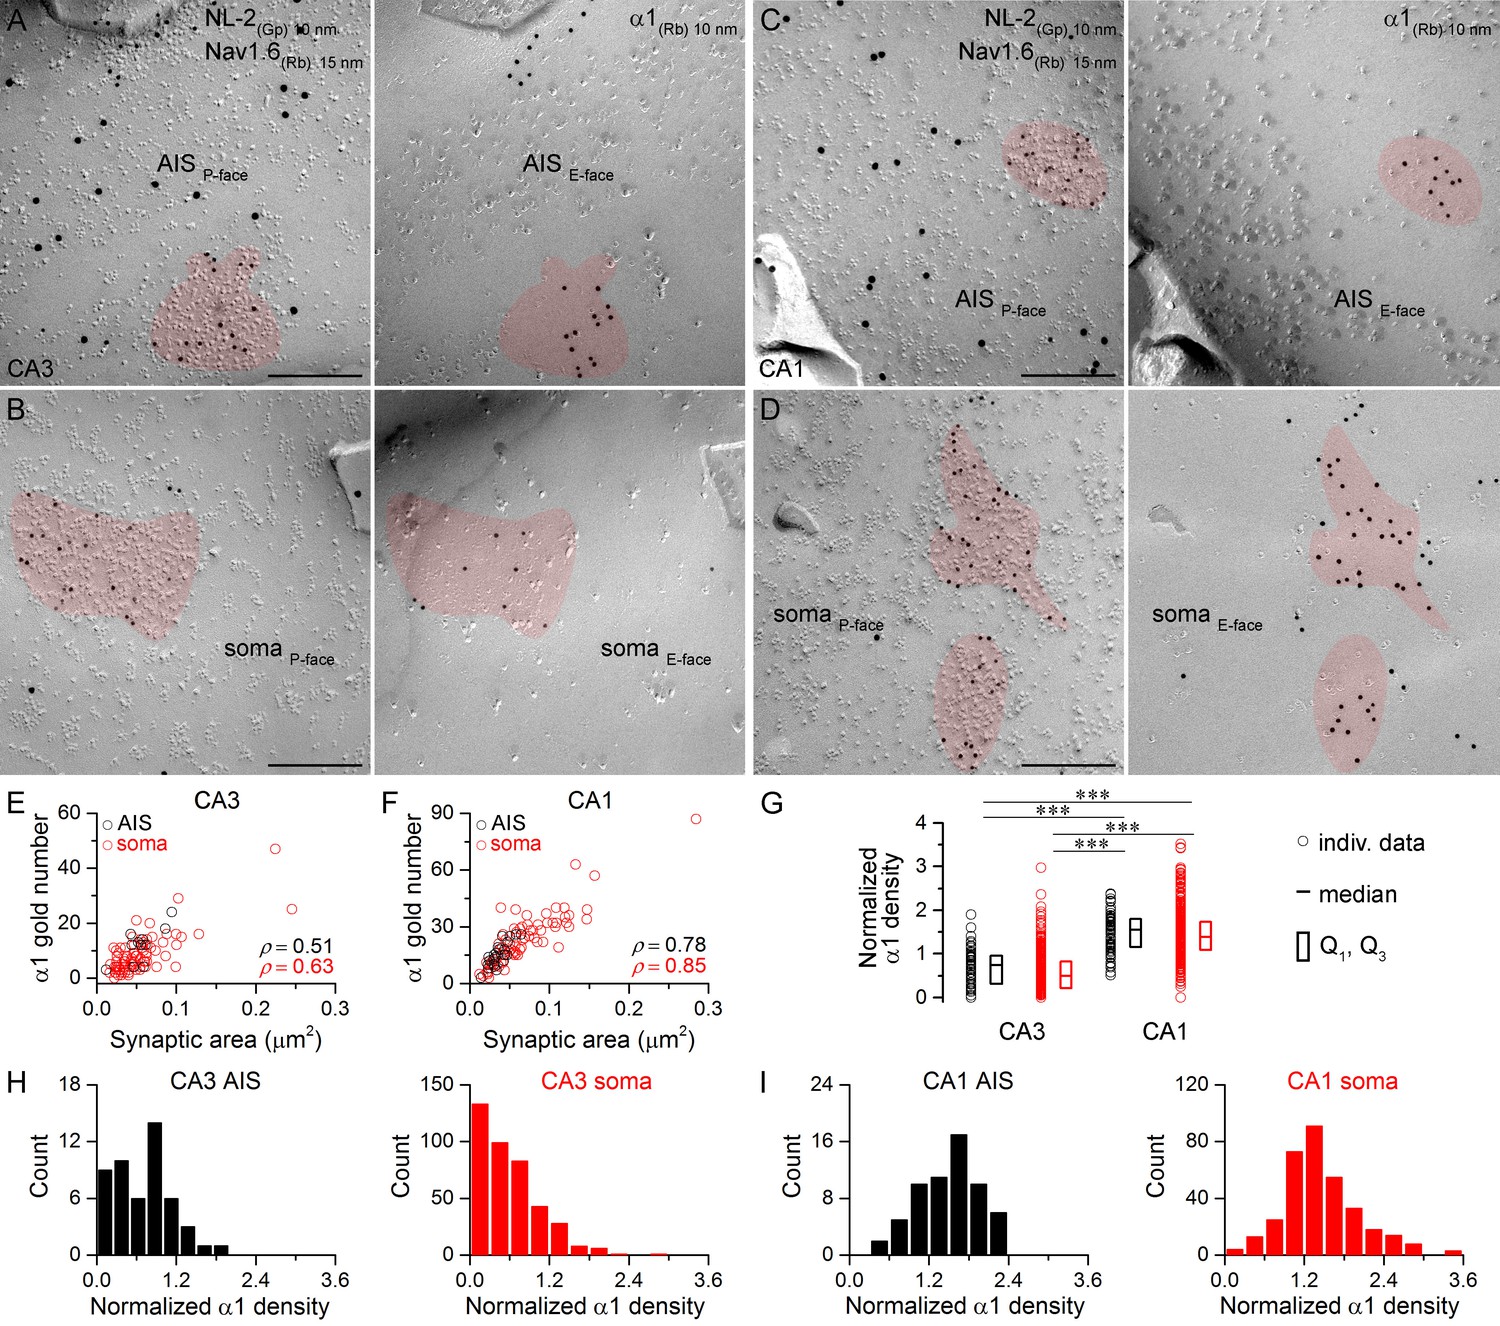
Hippocampal AIS and somatic synapses form unimodal distributions based on their α1 subunit densities.
(A–D) High magnification images of double-replica pairs showing clusters of gold particles for the α1 subunit (10 nm gold) on the E-face of AIS (A, C) and somatic (B, D) synapses, which were identified on the complementary P-face by immunoreactivity for NL-2 (10 nm gold). The AIS was identified by immunolabeling for the Nav1.6 subunit (15 nm gold) on the P-face. (E, F) Immunogold particle labeling for the α1 subunit scales with the synaptic area in AIS and somatic synapses of CA3 (E; Spearman correlation, AIS: ρ = 0.51, p=0.112, n = 11; soma: ρ = 0.63, p<0.001, n = 84, one rat) and CA1 (F; AIS: ρ = 0.78, p<0.001, n = 23; soma: ρ = 0.85, p<0.001, n = 76, one rat) PCs. (G) The α1 subunit densities are significantly lower in CA3 AIS and somatic synapses compared to those in the CA1 region (Kruskal-Wallis test, p<0.001; Multiple comparisons of mean ranks, p<0.001 for both AIS and somatic synapses; pooled individual synaptic density values from four rats). Plots show individual data (circles), medians (horizontal line) and lower and upper quartiles (Q1, Q3; boxes). (H, I) Distributions of AIS and somatic synapses in the CA3 (H; AIS: n = 50; soma: n = 402 synapses) and CA1 regions (I; AIS: n = 61; soma: n = 337 synapses) based on their normalized α1 subunit densities. Scale bars: (A–D) 200 nm.
-
Figure 4—source data 1
Data containing normalized α1 subunit densities in CA3 and CA1 AIS and somatic synapses are shown.
- https://doi.org/10.7554/eLife.18426.008
Figure 5
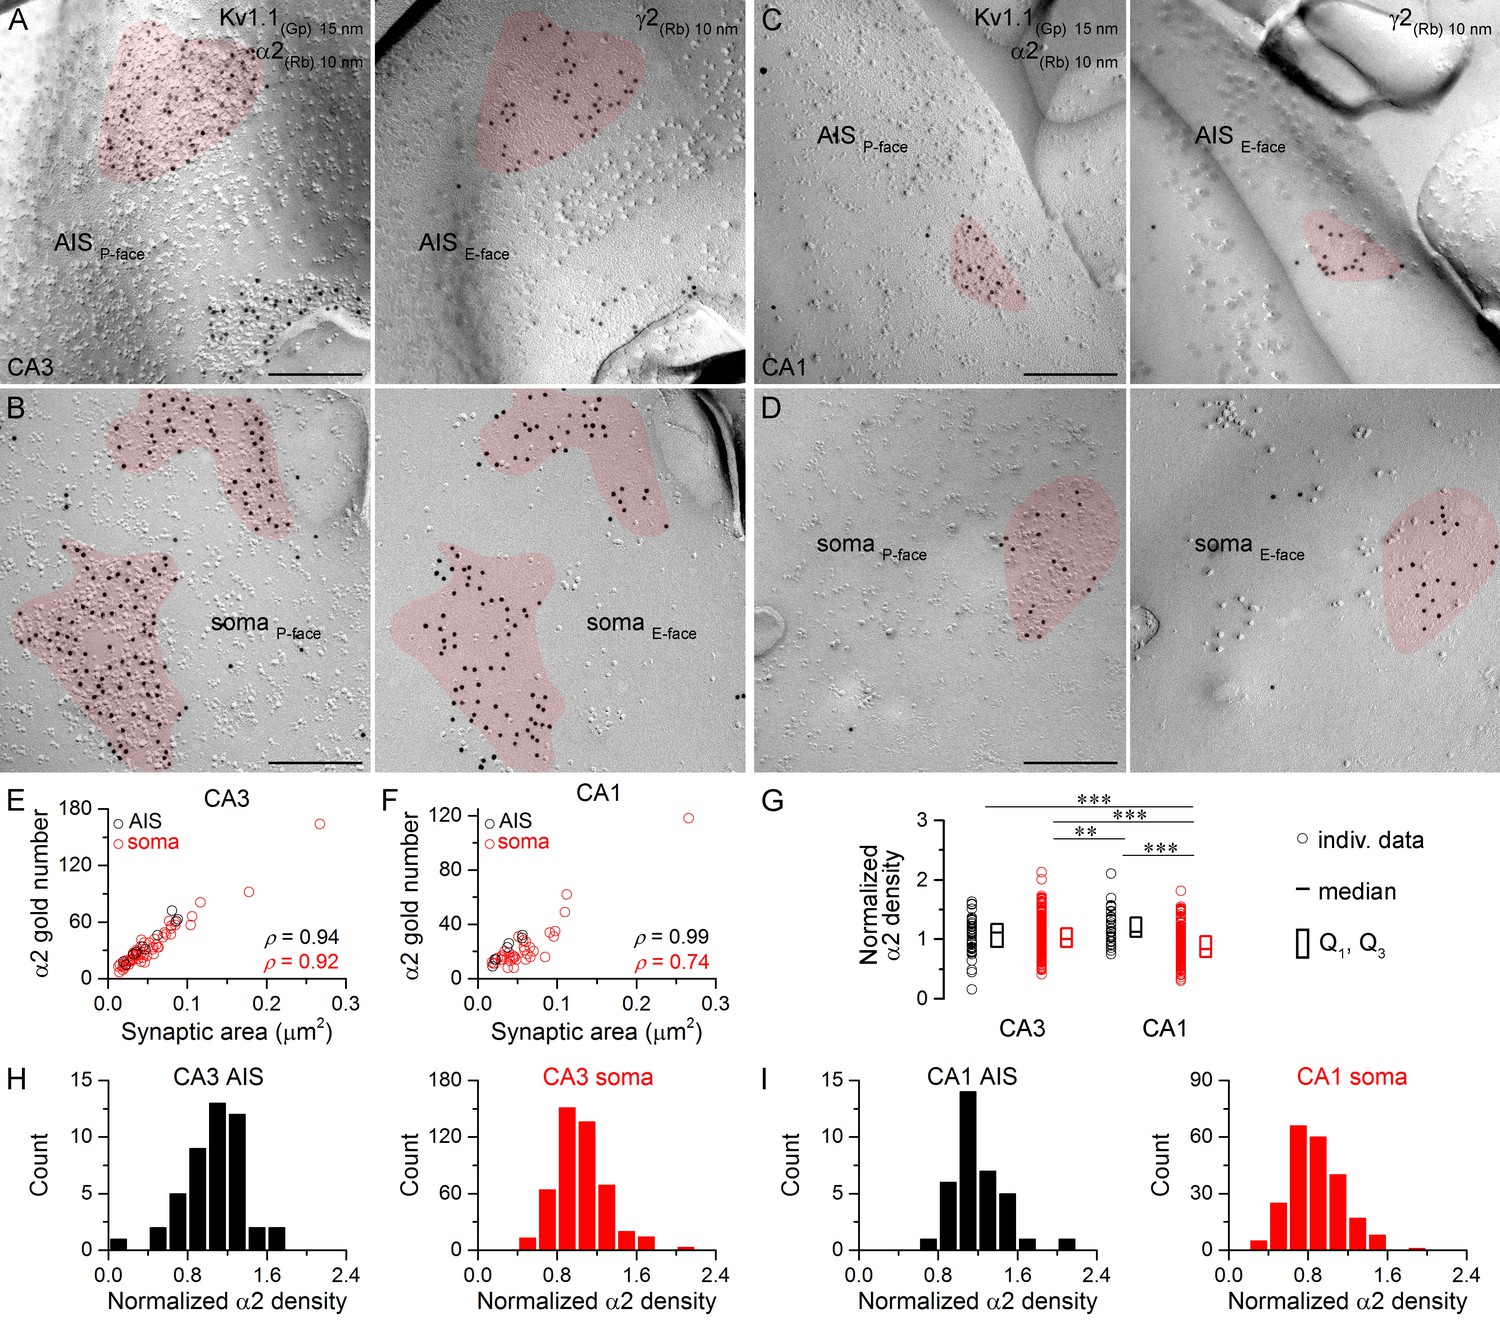
Hippocampal AIS and somatic synapses form unimodal distributions based on their α2 subunit densities.
(A–D) High magnification images of double-replica pairs show the clustering of gold particles for the α2 subunit (10 nm gold) in AIS (A, C) and somatic (B, D) synapses on the P-face, identified on the complementary E-faces by the presence of gold particles for the γ2 subunit (10 nm gold). (E, F) The number of gold particles labeling the α2 subunit shows tight positive correlation with the synaptic area in AIS and somata of CA3 (E; Spearman correlation, AIS: ρ = 0.94, n = 10; soma: ρ = 0.92, n = 60; p<0.001; one rat) and CA1 PCs (F; AIS: ρ = 0.99, n = 7; soma: ρ = 0.74, n = 36; p<0.001; one rat). (G) Normalized α2 subunit densities are significantly lower in CA1 somatic synapses compared to CA1 AIS, CA3 somatic and CA3 AIS synapses (Kruskal-Wallis test, p<0.001; Multiple comparisons of mean ranks p<0.001 for all compartments; pooled individual synaptic density values from four rats). Furthermore, the α2 subunit density is significantly lower in CA3 somatic synapses than in CA1 AIS synapses (p<0.01). Plots show individual data (circles), medians (horizontal line) and lower and upper quartiles (Q1, Q3; boxes). (H, I) Distributions of AIS and somatic synapses in the CA3 (H; AIS: n = 46, soma: n = 470 synapses) and CA1 regions (I; AIS: n = 35, soma: n = 222 synapses) according to their normalized α2 subunit densities. Scale bars: (A–D) 200 nm.
-
Figure 5—source data 1
Data containing normalized α2 subunit densities in CA3 and CA1 AIS and somatic synapses are shown.
- https://doi.org/10.7554/eLife.18426.010
Figure 6
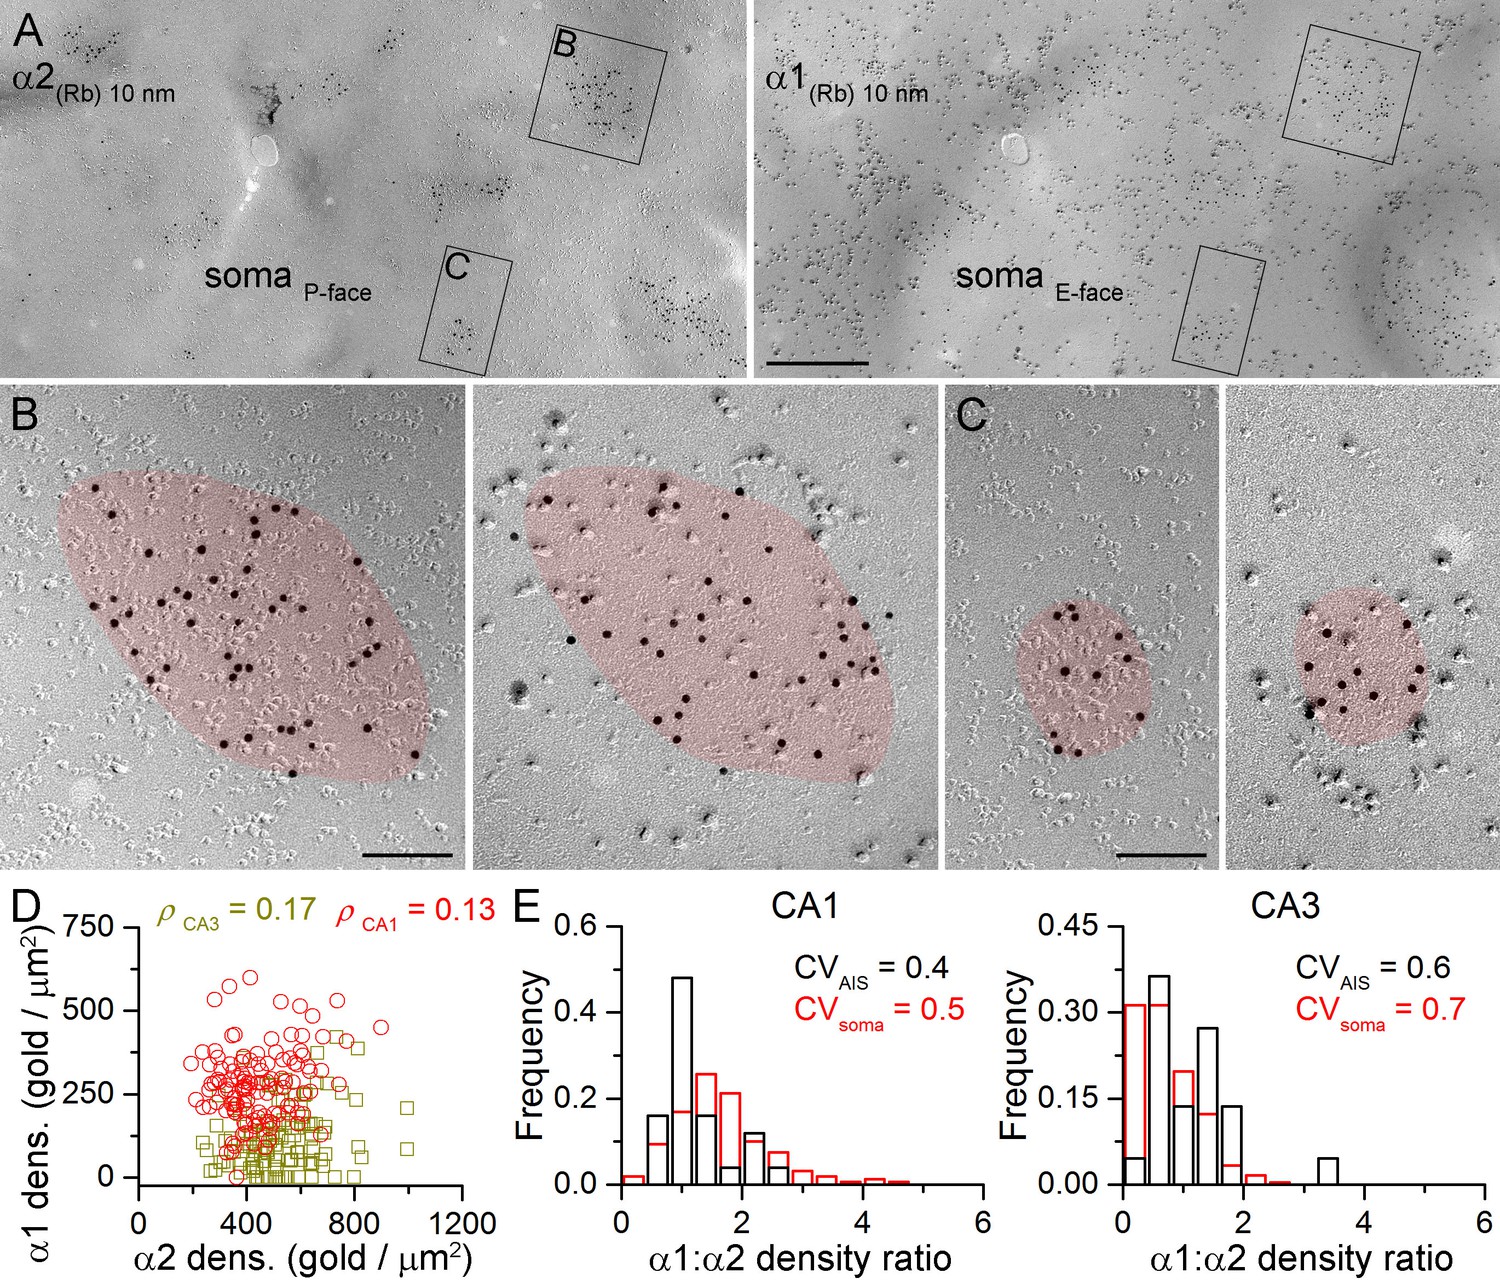
Face-matched mirror replica labeling for the α1 and α2 subunits in PC somatic synapses.
(A) Low-magnification images of a double-replica pair depict a fragment of a CA1 PC soma, containing many GABAergic synapses labeled for the α2 subunit (10 nm gold) on the P-face and for the α1 subunit (10 nm gold) on the complementary E-face. (B, C) Two synapses illustrated in (A) are shown at a higher magnification. (D) No significant correlation was found between the α1 and α2 subunit densities of individual CA1 (red circles; Spearman correlation, ρ = 0.13, p=0.172, n = 119 synapses, one rat) and CA3 (olive squares; ρ = 0.17, p=0.075, n = 117 synapses, one rat) PC somatic synapses. (E) Distributions of α1:α2 density ratios in AIS and somatic synapses are shown for CA1 and CA3 PCs. Note the similar variability in the density ratio between somatic (red) and AIS (black) synapses (AIS: CV = 0.4, n = 25; soma: CV = 0.5; n = 160 in the CA1 region, and AIS: CV = 0.6, n = 22; soma: 0.7; n = 243 in the CA3 region; data pooled from two rats). Scale bars: (A) 500 nm; (B, C) 100 nm.
-
Figure 6—source data 1
Summary data for α1:α2 density ratio measurements are shown.
- https://doi.org/10.7554/eLife.18426.012
Figure 7
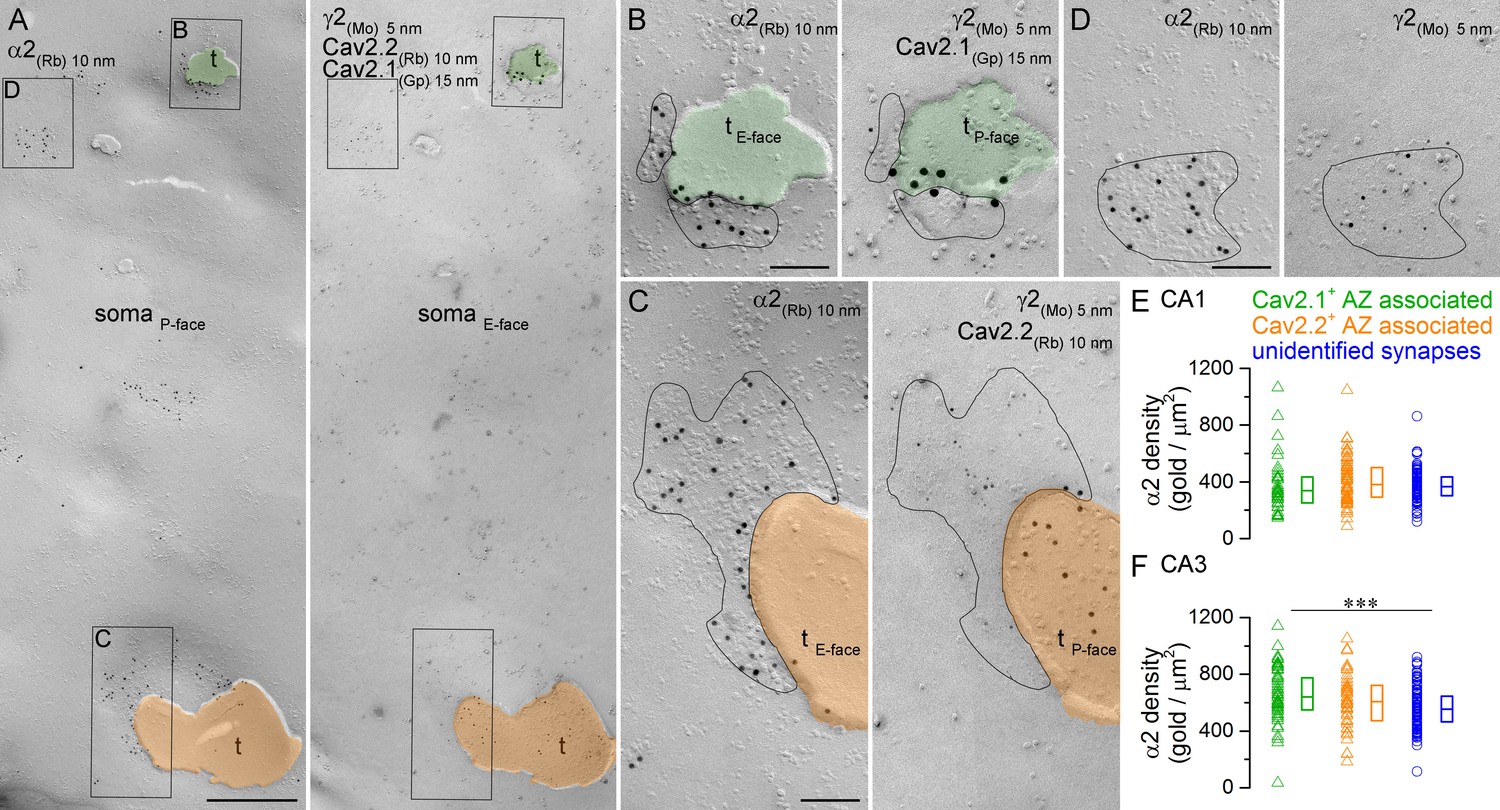
Comparison of immunogold labeling for the α2 subunit in synapses established by PV+ or CCK+ axon terminals on hippocampal PC somata.
(A) Mirror replica images of a fragment of a PC somatic plasma membrane are shown at a low magnification. The P-face is immunolabeled for the α2 subunit (10 nm gold). On the E-face of the same plasma membrane, immunogold labeling for Cav2.1 (15 nm gold) and Cav2.2 (10 nm gold) was used to identify putative PV+ (green overlay) and CCK+ axon terminals (orange overlay), respectively. Additionally, immunolabeling for the γ2 subunit (5 nm) was used to visualize GABAergic synapses. Axon terminals (t) were identified as P-face membrane fragments attached to the E-face of the somatic plasma membrane. (B) High magnification view of the synapse established by a Cav2.1+ axon terminal shown in (A). (C) High magnification image of the synapse established by a Cav2.2+ axon terminal. (D) High magnification mirror replica image of a complete postsynaptic density of an unidentified synapse also shown in (A). (E) α2 subunit densities are similar in Cav2.1+ and Cav2.2+ active zone-associated synapses, and in unidentified somatic synapses of CA1 PCs (Kruskal-Wallis test, p=0.252; Cav2.1+: n = 35; Cav2.2+: n = 65; unidentified synapses: n = 103; data pooled from two rats). (F) Gold particle densities for the α2 subunit in Cav2.1+ and Cav2.2+ active zone-associated synapses, and in unidentified somatic synapses of CA3 PCs (Kruskal-Wallis test, p=0.002; Multiple comparisons of mean ranks between Cav2.1+ and Cav2.2+ synapses, p=0.579; Cav2.1+ and unidentified synapses, p=0.001; Cav2.2+ and unidentified synapses p=0.278; Cav2.1+: n = 54; Cav2.2+: n = 41; unidentified synapses: n = 129; data pooled from two rats). Individual data derived from partial synapse quantifications are shown as open triangles, and open circles denote data from complete synapse measurements. Medians (horizontal bars) with lower and upper quartiles (boxes) are shown for α2 densities in the three synapse type. Scale bars: (A) 500 nm; (B–D) 100 nm.
Figure 8
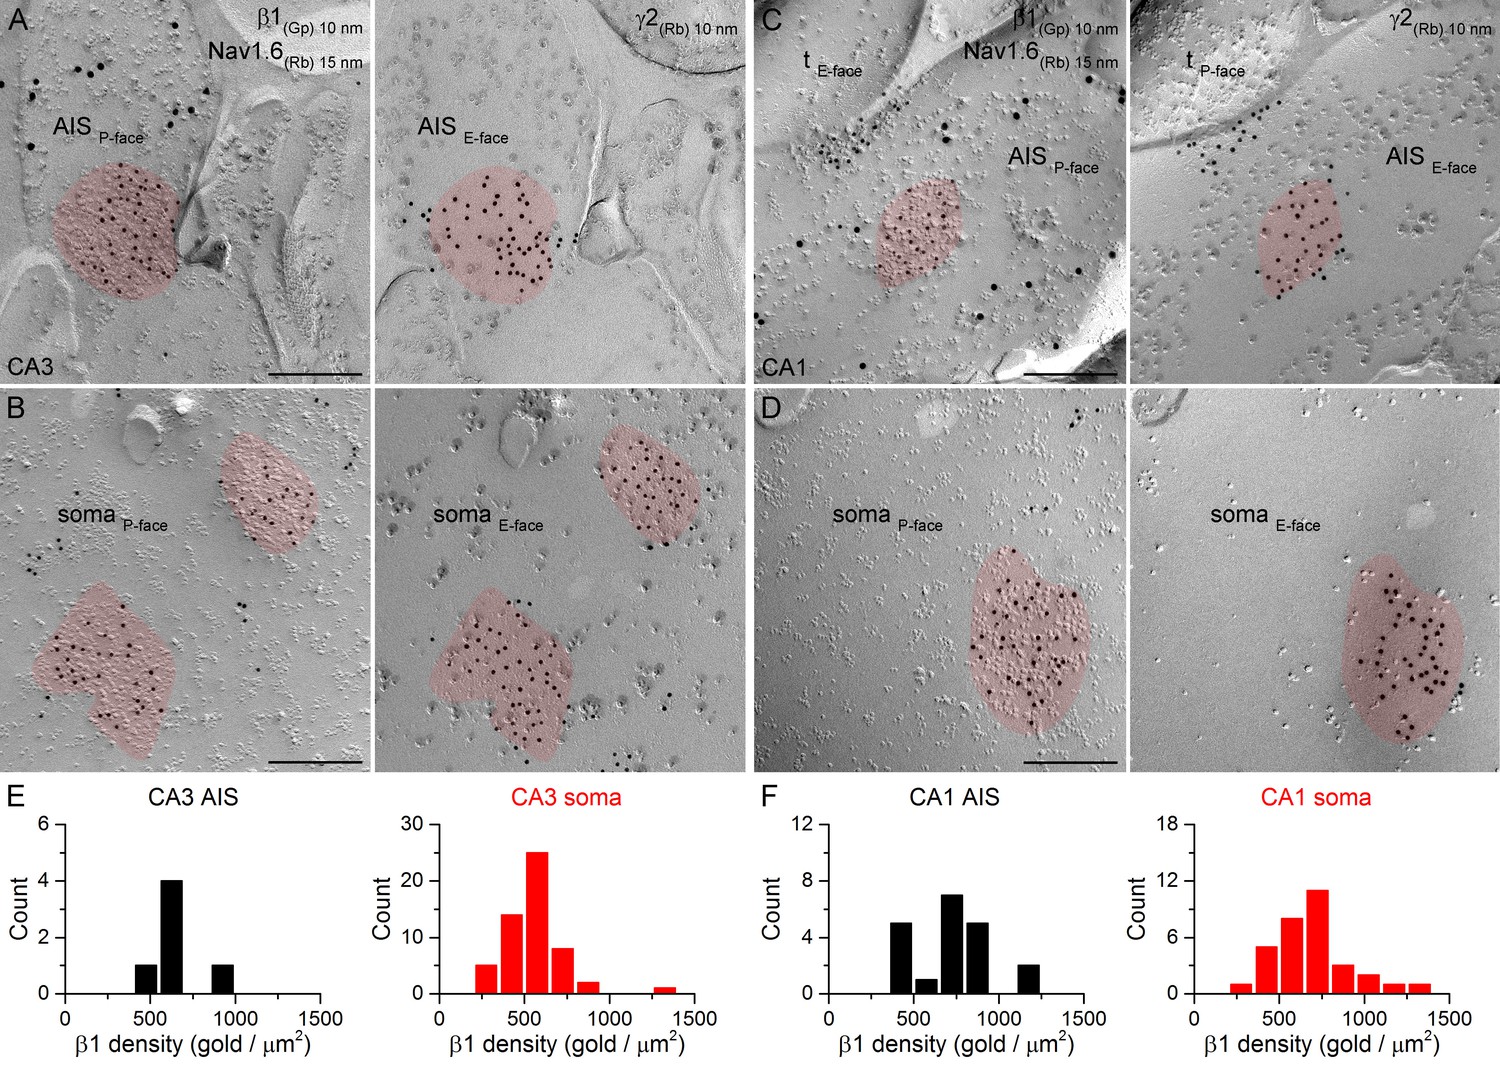
SDS-FRL labeling for the β1 subunit in hippocampal PC AIS and somatic synapses.
(A–D) High magnification images of double-replica pairs show the accumulation of gold particles labeling the β1 subunit (10 nm gold) in the P-face of AIS (A, C) and somatic (B, D) synapses, which were identified on the complementary E-face by the presence of gold particles labeling for the γ2 subunit (10 nm gold). The AIS was identified by immunolabeling for the Nav1.6 subunit (15 nm gold). Note an axon terminal (tE-face) facing a partial synapse immunolabeled for the β1 subunit of an AIS in the CA1 area (C). (E, F) Distributions of AIS (black) and somatic synapses (red) in the CA3 (E; AIS: n = 6, soma: n = 55, one rat) and CA1 (F; AIS: n = 20; soma: n = 32) regions based on their β1 subunit densities. Scale bars: (A–D) 200 nm.
Figure 9
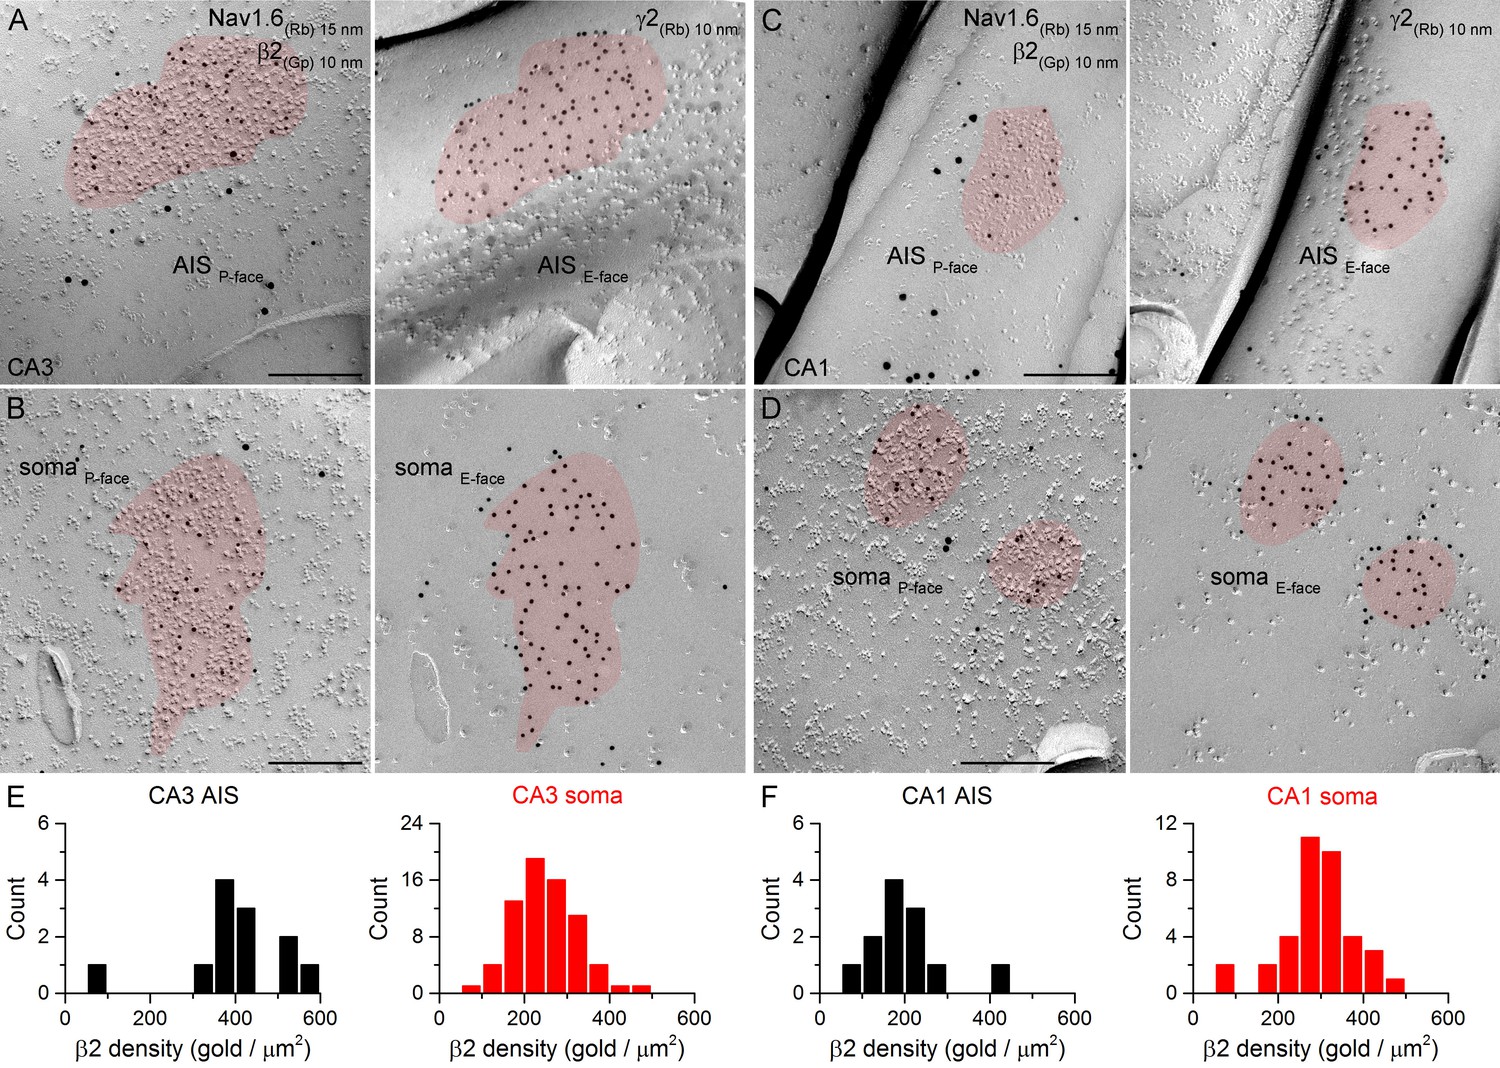
SDS-FRL labeling for the β2 subunit in hippocampal PC AIS and somatic synapses.
(A–D) High magnification views of mirror replica images show the clustering of β2 subunit (10 nm gold) in AIS (A, C) and somatic (B, D) synapses on the P-face, identified on the complementary E-face by the presence of gold particles labeling for the γ2 subunit (10 nm gold). The AIS was identified by immunolabeling for the Nav1.6 subunit (15 nm gold). (E, F) Distributions of AIS (black) and somatic synapses (red) in the CA3 (E; AIS: n = 12; soma: n = 70, one rat) and CA1 (F; AIS: n = 12; soma: n = 37) regions according to their β2 subunit densities. Scale bars: (A–D) 200 nm.
Figure 10
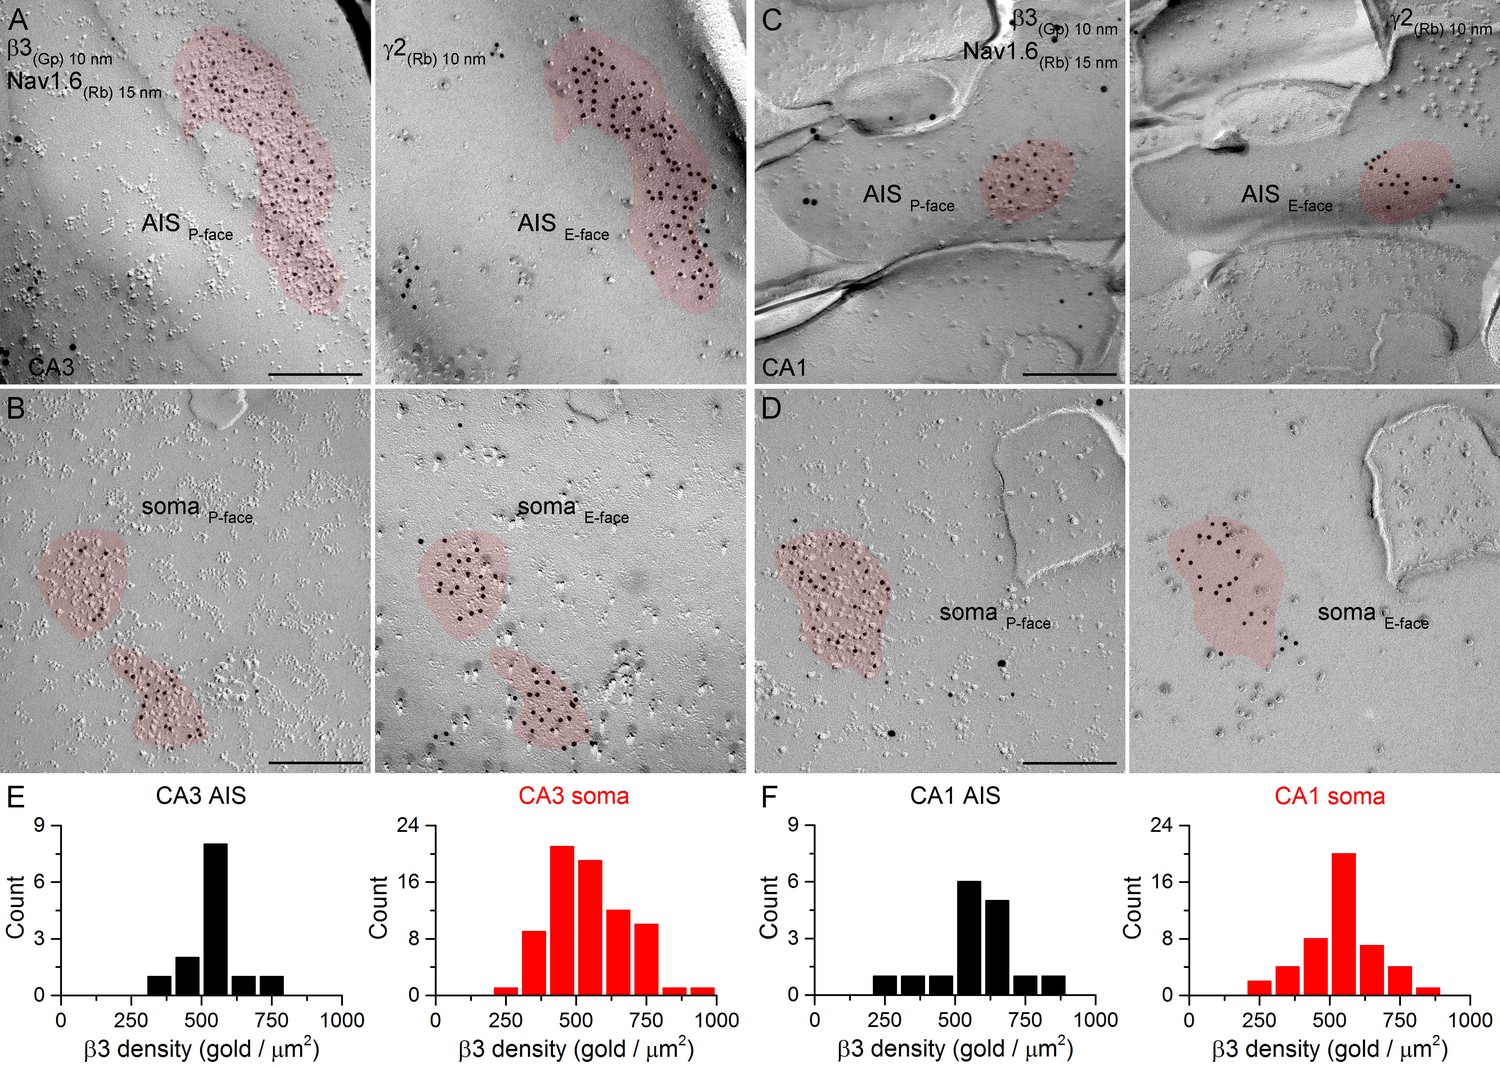
SDS-FRL labeling for the β3 subunit in hippocampal PC AIS and somatic synapses.
(A–D) High magnification images of double-replica pairs demonstrate the clustering of β3 subunit (10 nm gold) in AIS (A, C) and somatic (B, D) synapses, identified on the complementary E-face by the presence of gold particles labeling the γ2 subunit (10 nm gold). The AIS was identified by immunolabeling for the Nav1.6 subunit (15 nm gold). (E, F) Distributions of AIS (black) and somatic (red) synapses in the CA3 (E; AIS: n = 13; soma: n = 74, one rat) and CA1 (F; AIS: n = 16; soma: n = 46) regions based on their β3 subunit densities. Scale bars: (A–D) 200 nm.
Figure 11
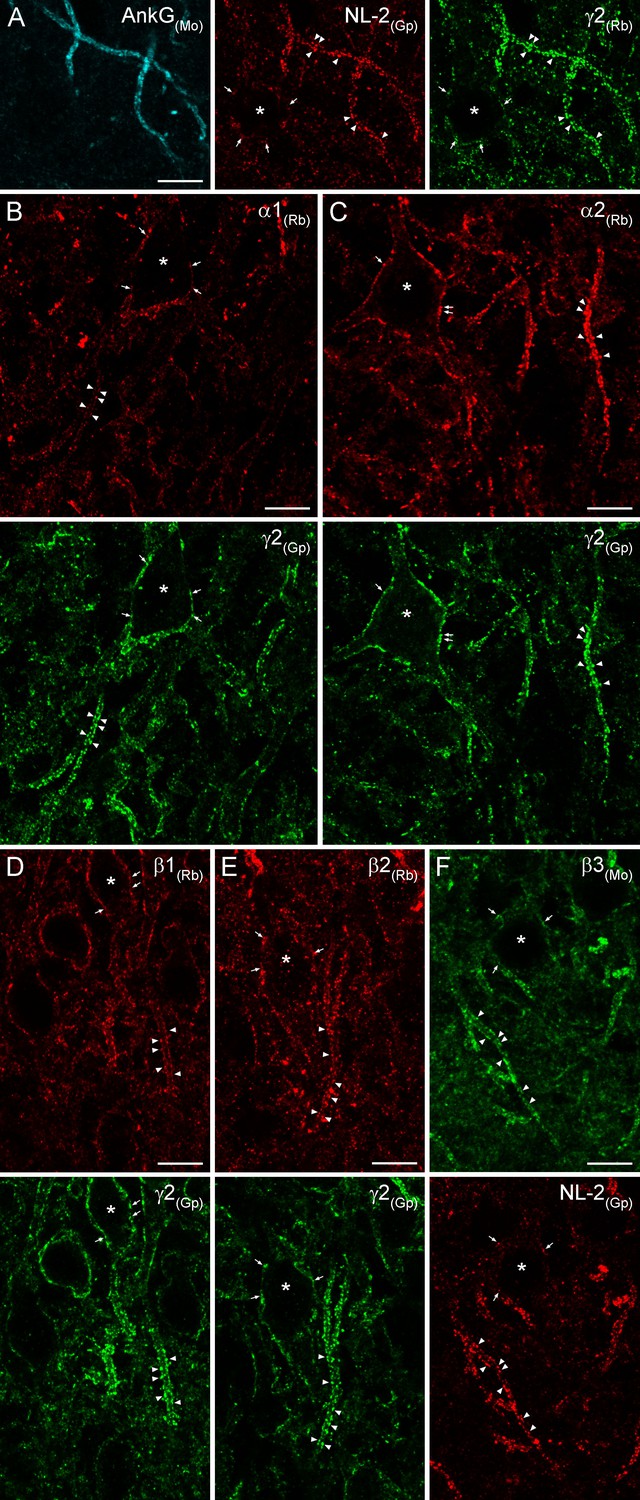
Immunofluorescent labeling for six GABAAR subunit isoforms in CA3 PC AIS and somatic synapses.
(A) Triple-labeling for the AIS marker ankyrin-G (AnkG; blue), the inhibitory synapse marker NL-2 (red) and the γ2 subunit (green) in PC AIS and somatic synapses. Light microscopic image depicts the co-localization of the γ2 subunit with NL-2 clusters in AISs (arrowheads) and somata (*; arrows). (B–F) Double-immunofluorescent labeling for the α1, α2, β1, β2 (red), β3 (green) and the γ2 subunit (green) or NL-2 (red) reveals the clustering of these GABAARs subunit isoforms in AIS (arrowheads) and somatic synapses (*; arrows). (A–F) 10 µm.
Tables
Table 1
List of primary antibodies used in fluorescent immunohistochemistry and SDS-FRL.
| Molecule | Host | Epitope (aa residues) | Vendor | RRID/Cat. No. | Protein concentration | Fluorescent reaction (dilution) | SDS-FRL (dilution) |
|---|---|---|---|---|---|---|---|
| GABAAR α1 | Rb | 1–9 | W. Sieghart | 958 µg/ml | 1:1000 | 1:200 | |
| GABAAR α1 | Mo | 28–43 | Synaptic Systems | 224 211 | 1 mg/ml | 1:60 | |
| GABAAR α2 | Rb | 29–37 | Synaptic Systems | 224 103 | 1 mg/ml | 1:1000 | |
| GABAAR α2 | Rb | 322–357 | W. Sieghart | 782/991 µg/ml | 1:10000/1:700 | ||
| GABAAR α2 | Gp | 1–9 | J.-M. Fritschy | AB_2314463 | 1:100 | ||
| GABAAR β1 | Rb | 342–430 | Synaptic Systems | 224 703 | 1 mg/ml | 1:1000 | 1:1000 |
| GABAAR β1 | Gp | 342–430 | Synaptic Systems | 224 705 | 1 mg/ml | 1:1200 | |
| GABAAR β2 | Rb | 343–430 | Synaptic Systems | 224 803 | 1 mg/ml | 1:1000 | |
| GABAAR β2 | Gp | 343–430 | Synaptic Systems | 224 805 | 1 mg/ml | 1:600 | |
| GABAAR β3 | Rb | 345–408 | W. Sieghart | 479 µg/ml | 1:800 | ||
| GABAAR β3 | Gp | 344–429 | Synaptic Systems | 224 404 | serum | 1:500 | |
| GABAAR β3 | Mo | 370–433 | Neuromab | AB_2109585 | 1:1000 | ||
| GABAAR γ2 | Rb | 39–67 | Synaptic Systems | 224 003 | 1 mg/ml | 1:1000 | 1:600 |
| GABAAR γ2 | Rb | 319–366 | W. Sieghart | 270 µg/ml | 1:1000 | ||
| GABAAR γ2 | Gp | 39–67 | Synaptic Systems | 224 004 | 1 mg/ml | 1:500 | |
| GABAAR γ2 | Mo | 39–67 | Synaptic Systems | 224 011 | 1 mg/ml | 1:600 | |
| neuroligin-2 | Gp | 732–761 | Frontier Institute | AB_2571609 | 200 µg/ml | 1:100 | 1:50 |
| neuroligin-2 | Gp | 750–767 | Synaptic Systems | 129 205 | 1 mg/ml | 1:600 | |
| ankyrin-G | Mo | 990–2622 | Neuromab | AB_10673030 | 1 mg/ml | 1:500 | |
| Nav1.6 | Rb | 1042–1061 | Alomone | AB_2040202 | 0.8 mg/ml | 1:600 | |
| Kv1.1 | Gp | 478–492 | Frontier Institute | Kv1.1-GP-Af1000 | 200 µg/ml | 1:50/1:100 | |
| Cav2.1 | Gp | 1921–2212 | Synaptic Systems | 152 205 | 1 mg/ml | 1:1000 | |
| Cav2.2 | Rb | 2056–2336 | Synaptic Systems | 152 303 | 1 mg/ml | 1:1000 |
-
Abbreviations: aa, amino acids; Gp, guinea pig; Mo, mouse; Rb, rabbit.
Download links
A two-part list of links to download the article, or parts of the article, in various formats.
Downloads (link to download the article as PDF)
Open citations (links to open the citations from this article in various online reference manager services)
Cite this article (links to download the citations from this article in formats compatible with various reference manager tools)
Similar GABAA receptor subunit composition in somatic and axon initial segment synapses of hippocampal pyramidal cells
eLife 5:e18426.
https://doi.org/10.7554/eLife.18426


