Spontaneous activation of visual pigments in relation to openness/closedness of chromophore-binding pocket
- Johns Hopkins University School of Medicine, United States
- Boston University School of Medicine, United States
- Peking University, China
- Peking-Tsinghua Center for Life Sciences, China
- Kyoto University, Japan
Figures
Figure 1
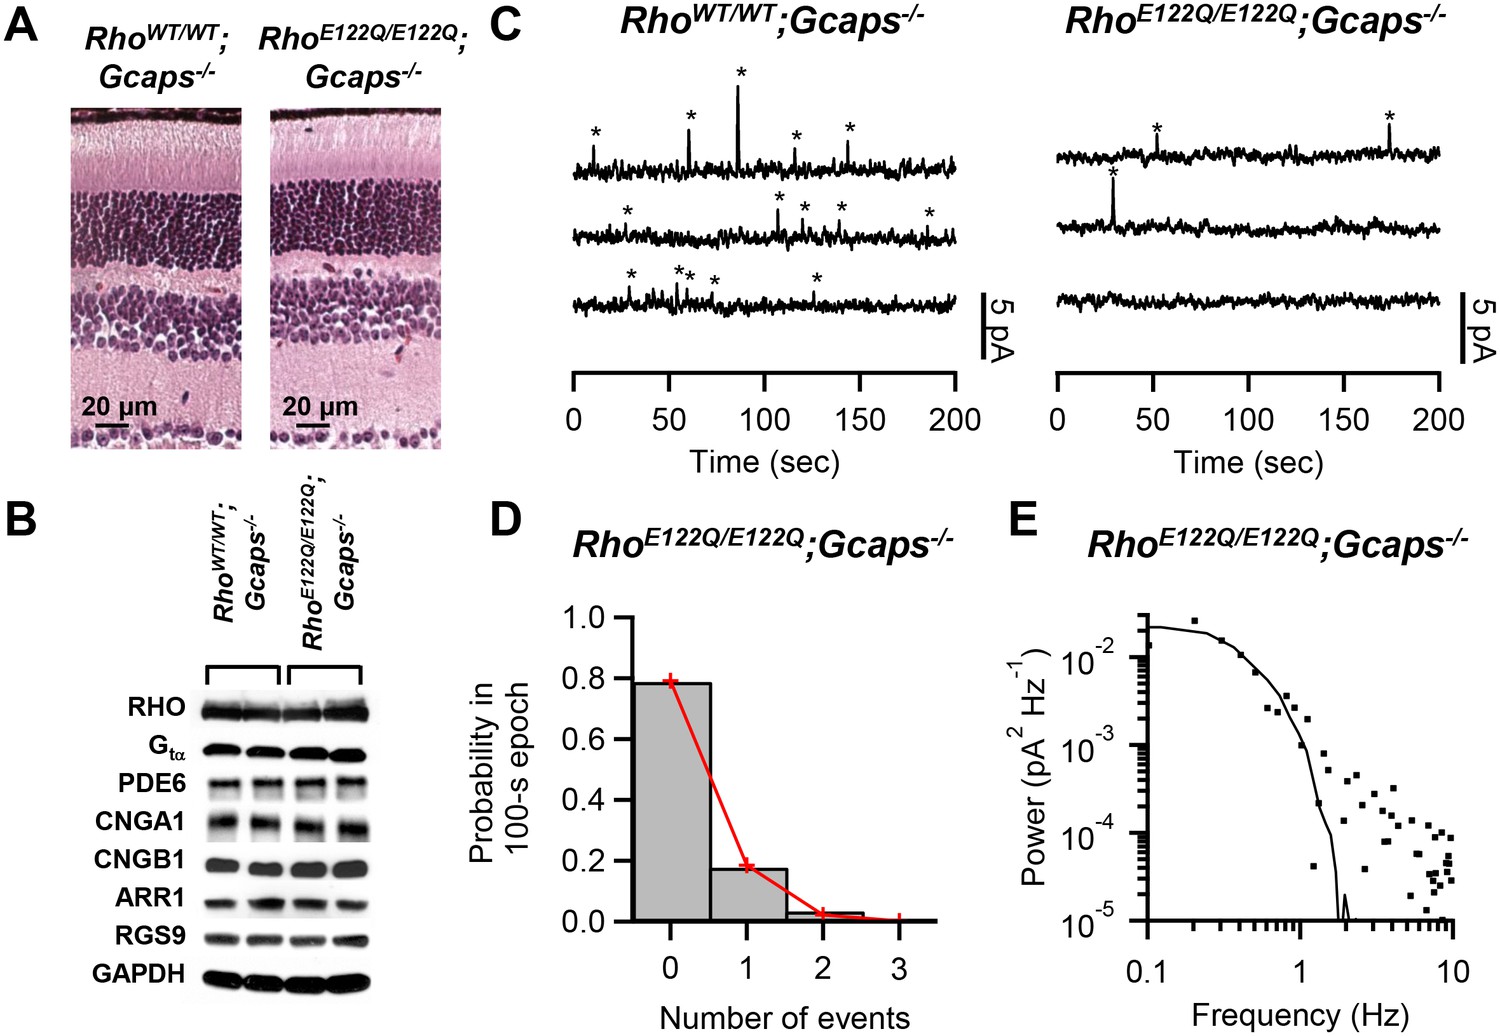
Measurement of spontaneous-activation rate of E122Q-rhodopsin.
(A) Paraffin sections of 2.5-month-old RhoWT/WT;Gcaps-/- (left) and RhoE122Q/E122Q;Gcaps-/- (right) retinas stained by haematoxylin and eosin showing normal rod morphology. Similar results were found in altogether 3 sets of experiments. (B) Western blots from retinal extracts of RhoWT/WT;Gcaps-/-(different animal in each of the left two columns) and RhoE122Q/E122Q;Gcaps-/-mice (different animal in each of right two columns) showing normal expression of various phototransduction protein components. RHO: rhodopsin; Gtα: α subunit of transducin; PDE6: phosphodiesterase isoform 6; CNGA1: A1 subunit of cyclic nucleotide-gated (CNG) channel; CNGB1: B1 subunit of CNG channel; ARR1: Arrestin 1; RGS9: regulator of G protein signaling isoform 9; GAPDH: glyceraldehyde 3-phosphate dehydrogenase (control for protein amount). (C) Sample 10 min recordings from a RhoWT/WT;Gcaps-/- rod (left) and a RhoE122Q/E122Q;Gcaps-/- rod (right) in darkness. Traces (continuous from top to bottom) were low-pass filtered at 3 Hz. Quantal events were identified based on amplitude and kinetics (see Text) and are marked by asterisks. (D) Poisson analysis of dark recordings collected from all RhoE122Q/E122Q;Gcaps-/- rods. Bars indicate the measured probabilities of observing 0, 1, 2 and 3 events in 100 s epochs. A total of 118 epochs were analyzed. Red lines give the fit by the Poisson distribution with a mean event rate of 0.0023 s−1 cell−1. (E) Difference power spectrum (square symbols) of a RhoE122Q/E122Q;Gcaps-/- rod fitted with the power spectrum (curve) of the single-photon-response function.
-
Figure 1—source data 1
Source data for Figure 1D.
- https://doi.org/10.7554/eLife.18492.004
Figure 2
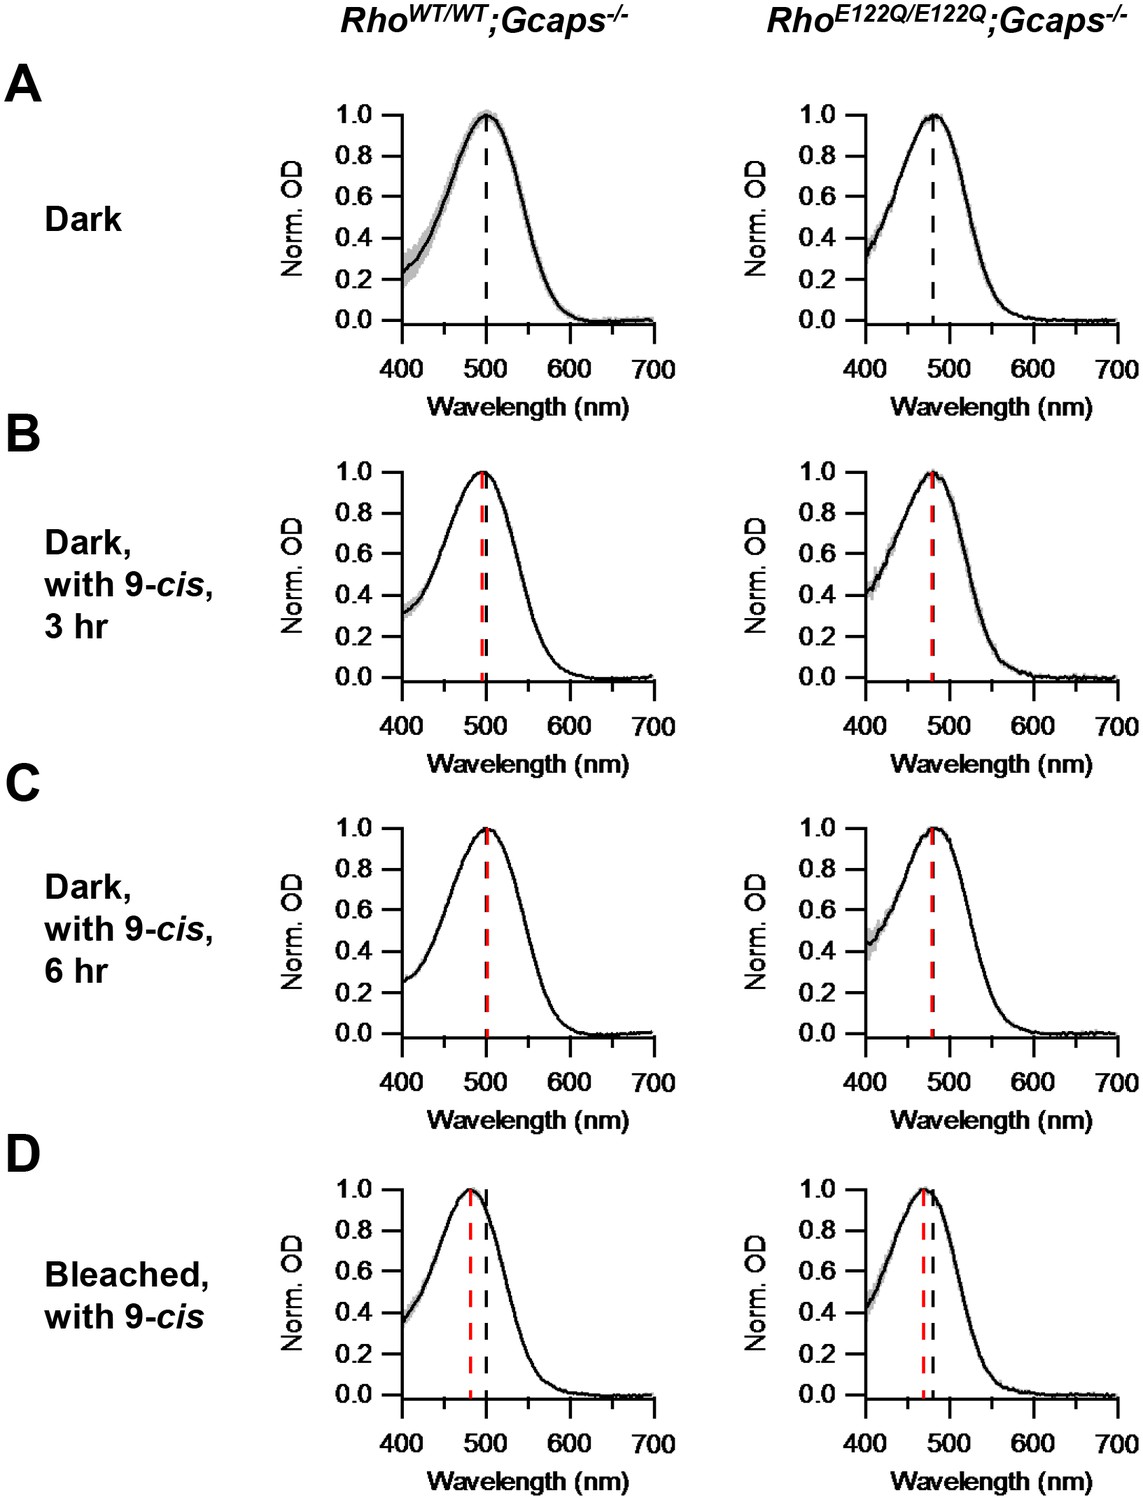
Chromophore-exchange experiment for probing the openness/closedness of chromophore-binding pocket.
Absorption spectra (normalized to peak optical density) were obtained from dark-adapted RhoWT/WT;Gcaps-/- rods (left) and RhoE122Q/E122Q;Gcaps-/- rods (right) that were incubated in darkness in (A) Ames solution for 3 hr, (B) Ames solution with 15 μM 9-cis-retinal in darkness for 3 hr and (C) Ames solution with 15 μM 9-cis-retinal in darkness for 6 hr. (D) Absorption spectra from rods 99%-bleached followed by 3 hr 9-cis incubation in darkness. In all panels, curves are mean (black) ± SD (gray). Black dashed lines indicate the λmax of dark-adapted RhoWT/WT;Gcaps-/- (left) and RhoE122Q/E122Q;Gcaps-/- rods (right) not exposed to exogenous chromophore. Red dashed lines indicate the λmax of rods of the respective genotypes after the respective experimental treatment. The black dashed lines in (A) are replotted in (B), (C) and (D) for comparison with the red lines. For RhoWT/WT;Gcaps-/- rods, λmax’s are (A) 499.9 ± 4.8 nm (n = 33 recordings), (B) 495.6 ± 3.0 nm (n = 5 recordings, p=0.06), (C) 501.3 ± 4.5 nm (n = 6 recordings, p=0.52) and (D) 481.6 ± 4.1 nm (n = 5 recordings, p<0.0001), with p values from Student’s t-test comparing with (A). For RhoE122Q/E122Q;Gcaps-/- rods, λmax’s are (A) 480.9 ± 5.4 nm (n = 7 recordings), (B) 479.6 ± 3.6 nm (n = 5 recordings, p=0.65), (C) 479.2 ± 3.9 nm (n = 5 recordings, p=0.56) and (D) 469.3 ± 3.2 nm (n = 8 recordings, p=0.0002), with p values from Student’s t-test comparing with (A).
-
Figure 2—source data 1
Source data for Figure 2.
- https://doi.org/10.7554/eLife.18492.006
Figure 3
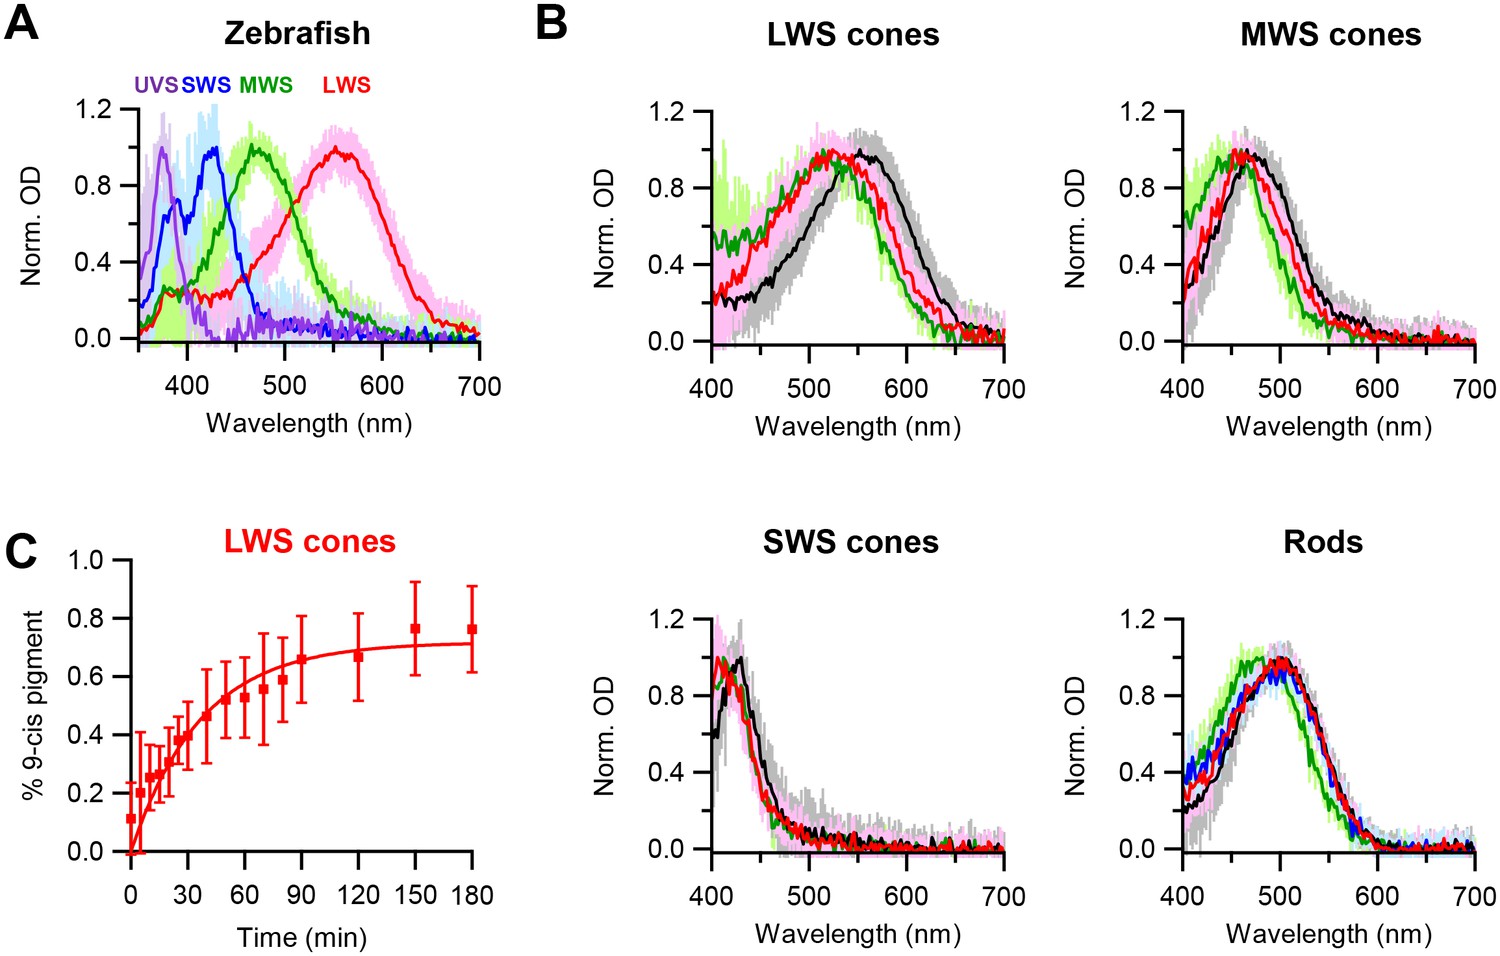
Chromophore-exchange experiment with zebrafish photoreceptors.
(A) Absorption spectra of dark-adapted zebrafish long-wavelength-sensitive (LWS), medium-wavelength-sensitive (MWS), short-wavelength-sensitive (SWS) and ultraviolet-sensitive (UVS) cones. Spectra are mean (intense traces) ± SD (faint traces), normalized to peak optical density. n = 41 (LWS), 32 (MWS), 17 (SWS) and 5 (UVS) cells. (B) Absorption spectra of dark-adapted zebrafish rods and cones that were incubated with 15 μM 9-cis-retinal in darkness for 3 hr (red) and 6 hr (blue, only for rods). Spectra of dark-adapted cells after dark incubation for 3 hr in Ames solution without 9-cis (black), and of cells 99%-bleached followed by dark incubation for 3 hr in Ames solution with 9-cis (green), are given as reference. Spectra are mean (intense traces) ± SD (faint traces), normalized to peak optical density. For LWS cones, n = 24 (red), 41 (black) and 6 (green) cells. For MWS cones, n = 15 (red), 32 (black) and 7 (green) cells. For SWS cones, n = 10 (red), 17 (black) and 4 (green) cells. For rods, n = 13 (red), 16 (blue), 25 (black) and 20 (green) cells. (C) Time course of dark chromophore-exchange in LWS cones. The percentage of 9-cis-conjugated pigment (Materials and methods) is plotted (mean ± SD, n = 9 cells) against time in chromophore incubation. Curve is a saturating exponential function, 0.72 (1- e-t/τ), with an asymptote of 0.72 and a time constant, τ, of 37 min fitted to the data.
-
Figure 3—source data 1
Source data for Figure 3A.
- https://doi.org/10.7554/eLife.18492.008
-
Figure 3—source data 2
Source data for Figure 3B.
- https://doi.org/10.7554/eLife.18492.009
-
Figure 3—source data 3
Source data for Figure 3C.
- https://doi.org/10.7554/eLife.18492.010
Download links
A two-part list of links to download the article, or parts of the article, in various formats.
Downloads (link to download the article as PDF)
Open citations (links to open the citations from this article in various online reference manager services)
Cite this article (links to download the citations from this article in formats compatible with various reference manager tools)
Spontaneous activation of visual pigments in relation to openness/closedness of chromophore-binding pocket
eLife 6:e18492.
https://doi.org/10.7554/eLife.18492


