A causal relationship between face-patch activity and face-detection behavior
- University of Pittsburgh, United States
- Laboratory of Neural Systems, The Rockefeller University, United States
Figures
Figure 1
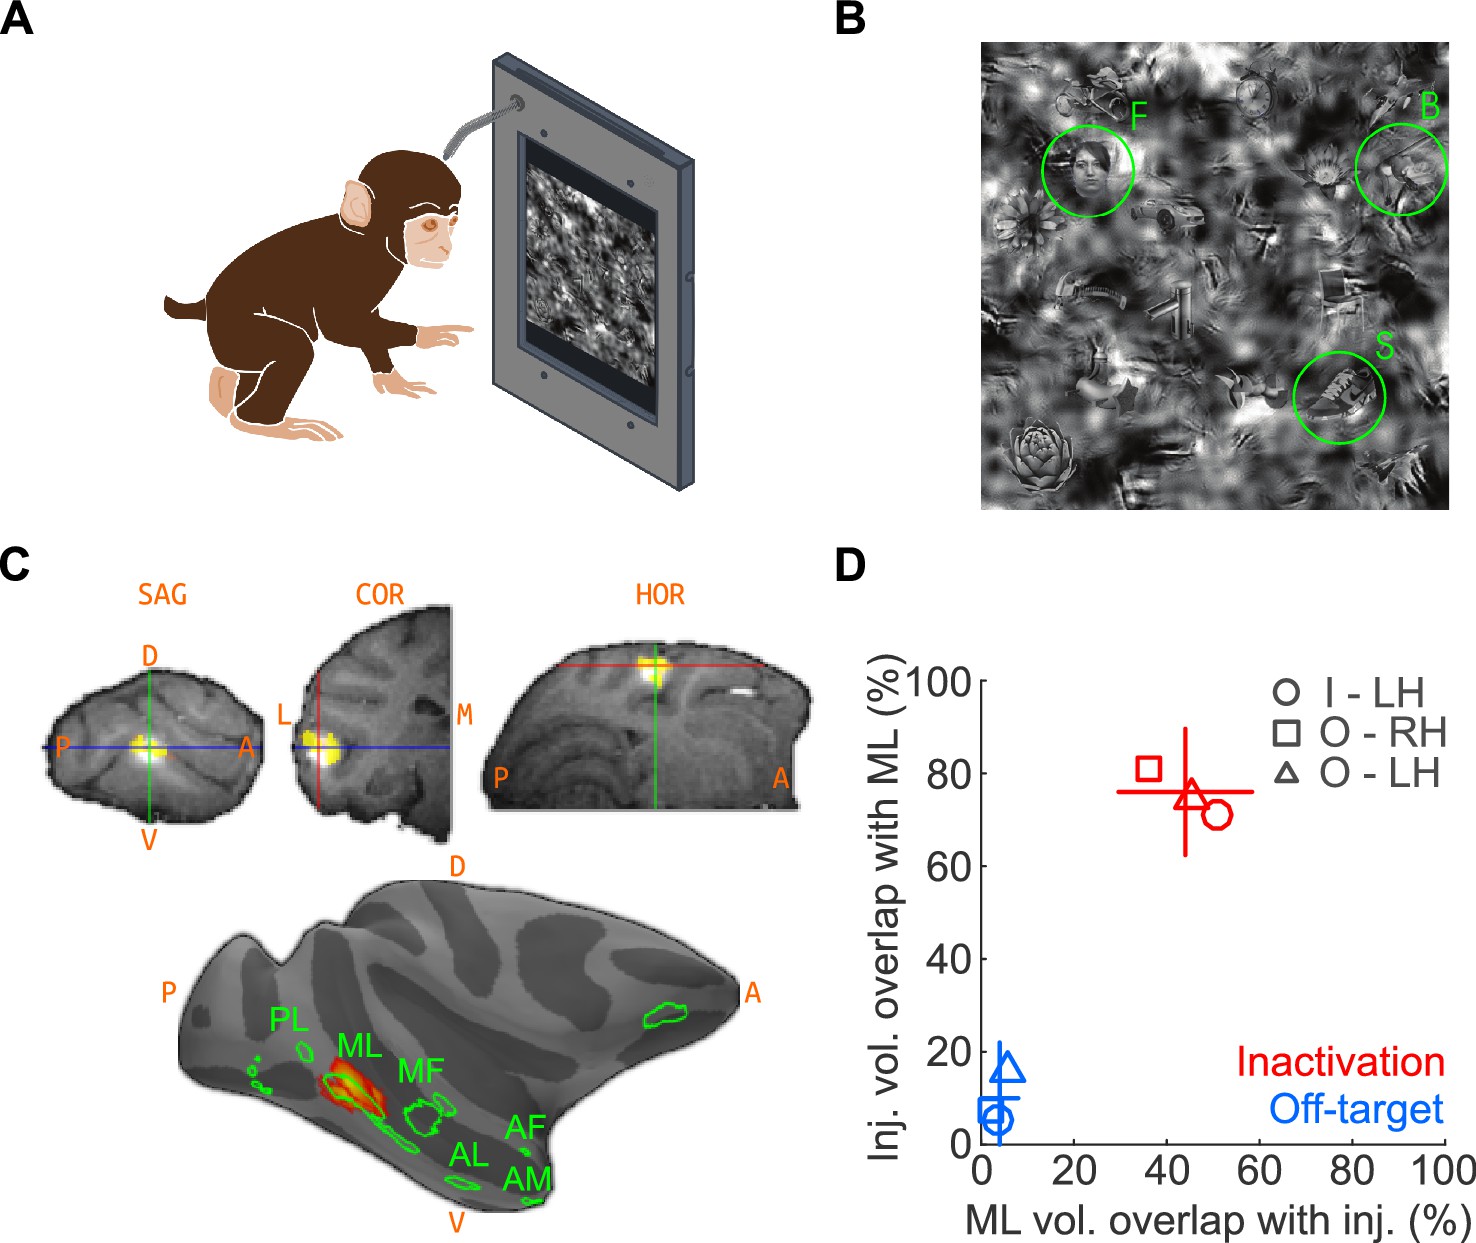
Naturalistic face-detection task and targeted inactivation of face-patch ML.
(A) Subjects performed a face-detection task on a touchscreen device that was mounted to their home cages. Subjects were unconstrained, initiated trials at will, and scanned the array freely. (B) Upon initiating a trial, an array of 24 objects appeared on the screen, one of which was the target belonging to one of three categories – faces, bodies, or shoes (green circles). (C) Neural activity in face-patch ML (yellow regions) was silenced by targeted microinjections of muscimol. (Top) The extent of diffusion and targeting accuracy was evaluated by coinjecting gadolinium, which appeared as a bright volume in post-injection anatomical scans. Labels: SAG - sagittal slice, HOR - horizontal slice, COR - coronal slice, A - anterior, P - posterior, D - dorsal, V – ventral. (Bottom) The locations of all four targeted muscimol microinjections (heatmap) from one subject's left hemisphere relative to face-patch locations (green outlines, face area labels as in Tsao et al., 2008). (D) Volumetric overlap between the inactivation injections and ML (red; n = 11) and off-target injections and ML (blue; n = 10). Lines correspond to ±1 s.e.m., and the intersection point is the mean along each axis. Symbols correspond to the mean values from individual hemispheres (circle – Subject ‘I’, LH; square – Subject ‘O’, RH; triangle – Subject ‘O’, LH).
Figure 2
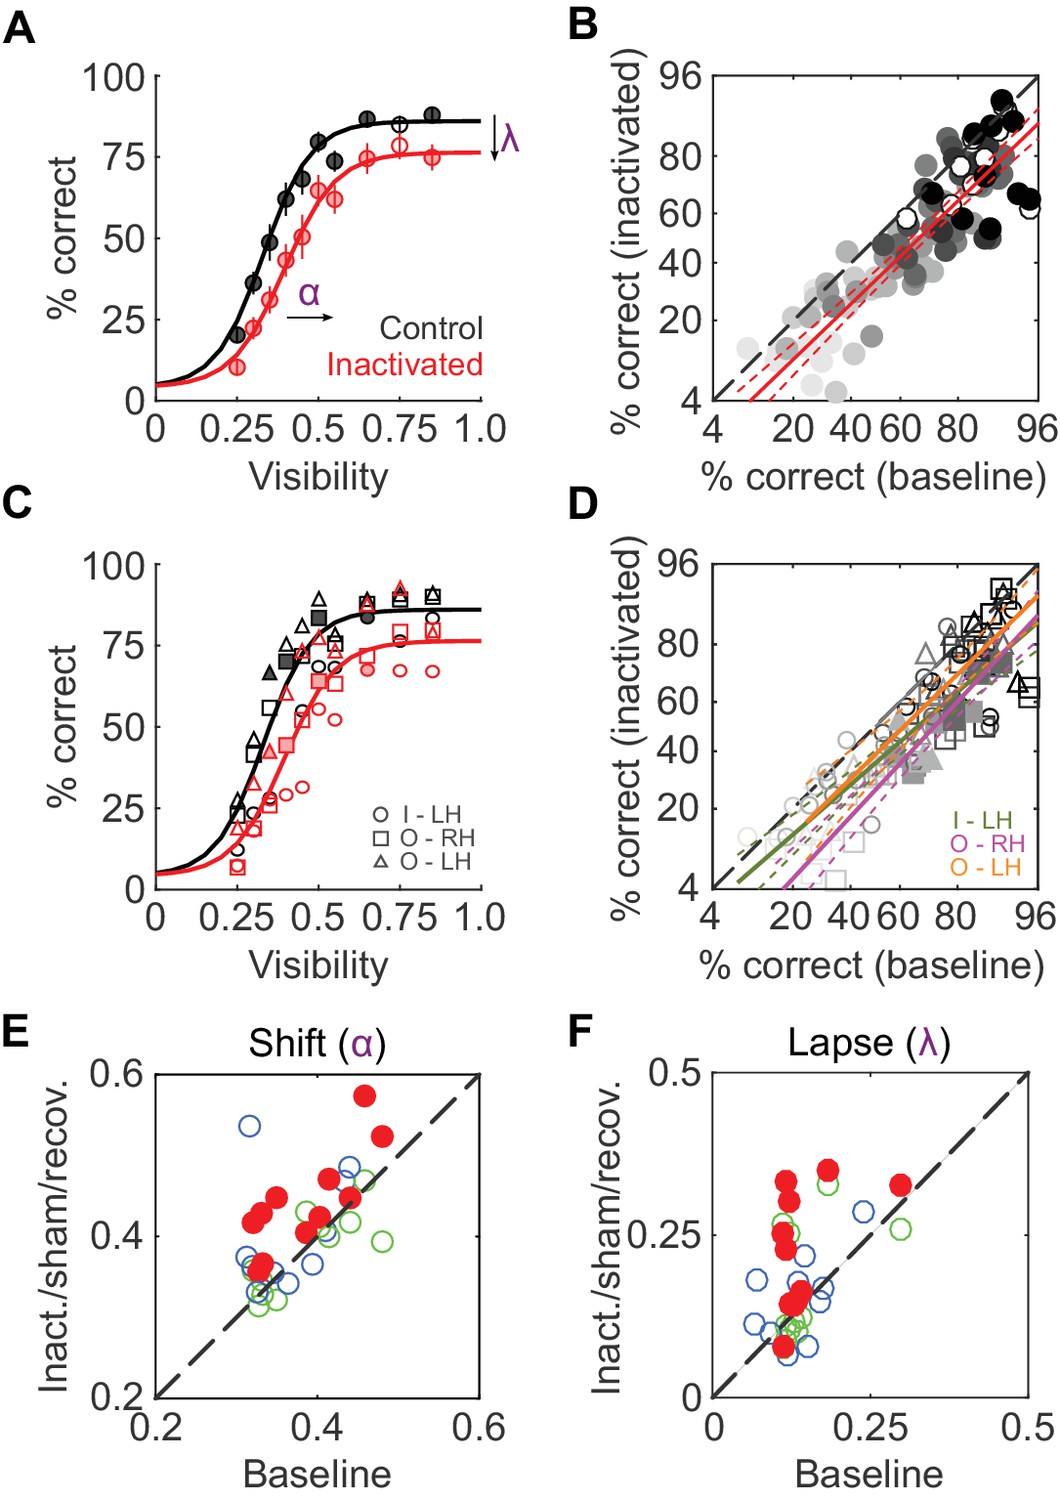
ML inactivation causes face-detection deficits.
(A) Face-detection performance as a function of stimulus visibility under baseline (black) and ML-inactivated (red) conditions. Circles correspond to average performance, error bars to ±1 s.e.m. Lines are psychometric function fits to all performance data. Filled circles: p<0.05, FDR-corrected paired t-tests after logit transform. (B) Performance in the inactivated condition plotted as a function of performance in the corresponding baseline condition, sorted by stimulus visibility (grayscale luminance). Filled circles are the significant points from (A). These data were well-fit by a line (red; R2 = 0.74; p<0.001) with a slope close to 1, and a significantly shifted intercept (p<0.001) compared withthe diagonal. Dashed red lines represent the 95% confidence intervals. (C and D) The data in (A) and (B), but separated into individual inactivated hemispheres. Filled symbols denote statistically significant differences between the control and inactivated conditions (p<0.05, FDR-corrected paired t-test after logit transform). Symbols are as in Figure 1. (E and F) Face-detection performance as quantified by shift α (E) and lapse λ (F) during three conditions (ML-inactivated (red), recovery (green) and off-target (blue)) versus baseline condition. Shift and lapse were derived from psychometric function fits to face-detection data, and were significantly altered from baseline during inactivation (filled red circles; p<0.001 for shift and p<0.05 for lapse; paired t-test). Note that the axes in (B) and (D) are logit scaled.
Figure 3
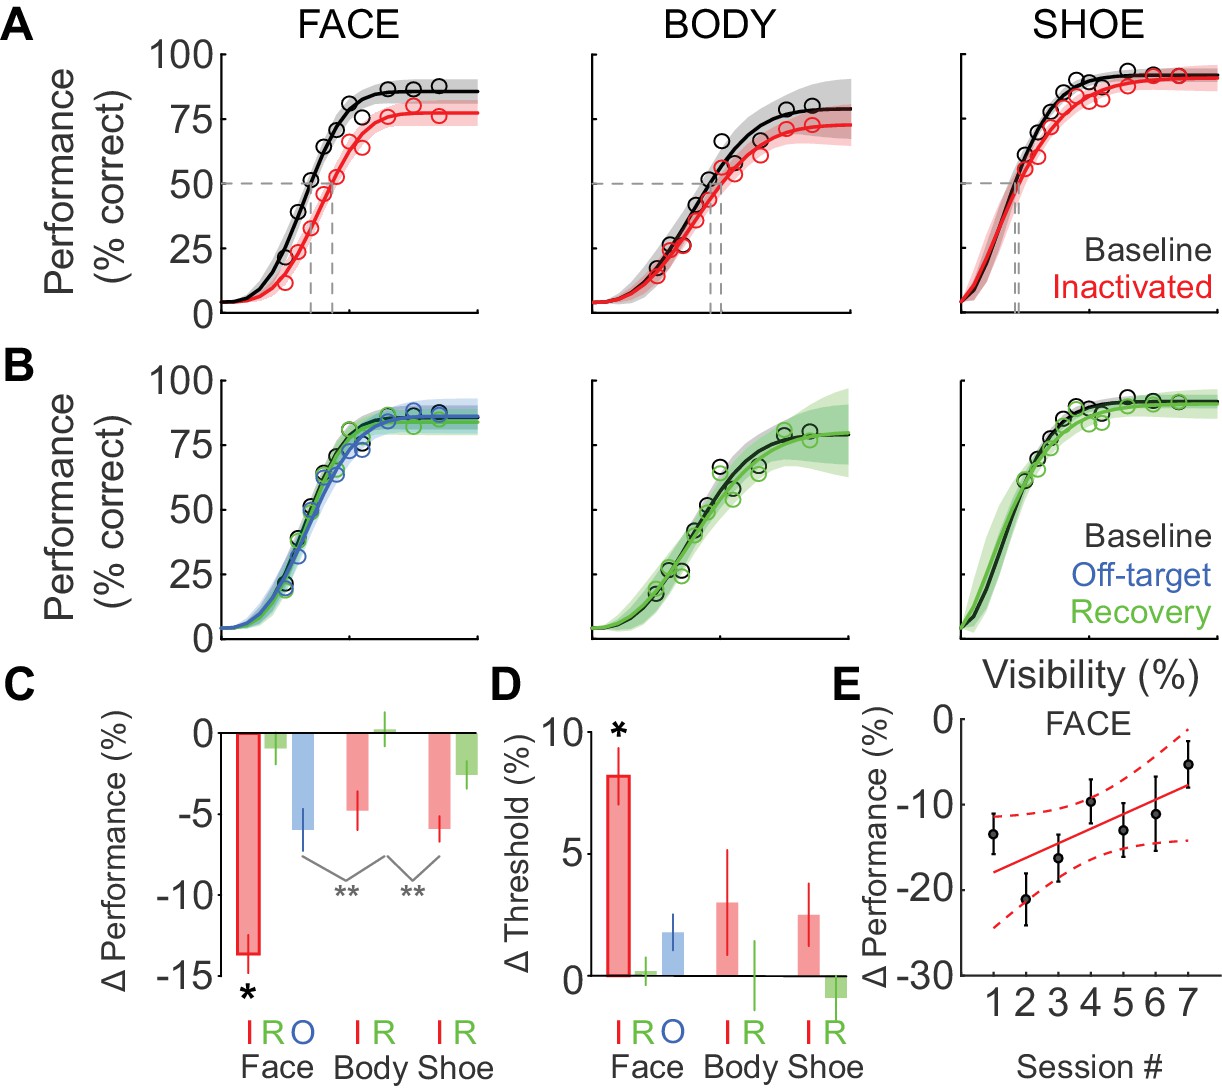
Deficits after ML inactivation are reversible and largely categorically specific to faces.
(A) Behavioral performance in the baseline (black) and ML-inactivation (red) conditions for face-, body-, and shoe-detection as a function of stimulus visibility, showing the categorical specificity of the effect to faces. Data are summed across all 11 inactivation sessions. Lines are fits to the psychometric function in Equation 1. Shading shows the 95% confidence intervals. Gray dashed lines indicate threshold stimulus visibilities for each stimulus category. (B) Behavioral performance measured the day after ML inactivation (recovery; green) was not different from the baseline condition (black). Behavioral performance when muscimol was infused into the surrounding cortical areas, but not into ML (off-target; blue), was not different from the baseline condition, showing the anatomical specificity of the effect. (C) The performance deficit, averaged across all visibilities and sessions, for all tested category/condition combinations (colors as earlier). Face/inactivated performance deficit was significantly different for all pairwise comparisons (ANCOVA accounting for effect of repeated muscimol exposure on logit-transformed data; black asterisk: p<0.05, Tukey's test). An ANOVA not accounting for repeated exposure resulted in two cross-category comparisons reaching significance (gray asterisks: p<0.01, Tukey’s test). (D) The change in detection threshold for all tested category/condition combinations. The face/inactivated threshold was significantly shifted to higher stimulus visibilities for all pairwise comparisons (ANOVA; black asterisk, p<0.05, Tukey's test). Labels 'I', 'R', and 'O' refer to the inactivated, recovery, and off-target conditions. (E) The effect of repeated muscimol exposure on the performance deficit caused by muscimol. Dots correspond to mean effect pooled over visibilities, error bars are s.e.m. Red line corresponds to linear fit, dashed lines correspond to 95% confidence intervals.
Figure 4
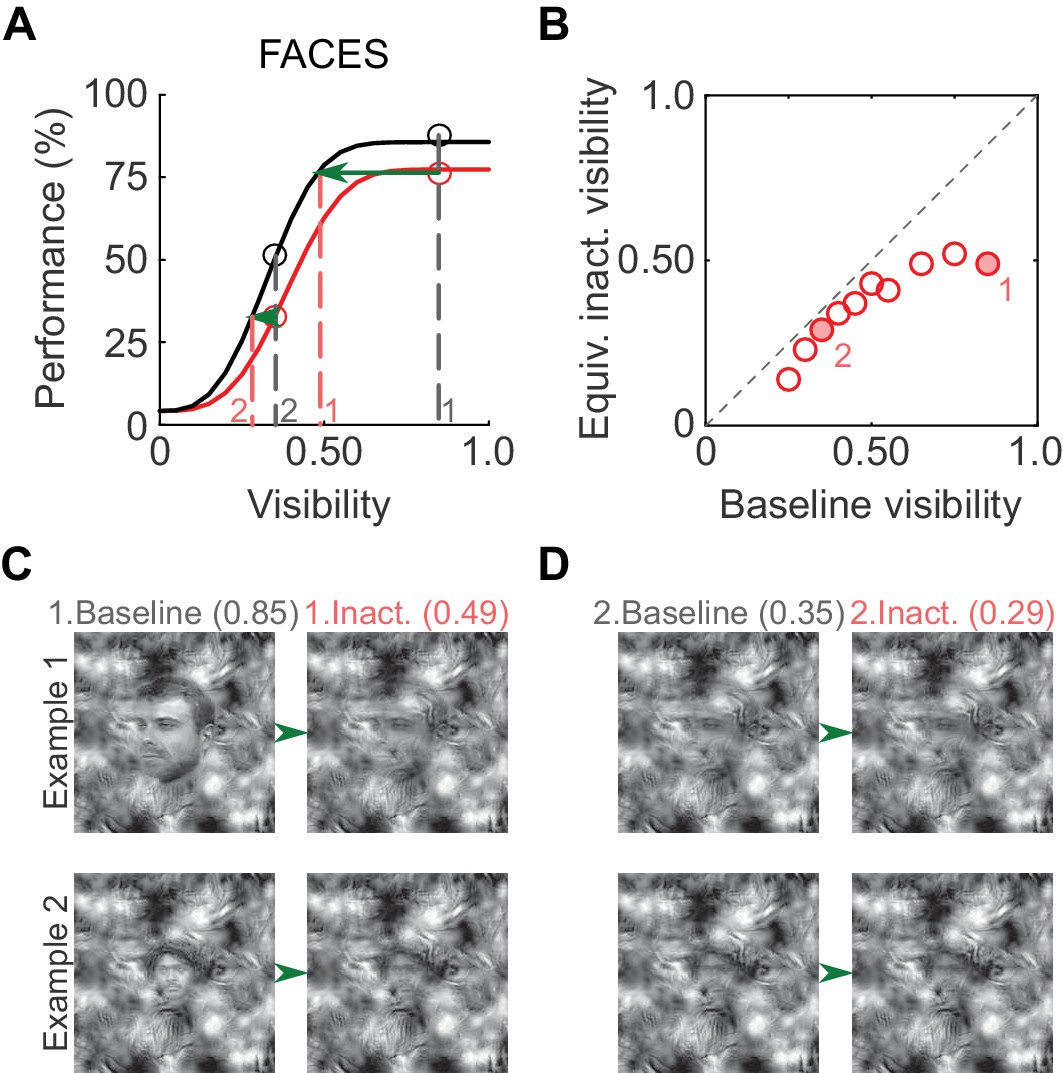
Perceptual effects of ML inactivation.
(A) Performance under baseline (black) and inactivated (red) conditions for face detection reproduced from Figure 2A (summed data). Dotted lines outline how equivalent inactivated visibility was calculated. For example, the ML-inactivated performance at a stimulus visibility of 0.85 (gray dashed line and gray '1') was the same as baseline performance when stimulus visibility was 0.49 (red dashed line and red '1'), that is, when ML was inactivated, the subject behaved as if it was viewing the stimulus at a decreased visibility. (B) As expected from the shifted psychometric curves, equivalent inactivated visibility was always lower than baseline visibility at each of the visibility levels tested (p=0.002; paired t-test). Filled circles marked '1' and '2' correspond to the visibility levels marked in A and C. (C and D) Example face stimuli plotted at baseline (0.85, marked '1', and 0.35, marked '2') and equivalent inactivated visibility levels corresponding to these baseline levels.
Download links
A two-part list of links to download the article, or parts of the article, in various formats.
Downloads (link to download the article as PDF)
Open citations (links to open the citations from this article in various online reference manager services)
Cite this article (links to download the citations from this article in formats compatible with various reference manager tools)
A causal relationship between face-patch activity and face-detection behavior
eLife 6:e18558.
https://doi.org/10.7554/eLife.18558


