RYBP stimulates PRC1 to shape chromatin-based communication between Polycomb repressive complexes
- University of Oxford, United Kingdom
Figures
Figure 1 with 1 supplement
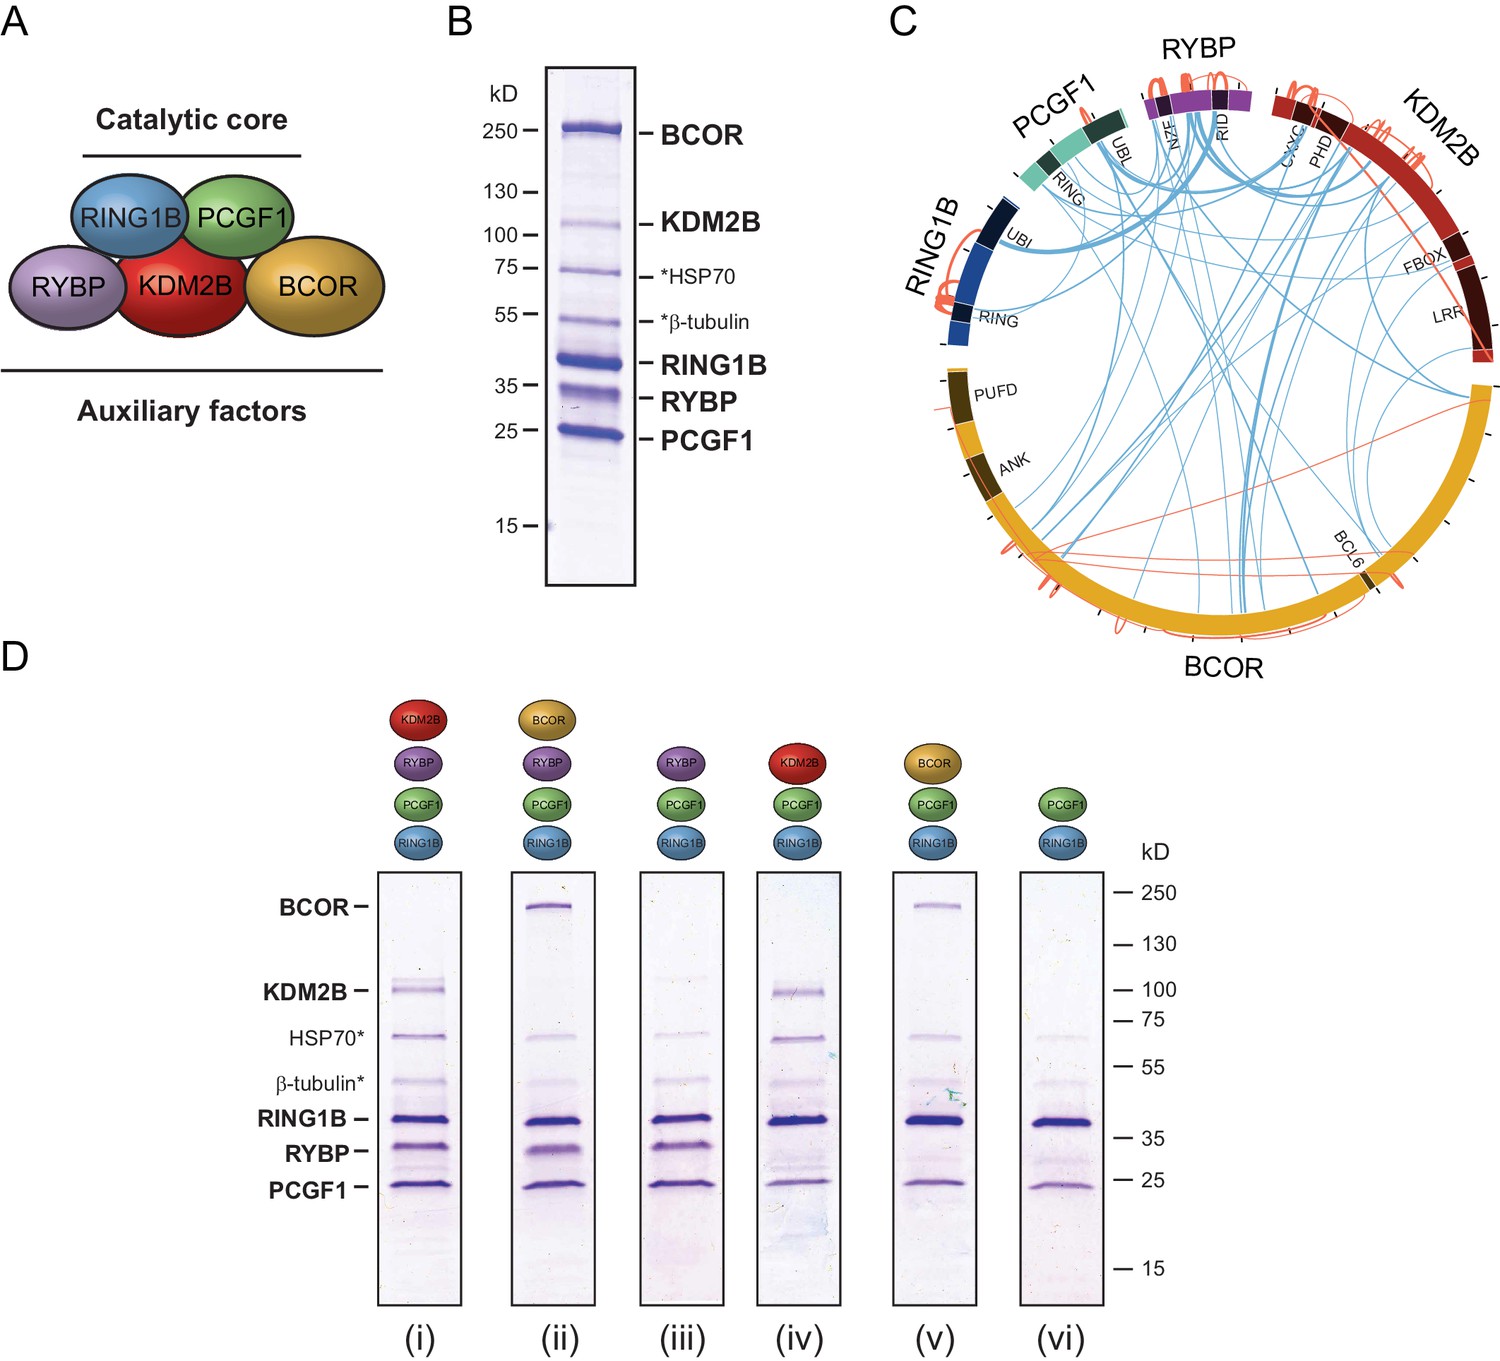
PCGF1-PRC1 is a highly modular complex.
(A) A schematic of the PCGF1-PRC1 complex indicating the core catalytic dimer of RING1B and PCGF1 and auxiliary components RYBP, KDM2B, and BCOR. (B) A Coomassie-stained gel of PCGF1-PRC1 affinity-purified via RING1B. Individual subunits are labelled and * denotes contaminants HSP70 and β-tubulin. (C) A Circos plot illustrating crosslinking mass spectrometry analysis of the PCGF1-PRC1 complex reveals extensive interactions between PCGF1-PRC1 subunits. Blue and orange lines indicate intermolecular and intramolecular crosslinks respectively. Lines are weighted by the statistical confidence of their interaction. (D) Coomassie-stained gels of affinity-purified PCGF1-PRC1 sub-complexes demonstrating the modularity of PCGF1-PRC1 complex. Complexes were affinity-purified via RING1B. Above each lane (i-vi) the co-expressed factors are illustrated and * denotes contaminants HSP70 and β-tubulin.
Figure 1—figure supplement 1
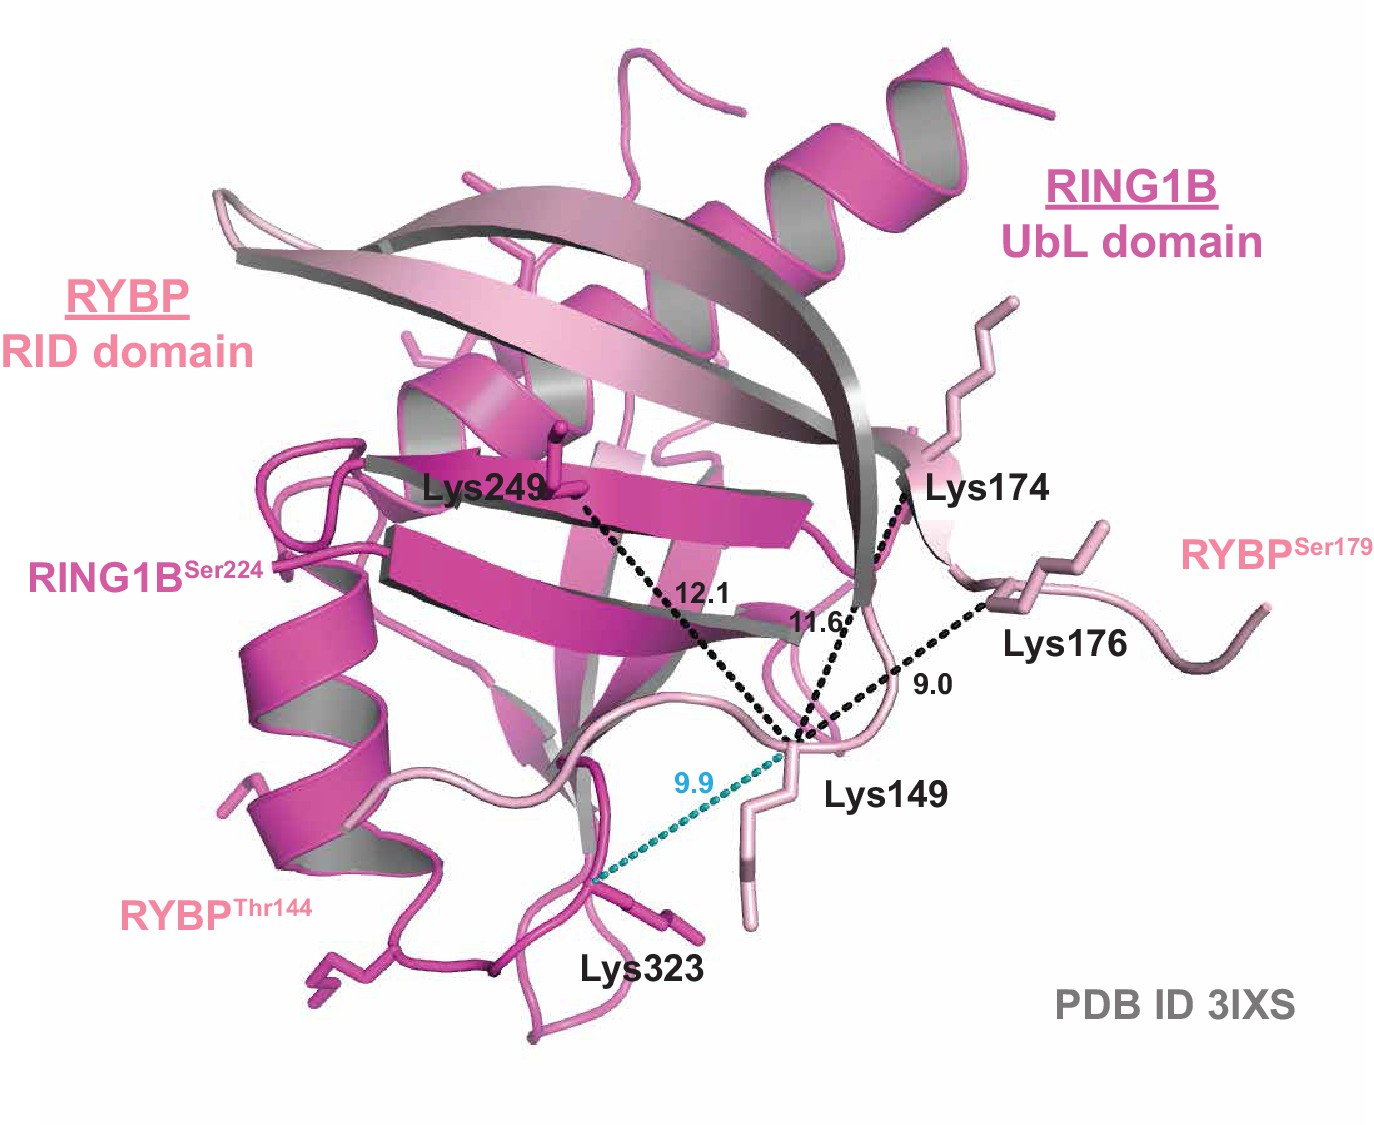
Crystal structure validation of crosslinking mass spectrometry-identified proximities.
A ribbon diagram of the crystal structure of the RING1B Ubiquitin-like (UbL) domain bound to the RYBP RING1B Interaction Domain (RID) (PDB ID: 3IXS). Experimentally identified high-confidence BS3 crosslinks are mapped onto the structure. Distances between lysine α-carbons are indicated in Angstroms. Black dotted lines indicate crosslinks identified in both the PCGF1-PRC1 holocomplex and the RING1B-RYBP-PCGF1 trimer, while blue dotted lines indicate crosslinks identified only in the RING1B-RYBP-PCGF1 trimer.
Figure 2 with 1 supplement

RYBP stimulates the catalytic core of PCGF1-PRC1.
(A) A histone H2AK119 E3 ligase assay monitoring the conversion of H2A to mono-ubiquitylated H2A by western blotting, which demonstrates that the activity of PCGF1-PRC1 requires E1 (UBE1), E2 (UBCH5C), Ubiquitin and ATP. The top panel monitors H2A mono-ubiquitylation with an antibody against total H2A that detects both mono-ubiquitylated and non-ubiquitylated H2A. The bottom panel monitors production of mono-ubiquitylated H2A with an antibody that specifically recognizes H2AK119ub1. (B) An E3 ligase activity assay directly comparing the PCGF1-RING1B catalytic core and the PCGF1-PRC1 holocomplex over increasing enzyme concentrations (two fold dilution series) as examined by western blotting. (C) An E3 ligase activity assay comparing the PCGF1-PRC1 holocomplex and various sub-complexes in which individual and combinations of PCGF1-PRC1 subunits have been omitted (see Figure 1D). This demonstrates that RYBP is the central determinant of E3 ligase activity for the PCGF1-PRC1 complex. The error bars correspond to the S.E.M. of at least two independent experiments.
Figure 2—figure supplement 1

YAF2 stimulates PCGF1-RING1B E3 ligase activity.
(A) Coomassie-stained gels showing the recombinant PCGF1-RING1B catalytic core affinity-purified via RING1B supplemented with recombinant RYBP or YAF2. (B) An H2AK119 E3 ubiquitin ligase activity assay comparing the relative activity of PCGF1-RING1B in the presence or absence of RYBP or YAF2. The error bars correspond to the S.E.M. of at least two independent experiments.
Figure 3 with 1 supplement

The PCGF1 catalytic dimer is inherently more active and stimulated more robustly than the PCGF4 catalytic dimer.
(A) Coomassie-stained gels showing the recombinant PCGF1-RING1B or PCGF4-RING1B catalytic cores with or without the addition of RYBP. Complexes were affinity-purified via RING1B. PCGF4 and RING1B migrate at the same position on the gel (Figure 3—figure supplement 1). (B) An E3 ligase activity assay comparing PCGF1-RING1B or PCGF4-RING1B in the presence or absence of RYBP. The error bars correspond to the S.E.M. of at least two independent experiments.
Figure 3—figure supplement 1
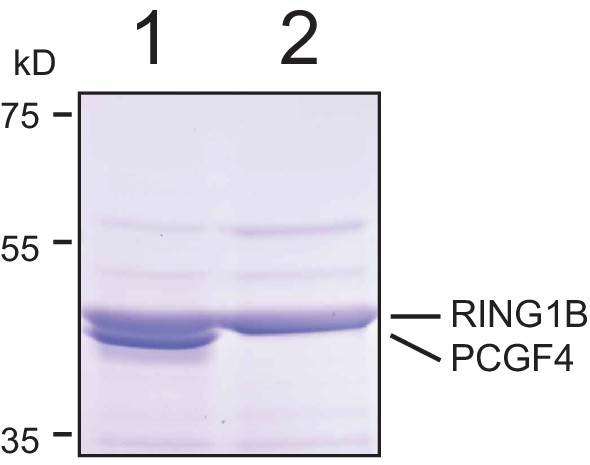
Resolution of RING1B/PCGF4 dimer by SDS-PAGE.
The affinity purified RING1B-PCGF4 dimer was separated by 4–12% SDS-PAGE (lane 1) and compared to RING1B alone (lane 2). Coomassie staining demonstrated the presence of two distinct protein species in the RING1B-PCGF4 dimer which correspond to RING1B and PCGF4.
Figure 4 with 1 supplement
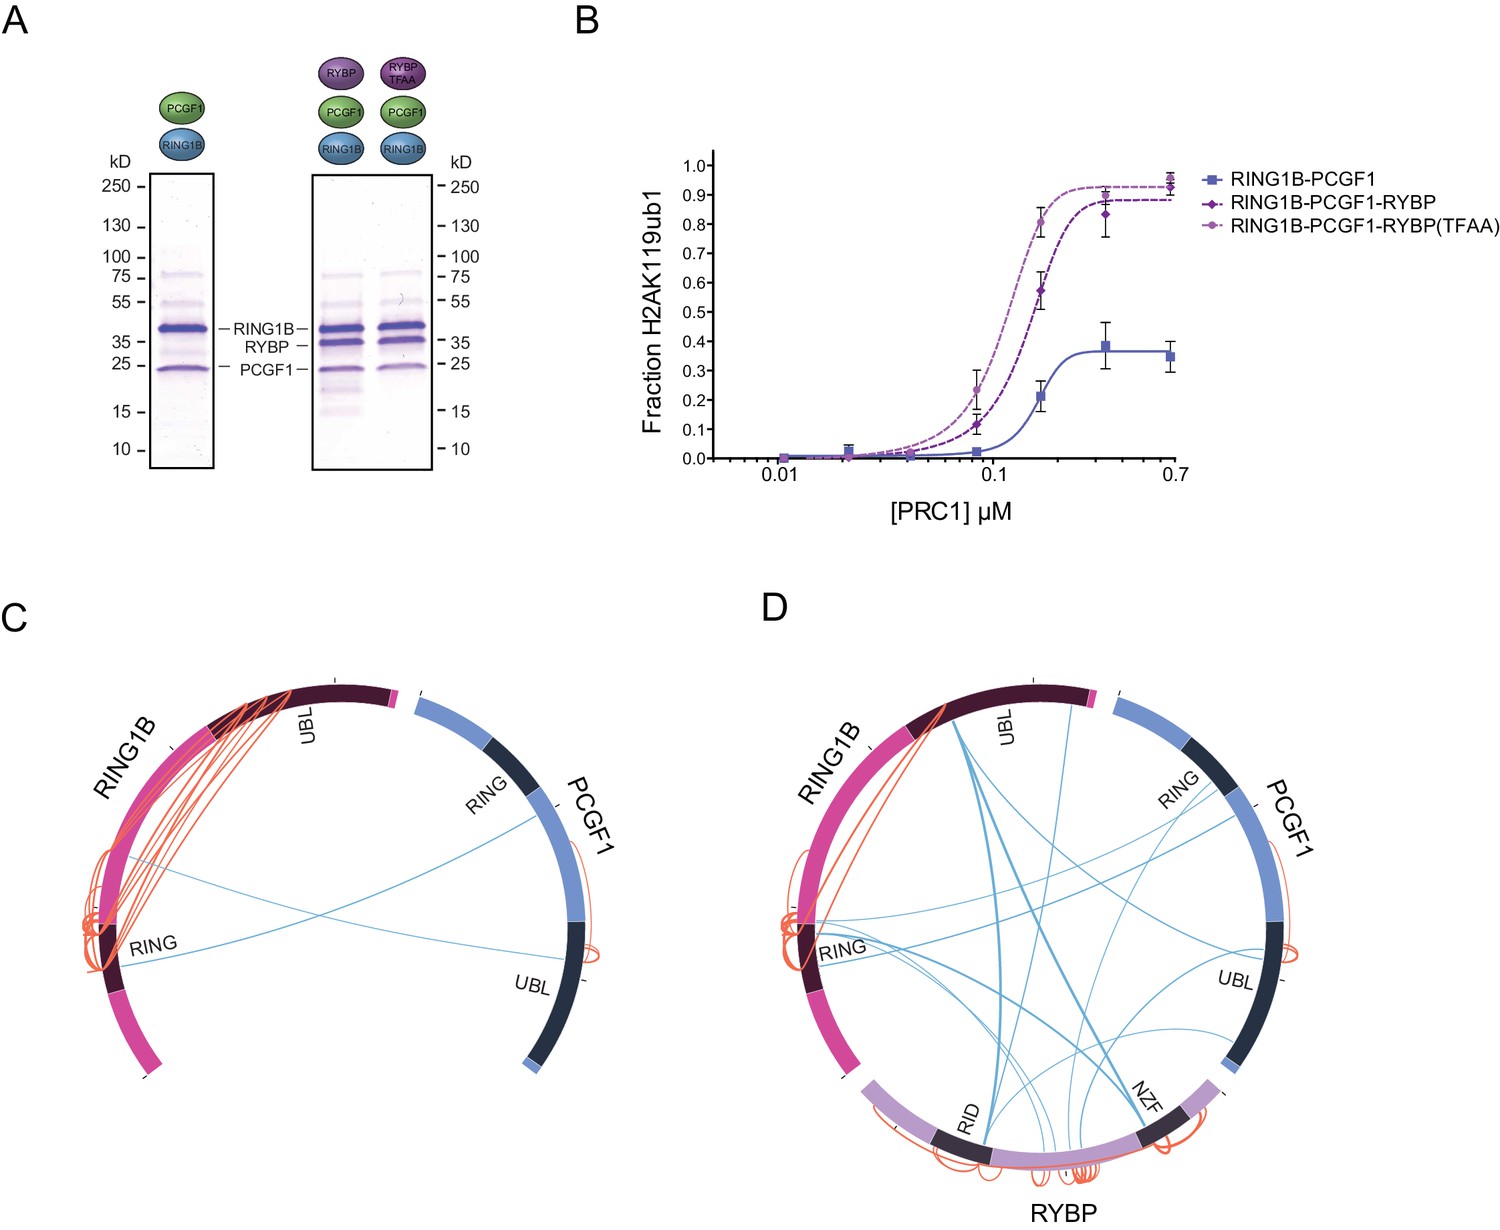
RYBP-dependent stimulation of PCGF1-PRC1 is associated with changes in the PCGF1-RING1B dimer but not ubiquitin binding.
(A) Coomassie-stained gels showing the recombinant PCGF1-RING1B affinity purified via RING1B with wildtype RYBP or a ubiquitin-binding mutant (RYBP TFAA). (B) An E3 ligase activity assay comparing the activity of PCGF1-RING1B with addition of RYBP or RYBP with mutations in the NZF domain (TF-AA) that abrogate ubiquitin binding. Error bars correspond to the S.E.M. of at least two independent experiments. (C–D) Circos plots illustrating crosslinking mass spectrometry analysis of PCGF1-RING1B in presence or absence of RYBP. In (C) extensive intramolecular crosslinks are observed between the RING1B RING and UBL domains. In (D) these intramolecular crosslinks are largely ablated in the presence of RYBP which makes extensive crosslinks with these regions of RING1B. Blue and orange lines indicate intermolecular and intramolecular crosslinks respectively. Lines are weighted by the statistical confidence of their interaction.
Figure 4—figure supplement 1
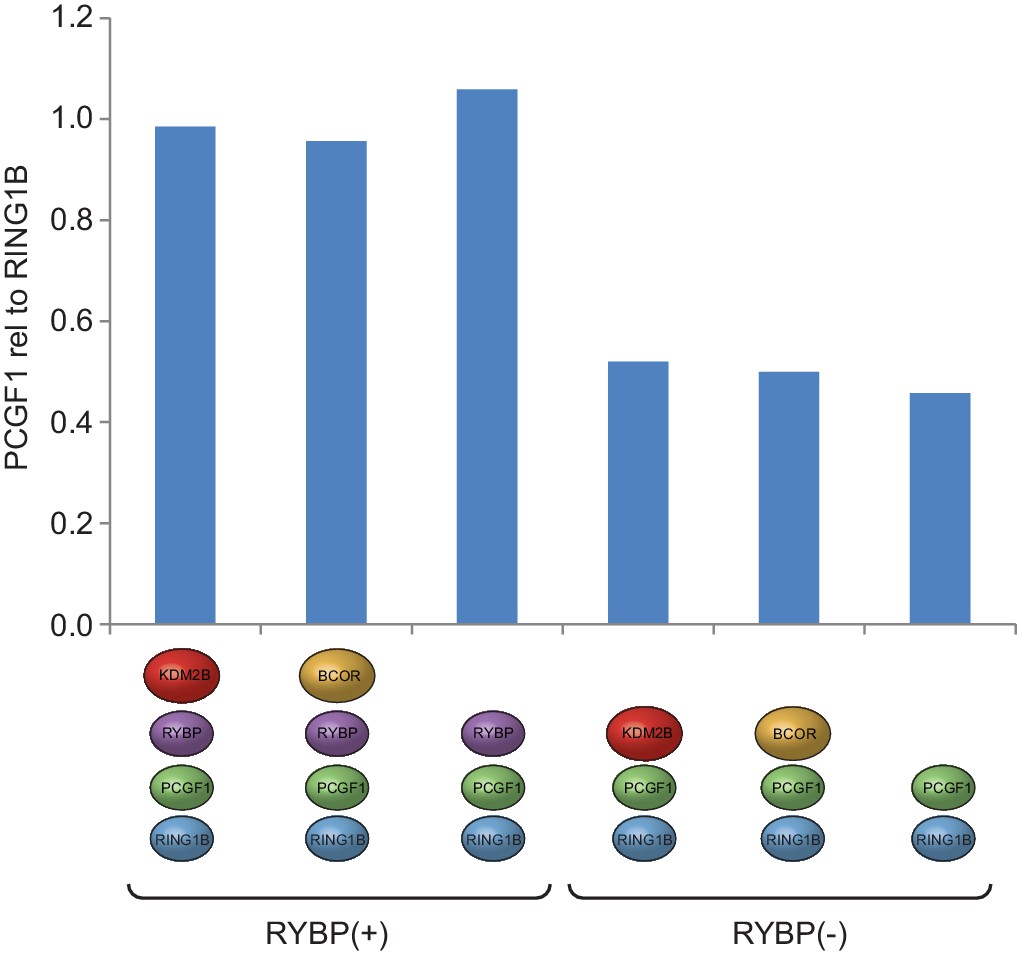
PCGF1 levels are reduced in complexes lacking RYBP.
Coomassie-stained gels of affinity-purified PCGF1-PRC1 complexes (see Figure 1D) were subjected to semi-quantitative densitometry analysis to examine the levels of PCGF1 in different PCGF1-PRC1 assemblies. This revealed a reduction in the relative amount of PCGF1 in complexes lacking RYBP.
Figure 5 with 1 supplement
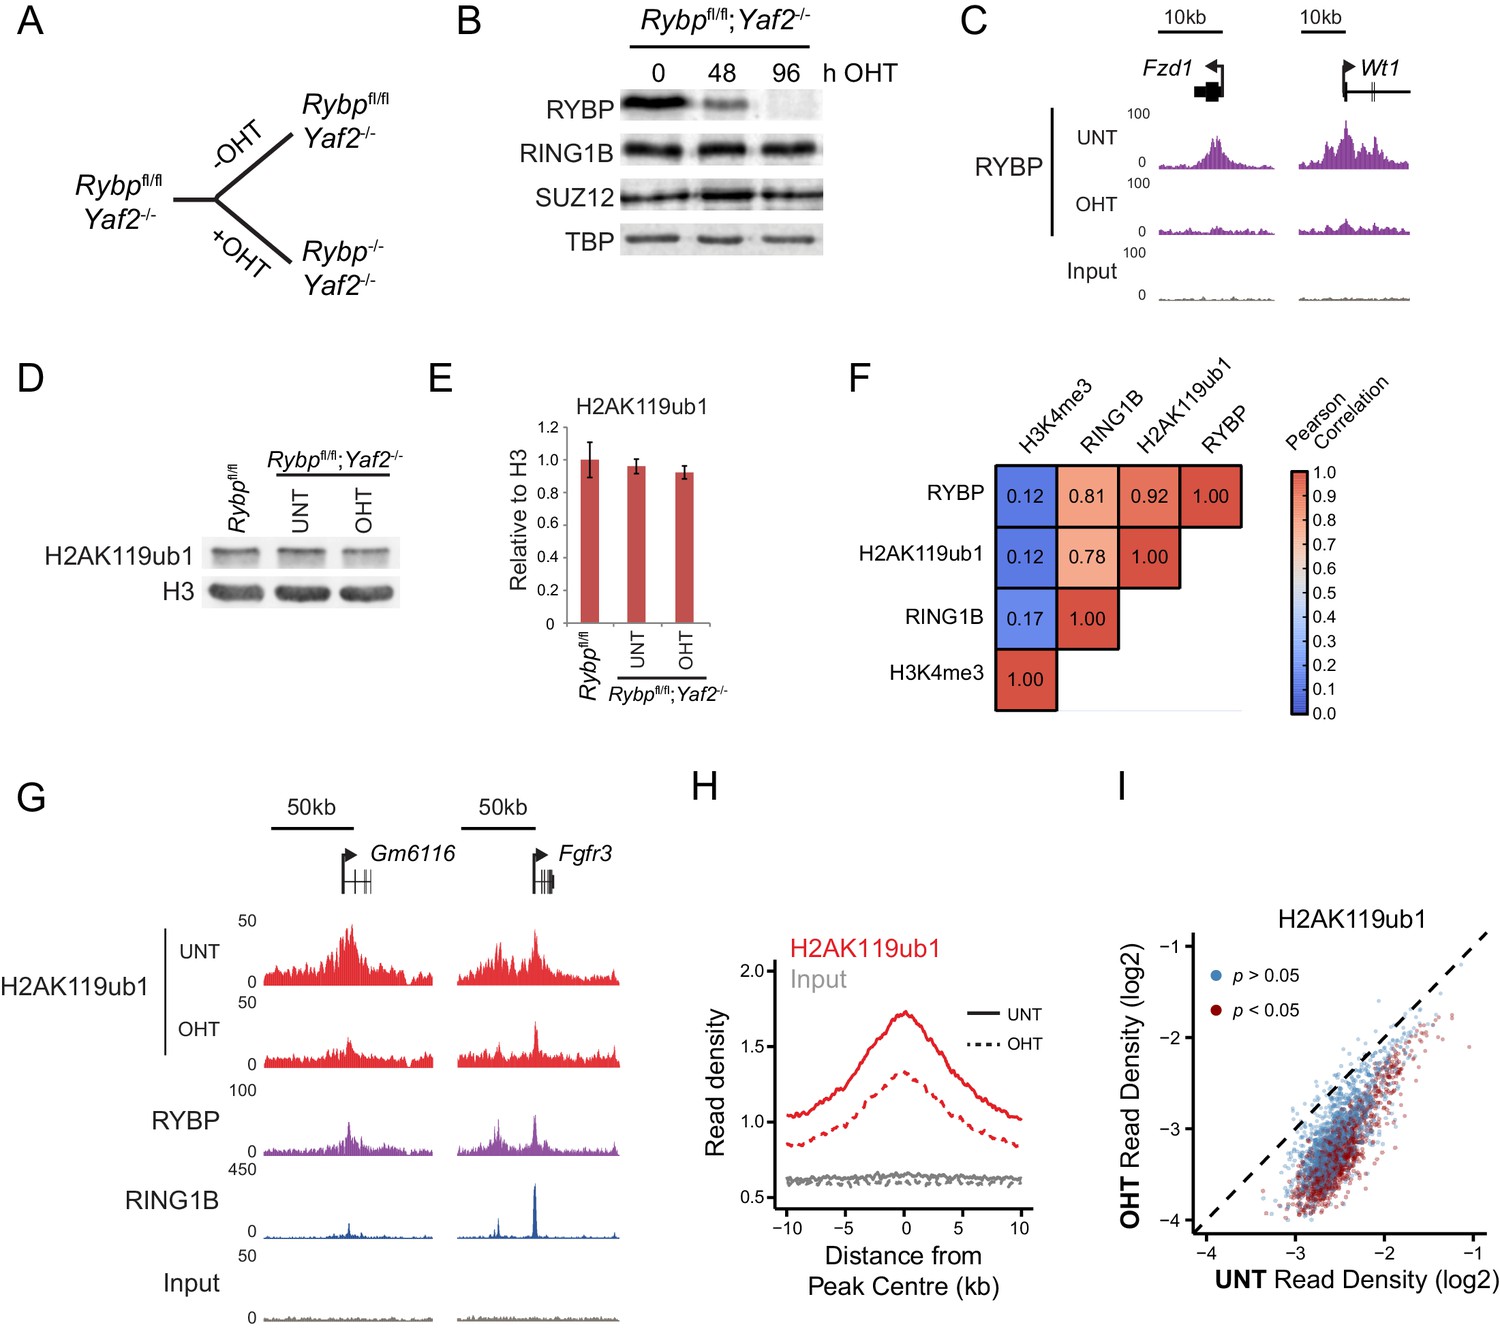
RYBP is required for H2AK119ub1 at PRC1 targets in vivo.
(A) A schematic illustrating the Rybpfl/fl;Yaf2−/− mouse embryonic stem cell model in which the addition of tamoxifen (OHT) leads to deletion of RYBP. (B) Western blot analysis demonstrating that treatment of Rybpfl/fl;Yaf2−/− cells with tamoxifen for 96 hr results in loss of RYBP protein. The levels of the PRC1 component, RING1B, and the PRC2 component, SUZ12, are unchanged. TATA Box Binding Protein (TBP) is included as a loading control. (C) A genomic snapshot from RYBP ChIP-seq analysis in Rybpfl/fl;Yaf2−/− cells before (UNT) and after 96 hr of tamoxifen treatment (OHT) showing that RYBP occupancy on chromatin is lost. (D) Western blot analysis of H2AK119ub1 in Rybpfl/fl ESCs, compared with Rybpfl/fl;Yaf2−/− cells before (UNT) and after 96 hr tamoxifen treatment (OHT). Western blot with a histone H3-specific antibody is shown as a loading control. (E) A quantitation of western blot analysis for H2AK119ub1 relative to histone H3 in Rybpfl/fl ESCs, compared with RYBP/YAF2 deletion indicating no global reduction in H2AK119ub1. Errors bars indicate standard deviation for three biological replicate experiments. (F) Genome-wide correlation of wildtype H2AK119ub1, RYBP, RING1B and H3K4me3 ChIP-seq using 10 kb windows. H2AK119ub1 ChIP-seq correlates well with RYBP and RING1B genome-wide. (G) A genomic snapshot of calibrated H2AK119ub1 ChIP-seq in the Rybpfl/fl;Yaf2−/− mouse embryonic stem cells before (UNT) and after 96 hr tamoxifen (OHT) treatment at two polycomb-occupied target sites indicating significant reductions in H2AK119ub1 in the absence of RYBP. (H) A metaplot illustrating calibrated H2AK119ub1 ChIP-seq read density at peaks of H2AK119ub1 (n = 2407) before (UNT-solid line) and after (OHT- dotted line) tamoxifen treatment. Removal of RYBP has a broad effect on H2AK119ub1. (I) A scatter plot of normalised read densities for calibrated H2AK119ub1 ChIP-seq illustrates reduced H2AK119ub1 signal at nearly all H2AK119ub1 peaks in OHT-treated Rybpfl/fl;Yaf2−/− cells (OHT) when compared to untreated cells (UNT). Red dots correspond to statistically significant reductions in H2AK119ub1.
Figure 5—figure supplement 1

CRISPR-Cas9-mediateddeletion of Yaf2 in Rybpfl/fl ESCs.
(A) A schematic depicting CRISPR-Cas9 guides used to delete Yaf2 and generate Rybpfl/fl;Yaf2−/− mouse embryonic stem cells. Cas9 guides were designed to make an approximately 680 bp deletion which removes exons 1 and 2 of Yaf2. This results in a loss of the Yaf2 translation start site, and the 5’ portion of the coding sequence. (B) Quantitative RT-PCR confirms deletion of Yaf2 mRNA in Rybpfl/fl;Yaf2−/− mouse embryonic stem cells. (C) Western blot analysis of Rybpfl/fl;Yaf2−/− mouse embryonic stem cells confirms loss of YAF2 protein. Western blot with an RYBP-specific antibody is shown as a control.
Figure 6 with 2 supplements
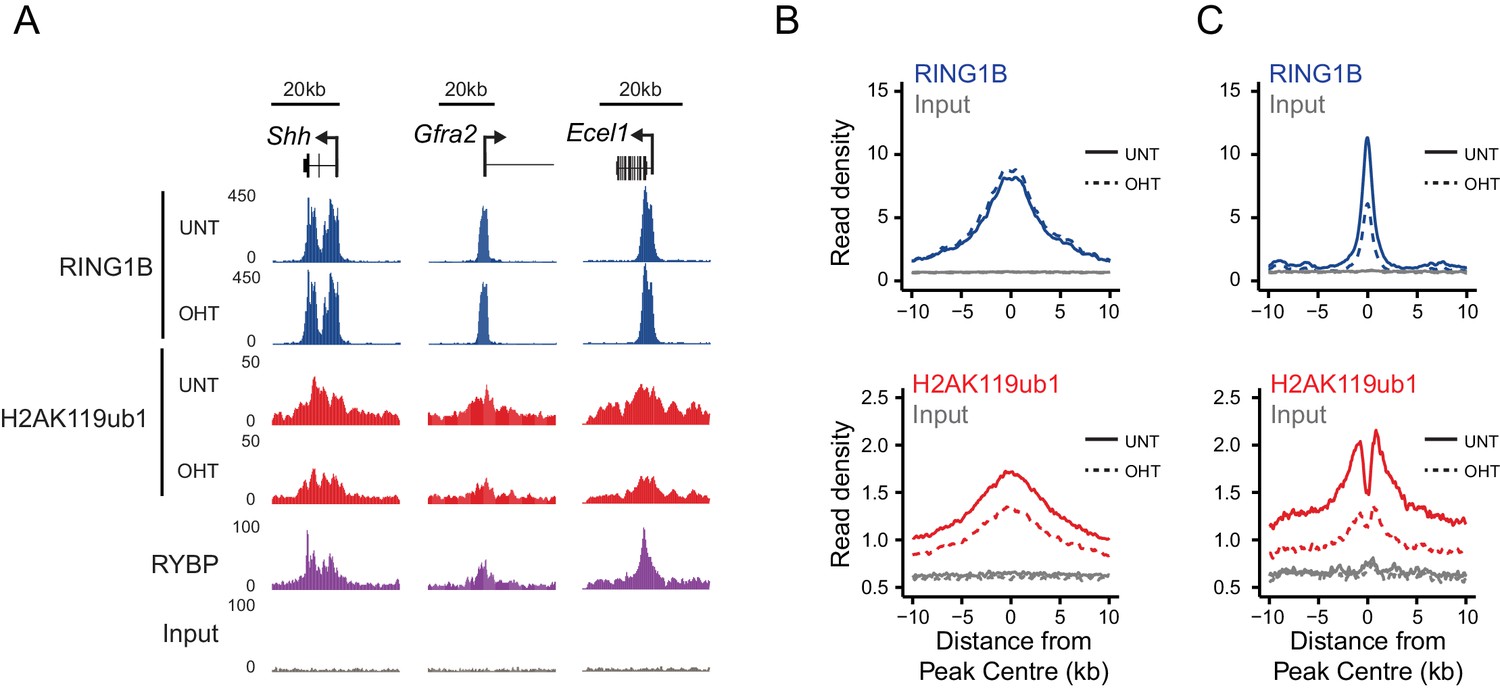
RYBP regulates the activity, not chromatin occupancy, of PRC1 in vivo.
(A) A genomic snapshot of RING1B and H2AK119ub1 ChIP-seq in Rybpfl/fl;Yaf2−/− mouse embryonic stem cells before (UNT) and after 96 hr tamoxifen (OHT) treatment demonstrates that decreases in H2AK119ub1 occur in the absence of altered RING1B occupancy. (B–C) Metaplots illustrating H2AK119ub1 and RING1B ChIP-seq read density at H2AK119ub1 peaks with (n = 487) or without (n = 1870) significant reductions in RING1B occupancy before (UNT-solid line) and after tamoxifen treatment (OHT-dotted line). RYBP loss affects the levels of H2AK119ub1 (B-bottom panel) even though RING1B occupancy is unaffected (B-upper panel) indicating RYBP stimulates PRC1 activity at target sites in vivo.
Figure 6—figure supplement 1
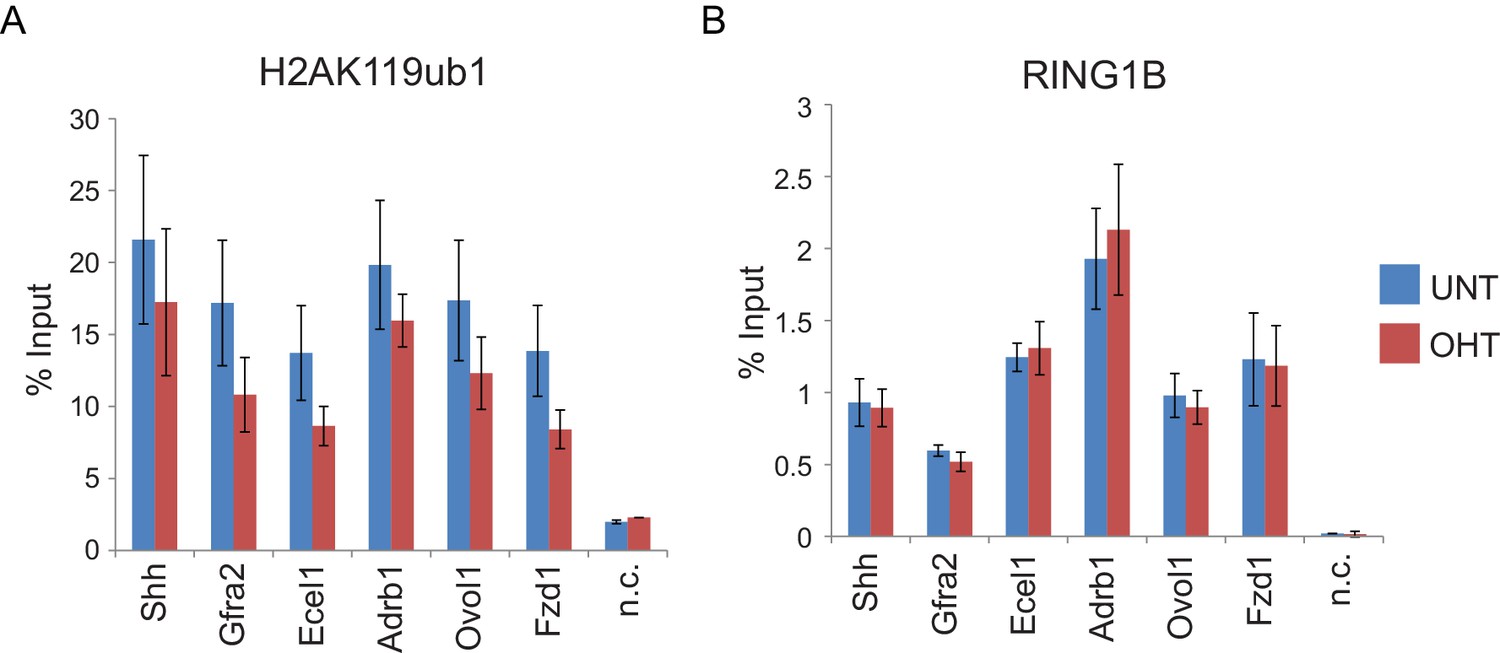
RYBP deletion results in reductions in H2AK119ub1 at sites where PRC1 occupancy remains unchanged.
(A) ChIP-qPCR based analysis validating the reductions in H2AK119ub1 observed by calibrated ChIP-seq in Rybpfl/fl;Yaf2−/− mouse embryonic stem cells before (UNT) and after 96 hr tamoxifen (OHT) treatment at a series of PcG target genes. n.c. corresponds to a non-target control region. ChIP experiments were performed in biological triplicate and error bars represent S.E.M. (B) ChIP-qPCR based analysis validating the retention of PRC1 (RING1B) at sites that show reductions in H2AK119ub1 in Rybpfl/fl;Yaf2−/− mouse embryonic stem cells before (UNT) and after 96 hr tamoxifen (OHT) treatment. n.c. corresponds to a non-target control region. ChIP experiments were performed in biological triplicate and error bars represent S.E.M.
Figure 6—figure supplement 2
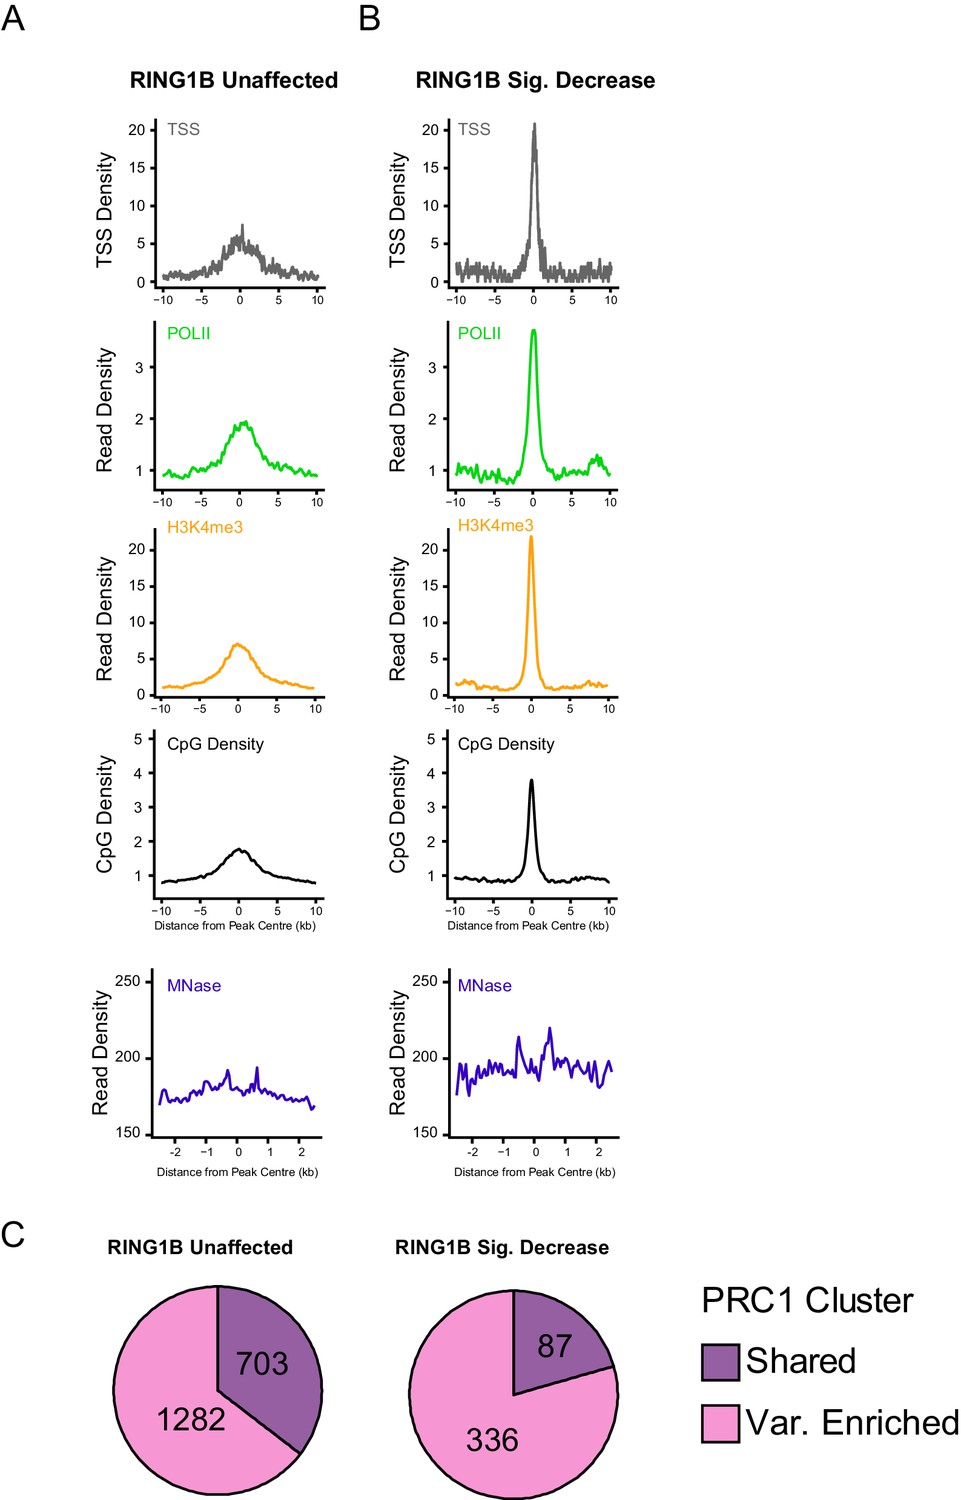
An examination of genomic features at PRC1 targets that retain, or lose, RING1B following deletion of RYBP/YAF2.
(A–B) Metaplots illustrating a series of genomic features at H2AK119ub1 peaks with (n = 487) or without (n = 1870) significant reductions in RING1B occupancy in the Rybpfl/fl;Yaf2−/− mouse embryonic stem cells, as depicted in Figure 6. The features profiled include TSS position (TSS), RNA polymerase II (POLII), H3K4me3, CpG density, and nucleosome positioning by MNase-seq. (C) Pie charts indicating whether sites examined in A and B were variant-enriched or shared PRC1 target sites.
Figure 7 with 1 supplement
RYBP-dependent stimulation is essential for H2AK119ub1 at sites with low PRC1 occupancy.
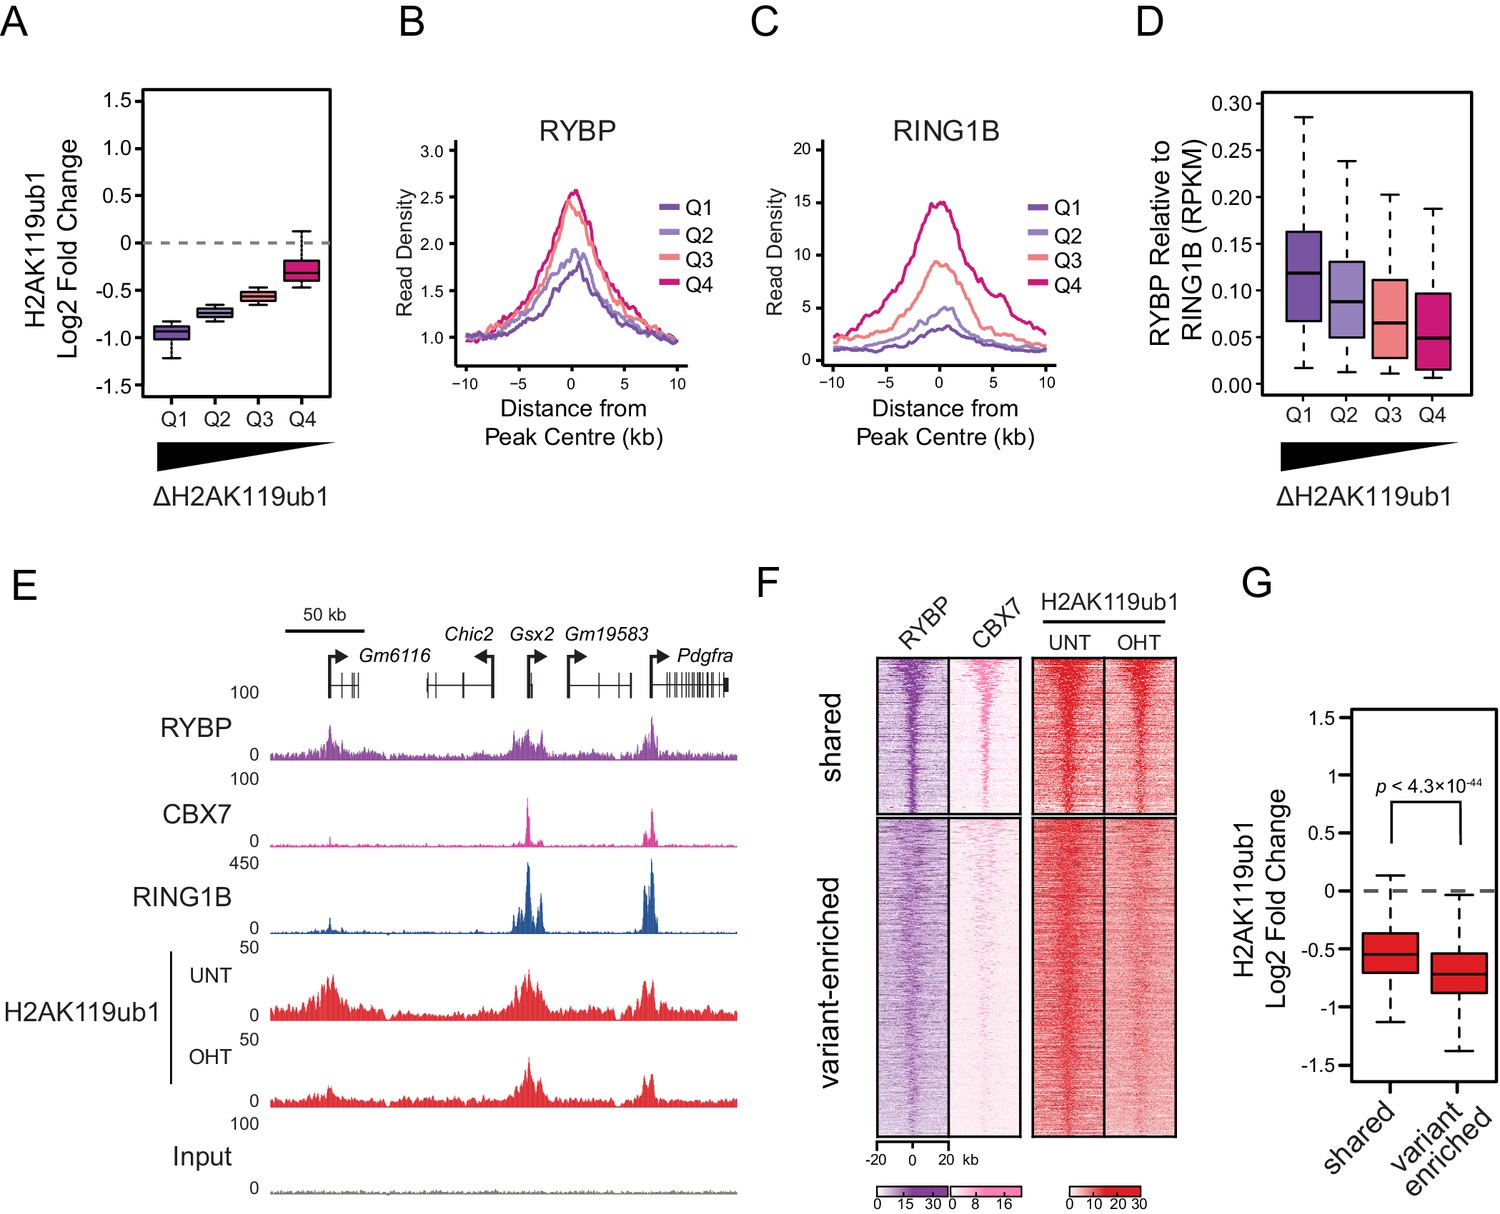
(A) A box plot illustrating the separation of H2AK119u1 peaks into quartiles based on their relative reduction in H2AK119ub1 upon deletion of RYBP. This indicates that all H2AK119ub1 peaks experience a decrease in H2AK119ub1 following RYBP removal, but some sites (e.g. Q1) are more dependent upon RYBP than others (e.g. Q4) (B–C) Metaplots illustrating the RYBP and RING1B ChIP-seq read density over the H2AK119ub1 quartiles identified in (A). Quartiles that are most dependent on RYBP for H2AK119ub1 (i.e. Q1 and Q2) have lower RYBP and RING1B occupancy. (D) A box plot illustrating that the quartiles which are most dependent on RYBP have the largest enrichment of RYBP relative to RING1B. (E) A genomic snapshot depicting three polycomb target sites which display varying dependencies on RYBP for their H2AK119ub1. The Gm6116 gene (highlighted in grey) has low occupancy of RING1B and CBX7, and is almost completely reliant on RYBP for H2AK119ub1. In contrast the Gsx2 and Pdgfra genes have high RING1B and CBX7 occupancy and are less dependent on RYBP for their H2AK119ub1. This indicates that RYBP plays a more pronounced role stimulating PRC1 activity at sites with limiting levels of RING1B. Furthermore, sites that are highly dependent on RYBP appear to be depleted of canonical PRC1. (F) A heatmap illustrating H2AK119ub1 peaks clustered into variant-enriched PRC1 and variant and canonical PRC1 (shared) sites based on RYBP (variant PRC1) and CBX7 (canonical PRC1) levels. Both variant-enriched and shared PRC1 target sites show a reduction in H2AK119ub1 following deletion of RYBP. (G) A box plot indicating the alterations in H2AK119ub1 at shared or variant-enriched PRC1 target sites. The p value denotes statistical significance calculated by a Wilcoxon signed rank test.
Figure 7—figure supplement 1
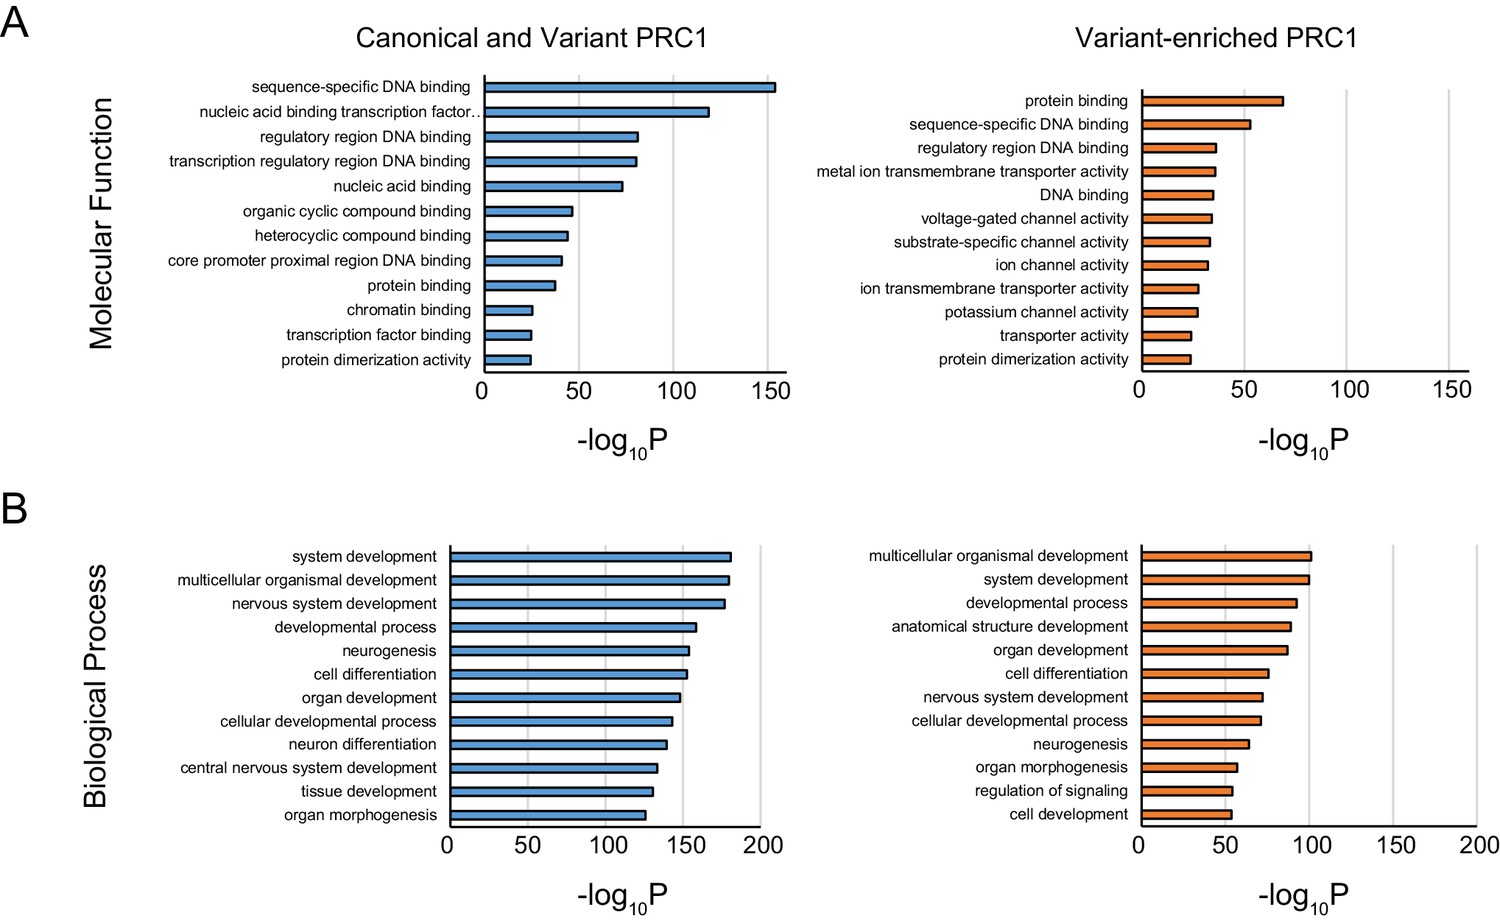
Gene ontology analysis of shared and variant-enriched PRC1 target sites.
(A) Gene ontology (GO) analysis of Molecular Function term enrichment at genes associated with shared or variant-enriched PRC1 target sites. (B) GO analysis as in (A) but using Biological Process term enrichments.
Figure 8 with 2 supplements
RYBP-dependent H2AK119ub1 shapes PRC2 activity.
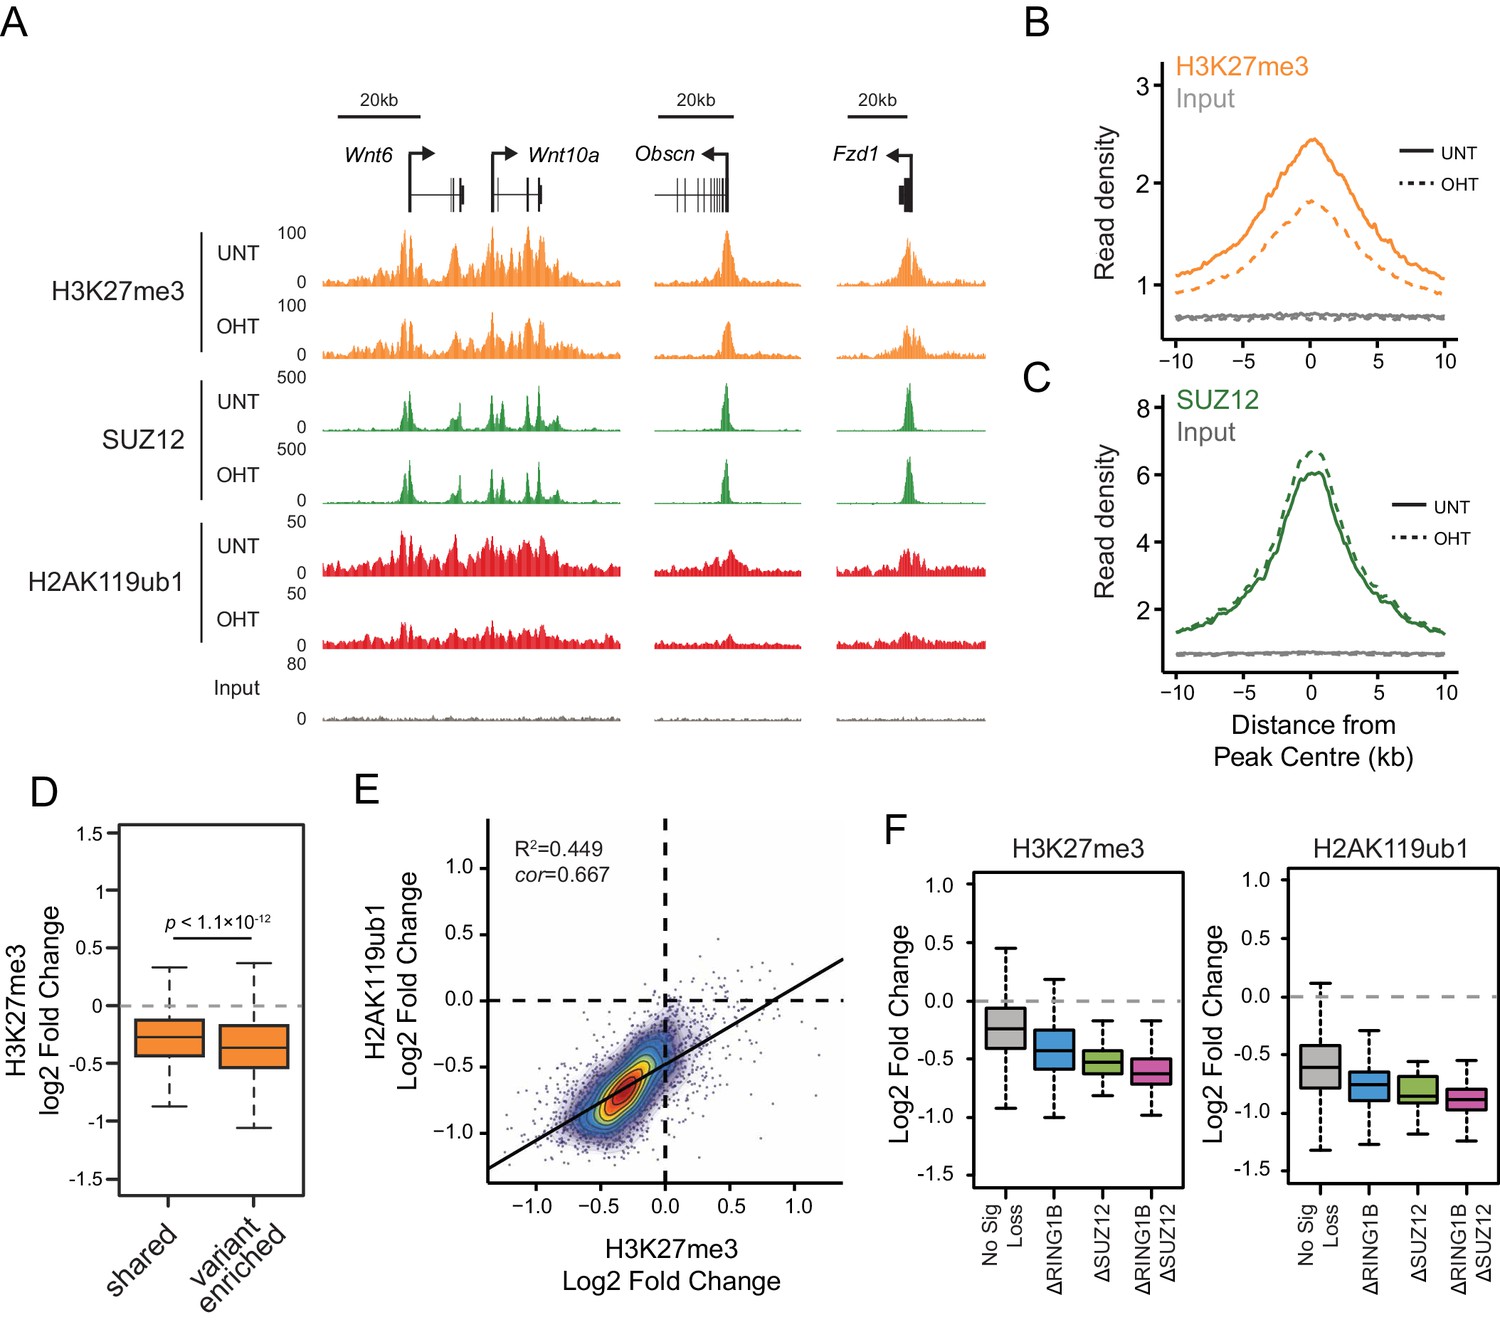
(A) A genomic snapshot of H3K27me3, SUZ12 and H2AK119ub1 ChIP-seq in Rybpfl/fl;Yaf2−/− mouse embryonic stem cells before (UNT) and after tamoxifen (OHT) treatment. At these target sites there are reductions in H3K27me3 in the absence of changes in SUZ12 occupancy following RYBP deletion. (B-C) Metaplots illustrating ChIP-seq read density for H3K27me3 (B) and SUZ12 (C) in the Rybpfl/fl;Yaf2−/− mouse embryonic stem cells before (UNT-solid line) and after tamoxifen (OHT-dotted line) treatment. Removal of RYBP results in widespread loss of H3K27me3 despite largely unaffected occupancy of SUZ12. (D) A box plot indicating the alterations in H3K27me3 at shared or variant-enriched PRC1 target sites. The p value denotes statistical significance calculated by a Wilcoxon signed rank test. (E) A scatter plot showing changes in H2AK119ub1 and H3K27me3 normalised read densities at H2AK119ub1 peaks after deletion of RYBP. This illustrates that the fold change in H2AK119ub1 and H3K27me3 are related to each other at individual sites following loss of RYBP. R2 and cor denote coefficient of determination for linear regression model and the pearson correlation coefficient respectively. (F) A box plot illustrating the changes in H2AK119ub1 and H3K27me3 at H2AK119ub1 peaks divided into groups based on whether RYBP deletion resulted in no significant loss of RING1B or SUZ12 (No Sig Loss, n = 1947), loss of RING1B only (△RING1B, n = 319), loss of SUZ12 only (△SUZ12, n = 38) or loss of both RING1B and SUZ12 (△RING1B △SUZ12, n = 103). This indicates that sites susceptible to loss of RING1B and/or SUZ12 experience the greatest relative reductions in H2AK119ub1 and H3K37me3.
Figure 8—figure supplement 1
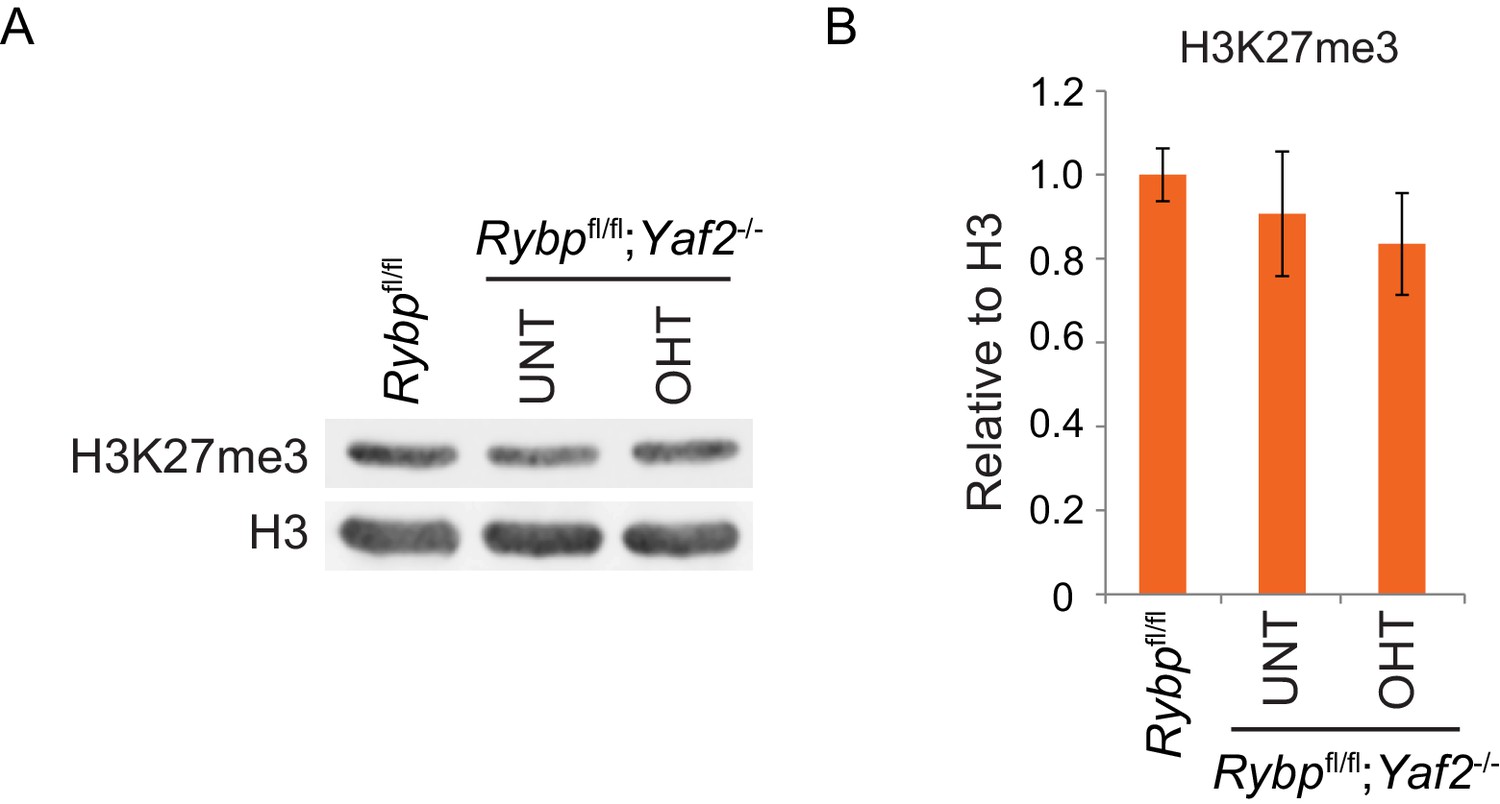
Analysis of H3K27me3 levels following loss of RYBP/YAF2.
(A) Western blot analysis of H3K27me3 in Rybpfl/fl ESCs, and Rybpfl/fl;Yaf2−/− cells before (UNT) and after 96 hr tamoxifen treatment (OHT). An H3-specific antibody was used as a loading control. (B) A quantitation of western blot analysis for H3K27me3 relative to histone H3 following RYBP/YAF2 deletion. Errors bars indicate S.E.M. from four biological replicate experiments.
Figure 8—figure supplement 2
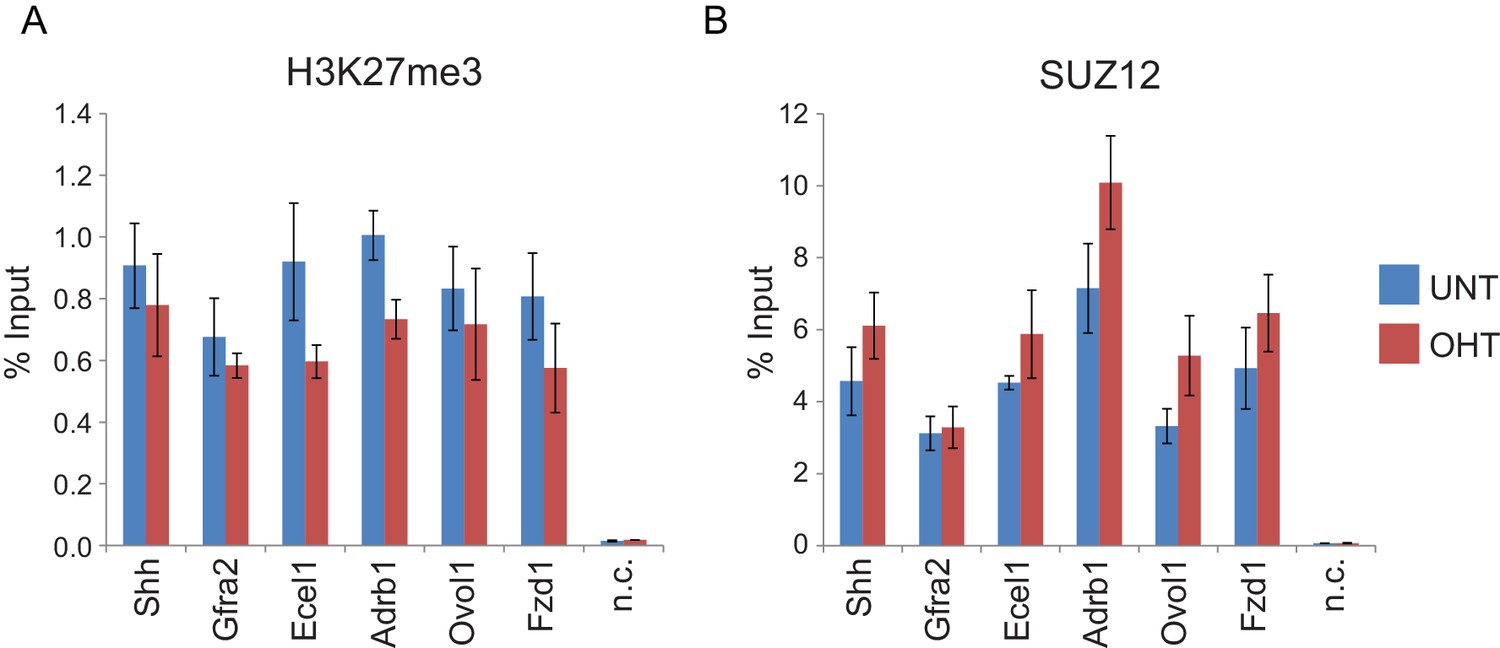
RYBP deletion results in reductions in H3K27me3, without decreases in PRC2 occupancy.
(A) ChIP-qPCR based analysis validating the reductions in H3K27me3 observed by calibrated ChIP-seq in Rybpfl/fl;Yaf2−/− mouse embryonic stem cells before (UNT) and after 96 hr tamoxifen (OHT) treatment at a series of PcG target genes. n.c. corresponds to a non-target control region. ChIP experiments were performed in biological triplicate and error bars represent S.E.M. (B) ChIP-qPCR based analysis validating the retention of PRC2 (SUZ12) at sites that show reductions in H3K27me3 in Rybpfl/fl;Yaf2−/− mouse embryonic stem cells before (UNT) and after 96 hr tamoxifen (OHT) treatment. n.c. corresponds to a non-target control region. ChIP experiments were performed in biological triplicate and error bars represent S.E.M.
Figure 9 with 3 supplements
Loss of RYBP culminates in gene reactivation at sites where Polycomb chromatin domains are compromised.
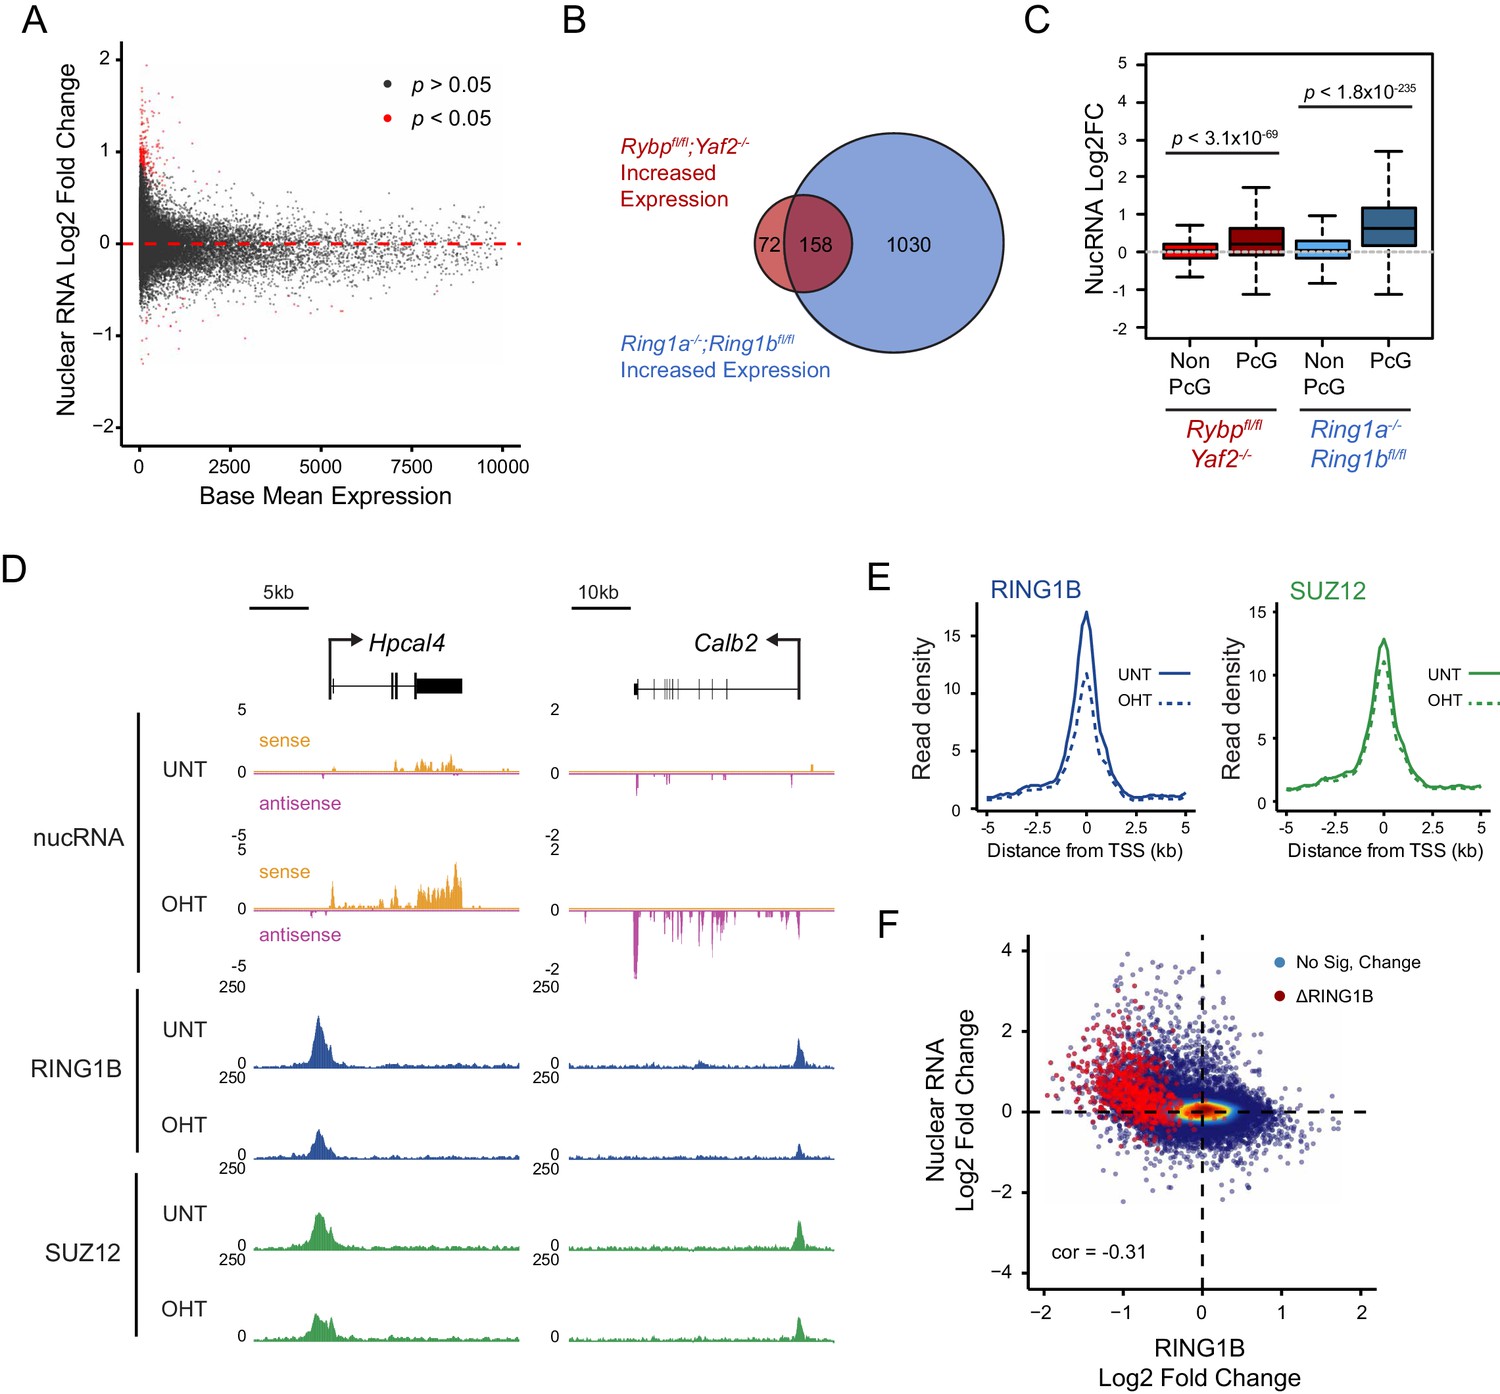
(A) An MA plot illustrating differential gene expression analysis based on nuclear RNA (nucRNA)-seq in the Rybpfl/fl;Yaf2−/− mouse embryonic stem cells before and after tamoxifen treatment. Log2 fold change of nucRNA is plotted against mean transcriptional level in wildtype cells. Significance values represent adjusted p values calculated by DESeq2. (B) A Venn diagram illustrating that genes upregulated after deletion of RYBP are a subset of genes upregulated upon deletion of the PRC1 catalytic core proteins RING1A/RING1B. (C) A box plot comparing the log2 fold change in nucRNA levels following loss of RYBP or RING1A/RING1B at TSS marked by H2AK119ub1 peaks (PcG; n = 1490) or TSS without H2AK119ub1 (Non-PcG; n = 12,911). This reveals that Polycomb target TSS are the most affected genes, and that the average level of upregulation after loss of RYBP is less than the upregulation following deletion of RING1A/RING1B. p values denote statistical significance calculated with Wilcoxon signed rank test. (D) A genomic snapshot of two genes upregulated following loss of RYBP. RNA-seq reads are separated by strand. Following RYBP deletion, both genes exhibit reductions in TSS-associated RING1B and SUZ12, as illustrated by ChIP-seq for RING1B and SUZ12 before (UNT) and after tamoxifen (OHT) treatment. (E) Metaplots illustrating that TSS occupancy of RING1B and SUZ12 are reduced after deletion of RYBP/YAF2 at upregulated genes (n = 230). (F) A scatter plot illustrating that increases in gene expression broadly correlate with decreases in RING1B occupancy at the TSS (±500 bp). Significant reductions in RING1B are depicted as red dots.
Figure 9—figure supplement 1
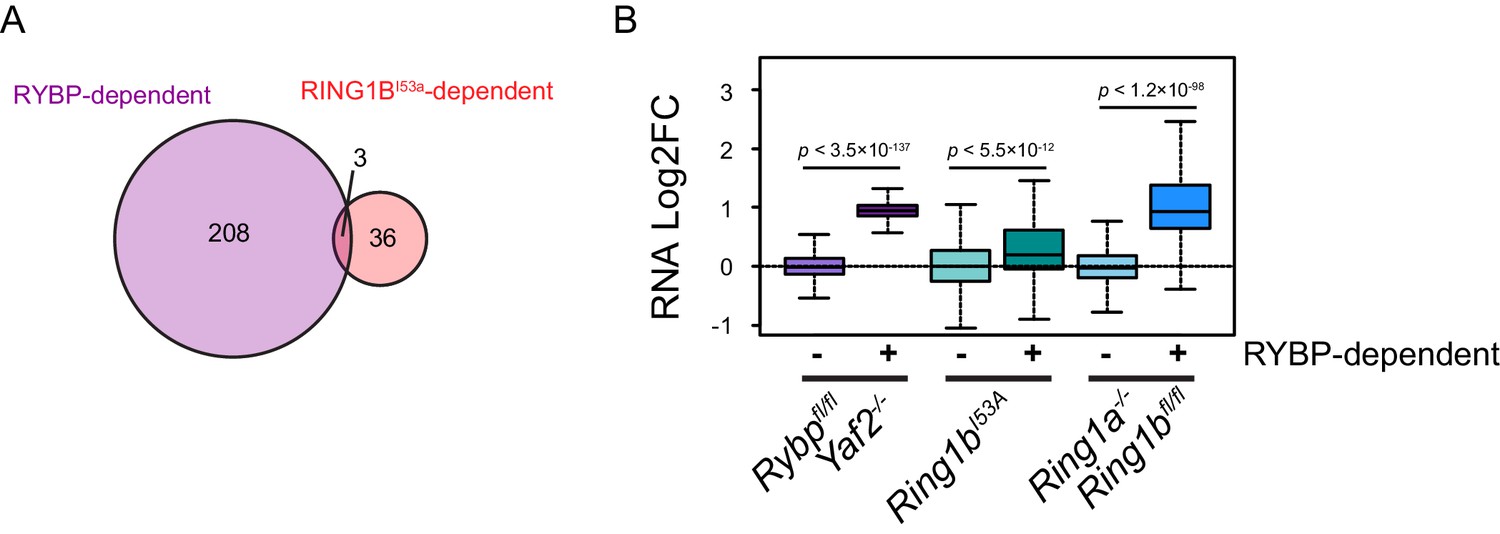
A Comparison of RYBP-dependent gene expression changes with RING1BI53A gene expression changes.
(A) A Venn diagram illustrating the overlap between significant increases in gene expression that result from RYBP deletion in Rybpfl/fl;Yaf2−/− mouse embryonic stem cells and significant increases in gene expression that occur in mouse ESCs expressing a catalytically inactive form of RING1B (Ring1bI53A) ( Illingworth et al., 2015). (B) A quantitation of gene expression changes that occur in the Rybpfl/fl;Yaf2−/−, Ring1bI53Aand Ring1a−/−;Ring1bfl/fl lines at genes which are unaffected (−) or significantly increase in expression (+) following removal of RYBP in Rybpfl/fl;Yaf2−/− mouse embryonic stem cells. p denotes statistical significance calculated using Wilcoxon Rank Sum test.
Figure 9—figure supplement 2
Genes up-regulated following deletion of RYBP/YAF2 are not unique to shared or variant-enriched PRC1 target sites.
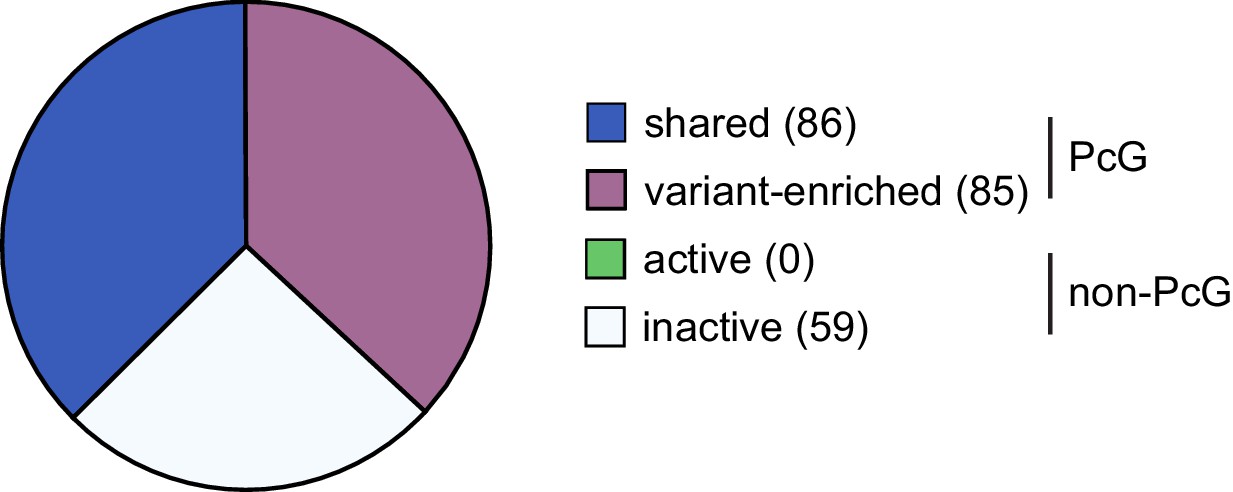
Genes up-regulated following removal of RYBP in Rybpfl/fl;Yaf2−/− cells were classified as either PcG target sites or non-PcG target sites. These sites were further segregated into shared or variant-enriched PcG target sites and active or inactive non-PcG target sites. This revealed that genes upregulated following RYBP removal were not unique to either shared or variant-enriched PcG target sites.
Figure 9—figure supplement 3
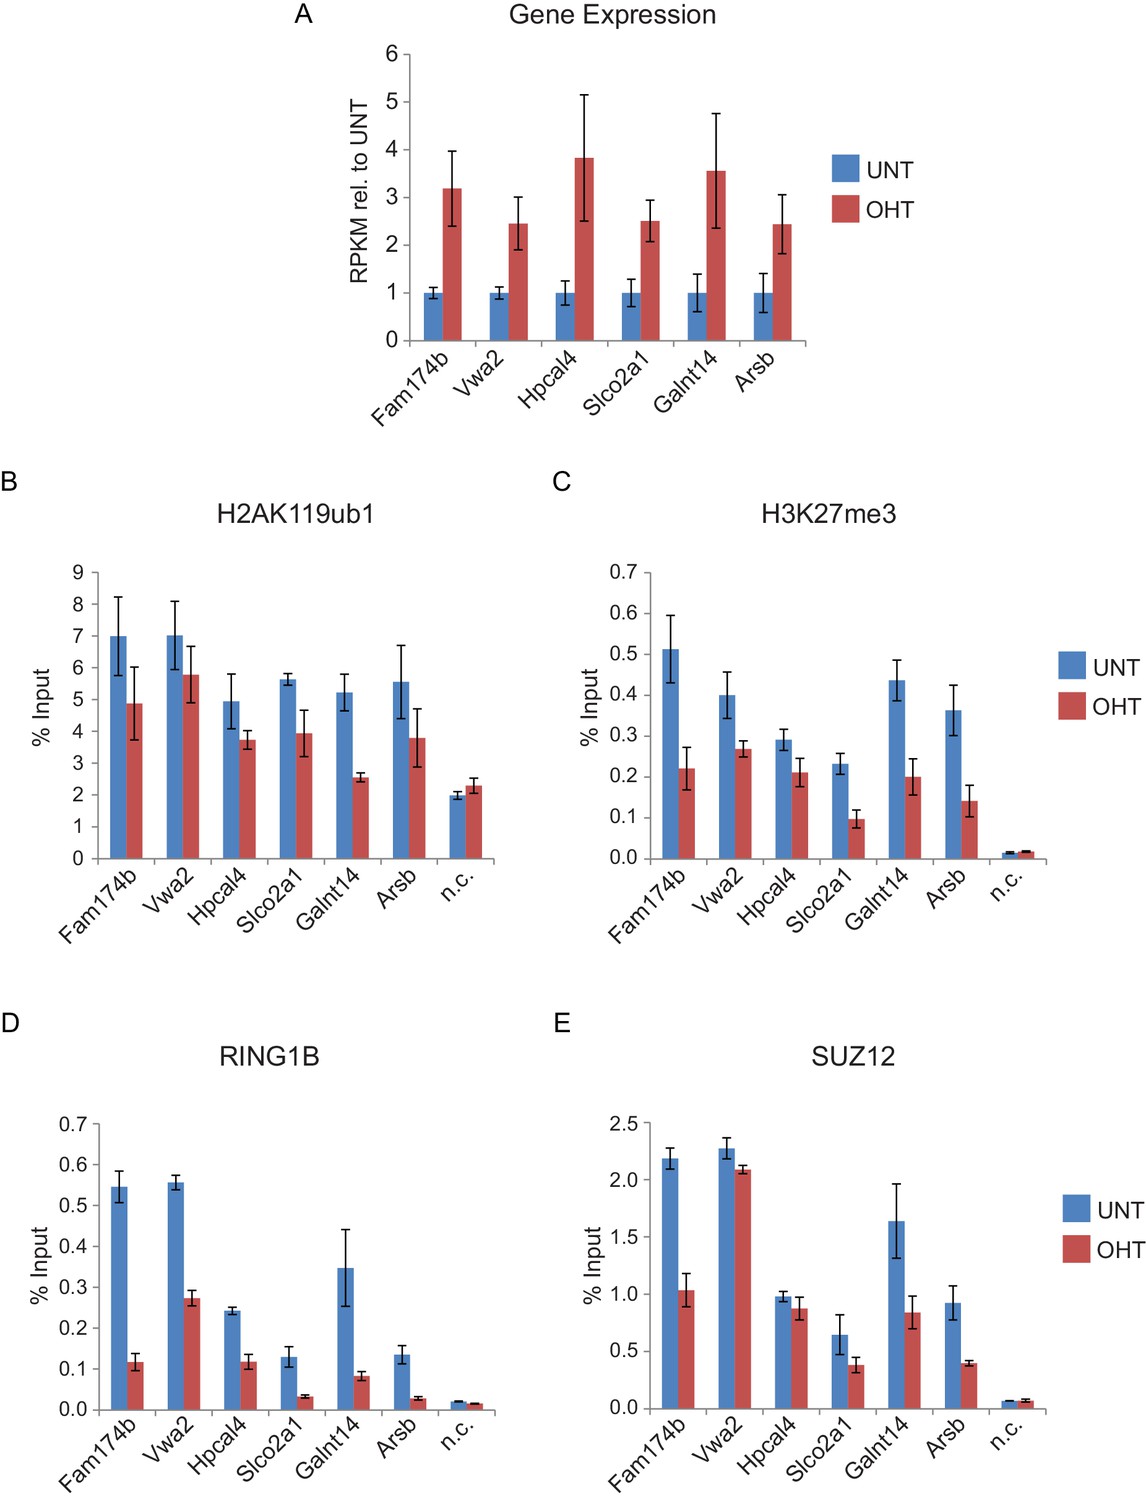
Genes that are reactivated in response to RYBP deletion exhibit polycomb domain erosion.
(A) A panel of genes which exhibited significant increases in transcription in response to RYBP removal were identified and their reads per kilobase per million (RPKM) values for tamoxifen-treated (OHT) relative to untreated (UNT) cells were examined. The bar graphs represent read information from three biological replicate RNA-seq experiments and error bars represent S.E.M. (B-E) ChIP-qPCR based analysis was carried out to examine the effects on (B) H2AK119ub1, (C) H3K27me3, (D) RING1B, and (E) SUZ12 which occurred at the target genes identified in (A) following RYBP removal (OHT) in the Rybpfl/fl;Yaf2−/− mouse embryonic stem cells. In all cases upregulated genes displayed a loss of H2AK119ub1 and H3K27me3. In agreement with the ChIP-seq analysis for RING1B and SUZ12 at this class of reactivated genes (Figure 9D and E), our single gene ChIP quantitative PCR analysis validated that these sites usually also display reductions PRC1 (RING1B) and PRC2 (SUZ12) binding, albeit with losses of RING1B being more apparent than SUZ12. n.c. corresponds to a non-target control region. ChIP experiments were performed in biological triplicate and error bars represent S.E.M.
Author response image 1
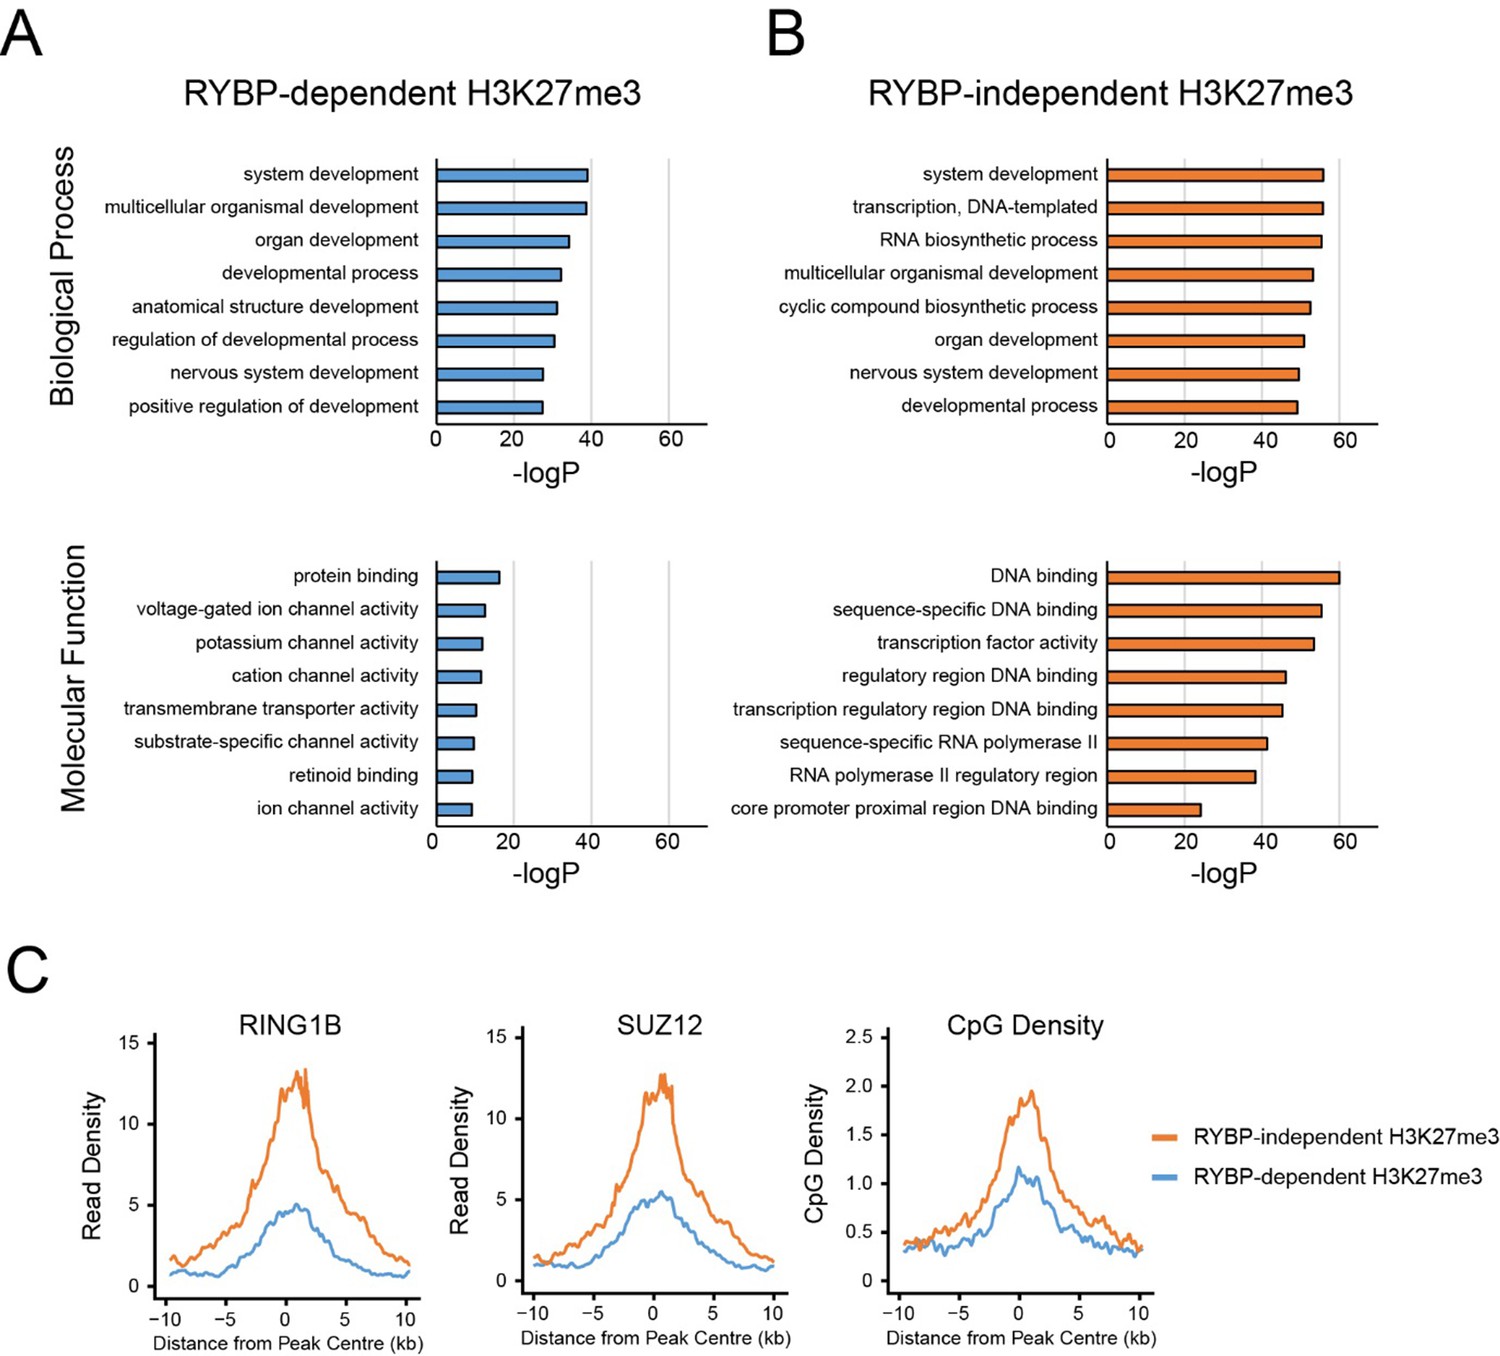
GO analysis of RYBP-dependent and –independent H3K27me3 genes.
(A,B) PRC1 target genes with the largest reductions in H3K27me3 (RYBP-dependent H3K27me3; Top 25%), or the PRC1 targets with the smallest reductions in H3K27me3 (RYBP-independent) were used for gene ontology analysis using HOMER. (C) Metaplot analysis at PRC1 target sites with RYBP-dependent or RYBP-independent H3K27me3. This reveals that RYBP-independent H3K27me3 is associated with the largest polycomb domains, as measured by RING1B, SUZ12 and CpG density.
Author response image 2
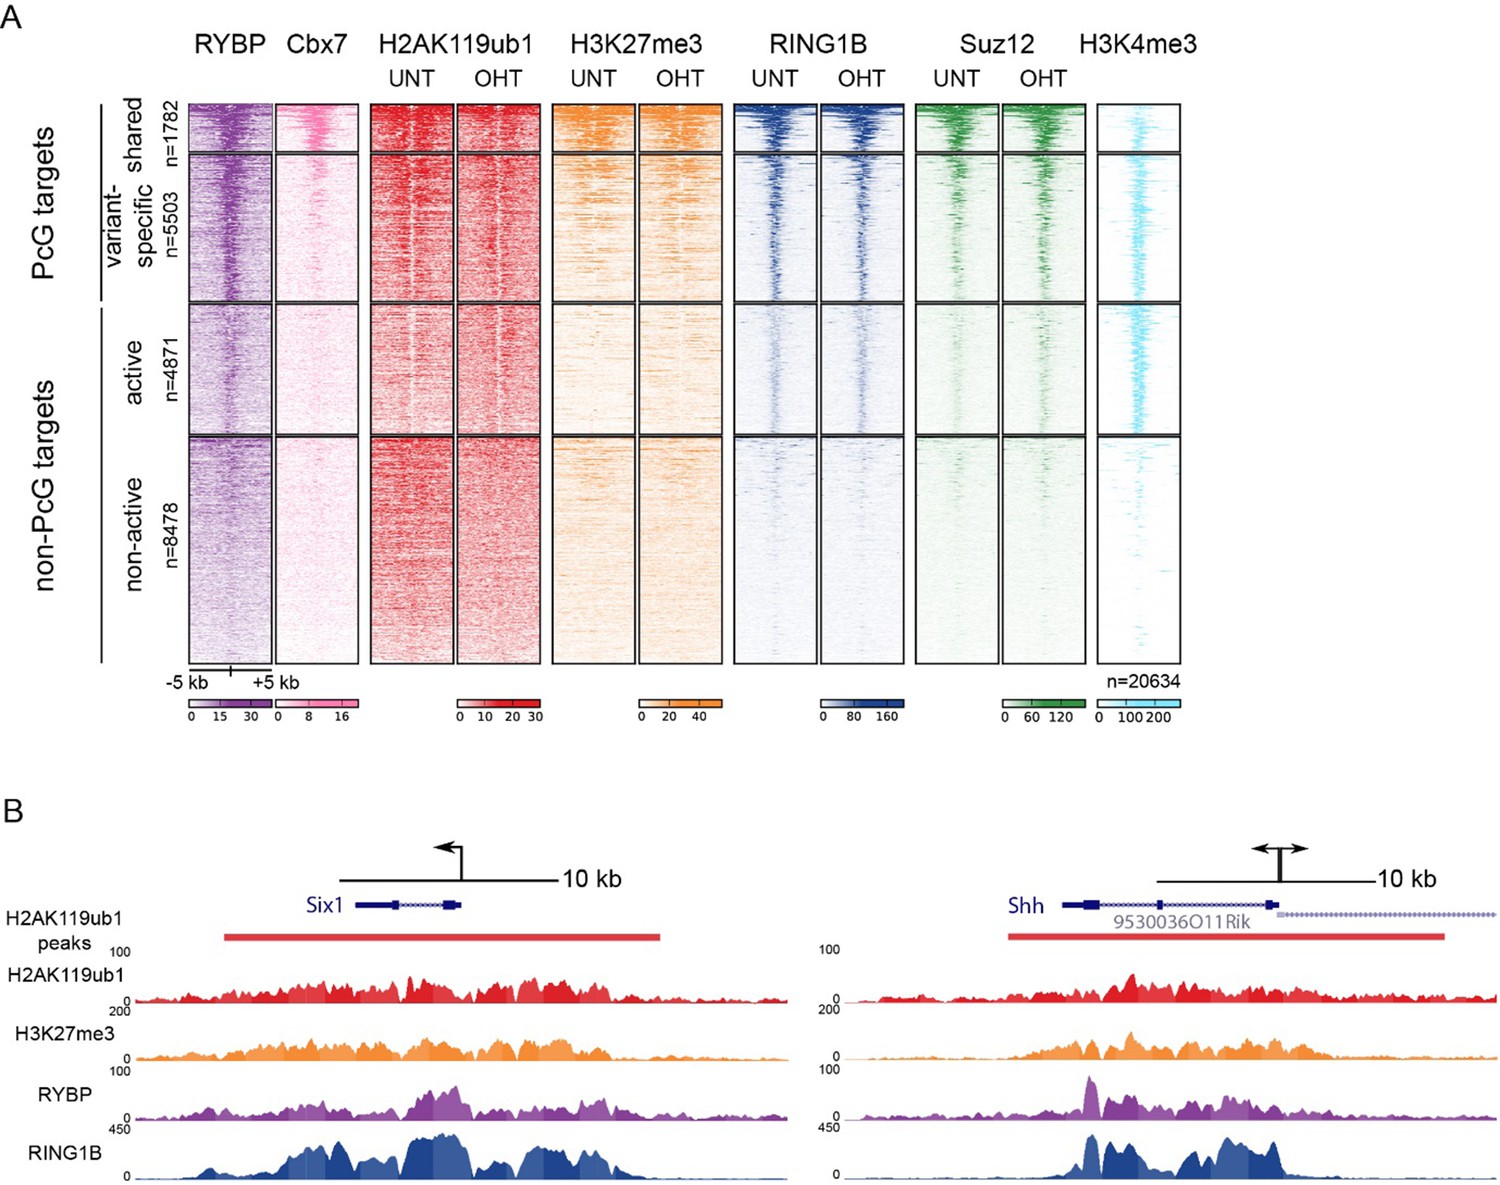
TSS clustering and heatmap analysis of variant and canonical PRC1.
(A) Non-redundant mm10 refGene TSSs (n=20634) were clustered into Polycomb (PcG) or non-PcG TSS. These were then further clustered based on RYBP and CBX7 binding (Morey et al., 2013) into shared (RYBP and CBX7 aka variant and canonical PRC1) and variant-enriched (RYBP-enriched) TSSs. Non-PcG TSSs were clustered by H3K4me3 to identify in active and inactive TSS. (B) Genomic snapshot of Six1 and Shh TSSs. A fixed window of ± 5kb is depicted from the TSS (arrow). This simple windowing suffers from the fact that it does not capture the true polycomb chromatin domain. In contrast intervals based on H2AK119ub1 more accurately represent the region corresponding to the polycomb chromatin domain.
Author response image 3
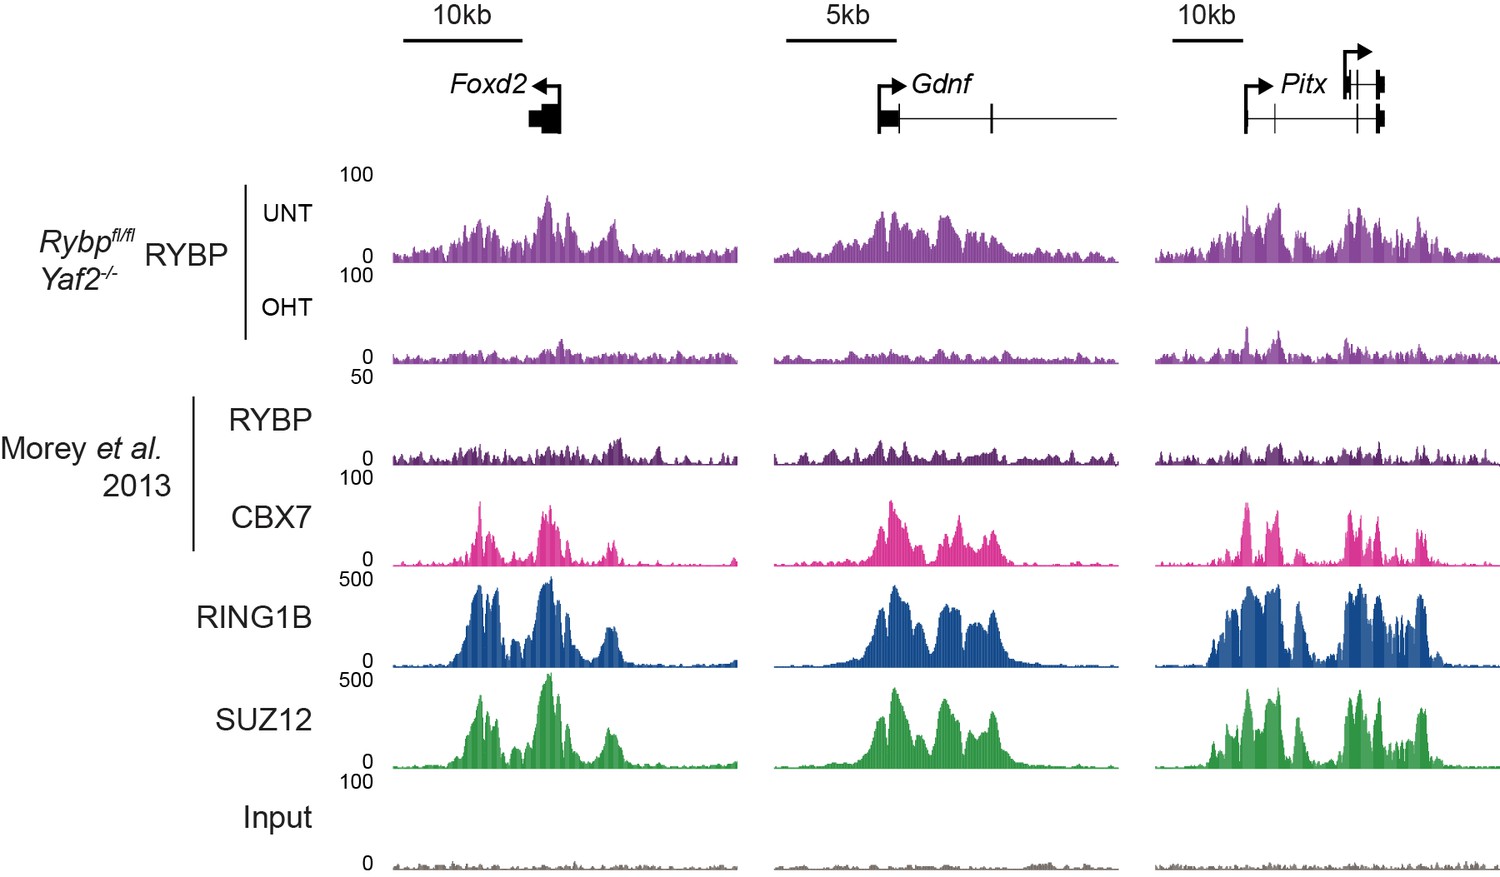
Analysis of RYBP occupancy at previously described canonical PRC1-specific sites.
Genomic snapshots of ChIP-seq signal for RYBP (datasets from this study and (Morey et al., 2013)), CBX7 (Morey et al., 2013), RING1B (this study) and SUZ12 (this study) at three genes previously reported as being occupied by cPRC1 and RYBP-free/depleted (Morey et al., 2013). Our RYBP ChIP-seq data (complete with RYBP knockout control (OHT)), clearly shows enrichment for RYBP at these genes. Importantly, RYBP enrichment at these sites is comparable in magnitude to other ncPRC1-enriched and shared sites (for example compare with Figure 7E).
Download links
A two-part list of links to download the article, or parts of the article, in various formats.
Downloads (link to download the article as PDF)
Open citations (links to open the citations from this article in various online reference manager services)
Cite this article (links to download the citations from this article in formats compatible with various reference manager tools)
RYBP stimulates PRC1 to shape chromatin-based communication between Polycomb repressive complexes
eLife 5:e18591.
https://doi.org/10.7554/eLife.18591


