Hunger neurons drive feeding through a sustained, positive reinforcement signal
- University of California, San Francisco, United States
- University of California, San Francisco, United states
Figures
Figure 1 with 1 supplement
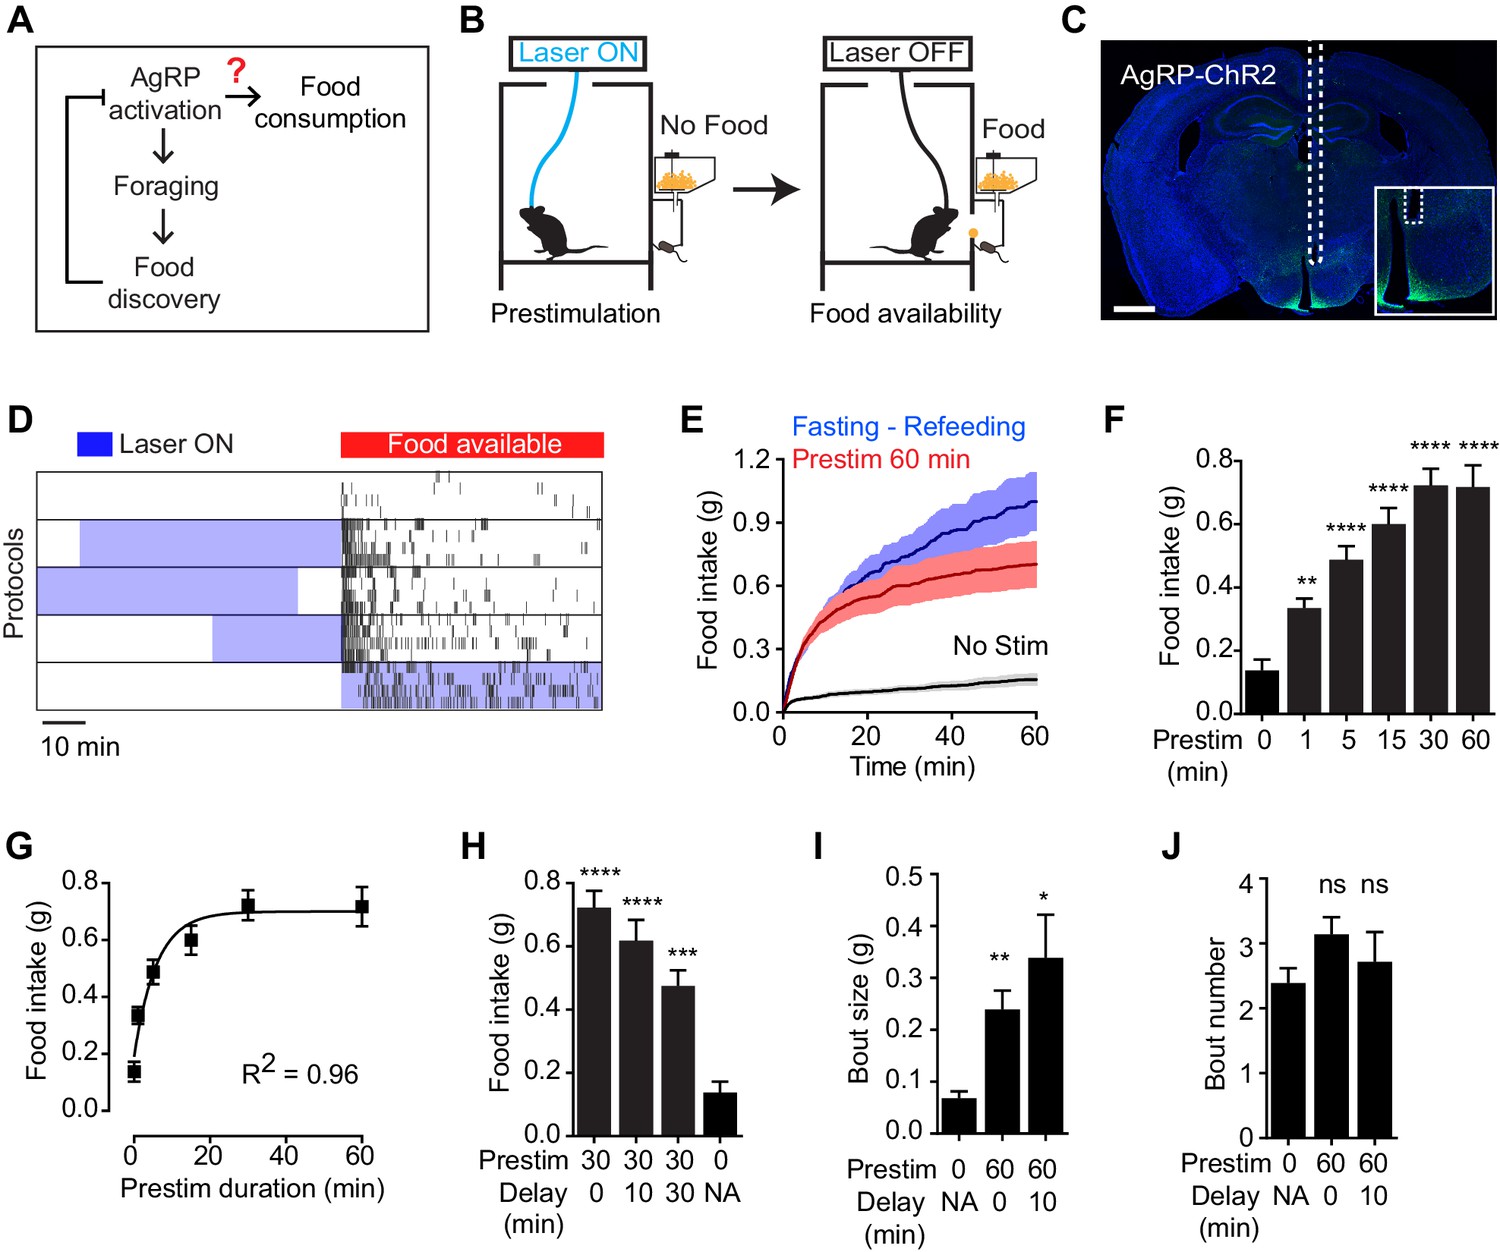
Prestimulation of AgRP neurons promotes sustained consummatory behavior.
(A) Current model of feeding control by AgRP neurons illustrating the disconnect between the natural dynamics and orexigenic function of these cells. (B) Schematic of the prestimulation experiment. (C) Expression of ChR2-eYFP in AgRP neurons and optical fiber placement above arcuate nucleus. (D–J) Prestimulating ARCAgRP neurons evokes food consumption in fed mice. (D) Raster plots showing temporal relationship between food pellet consumption events (black vertical bars) and opto-stimulation patterns (blue boxes). (E) Plots of cumulative food intake by mice after 0 min prestim (black n = 7), 60 min prestim (red n = 7) and overnight fasting (blue n = 6). Filled areas indicate S.E.M. (F) Food intake evoked by prestimulation with varied duration (n = 8). (G) First order association between average total food intake and prestimulation durations (Equation: Y = Y0 + (Plateau-Y0)*(1-exp(-K*x)). (H) Food intake evoked by protocols with different duration of delay between prestimulation and food availability (n = 8). (I) Bout size analysis of different prestimulation protocols (n = 7). (J) Bout number analysis of prestimulation protocols (n = 7). Asterisks on top of bar plots indicate significance levels compared to no stimulation control and asterisks on top of brackets indicate significance levels for comparisons with the respective protocols, using one-way-ANOVA with Holm-Sidak’s correction for multiple comparisons (****p≤0.0001, ***0.0001<p≤0.001, **0.001<p≤0.01, *0.01<p≤0.05, ns p>0.05).
Figure 1—figure supplement 1
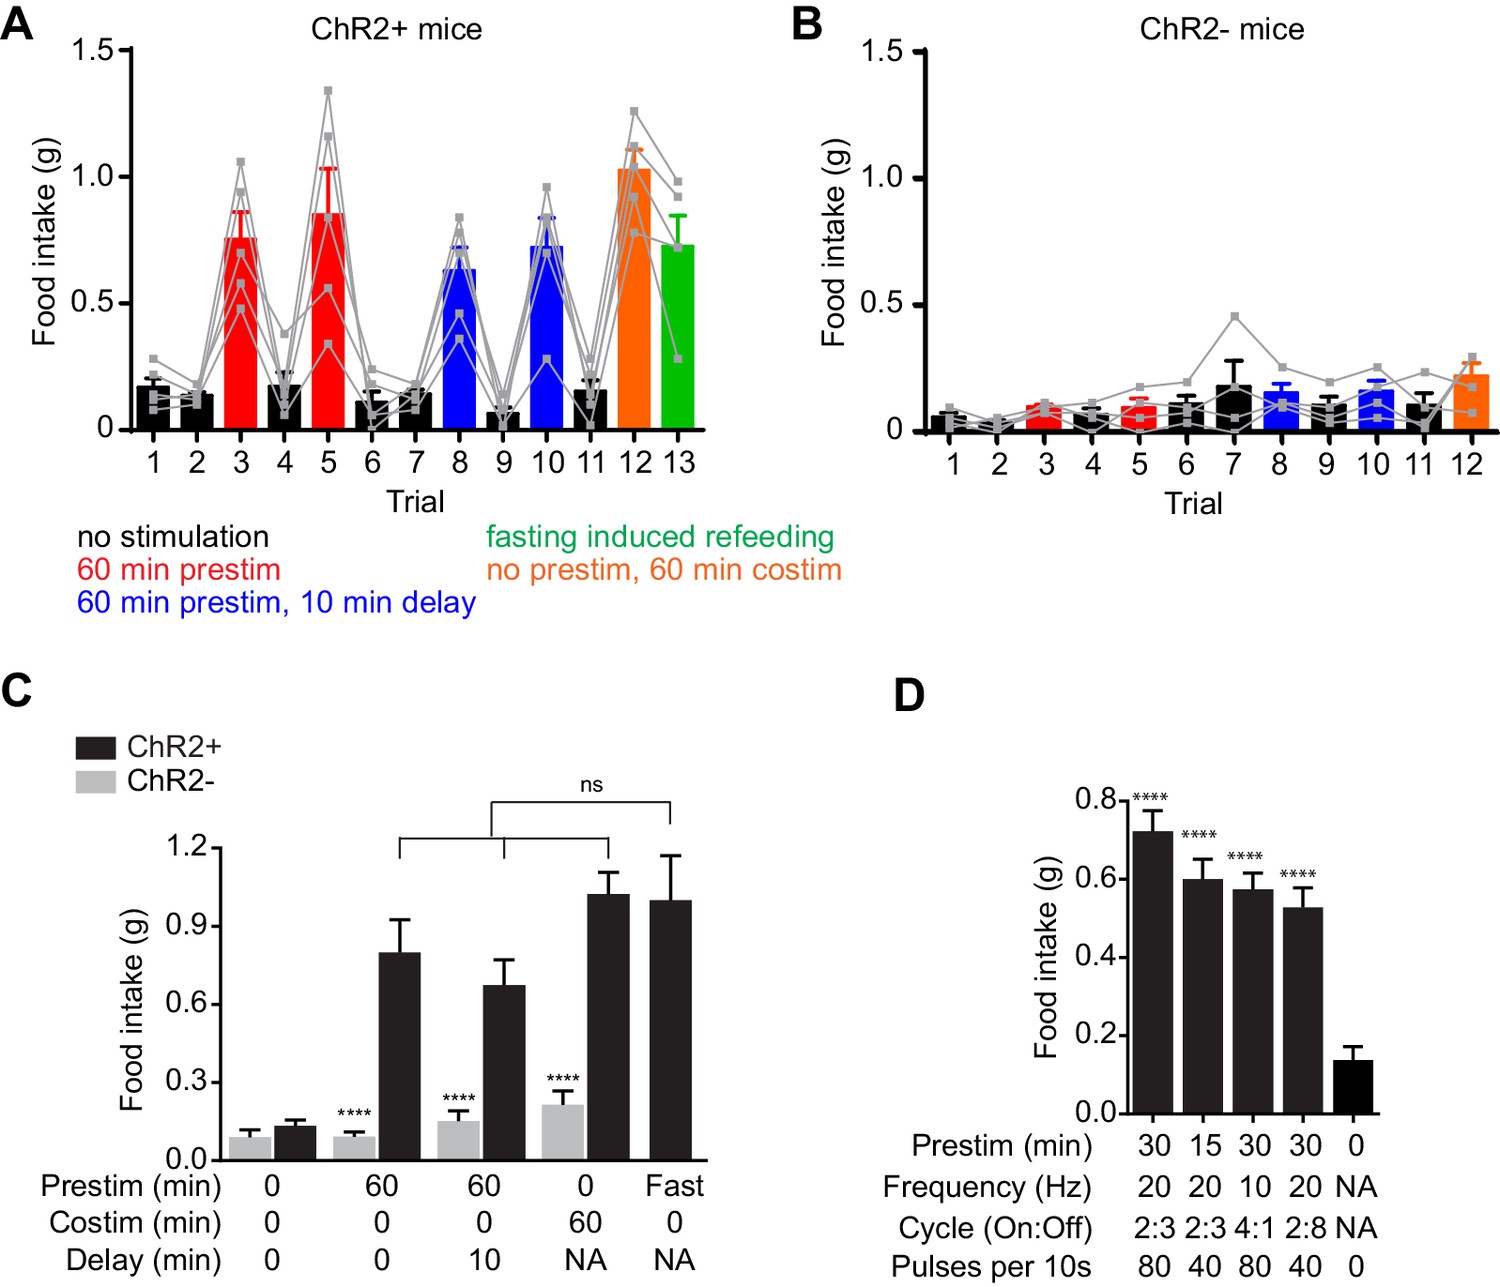
Prestimulation of AgRP neurons primes feeding.
(A–B) 60 min food intake of (A) AgRP-ChR2 (n = 5) and (B) WT control (n = 4) mice in trials conducted in consecutive days. (C) Analysis of 60 min food intake of AgRP-ChR2 (n = 5) and WT control (n = 4) mice under different stimulation condition. Asterisks indicate the significance level for comparison between WT and AgRP:ChR2 animals subjected to same stimulation protocol. ns, not significant. (D) Average 60 min food intake evoked by prestimulation with a varied temporal structure of laser pulses (n = 8 Asterisks on top of bar plots indicate significance levels compared to no stimulation control and asterisks on top of brackets indicate significance levels for comparisons with the respective protocols, using one-way-ANOVA with Holm-Sidak’s correction for multiple comparisons (****p≤0.0001, ***0.0001<p≤0.001, **0.001<p≤0.01, *0.01<p≤0.05, ns p>0.05).
Figure 2
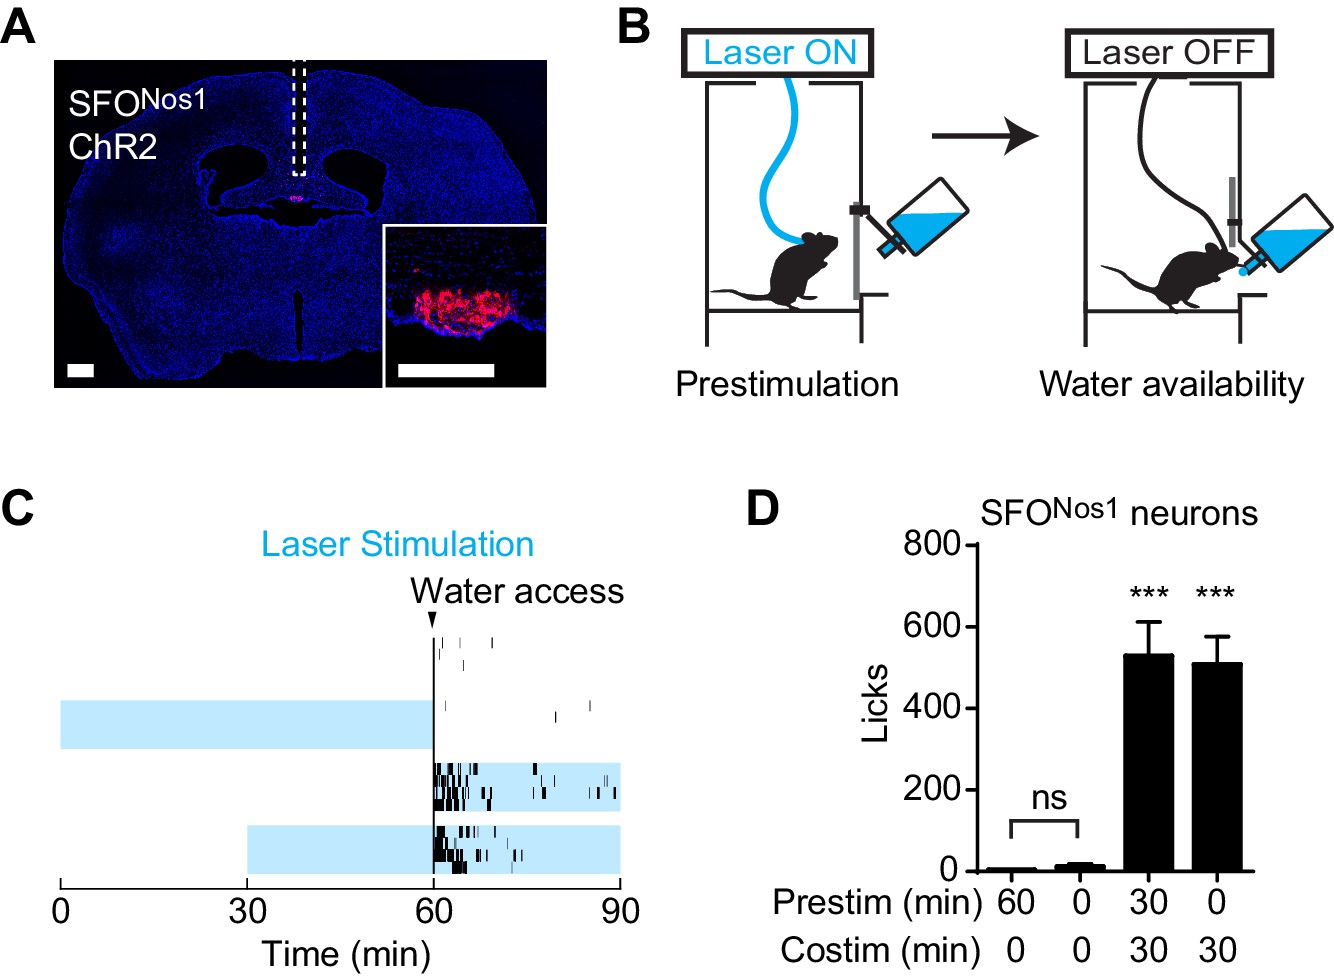
Prestimulation of SFONos1 neurons does not prime drinking behavior.
(A) Expression of ChR2-mCherry in SFONos1 neurons and optical fiber placement above SFO. (B) Schematic of the prestimulation experiment. (C–D) Drinking evoked by different protocols stimulating SFONos1 neurons (n = 4). (C) Raster plots showing temporal relationship between licking (black vertical lines) and opto-stimulation pattern (blue boxes). (D) Comparison of total licking events. Co-stimulation data are a reanalysis of experiments described in (Zimmerman et al., 2016). Asterisks on top of bar plots indicate significance levels compared to no stimulation control and asterisks on top of brackets indicate significance levels for comparisons with the respective protocols, using one-way-ANOVA with Holm-Sidak’s correction for multiple comparisons (****p≤0.0001, ***0.0001<p≤0.001, **0.001<p≤0.01, *0.01<p≤0.05, ns p>0.05).
Figure 3
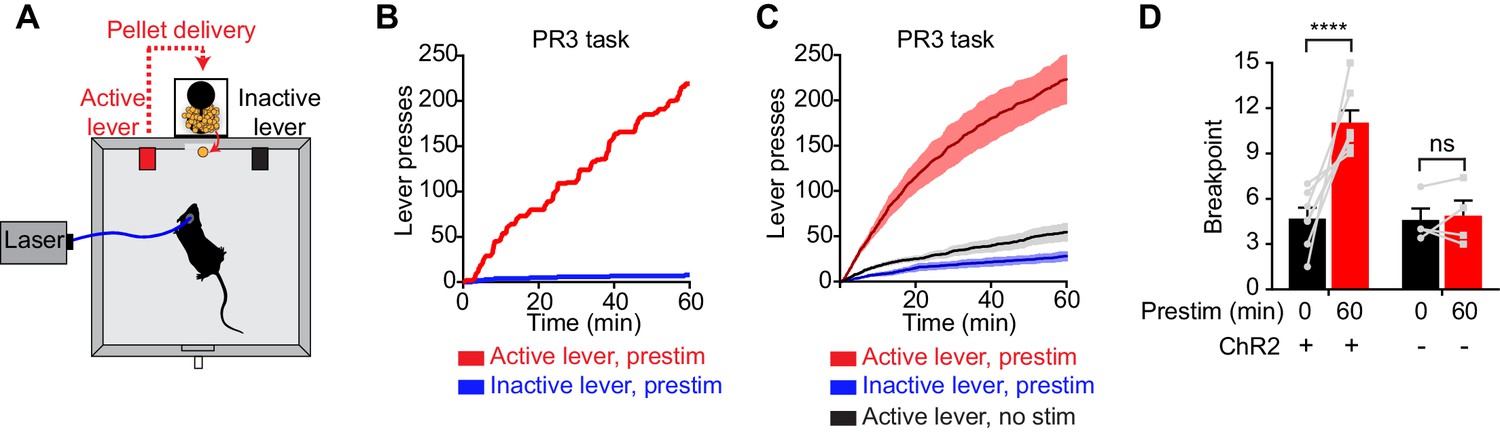
Prestimulation of AgRP neurons promotes sustained appetitive behavior.
(A) Progressive ratio 3 lever press task. (B–D) Lever presses evoked by prestimulating AgRP neurons in progressive ratio 3 tasks (n = 7). (B) Plots of cumulative lever presses by a representative mouse after 60 min prestimulation. (C) Plots of average cumulative lever presses from trials with or without prestimulation. Filled areas indicate S.E.M. (D) Breakpoint in a lever pressing assay for ChR2+ and ChR2- mice. Asterisks on top of brackets indicate significance levels for comparisons with the respective protocols, using one-way-ANOVA with Holm-Sidak’s correction for multiple comparisons (****p≤0.0001, ***0.0001<p≤0.001, **0.001<p≤0.01, *0.01<p≤0.05, ns p>0.05).
Figure 4 with 1 supplement
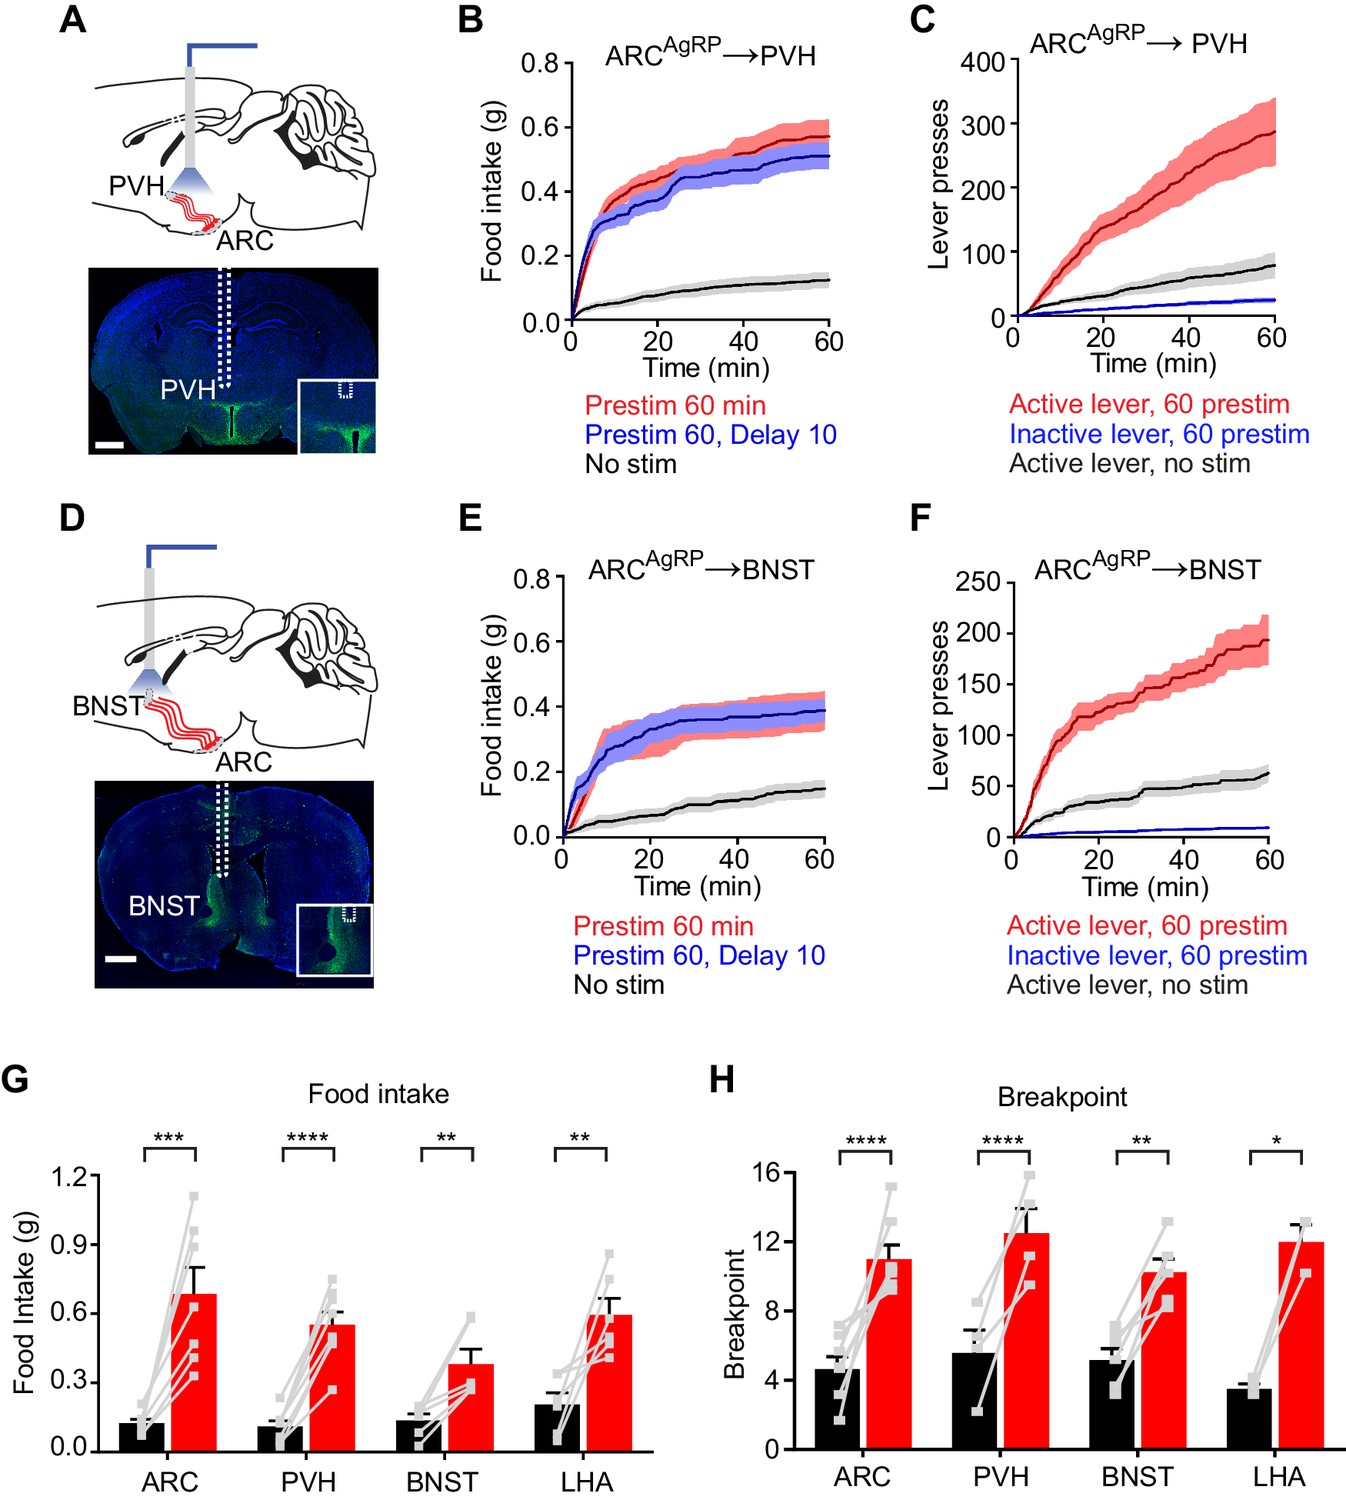
Projections of AgRP neurons to PVH, BNST or LHA are sufficient to prime feeding behavior.
(A) Optical fiber placement above AgRPARC→PVH. (B–C) Plots of cumulative food intake (B) and lever presses (C) evoked by prestimulating AgRPARC→PVH axonal terminals. Filled areas indicate S.E.M. (D) Optical fiber placement above AgRPARC→BNST. (E–F) Plots of cumulative food intake (E) and lever presses (F) evoked by prestimulating AgRPARC→BNST axonal terminals. Filled areas indicate S.E.M. (G) 60 min food intake evoked by 60 min prestimulation of AgRPARC, AgRPARC→PVH, AgRPARC→BNST and AgRPARC→LHA (red) and corresponding nostim controls (black). (H) Breakpoint in 60 min progressive ratio 3 task reached by animals with 60 min prestimulation of AgRPARC, AgRPARC→PVH, AgRPARC→BNST and AgRPARC→LHA (red) and corresponding nostim controls (black). Asterisks on top of brackets indicate significance levels for comparisons with the respective protocols, using one-way-ANOVA with Holm-Sidak’s correction for multiple comparisons (****p≤0.0001, ***0.0001<p≤0.001, **0.001<p≤0.01, *0.01<p≤0.05, ns p>0.05). ARC food intake n = 8; ARC PR3 n = 7; PVH food intake n = 8; PVH PR3 n = 4; BNST food intake n = 6; BNST PR3 n = 6; LHA food intake n = 6; LHA PR3 n = 3.
Figure 4—figure supplement 1
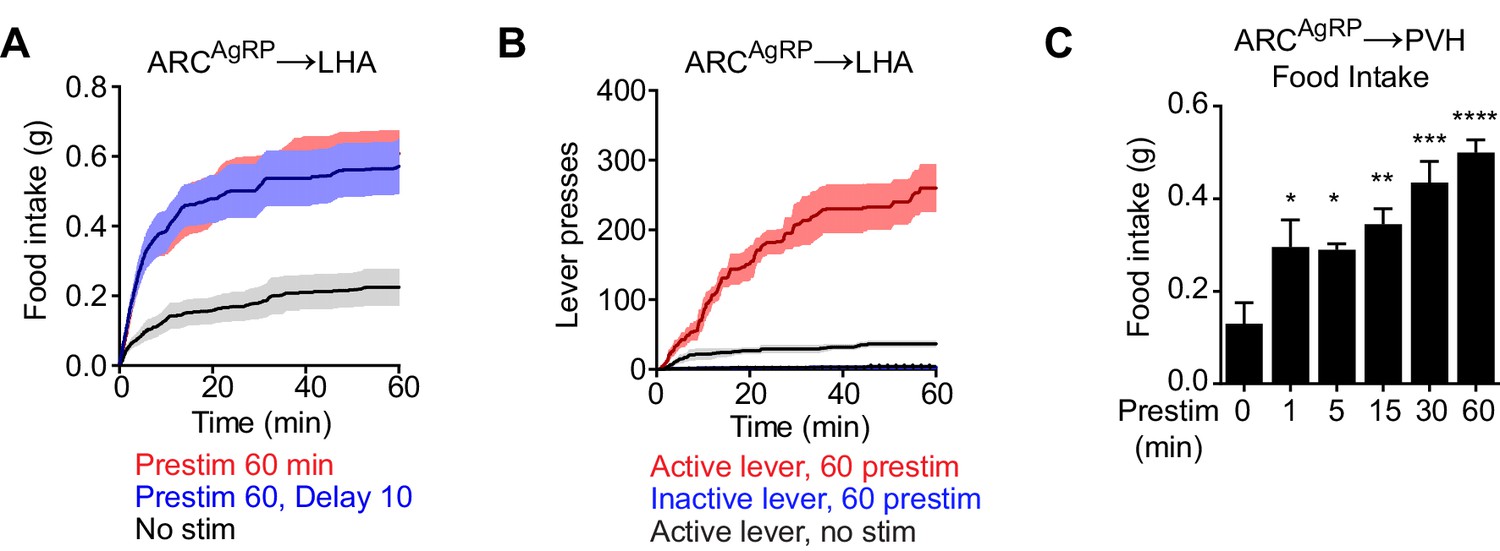
Prestimulation of specific AgRP neuron projections promotes feeding.
(A) Plots of cumulative food intake for prestimulation AgRPARC→LHA projections. Filled area indicates SEM (n = 6). (B) Plots of cumulative lever presses for prestimulation of AgRPARC→LHA projections. Filled area indicates SEM (n = 3). (C) Food intake evoked by prestimulation of AgRPARC→PVH projections of varied duration (n = 4). Asterisks indicate significance levels for comparison to no prestimulation adjusted with Holm-Sidak’s correction for multiple comparisons (****p≤0.0001, ***0.0001<p≤0.001, **0.001<p≤0.01, *0.01<p≤0.05).
Figure 5
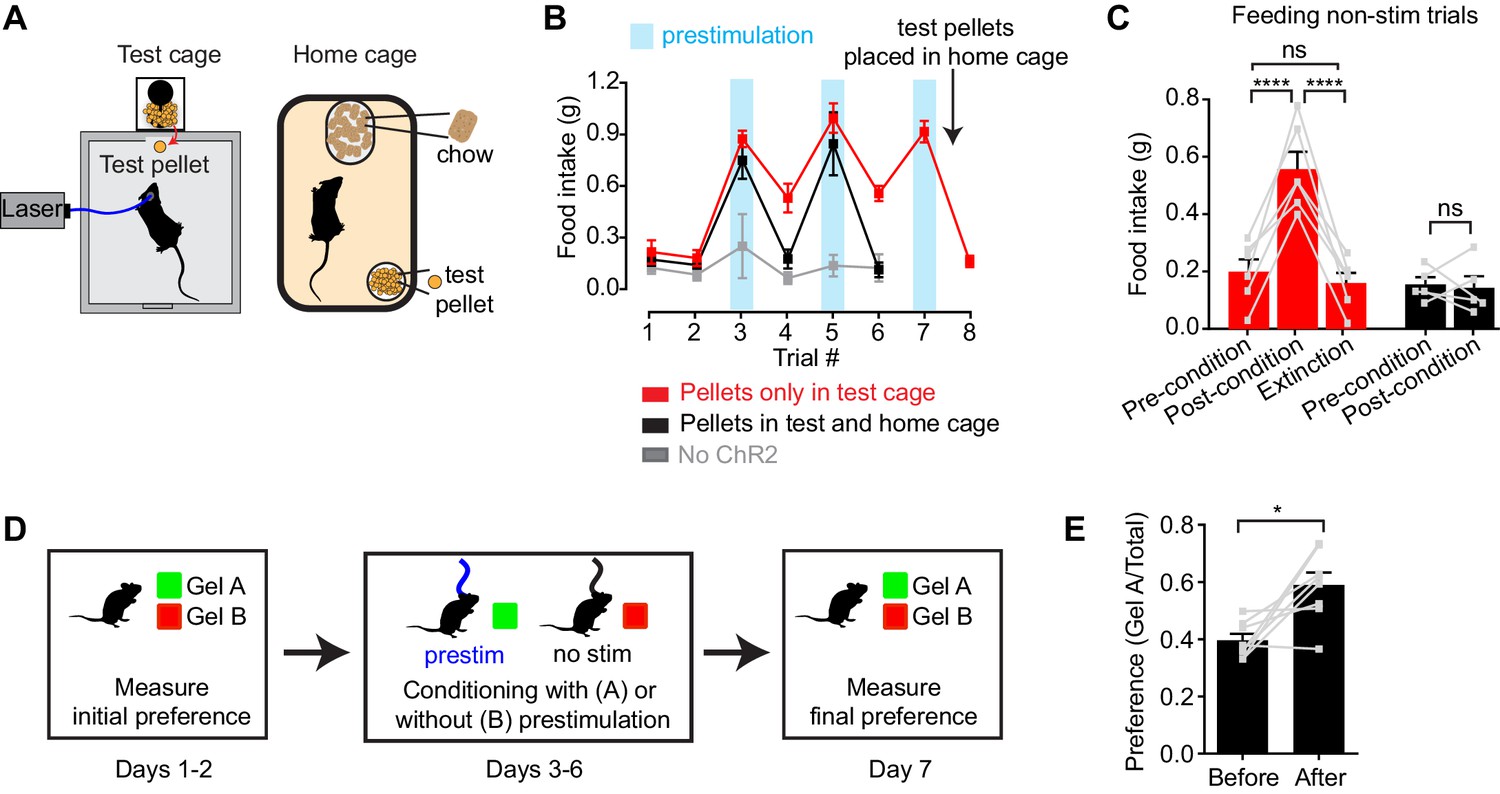
Prestimulation of AgRP neurons conditions appetite and flavor preference.
(A) Schematic of conditioned appetite assay. Test pellets and home cage chow are similar in energy density but different in shape, size, and texture. Test pellets were either included in home cage or not, as indicated. (B–C) Average 60 min food intake of conditioned appetitive experiments. (B) Food intake of AgRP-ChR2 mice without access to test pellets in homecage (red n = 6) and with access to test pellets in homecage (black n = 5), and WT mice without access to test pellets in homecage (grey n = 3) through consecutive trials. Blue boxes indicate trials with 60 min prestimulation (trials 3,5,7), whereas in white trials animals were subjected to mock stimulation (trials 1,2,4,6,8). (C) Comparison among pre-conditioning, post-conditioning and extinction trials of AgRP-ChR2 mice with (black n = 5) or without (red n = 6) access to test pellets in homecage. Trial 1 and 2 are considered pre-conditioning, trial 4 and 6 are considered post-conditioning and trial 8 is considered extinction. (D) Conditioned flavor preference experiment. (E) Change of preference to conditioned flavor before and after 4 repeats of prestimulation conditioning assay (n = 8). Asterisks on top of brackets indicate significance levels for comparisons with the respective protocols, using one-way-ANOVA with Holm-Sidak’s correction for multiple comparisons (****p≤0.0001, ***0.0001<p≤0.001, **0.001<p≤0.01, *0.01<p≤0.05, ns p>0.05).
Figure 6 with 1 supplement
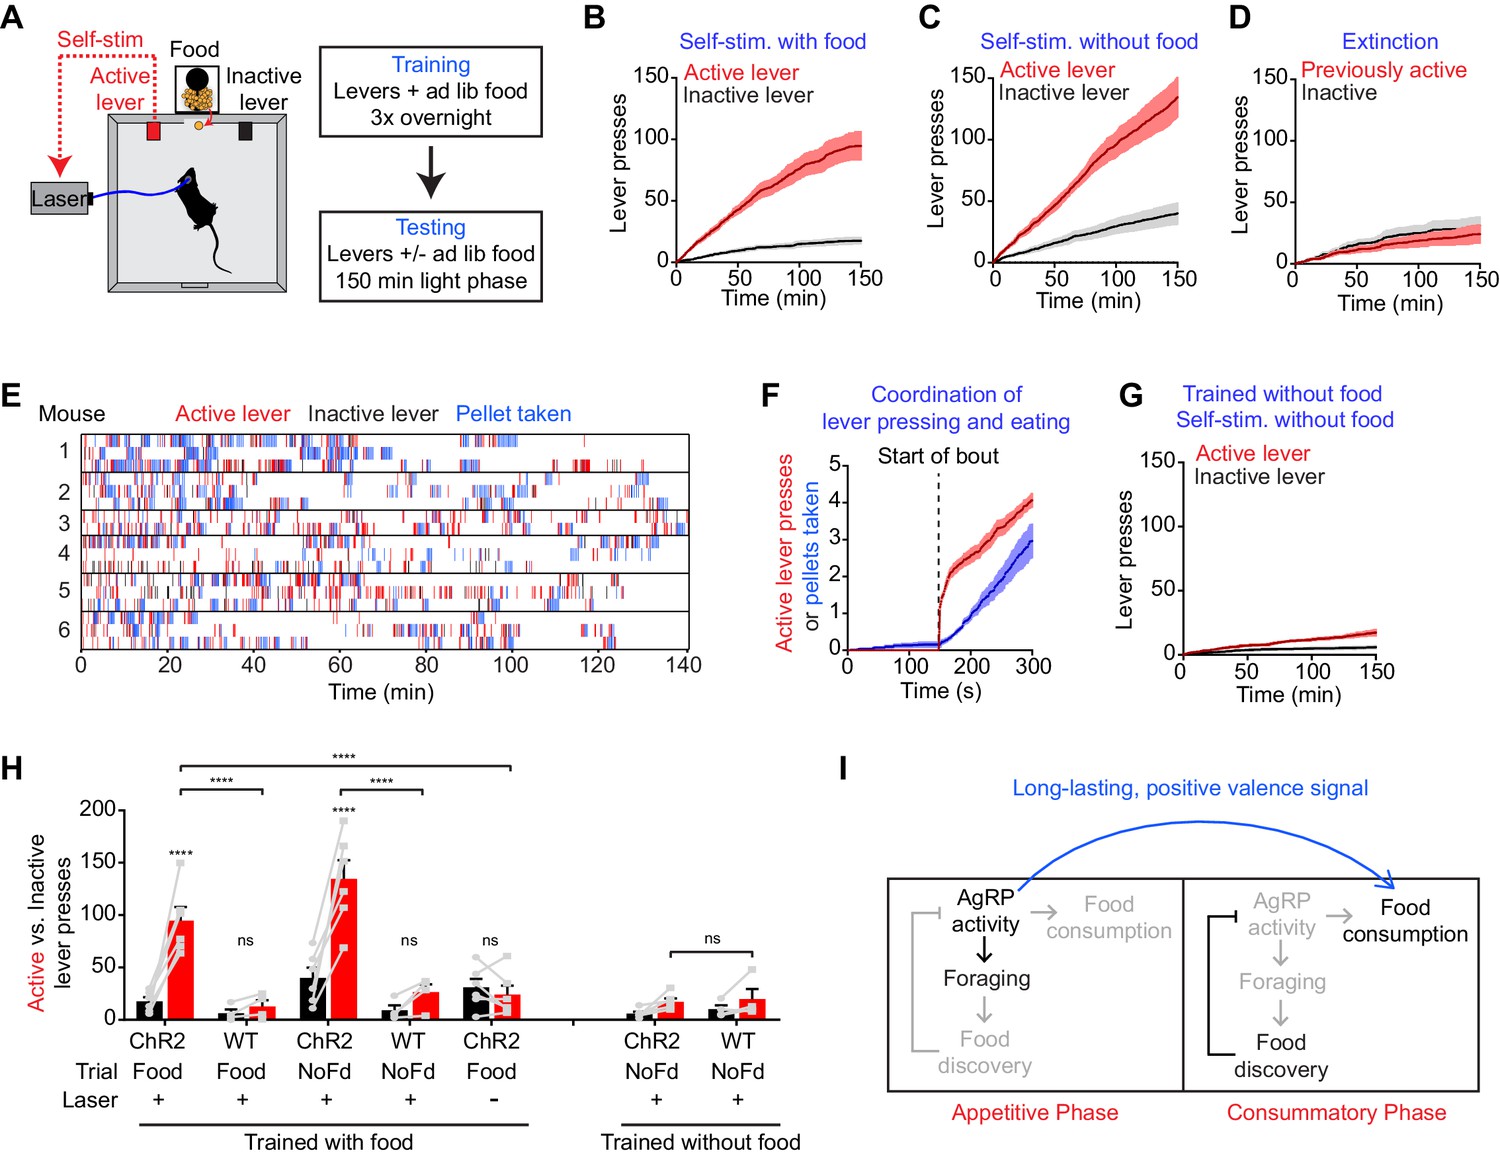
AgRP neuron activity is positively reinforcing in the presence of food.
(A) Schematic of the positive reinforcement protocol that tests whether animals will lever press to self-stimulate AgRP neurons. (B–D) Plots of cumulative active (red) and inactive lever presses (black) by mice conditioned with ad lib access to food (n = 6). Filled areas indicate S.E.M. (B) Self-stimulation experiment with ad lib access to food pellets. (C) Self-stimulation experiment without access to food. (D) Self-stimulation experiment after extinction with ad lib access to food. (E–F) Temporal relationship between self-stimulation of AgRP neurons and food intake. Filled areas indicate SEM. (E) Raster plots of individual trials (2–3 repeats) of 6 different mice. (F) PSTH analysis of active lever presses and pellet consumption. Filled areas indicate SEM (n = 6). Time zero is defined as the beginning of each active lever pressing bout. A bout is defined as a lever press train segregated from other lever presses by ≥5 min. (G) Plots of cumulative active (red) and inactive lever presses (black) by mice conditioned without food access (n = 6). Self-stimulation experiments were conducted in the absence of food access. Filled areas indicate S.E.M. (H) Bar plots comparing total active (red) and inactive (black) lever presses of AgRP-ChR2 mice and WT control mice in self-stimulation experiment with ad lib (Food) or no (NoFd) access to food pellets. Asterisks on top of bar plots of active lever presses indicate significance levels compared to corresponding inactive lever presses and asterisks on top of brackets indicate significance levels for comparisons with the respective protocols, using one-way-ANOVA with Holm-Sidak’s correction for multiple comparisons (****p≤0.0001, ***0.0001<p≤0.001, **0.001<p≤0.01, *0.01<p≤0.05, ns p>0.05). Trained with food: ChR2 food n = 6, WT food n = 4, ChR2 nofood n = 6, WT nofood n = 4; trained without food: ChR2 nofood n = 6, WT nofood n = 4. (I) Model for control of feeding by AgRP neurons. During the appetitive phase, AgRP neuron activity drives food seeking. The sensory detection of food silences AgRP neuron activity. However, animals still consume food during the subsequent consummatory phase because of a long-lasting, positive valence signal transmitted by AgRP neurons earlier, when food was unavailable.
Figure 6—figure supplement 1
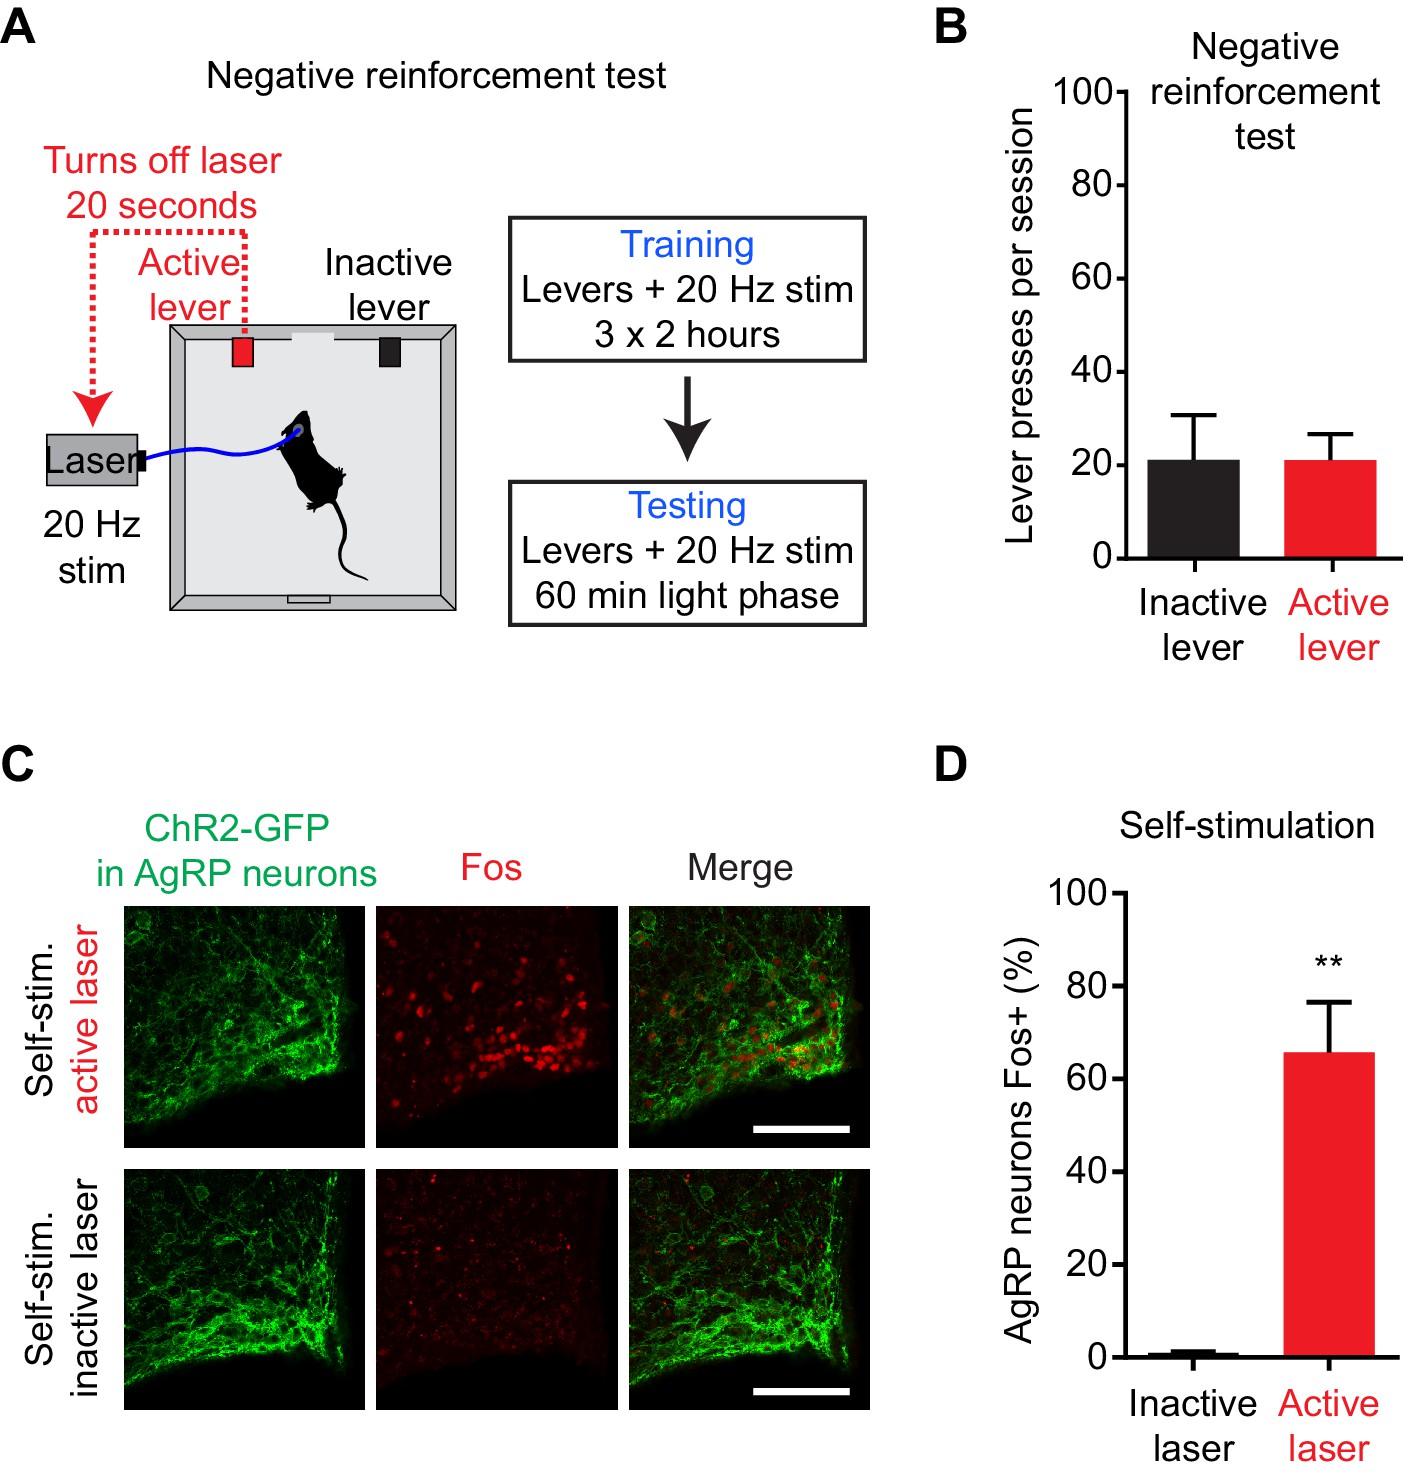
AgRP neurons support positive, but not negative, reinforcement.
(A) Schematic of the negative reinforcement protocol that tests whether animals will lever press to shut off AgRP neuron activity. (B) Number of presses for the active and inactive lever in a 60 min negative reinforcement test (n = 6). (C) Induction of Fos expression in AgRP neurons of mice that are allowed to self-stimulate by lever pressing (top), but not in mice in which the lever has been disconnected from the laser (bottom). (D) Quantification of the percentage of AgRP neurons that express Fos in each group (n = 3). Asterisks indicate a significant difference in Fos expression between the two groups by an unpaired, two-tailed t-test. (**0.001<p≤0.01).
Download links
A two-part list of links to download the article, or parts of the article, in various formats.
Downloads (link to download the article as PDF)
Open citations (links to open the citations from this article in various online reference manager services)
Cite this article (links to download the citations from this article in formats compatible with various reference manager tools)
Hunger neurons drive feeding through a sustained, positive reinforcement signal
eLife 5:e18640.
https://doi.org/10.7554/eLife.18640


