Clec11a/osteolectin is an osteogenic growth factor that promotes the maintenance of the adult skeleton
- University of Texas Southwestern Medical Center, United States
Figures
Figure 1 with 1 supplement

Clec11a deficient mice were grossly developmentally normal and had normal hematopoiesis.
(A–C) Clec11a expression analysis by microarray, RNA-seq and qRT-PCR. Whole bone marrow cells, VE-Cadherin+ bone marrow endothelial cells, bone marrow stromal cells (Scf-GFP+CD45-Ter119-CD31- for microarray, PDGFRα+CD45-Ter119-CD31- for RNA-seq, and LepR+CD45-Ter119-CD31- for qPCR), Col2.3-GFP+CD45-Ter119-CD31- osteoblasts and hematopoietic cell populations were sorted from enzymatically dissociated femur bone marrow of two month-old mice, followed by microarray (A), RNA-seq (B) and qPCR (C) analysis. The statistical significance of differences was assessed using one-way ANOVAs with Dunnett’s multiple comparison tests (n = 2–3 mice/genotype from at least two independent experiments). (D) The position of images from femur sections. (E–H) Confocal analysis of isotype control or anti-Clec11a antibody staining in the femur metaphysis (E and F) and diaphysis (G and H) of Prrx1-Cre; tdTomato mice. Bone was imaged by second harmonic generation (SHG). Bone marrow stromal cells (Fi), osteoblasts (Fii), hypertrophic chondrocytes (Fiii) and osteocytes (H) are marked by arrows (n = 3 mice per genotype, total, from three independent experiments). (I and J) Confocal analysis of isotype control (I) or anti-Clec11a antibody staining (J) in the femur metaphysis of Lepr-Cre; tdTomato mice. LepR+ bone marrow stromal cells are marked by arrows (n = 3 mice per genotype, total, from three independent experiments). (K) Representative images of two month-old control and Clec11a-/- mice. (L) Body mass of 2 and 10 month-old mice (n = 3–8 mice per genotype, total, from at least three independent experiments for all data in panels L–T). (M) Cellularity of the bone marrow and spleen. (N–T) Flow cytometric analysis of the frequencies of myeloid cells (N), erythroid progenitors (O), T cells (P), B cells (Q), hematopoietic stem cells (R), multipotent progenitors (S) and restricted progenitors (T) in the bone marrow and spleen of Clec11a-/- mice and sex-matched littermate controls. The statistical significance of differences among genotypes was assessed using two-tailed Student’s t tests. Data represent mean ± SD: *p<0.05, **p<0.01, ***p<0.001. The source data are in Figure 1—source data 1.
-
Figure 1—source data 1
Data for Figure 1A and Figure 1—figure supplement 1.
- https://doi.org/10.7554/eLife.18782.003
Figure 1—figure supplement 1

Generation of Clec11a-/- mice and hematopoietic analysis.
(A and B) Anti-Clec11a antibody staining (green) of distant femur metaphysis (A) and diaphysis cortical bone (B) sections from Clec11a-/- mice and wild-type controls. (C) Anti-Clec11a antibody staining (green) of sections through vertebral trabecular and cortical bone in wild-type mice. (D) Anti-Clec11a antibody staining (green) of distant femur metaphysis in Prrx1-Cre; tdTomato mice. Growth plate chondrocytes were marked by aggrecan staining. Bone was imaged by second harmonic generation (SHG). (E and F) Targeting strategy to generate a loss-of-function Clec11a allele using Crispr-Cas9 gene targeting. Two sgRNAs were designed against sequences in intron 1 and intron 2 (arrowheads) to engineer the deletion of exon 2 (E), which caused a frame shift that created a premature stop codon in exon 3 (F). The resulting mutant protein has 76 amino acids, lacking all of the domains that are thought to be functionally important in Clec11a (F). Genotyping (black arrows) and qPCR (red arrows) primer locations are marked in (E). (G) Genomic DNA PCR. Tail genomic DNA was extracted from Clec11a+/+ and Clec11a-/- mice, followed by PCR amplification using the primers indicated in (E) with black arrows. The amplicons were sequenced to confirm correct targeting. (H) qPCR analysis of Clec11a expression in sorted LepR+CD45-Ter119-CD31- cells from Clec11a+/+ and Clec11a-/- bone marrow using the primers marked in panel E (red arrows). Statistical significance was assessed using a two-tailed Student’s t test (n = 5 mice per genotype, total, from three independent experiments). (I) Clec11a cDNA was amplified by RT-PCR from bone marrow stromal cells using primers located in exon 1 and exon 3 (black arrows) and subjected to Sanger sequencing. Deletion of exon 2 in Clec11a-/- mice led to an aberrant transcript that joined exon 1 and exon 3, causing a frame shift and formation of a premature stop codon in exon 3 (see panel F). (J) ELISA measurement of plasma Clec11a level in 2 month-old Clec11a+/+, Clec11a+/- and Clec11a-/- mice (n = 3–6 mice per genotype, total, from three independent experiments). (K) Heterozygous Clec11a+/- mice were intercrossed and generated progeny in Mendelian ratios (p=0.37 relative to expected numbers by Chi-square test). (L–N) Red blood cell (L), white blood cell (M) and platelet (N) counts in 2, 10 and 16 month-old Clec11a-l- and sex-matched littermate control mice (n = 4–6 mice per genotype, total, from at least four independent experiments). The statistical significance of differences among genotypes was assessed using two-tailed Student’s t tests. (O–R) Competitive reconstitution analysis of irradiated mice transplanted with 300,000 donor bone marrow cells from Clec11a-/- or littermate control mice along with 300,000 recipient bone marrow cells. All mice were long-term multilineage reconstituted by donor cells (O), including CD3+ T cells (P), B220+ B cells (Q) and Mac1+Gr-1+ myeloid cells (R) (n = 10 recipients per genotype, total, from two independent experiments). The statistical significance of differences among genotypes was assessed using repeated measures two-way ANOVAs with Sidak’s multiple comparison tests. (S and T) Hematopoietic colony formation by mouse bone marrow cells in cultures supplemented with rClec11a along with 1 U/ml EPO to promote erythroid progenitor colony formation (BRU-E; S) or 10 ng/ml GM-CSF to promote myeloid progenitor colony formation (CFU-G/M/GM; T) (n = 3 independent experiments). The statistical significance of differences among treatments was assessed using one-way ANOVAs with Tukey’s multiple comparison tests. The data represent mean ± SD (*p<0.05, ***p<0.001) from male and female mice. The source data are in Figure 1—source data 1.
Figure 2 with 1 supplement
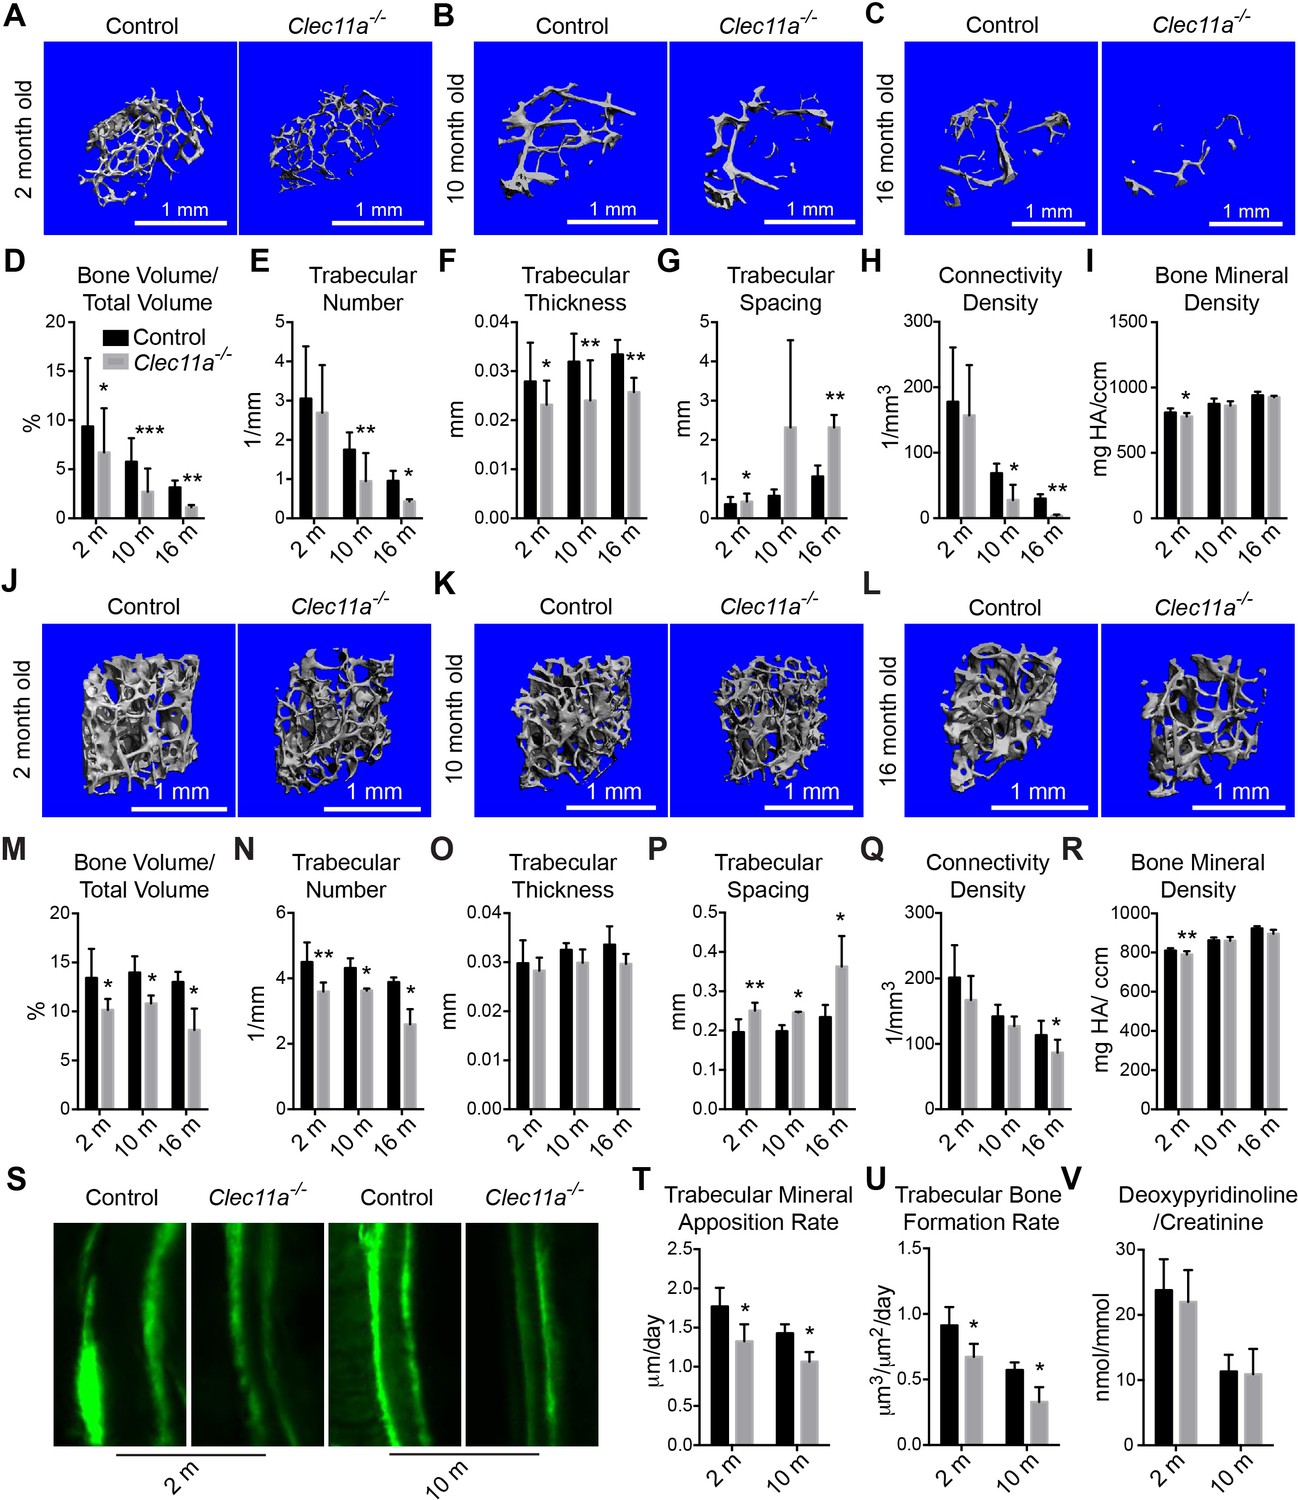
Clec11a is necessary for osteogenesis in limb bones and vertebrae.
(A–C) MicroCT images of trabecular bone in the distal femur metaphysis of two month-old (A), 10 month-old (B) and 16 month-old (C) Clec11a-/- mice and sex-matched littermate controls. (D–I) MicroCT analysis of trabecular bone volume/total volume (D), trabecular number (E), trabecular thickness (F), trabecular spacing (G), connectivity density (H) and bone mineral density (I)) in the distal femur metaphysis of 2, 10 and 16 month-old Clec11a-/- mice and sex-matched littermate controls (n = 4–9 mice/genotype from at least four independent experiments). (J–L) MicroCT images of trabecular bone from the ventral L3 lumbar vertebrae of two month-old (J), 10 month-old (K) and 16 month-old (L) Clec11a-/- mice and sex-matched littermate controls. (M–R) MicroCT analysis of trabecular bone parameters in the L3 vertebral bodies of 2, 10 and 16 month-old Clec11a-/- mice and sex-matched littermate controls (n = 3–5 mice per genotype, total, from at least three independent experiments). (S–U) Representative calcein double labeling images (S) with quantification of the trabecular bone mineral apposition (T) and trabecular bone formation (U) rates in the femur metaphysis of 2 and 10 month-old mice (n = 4 mice per genotype, total, from four independent experiments). (V) Bone resorption analysis by measuring the deoxypyridinoline/creatinine ratio in urine (n = 4 mice/genotype from four independent experiments). The statistical significance of differences among genotypes was assessed using two-tailed Student’s paired t tests. Data represent mean ± SD (*p<0.05, **p<0.01, ***p<0.001). All means included data from male and female mice but within individual experiments sex-matched littermates were compared by paired tests. The source data are in Figure 2—source data 1.
-
Figure 2—source data 1
Data for Figure 2 and Figure 2—figure supplement 1.
- https://doi.org/10.7554/eLife.18782.006
Figure 2—figure supplement 1
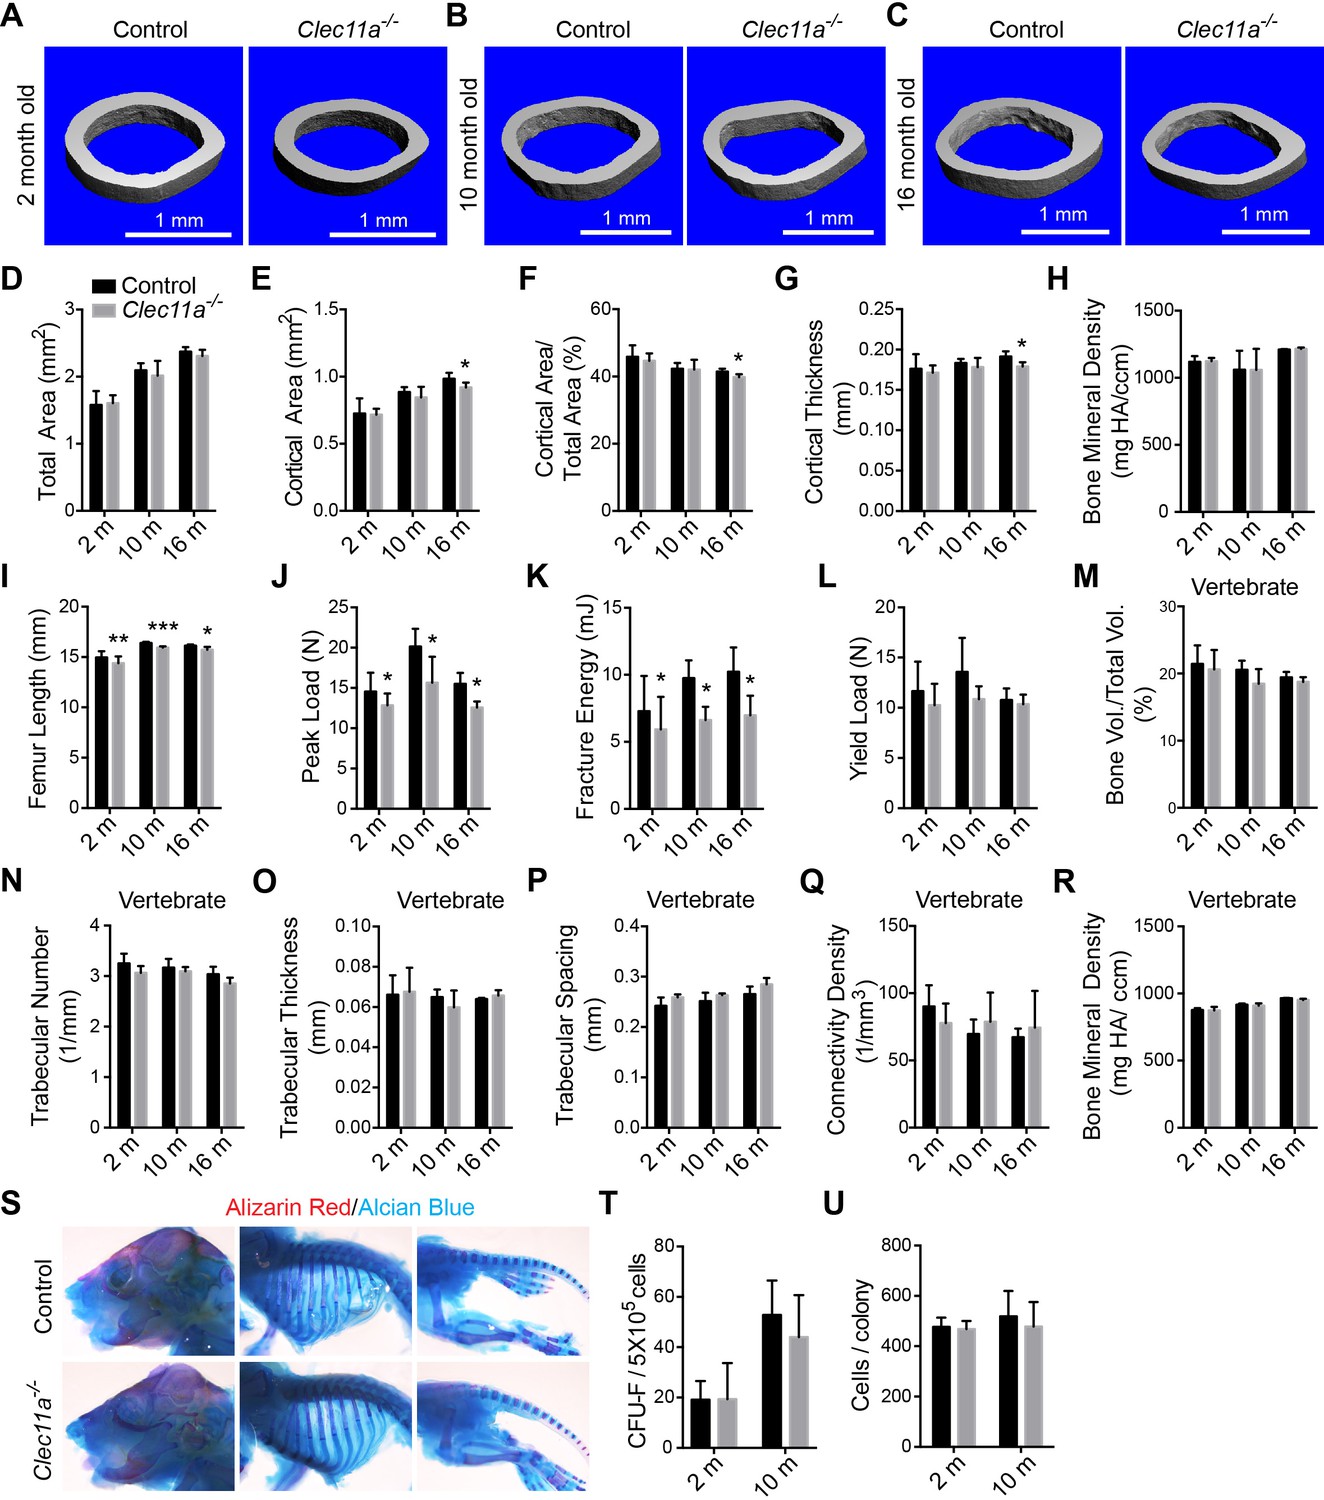
Further skeleton analysis in Clec11a-/- mice.
(A–C) Representative microCT images of cortical bone in the femur diaphysis of two month-old (A), 10 month-old (B) and 16 month-old (C) Clec11a-/- mice and sex-matched littermate controls. (D–H) MicroCT analysis of the total area (D), cortical area (E), cortical area/total area (F), cortical thickness (G) and cortical bone mineral density (H) in the femur diaphysis (n = 4–9 mice per genotype, total, from at least four independent experiments). (I) Femur length (n = 4–8 mice per genotype, total, from at least four independent experiments). (J–L) Biomechanical tests of the peak load (J), fracture energy (K), and yield load (L) in the femur diaphysis (n = 4–9 mice per genotype, total, from at least four independent experiments). (M–R) MicroCT analysis of the whole L3 lumbar vertebrae in 2, 10 and 16 month-old Clec11a-/- mice and sex-matched littermate controls (n = 3–5 mice per genotype, total, from at least three independent experiments). (S) Alizarin red/alcian blue double staining of a Clec11a-/- mouse and a littermate control at postnatal day 3 (images are representative of 3–4 mice per genotype, analyzed in two independent experiments). (T and U) CFU-F frequency (T) and cells per CUF-F colony (U) in 2 and 10 month-old mice (n = 6 mice per genotype, total, from six independent experiments). The statistical significance of differences was assessed using two-tailed Student’s t tests. Data represent mean ± SD (*p<0.05, **p<0.01 and ***p<0.001). All means included data from male and female mice but within individual experiments sex-matched littermates were compared using pairwise analyses. The source data are in Figure 2—source data 1.
Figure 3 with 2 supplements
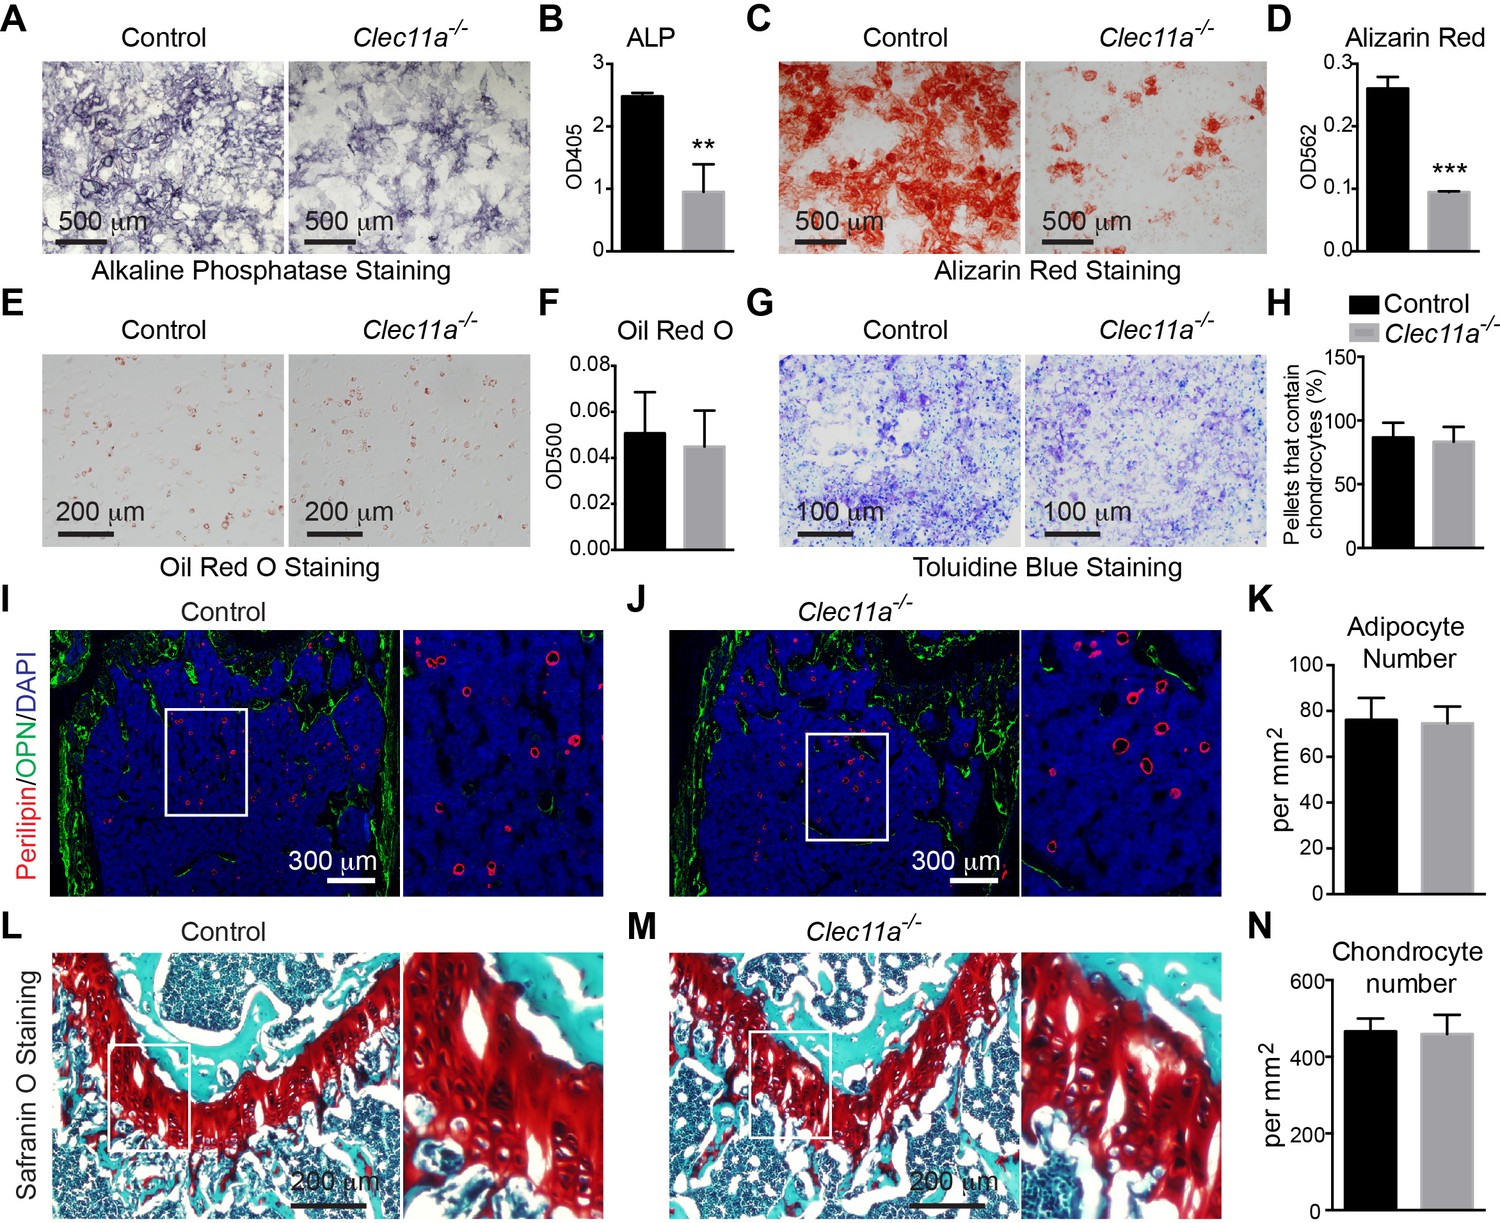
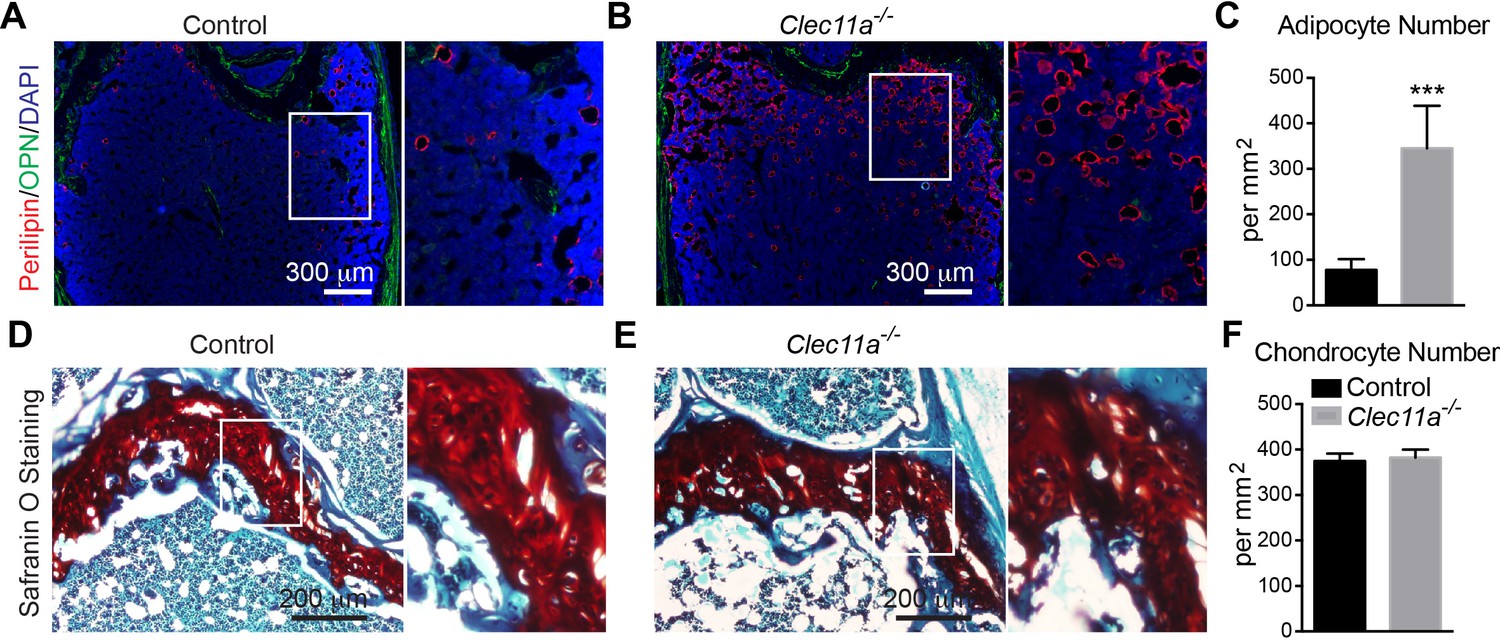
Clec11a is necessary for osteogenic differentiation.
(A–D) Osteogenic differentiation in culture of bone marrow stromal cells from the femur bone marrow of Clec11-/- mice and sex-matched littermate controls. Alkaline phosphatase staining and alizarin red staining were performed after seven days (A and B) and 14 days (C and D) to quantify osteoblast differentiation and mineralization (n = 3 independent experiments). (E and F) Adipogenic differentiation in culture of bone marrow stromal cells from the femur bone marrow of Clec11-/- mice and sex-matched littermate controls. Oil red O staining was performed after four days (n = 3 independent experiments). (G and H) Chondrogenic differentiation in cell pellets of bone marrow stromal cells from the femur bone marrow of Clec11-/- mice and sex-matched littermate controls. Toluidine blue staining was performed on cryosectioned cell pellets after 21 days (n = 3 independent experiments). (I–K) Representative perilipin and osteopontin (OPN) staining in femur sections of two month-old Clec11-/- mice and sex-matched littermate controls (I and J) as well as the number of adipocytes per mm2 in sections through the bone marrow metaphysis (K) (n = 3 mice per genotype, total, from three independent experiments). (L–N) Representative Safranin O/fast green staining in femur sections of two month-old Clec11a-/- mice and sex-matched littermate controls (L and M) as well as the number of chondrocytes per mm2 in sections through the growth plate (N) (n = 3 mice per genotype from three independent experiments). The statistical significance of differences among genotypes was assessed using two-tailed Student’s t tests. All data represent mean ± SD (**p<0.01, ***p<0.001) from female mice. The source data are in Figure 3—source data 1.
-
Figure 3—source data 1
Data for Figure 3 and Figure 3—figure supplements 1 and 2.
- https://doi.org/10.7554/eLife.18782.009
Figure 3—figure supplement 1
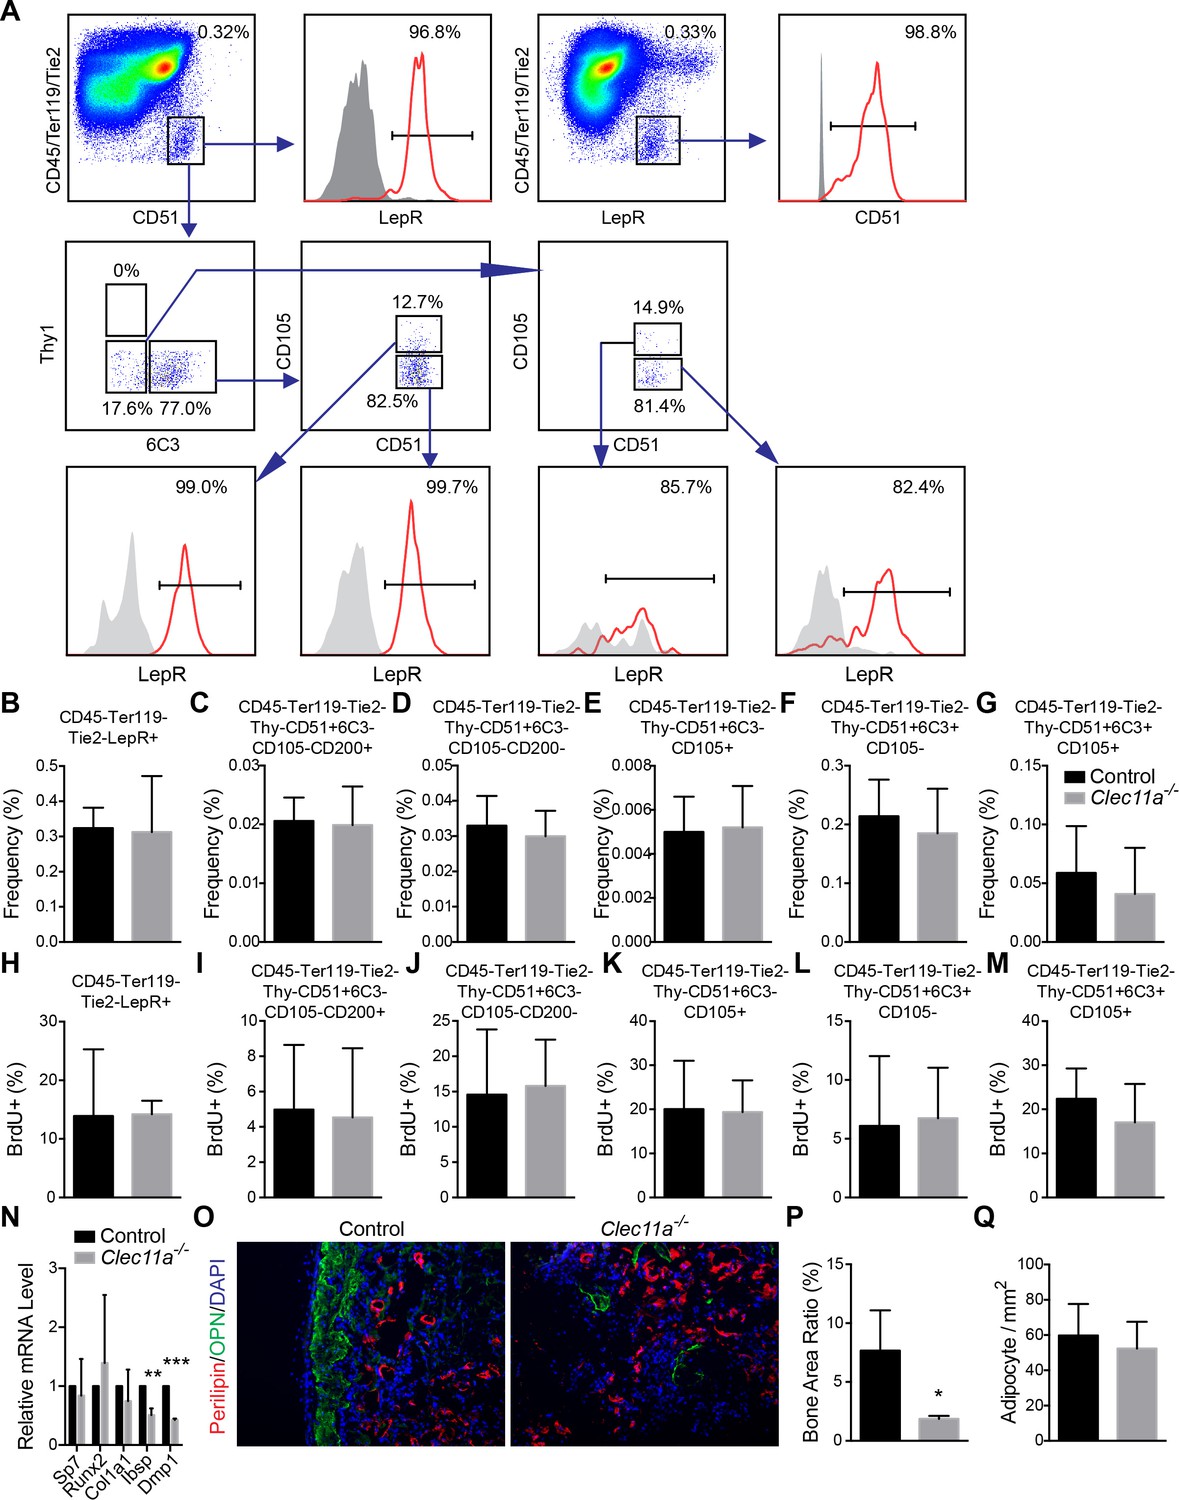
Analysis of osteoprogenitor populations and in vivo transplantation of bone marrow stromal cells.
(A) Gating strategy for analysis of osteoprogenitor populations from dissociated bone marrow. (B–G) Frequency analysis of different osteogenic progenitors in the growth plate region of 10 month-old Clec11a-/- mice and sex-matched control littermates (n = 5 mice per genotype, total, from three independent experiments). (H–M) Cell cycle analysis of different osteogenic progenitors in the growth plate region of 10 month-old Clec11a-/- mice and sex-matched control littermates after 14 days of BrdU labeling (n = 5 mice per genotype, total, from three independent experiments). (N) qPCR analysis in osteogenic differentiation cultures of BMSCs from Clec11a-/- mice and control littermates (n = 3 mice per genotype, total, from three independent experiments). (O) Representative perilipin and osteopontin (OPN) staining in ossicle sections. Bone marrow stromal cells from Clec11-/- mice and sex-matched littermate controls (I and J) were subcutaneously transplanted into NSG mice with collagen sponges (n = 3 mice per genotype, total, from three independent experiments). The bone ossicles were dissected eight weeks after transplantation for cryosection and immunostaining. (P and Q) Quantification of the percentage of total area that contained bone (P) and the number of adipocytes per mm2 in ossicles (Q; n = 3 independent experiments). The statistical significance of differences was assessed using two-tailed Student’s t tests. Data represent mean ± SD: *p<0.05, **p<0.01. All mice were female in these experiments. The source data are in Figure 3—source data 1.
Figure 3—figure supplement 2
Analysis of the number of adipocytes and chondrocytes in 10 month-old Clec11a-/- and control femur sections.
(A–C) Representative perilipin and osteopontin (OPN) staining in femur sections from 10 month-old Clec11-/- mice and sex-matched littermate controls (A and B) as well as the number of adipocytes per mm2 in sections through the bone marrow metaphysis (C) (n = 5 mice per genotype, total, from three independent experiments). (D–F) Representative Safranin O/fast green staining in femur sections from 10 month-old Clec11a-/- mice and sex-matched littermate controls (D and E) as well as the number of chondrocytes per mm2 in sections through the growth plate (F) (n = 5 mice per genotype, total, from three independent experiments). The statistical significance of differences was assessed using two-tailed Student’s t tests. Data represent mean ± SD (***p<0.001). All mice were female in these experiments. The source data are in Figure 3—source data 1.
Figure 4
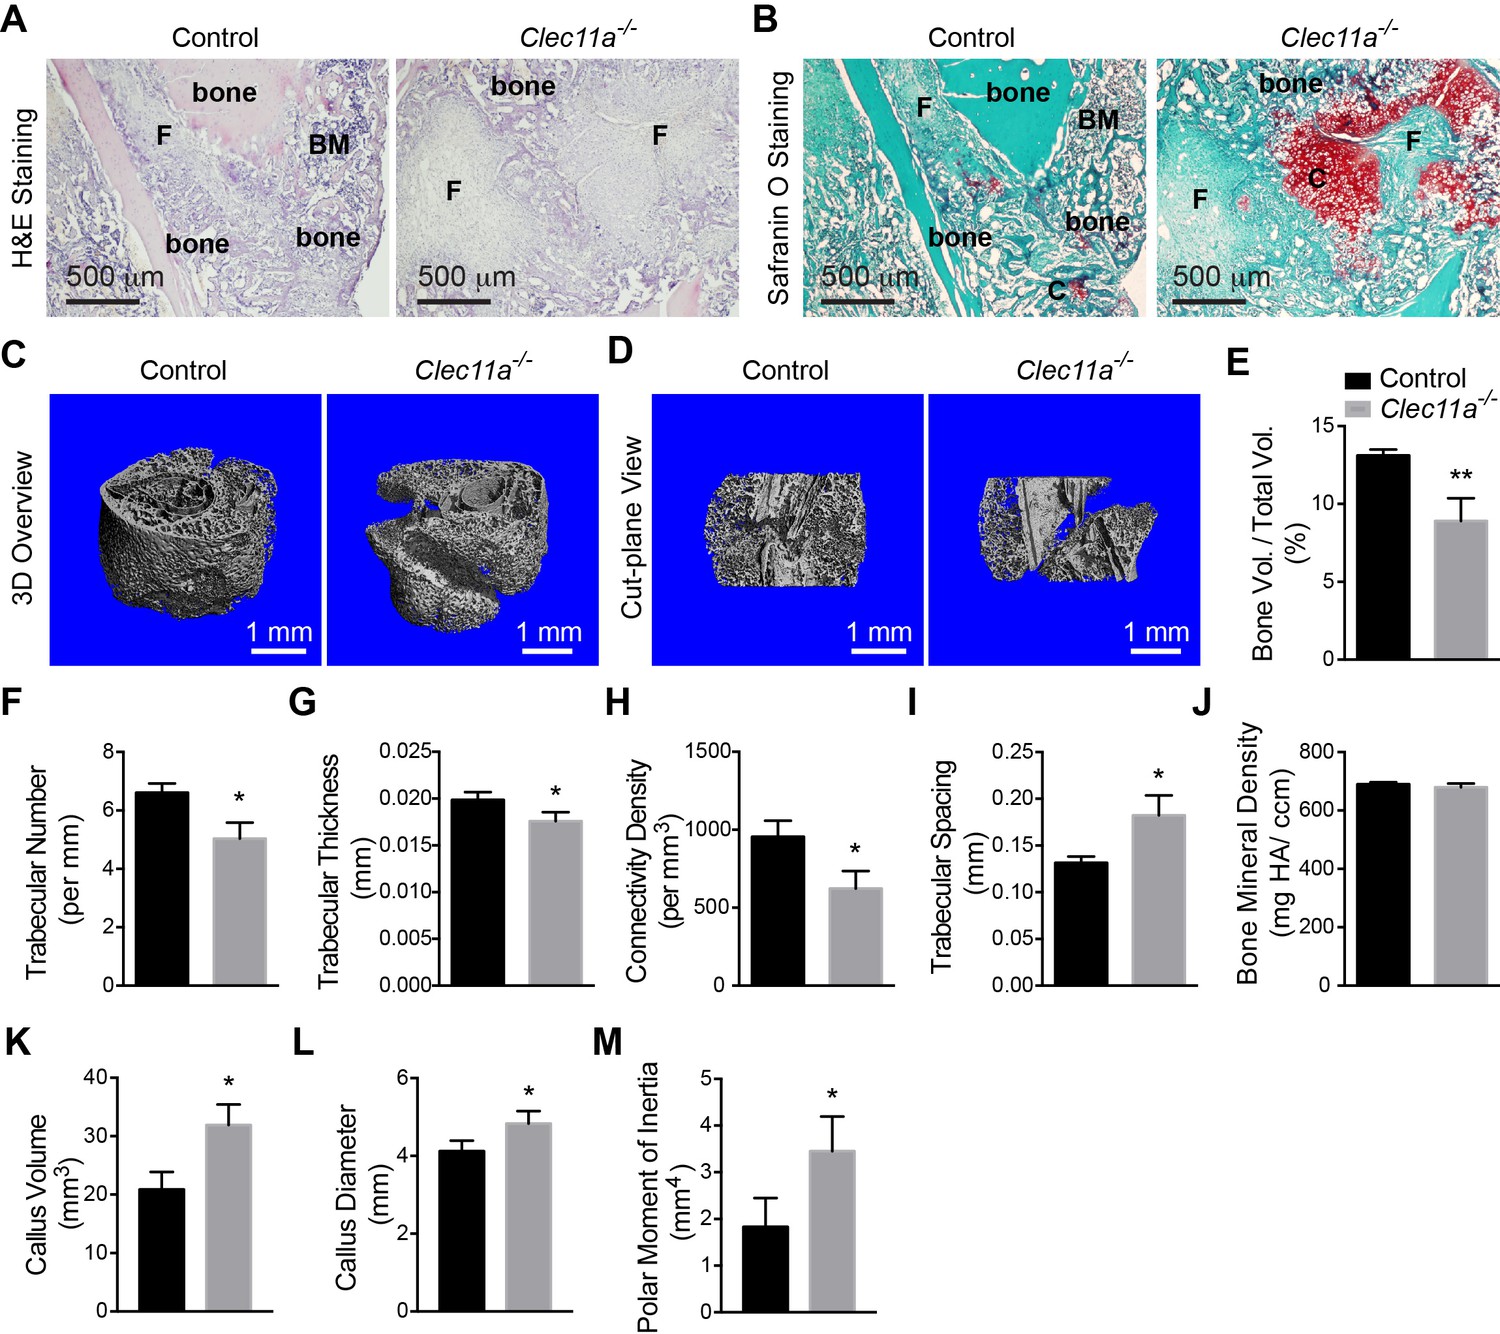
Clec11a is necessary for bone regeneration and fracture healing.
(A and B) Hematoxylin and eosin (A; dark blue = bone marrow cells; pink = bone) and Safranin O (B; red = cartilage) staining of the callus around the fracture site two weeks after bone fracture. F, fibrous tissue. BM, bone marrow. C, cartilage. (C and D) Representative microCT snapshot images of the callus (C) and cut-plane images around the fracture site (D) two weeks after bone fracture. (E–M) MicroCT analysis of trabecular bone volume/total volume (E), trabecular number (F), trabecular thickness (G), connectivity density (H), trabecular spacing (I), bone mineral density (J), callus volume (K), callus diameter (L) and polar moment of inertia (M) in the callus two weeks after bone fracture (n = 3 mice per genotype, total, from three independent experiments). The statistical significance of differences was assessed using two-tailed Student’s t tests. All data represent mean ± SD (*p<0.05, **p<0.01) from male mice that were two months old at the time of fracture. The source data are in Figure 4—source data 1.
-
Figure 4—source data 1
Data for Figure 4.
- https://doi.org/10.7554/eLife.18782.013
Figure 5 with 1 supplement
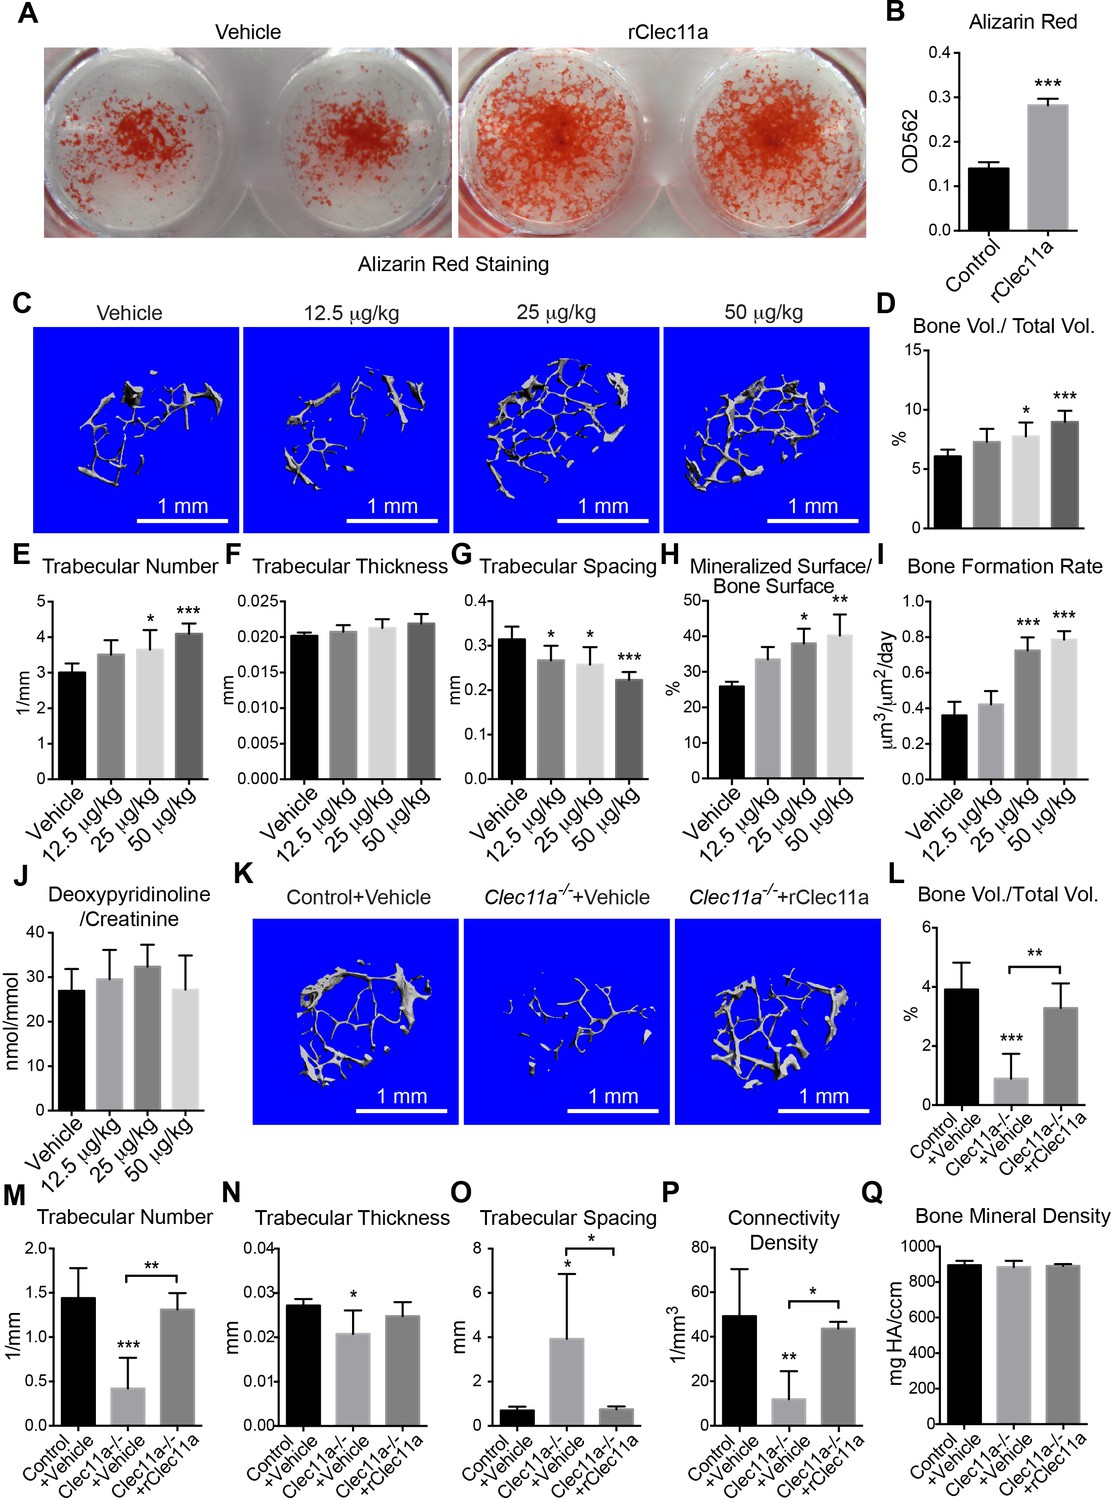
Recombinant Clec11a promotes osteogenesis in vitro and in vivo.
(A and B) Osteogenic differentiation of stromal cells from femur bone marrow of wild-type mice. Vehicle or 10 ng/ml rClec11a were added to osteogenic culture conditions and alizarin red staining was assessed 14 days later to test whether Clec11a would promote osteogenesis (n = 3 independent experiments with duplicate cultures per treatment per experiment). (C) Representative microCT images of trabecular bone in the distal femur metaphysis of wild-type female mice treated with daily subcutaneous doses of rClec11a for 28 days (panels C–G reflect n = 6 mice per treatment, total, from six independent experiments). (D–G) MicroCT analysis of trabecular bone parameters from the distal femur metaphysis of mice treated with daily subcutaneous doses of rClec11a for 28 days. (H and I) Mineralized surface/bone surface ratio (H) and bone formation rate (I) in trabecular bone in the femur metaphysis of mice treated with rClec11a for 28 days (n = 3 mice per genotype, total, from three independent experiments). (J) Bone resorption analysis based on the deoxypyridinoline/creatinine ratio in the urine (n = 4 mice per genotype, total, from four independent experiments). (K) Representative microCT images of trabecular bone in the distal femur metaphysis of control mice treated with vehicle, or Clec11a-/- mice treated with vehicle or 50 µg/kg daily subcutaneous injections of rClec11a for 28 days (panels K–Q reflect n = 4–6 mice per treatment, total, from four independent experiments). (L–Q) Trabecular bone parameters from the distal femur metaphysis of mice in the experiment shown in panel J. The statistical significance of differences among treatments was assessed using one-way ANOVAs with Tukey’s multiple comparison tests. All data represent mean ± SD (*p<0.05, **p<0.01, ***p<0.001) from female mice that were two months (C–J) or six months (K–Q) old at the start of the experiment. The source data are in Figure 5—source data 1.
-
Figure 5—source data 1
Data for Figure 5 and Figure 5—figure supplement 1.
- https://doi.org/10.7554/eLife.18782.015
Figure 5—figure supplement 1
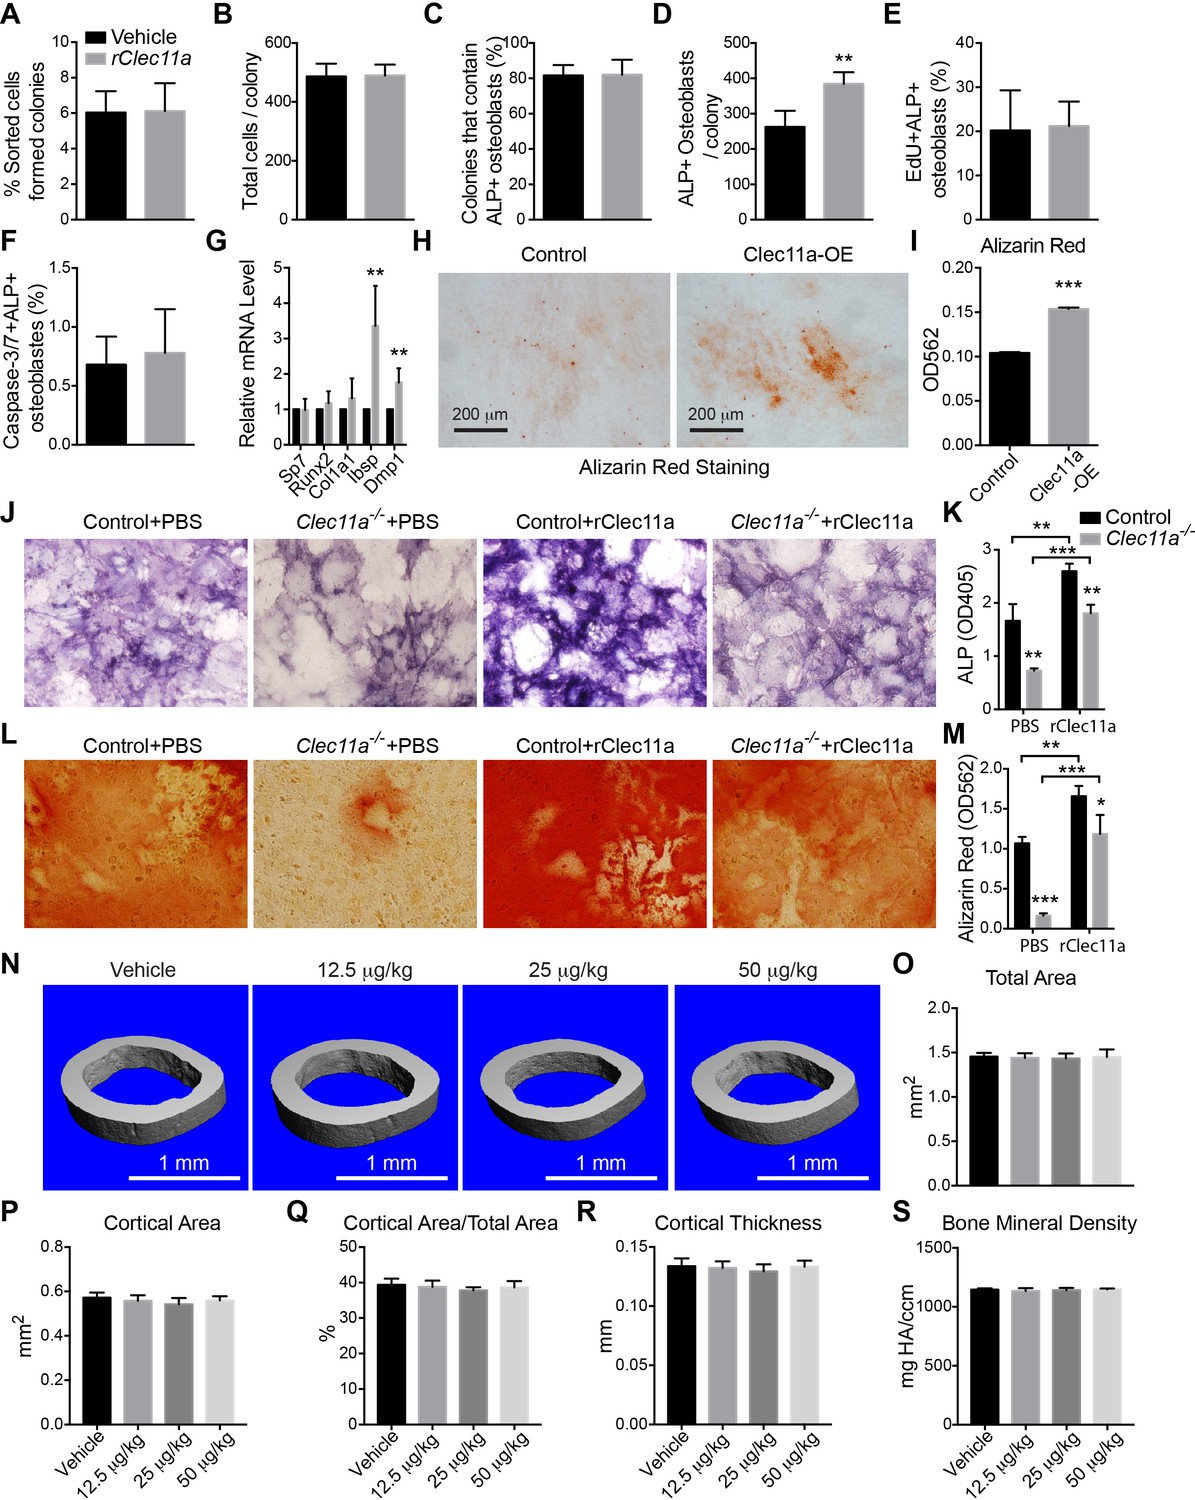
Effects of rClec11a on osteogenic differentiation and cortical bone analysis in mice wild-type mice treated with rClec11a.
(A and B) Percentage of sorted LepR+CD105+CD45-Ter119-CD31- femur bone marrow cells that formed CFU-F (A) and the total number of cells per colony (B) when cultured with or without 10 ng/ml rClec11a for eight days (n = 5 independent experiments). (C and D) Clonal osteogenic differentiation of sorted LepR+CD105+CD45-Ter119-CD31- femur bone marrow cells in the presence or absence of 10 ng/ml rClec11a. The percentage of colonies that contained osteoblasts (C) and the total number of osteoblasts per colony (D) based on alkaline phosphatase staining (n = 5 independent experiments). (E and F) rClec11a did not affect the proliferation or survival of osteoblasts in culture. EdU was added into the medium to quantify the proliferation of osteoblasts for eight days. Caspase-3/7 activity was detected on day eight of differentiation to quantify the frequency of apoptotic osteoblasts (n = 5 independent experiments). (G) qPCR analysis of osteogenic markers (n = 4 independent experiments). (H and I) MC3T3-E1 cells expressing empty vector or mouse Clec11a cDNA were subjected to osteogenic differentiation for 14 days (n = 3 independent experiments with duplicate cultures per treatment per experiment). The statistical significance of differences in panels A–I was assessed using two-tailed Student’s t tests. (J–M) Osteogenic differentiation in culture of stromal cells from Clec11-/- or littermate control femur bone marrow, with or without rClec11a. Alkaline phosphatase staining and alizarin red staining were performed after seven days (J and K) or 14 days (L and M) to quantify osteoblast differentiation and mineralization (n = 3 independent experiments). (N) Representative microCT images of cortical bone in the femur diaphysis of two month-old wild-type female mice injected with vehicle or various doses of rClec11a. (O–S) MicroCT analysis of the total area (O), cortical area (P), cortical area/total area (Q), cortical thickness (R) and cortical bone mineral density (S) in the femur diaphysis (n = 6 mice per genotype, total, from six independent experiments). The statistical significance of differences was assessed using one-way ANOVAs with Tukey’s multiple comparison tests. Data represent mean ± SD (**p<0.01, **p<0.001). All mice were female in these experiments. The source data are in Figure 5—source data 1.
Figure 6 with 2 supplements
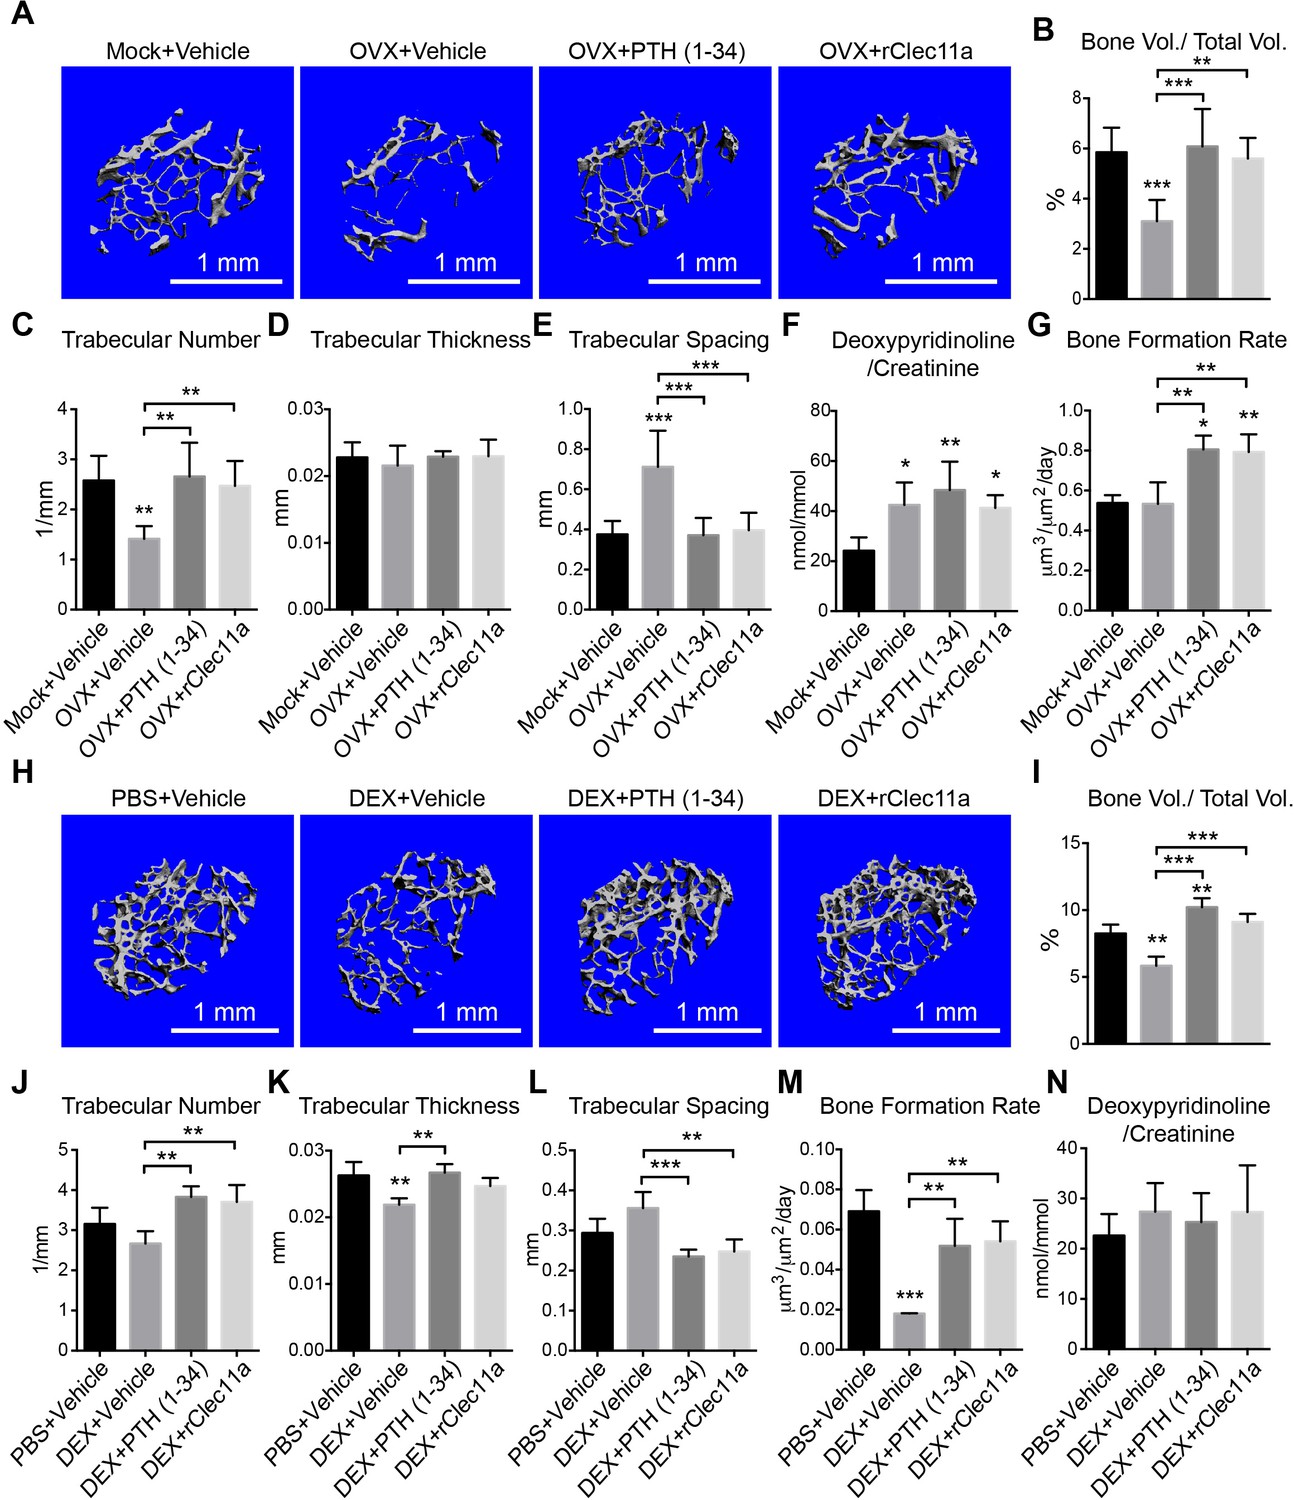
Recombinant Clec11a prevents osteoporosis.
(A) Representative microCT images of trabecular bone in the distal femur metaphysis. Two month-old sham operated (Mock) or ovariectomized (OVX) female mice received daily subcutaneous injections with vehicle, 40 µg/kg human PTH, or 50 µg/kg rClec11a for 28 days. (B–E) MicroCT analysis of trabecular bone parameters in the distal femur metaphysis of the mice from the experiment in panel A (n = 6–8 mice per treatment, total, from six independent experiments). (F) Bone resorption analysis based on the deoxypyridinoline/creatinine ratio in the urine (n = 4 mice per treatment, total, from four independent experiments). (G) Trabecular bone formation rate based on calcium double labeling in the distal femur metaphysis (n = 3–4 mice per treatment, total, from at least three independent experiments). (H) Representative microCT images of trabecular bone in the distal femur metaphysis. Two month-old wild-type female mice were treated with daily intraperitoneal injections of PBS or 20 mg/kg dexamethasone (DEX) for 28 days, with or without daily subcutaneous injections of vehicle, 40 µg/kg human PTH, or 50 µg/kg rClec11a. (I–L) Trabecular bone parameters of mice from the same experiments (panels I–N reflect n = 4 mice per treatment, total, from four independent experiments). (M) Trabecular bone formation rate based on calcium double labeling in the distal femur metaphysis (n = 3–4 mice per treatment, total, from at least three independent experiments). (N) Bone resorption analysis based on the deoxypyridinoline/creatinine ratio in the urine (n = 4 mice per treatment, total, from four independent experiments). The statistical significance of differences was assessed using one-way ANOVAs with Tukey’s multiple comparisons tests. All data represent mean ± SD (*p<0.05, **p<0.01, ***p<0.001) from female mice that were two months old at the start of the experiment. The source data are in Figure 6—source data 1.
-
Figure 6—source data 1
Data for Figure 6 and Figure 6—figure supplement 1 and 2.
- https://doi.org/10.7554/eLife.18782.018
Figure 6—figure supplement 1
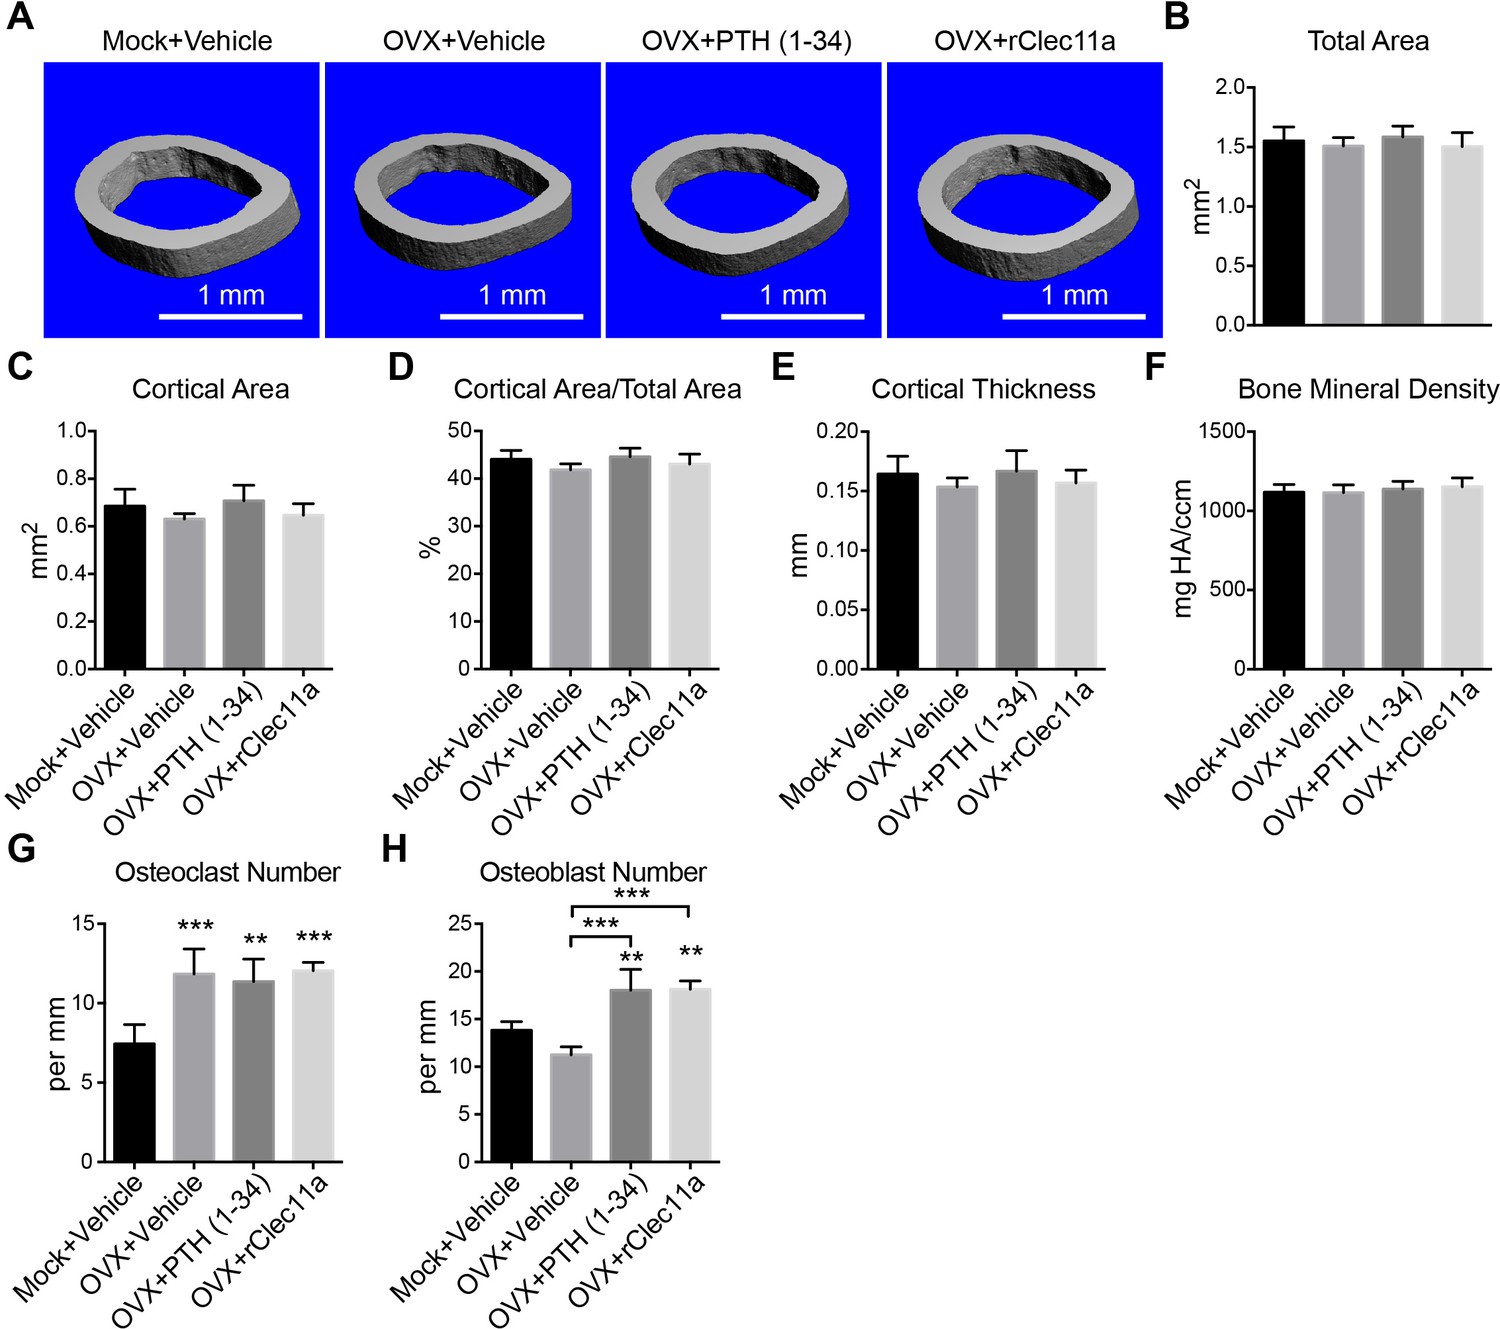
Cortical bone analysis in ovariectomized mice.
(A) Representative microCT images of cortical bone in the femur diaphysis. Two month-old sham operated (Mock) or ovariectomized (OVX) female mice were injected with vehicle, 40 µg/kg human PTH (1–34) or 50 µg/kg rClec11a for 28 days. (B–F) MicroCT analysis of the total area (B), cortical area (C), cortical area/total area (D), cortical thickness (E) and cortical bone mineral density (F) in the femur diaphysis (n = 6–8 mice per genotype, total, from six independent experiments). (G and H) Histomorphometry analysis of osteoclast number/bone surface and osteoblast number/bone surface in trabecular bone from the distal femur metaphysis (n = 4 mice per genotype, total, from four independent experiments). The statistical significance of differences was assessed using one-way ANOVAs with Tukey’s multiple comparison tests. Data represent mean ± SD (**p<0.01, ***p<0.001). All mice were female in these experiments. The source data are in Figure 6—source data 1.
Figure 6—figure supplement 2

Hematopoietic and cortical bone analysis in dexamethasone-injected mice.
(A–D) White blood cell (A), neutrophil (B), lymphocyte (C) and monocyte (D) counts in two month-old wild-type female mice treated with daily intraperitoneal injections of PBS or 20 mg/kg dexamethasone (DEX) for 28 days, with or without daily subcutaneous injections of vehicle, 40 µg/kg human PTH, or 50 µg/kg rClec11a (n = 4 mice per genotype, total, from four independent experiments). (E) Representative microCT images of cortical bone in the femur diaphysis of the same mice. (F–J) MicroCT analysis of the total area (B), cortical area (C), cortical area/total area (D), cortical thickness (E) and cortical bone mineral density (F) in the femur diaphysis of the mice in this experiment (panels F–M, n = 4 mice per genotype, total, from four independent experiments). (K) Plasma Clec11a level measurement by ELISA. (L and M) Histomorphometry analysis of osteoclast number/bone surface and osteoblast number/bone surface in trabecular bone from the distal femur metaphysis. The statistical significance of differences among treatments was assessed using one-way ANOVAs with Tukey’s multiple comparison tests. Data represent mean ± SD: **p<0.01, ***p<0.001. Data represent mean ± SD (**p<0.01, ***p<0.001). All mice were female in these experiments. The source data are in in Figure 6—source data 1.
Figure 7 with 1 supplement

Recombinant Clec11a reverses osteoporosis and promotes osteogenesis by human bone marrow stromal cells.
(A) Representative microCT images of trabecular bone in the distal femur metaphysis. Two month-old sham operated (Mock) or ovariectomized (OVX) female mice were left untreated for 28 days for osteoporosis to develop, and then received daily subcutaneous injections with vehicle, 40 µg/kg human PTH, or 50 µg/kg rClec11a for another 28 days. (B–G) MicroCT analysis of trabecular bone parameters in the distal femur metaphysis of the mice from the experiment in panel A (panels B–G reflect n = 4 mice per treatment, total, from four independent experiments). The statistical significance of differences among treatments was assessed using one-way ANOVAs with Tukey’s multiple comparisons tests. All data represent mean ± SD (*p<0.05, **p<0.01, ***p<0.001) from female mice that were two months old at the start of the experiment. (H–K) Osteogenic differentiation in culture of hMSCs. Alkaline phosphatase staining and alizarin red staining were performed after eight days (H and I) and 21 days (J and K) to quantify osteoblast differentiation and mineralization (n = 6 independent experiments). (L–O) Ossicle formation by human bone marrow stromal cells in NSG mice. Vehicle or 50 µg/kg rhClec11a was subcutaneously injected daily for 4 (L and M) or 8 (N and O) weeks before the ossicles were dissected and sectioned for H and E staining (n = 5–9 ossicles per treatment, total, from two independent experiments). F, fibrous tissue. HA, HA/TCP carrier. The statistical significance of differences in H–O was assessed using two-tailed Student’s t tests. Data represent mean ± SD (*p<0.05 **p<0.01, ***p<0.001). The source data are in Figure 7—source data 1.
-
Figure 7—source data 1
Data for Figure 7 and Figure 7—figure supplement 1.
- https://doi.org/10.7554/eLife.18782.022
Figure 7—figure supplement 1

Cortical bone analysis in ovariectomized mice.
(A) Representative microCT images of cortical bone in the femur diaphysis. Two month-old sham operated (Mock) or ovariectomized (OVX) female mice were left untreated for 28 days, and then injected daily with vehicle, 40 µg/kg human PTH (1–34) or 50 µg/kg rClec11a for another 28 days. (B–F) MicroCT analysis of the total area (B), cortical area (C), cortical area/total area (D), cortical thickness (E) and cortical bone mineral density (F) in the femur diaphysis (n = 4 mice per genotype, total, from four independent experiments). The statistical significance of differences among treatments was assessed using one-way ANOVAs with Tukey’s multiple comparison tests. Data represent mean ± SD (*p<0.05, **p<0.01, ***p<0.001). All mice were female in these experiments. The source data are in Figure 7—source data 1.
Download links
A two-part list of links to download the article, or parts of the article, in various formats.
Downloads (link to download the article as PDF)
Open citations (links to open the citations from this article in various online reference manager services)
Cite this article (links to download the citations from this article in formats compatible with various reference manager tools)
Clec11a/osteolectin is an osteogenic growth factor that promotes the maintenance of the adult skeleton
eLife 5:e18782.
https://doi.org/10.7554/eLife.18782


