NPAS1-ARNT and NPAS3-ARNT crystal structures implicate the bHLH-PAS family as multi-ligand binding transcription factors
- Sanford Burnham Prebys Medical Discovery Institute, United States
- Argonne National Laboratory, United States
Figures
Figure 1 with 3 supplements
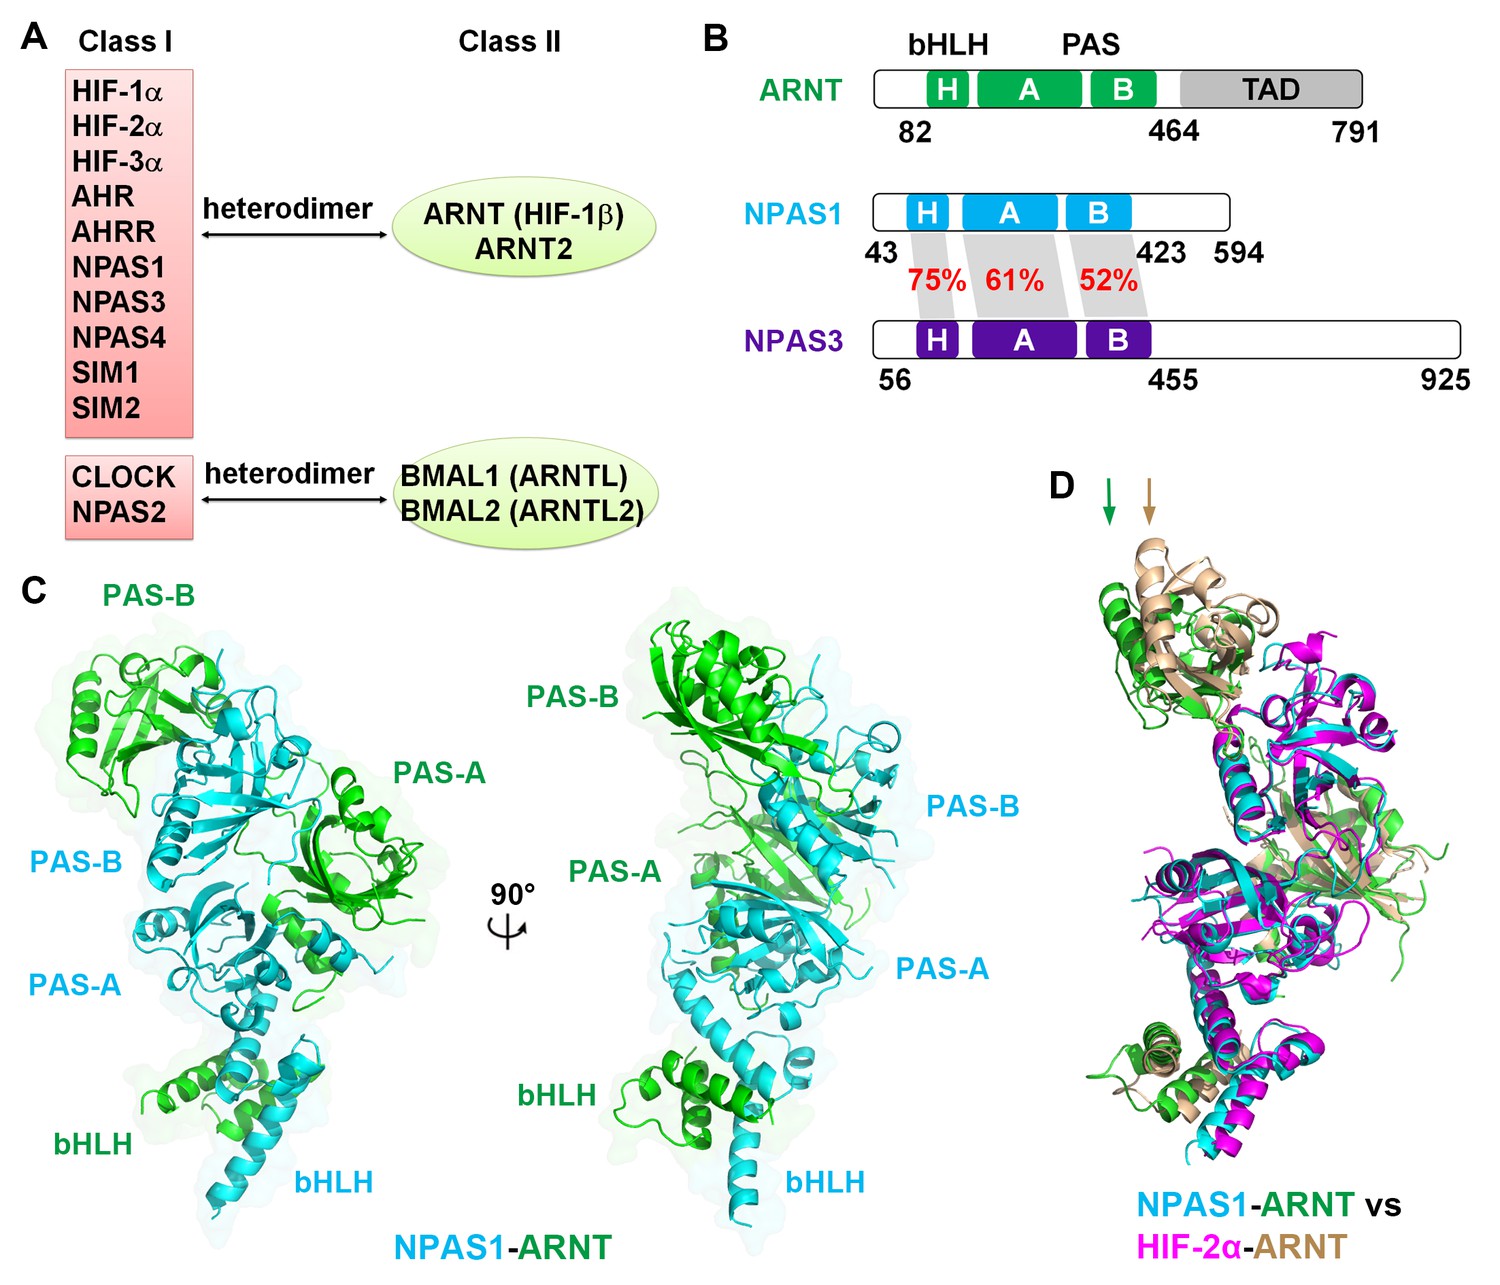
Comparison of bHLH-PAS proteins.
(A) Heterodimerization patterns between bHLH-PAS proteins. (B) Protein domain arrangements of ARNT, NPAS1 and NPAS3. Percent amino-acid identities between corresponding domains of NPAS1 and NPAS3 are in red. (C) Overall crystal structure of the NPAS1-ARNT complex shown in two views. (D) Superposition of NPAS1-ARNT and HIF-2α-ARNT heterodimers. The arrows on top show the shift in position for the PAS-B domain of ARNT.
Figure 1—figure supplement 1
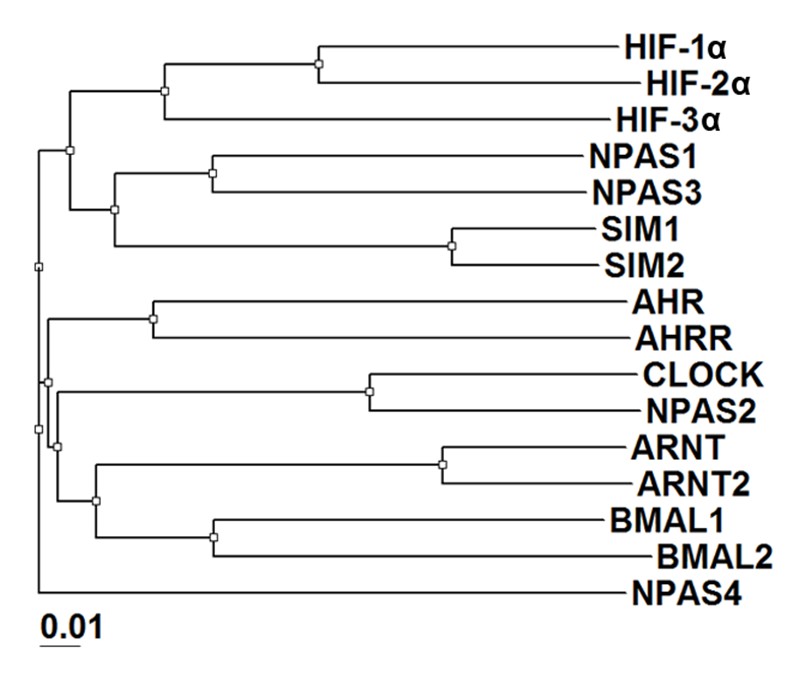
Phylogenetic tree of all mouse bHLH-PAS family members based on protein sequences at their bHLH-PAS-A-PAS-B regions.
https://doi.org/10.7554/eLife.18790.004
Figure 1—figure supplement 2
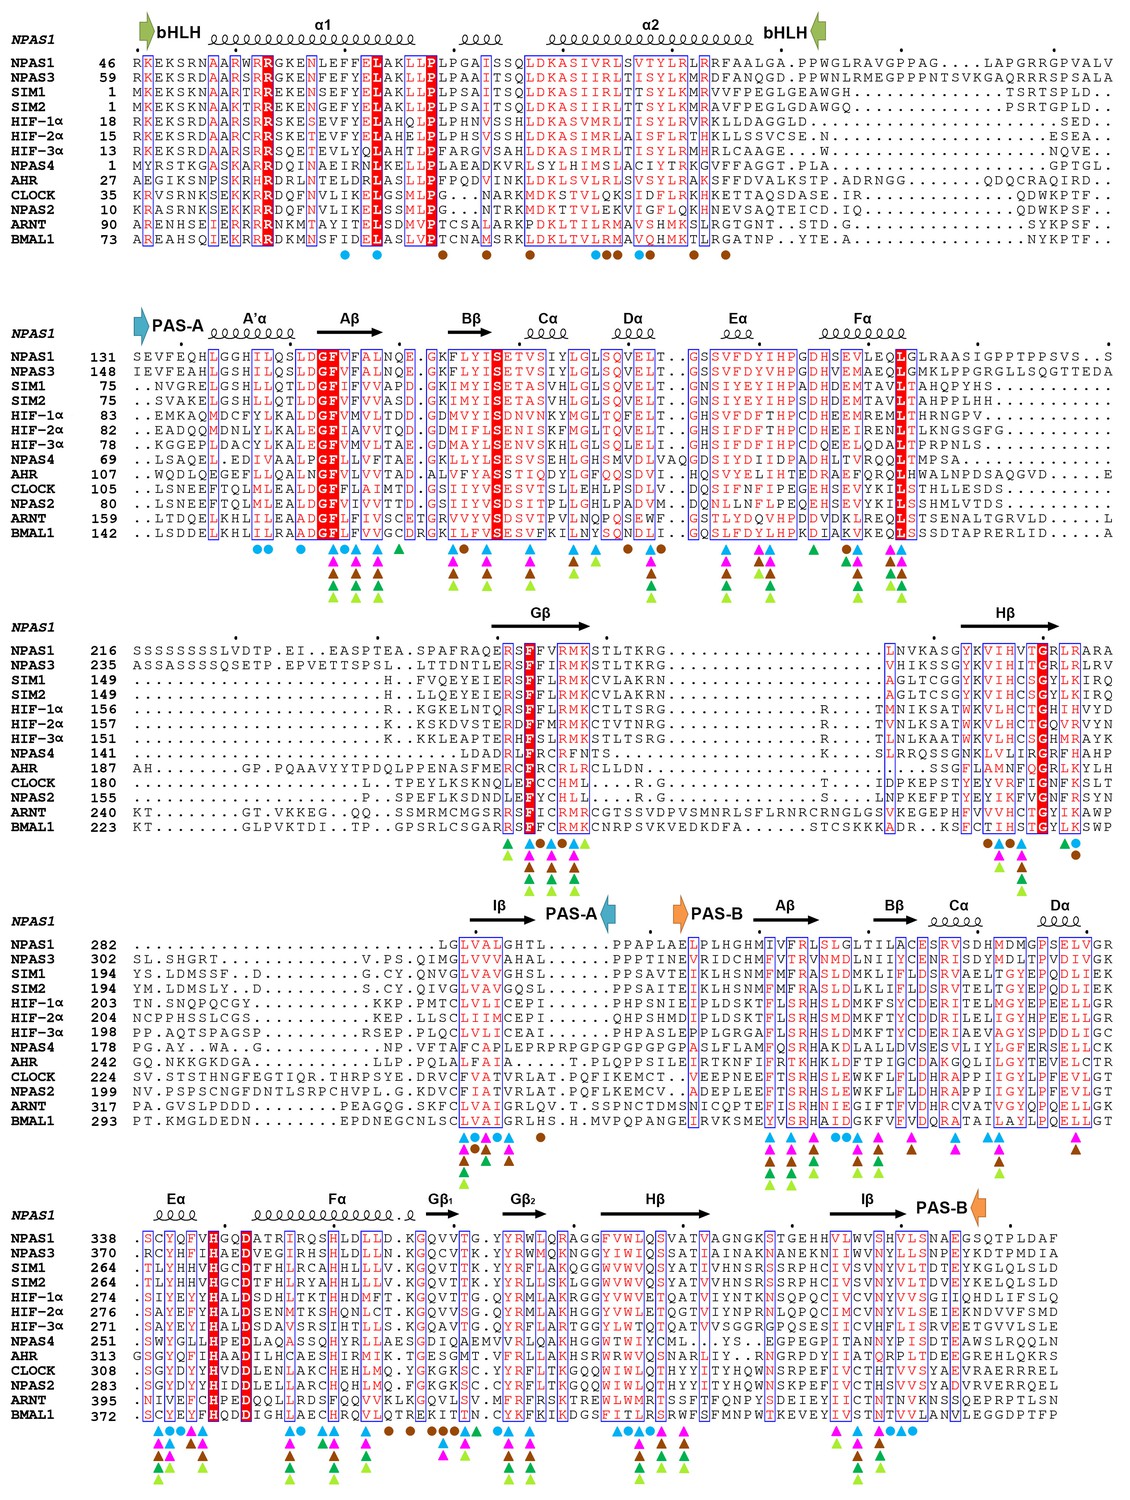
Comparative protein sequence analysis of mouse bHLH-PAS proteins.
The bHLH, PAS-A and PAS-B segments, and the secondary structure components of NPAS1 are shown above the alignment. The NPAS1 residues interacting directly with ARNT (at interface 1–4) are marked using cyan round dots, while those at intra-molecular interfaces (5 and 6) are marked with brown round dots. Triangles show pocket amino-acids in NPAS1, HIF-2α, CLOCK, ARNT and BMAL1 (in cyan, magenta, brown, green and lime colors, respectively).
Figure 1—figure supplement 3
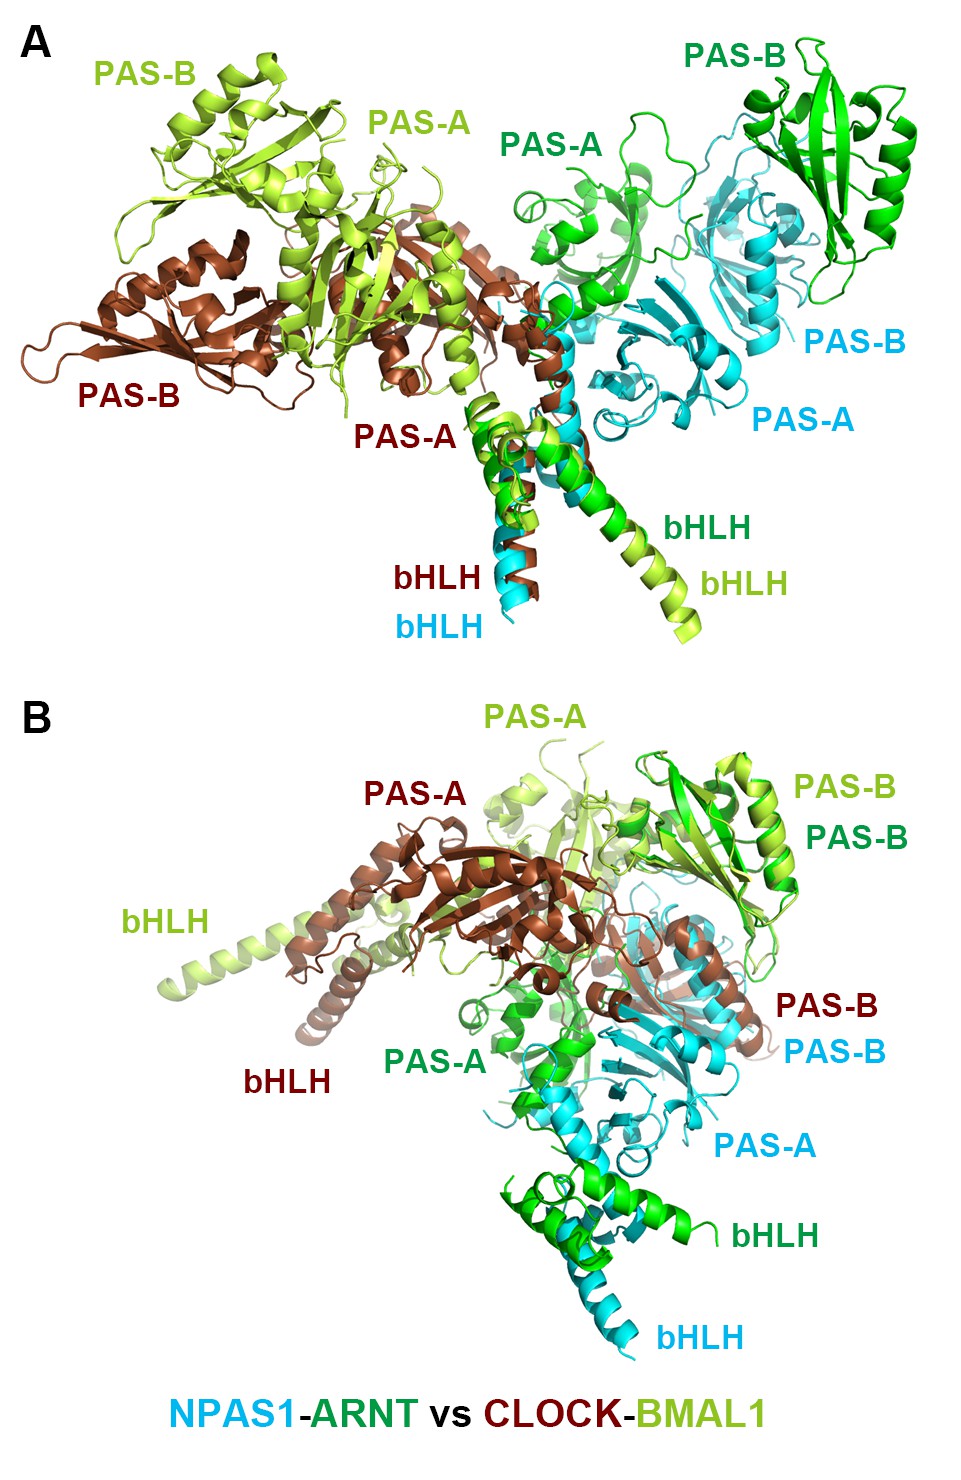
Comparison of the overall structures of NPAS1-ARNT and CLOCK-BMAL1 complexes.
The two complexes are superimposed by aligning the bHLH domains (A) or PAS-B domains (B) of ARNT with BMAL1, respectively.
Figure 2
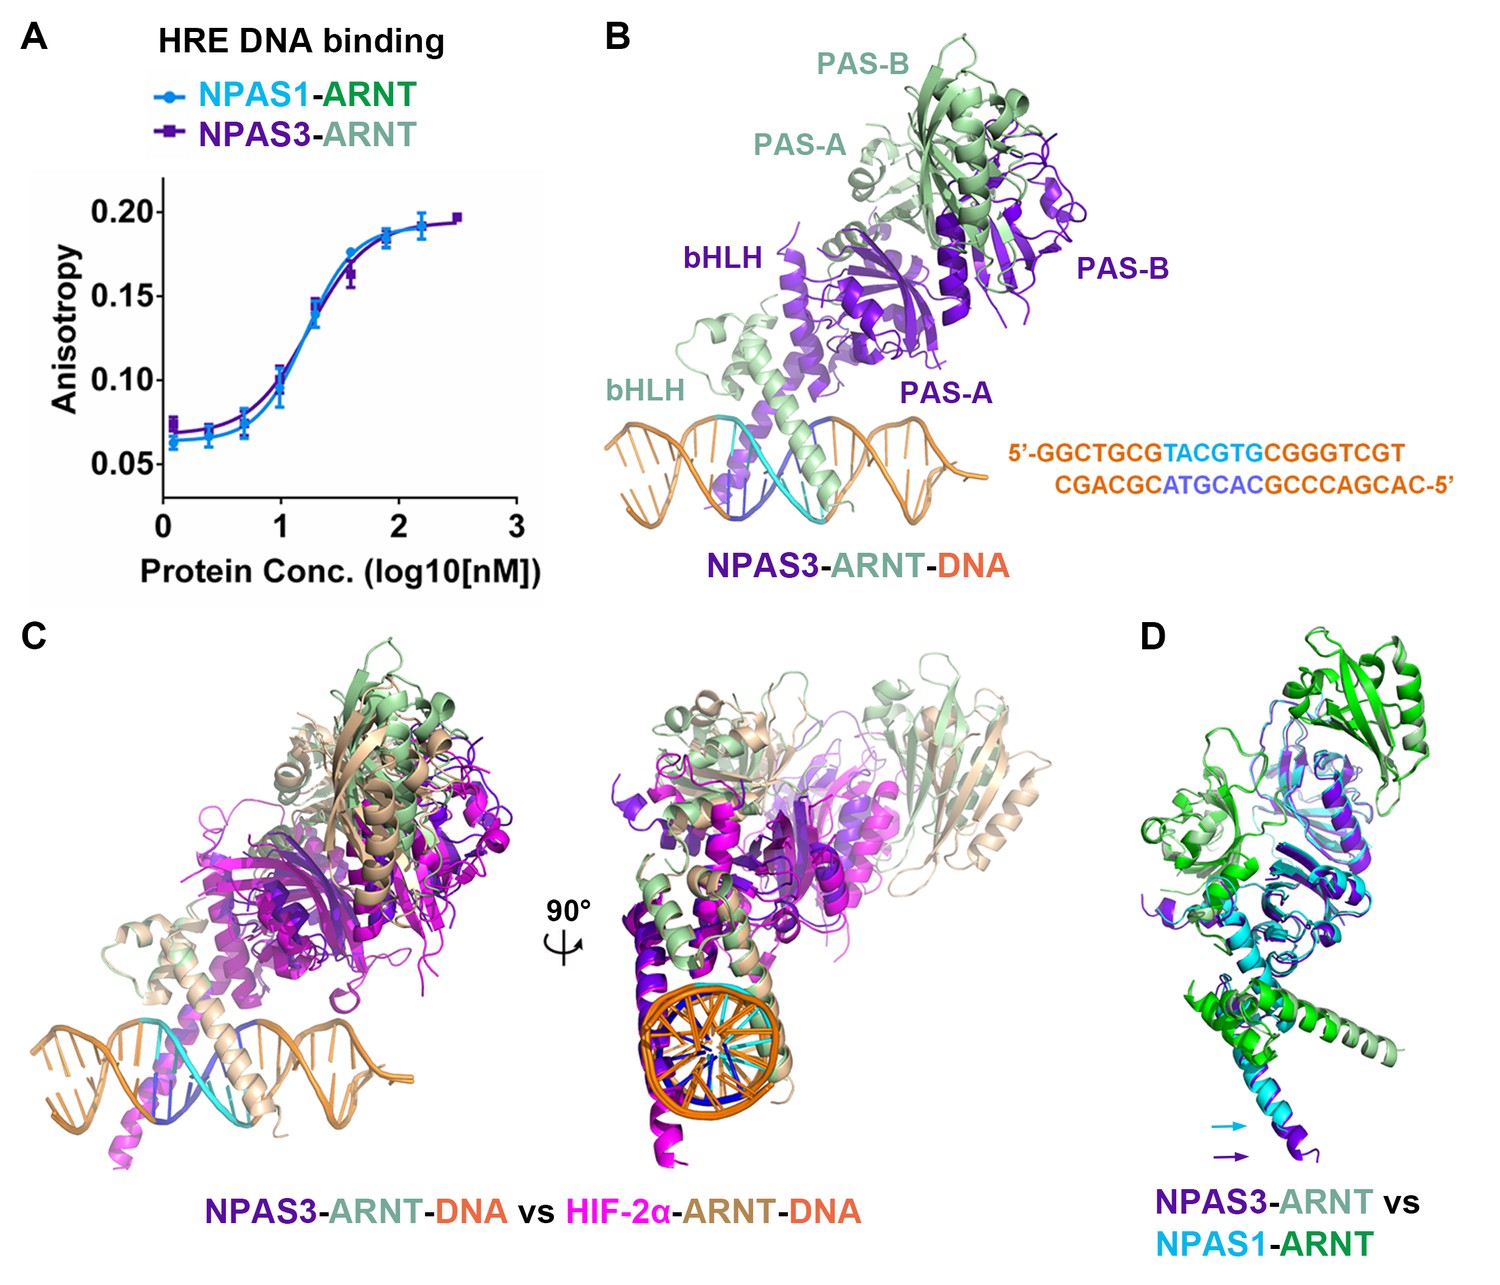
Comparison of NPAS1-ARNT and NPAS3-ARNT complexes.
(A) DNA-binding affinities measured using fluorescence anisotropy. The Kd values of NPAS1-ARNT and NPAS3-ARNT binding to the same HRE element were 16.3 ± 1.1 nM and 17.5 ± 1.1 nM, as calculated from three technical replicates respectively. (B) Overall structures of the NPAS3-ARNT-DNA, with the hexameric HRE site colored in cyan and blue. (C) Structure comparison of NPAS3-ARNT-DNA and HIF-2α-ARNT-DNA complexes aligned on their DNA. (D) Superposition of NPAS3-ARNT and NPAS1-ARNT structures. DNA was omitted from the NPAS3-ARNT complex. Arrows show the extension of α1 helices likely associated with its DNA binding.
Figure 3 with 1 supplement
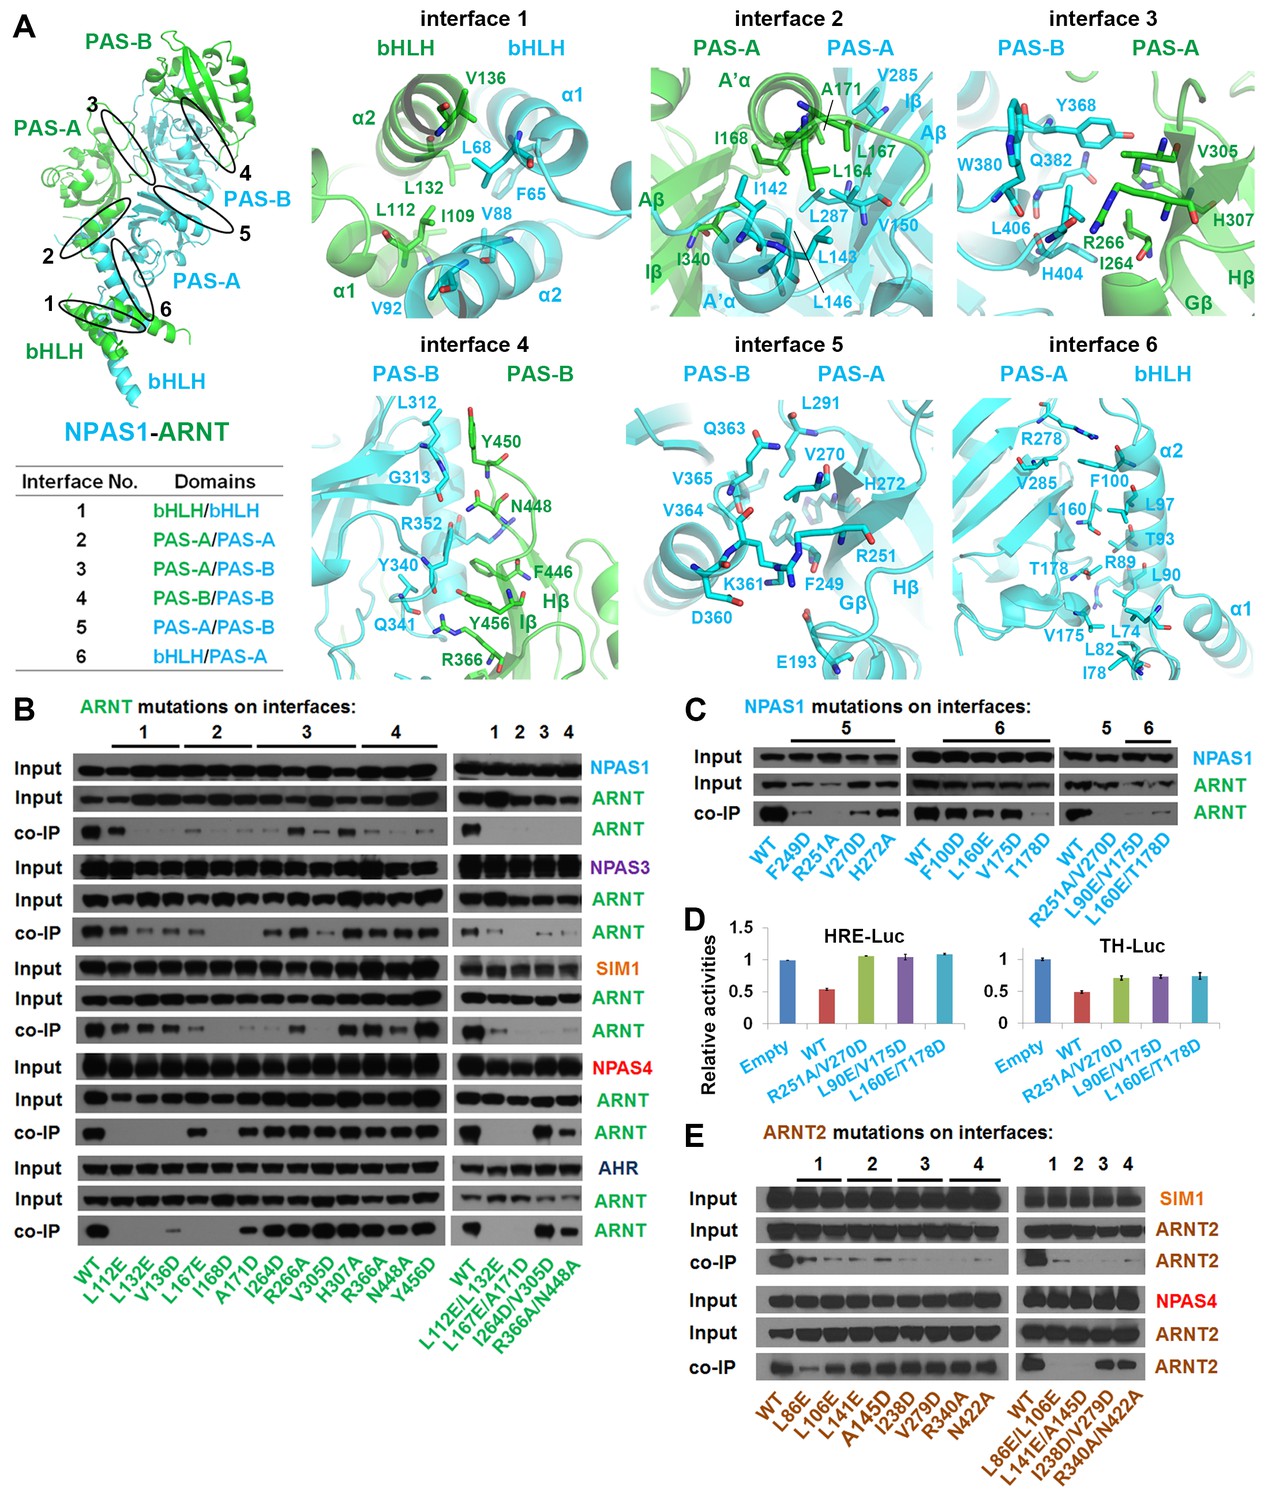
Testing of domain interfaces in NPAS1-ARNT and other ARNT heterodimers using mutagenesis.
(A) Detailed interactions at each of six interfaces in NPAS1-ARNT. Each junction is circled in the context of the overall structure of NPAS1-ARNT on the left, and each interface is further listed in the table. (B) Co-IP experiments showing the effects of ARNT mutations at interfaces 1–4 on the cellular stabilities of heterodimers formed with NPAS1, NPAS3, SIM1, NPAS4 and AHR, respectively. (C) Co-IP experiments showing the effects of NPAS1 mutations at interfaces 5 and 6 on the stabilities of NPAS1-ARNT heterodimer. (D) Luciferase reporter assay testing the effects of NPAS1 (wide-type and three mutants) on HRE-driven (left) and tyrosine hydroxylase (TH) promoter-driven (right) transactivation. Each sample represents the average reading of cells from three wells. (E) Co-IP experiments showing the effects of ARNT2 mutations at interfaces 1–4 (corresponding to ARNT) on the stabilities of heterodimers formed with SIM1 and NPAS4. The residues and mutants of ARNT, NPAS1 and ARNT2 are labelled in green, cyan and brown, respectively.
Figure 3—figure supplement 1
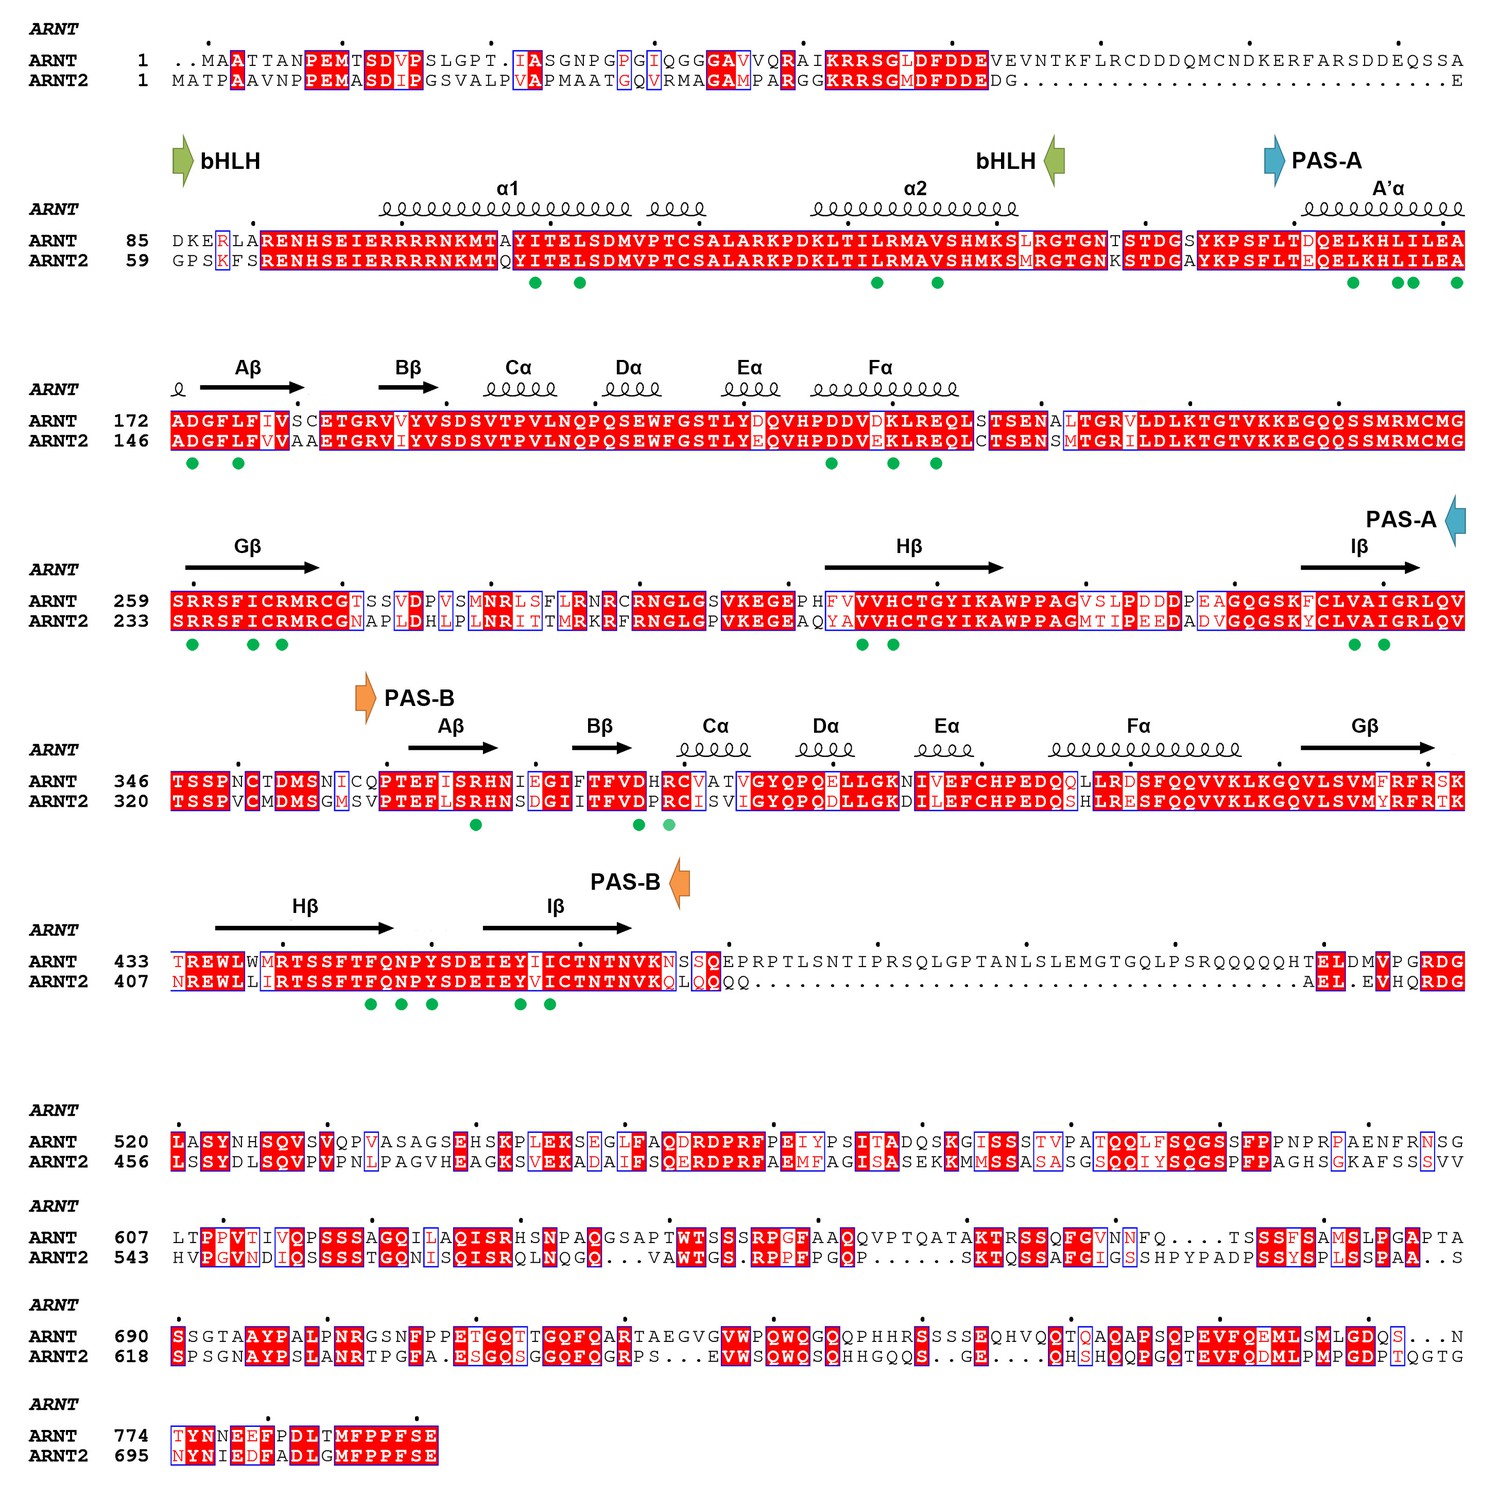
Amino-acid sequence alignment of full-length mouse ARNT and ARNT2 proteins.
Secondary structures and positions of the bHLH, PAS-A and PAS-B domains of ARNT are indicated on top. The ARNT residues participating at dimerization interfaces are indicated with green dots.
Figure 4
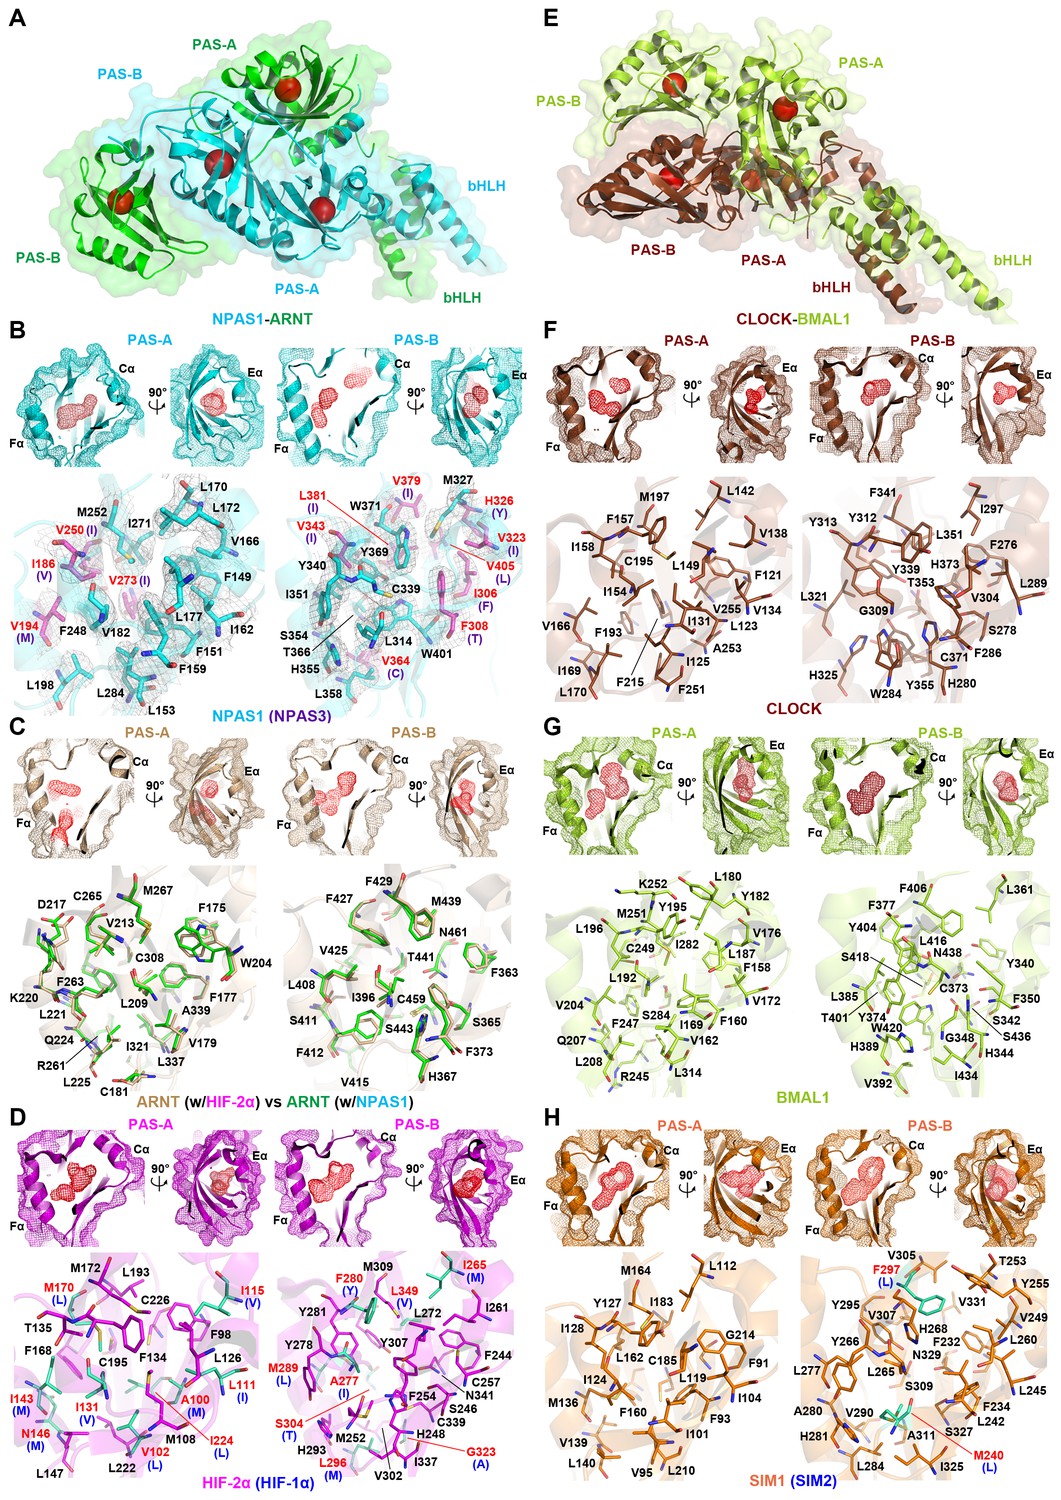
Comparison of ligand-binding pockets among multiple bHLH-PAS proteins.
(A and E) Relative positions of the four pockets (red circles) within the structures of NPAS1-ARNT (A) and CLOCK-BMAL1 (E) complexes. (B–D and F–H) Empty pockets in each of PAS-A and PAS-B domains of NPAS1 (B), ARNT (C), HIF-2α (D), CLOCK (F), BMAL1 (G) and SIM1 (H). The accessible cavities are shown in red meshes, together with the amino-acid residues lining each pocket. For NPAS1, the surrounding residues are further covered with 2FO – FC map contoured at 1.0σ (B). The NPAS1 residues with identical counterparts in NPAS3 are in cyan and labelled in black, while those with non-conserved NAPS3 counterparts (indicated in parentheses) are in magenta and labelled in red (B). ARNT pocket residues from apo HIF-2α-ARNT complex (PDB: 4ZP4) (in wheat) and those from NPAS1-ARNT complex (in green) are superposed for comparison (C). The HIF-2α residues with identical counterparts in HIF-1α are in magenta, while those with non-conserved HIF-1α counterparts (indicated in parentheses) are in green (D). Structures of CLOCK (F) and BMAL1 (G) are from the CLOCK-BMAL1 complex (PDB: 4F3L) in brown and lime, respectively. The SIM1 structure in orange was modelled from NPAS1 and HIF-2α; and the pocket residues not conserved in SIM2 are in green with their SIM2 counterparts indicated in parentheses (H).
Tables
Table 1
Data collection and refinement statistics.
NPAS-ARNT | NPAS3-ARNT-DNA | |
|---|---|---|
Data collection | ||
Space group | P 1 | P 43 |
Cell dimensions | ||
a, b, c (Å) | 69.9, 81.2, 138.1 | 64.8, 64.8, 249.1 |
α, β, γ (°) | 90.4, 95.1, 107.4 | 90.0, 90.0, 90.0 |
Resolution (Å) | 50.0–3.20 (3.26–3.20)* | 50.0–4.20 (4.27–4.20) |
Rmerge | 5.5 (76.4) | 6.0 (84.8) |
CC* (highest resolution shell) | 0.793 | 0.971 |
CC1/2 (highest resolution shell) | 0.459 | 0.893 |
I/σI | 14.0 (1.2) | 20.0 (1.1) |
Completeness (%) | 98.6 (98.3) | 94.6 (72.3) |
Redundancy | 2.1 (2.2) | 5.2 (3.9) |
Refinement | ||
Resolution (Å) | 37.7–3.20 (3.32–3.20) | 36.9–4.20 (5.28–4.20) |
No. reflections | 39,096 (802) | 5868 (2120) |
Rwork/ Rfree (%) | 19.2/24.9 (28.3/40.4) | 29.5/36.2 (27.1/34.8) |
No. atoms | ||
Protein/DNA | 13,303 | 5313 |
Water | 0 | 0 |
B-factors | ||
Protein/DNA | 49.6 | 66.9 |
Water | - | - |
R.m.s deviations | ||
Bond lengths (Å) | 0.016 | 0.004 |
Bond angles (°) | 1.46 | 0.77 |
-
One crystal was used for each structure.
-
*Highest resolution shell is shown in parenthesis.
Table 2
Volumes of ligand-binding pockets of bHLH-PAS proteins.
Location | NPAS1 | NPAS3 | HIF-1α | HIF-2α | HIF-3α | ARNT | CLOCK | BMAL1 | NPAS2 | SIM1 | SIM2 |
|---|---|---|---|---|---|---|---|---|---|---|---|
PAS-A | 190 | 100 | 100 | 150 | 170 | 110 | 120 | 200 | 230 | 210 | 210 |
PAS-B | 180 | 230 | 160 | 370 | 590 | 210 | 140 | 220 | 170 | 370 | 310 |
-
Pocket volumes (Å3) were calculated using CASTp program (Dundas et al., 2006) using the default probe sphere radius of 1.4 Å. The PDB coordinate files used for NPAS1 and NPAS3 proteins were from the NPAS1-ARNT and NPAS3-ARNT-DNA complexes, the coordinates for ARNT and HIF-2α were from the apo HIF-2α-ARNT complex (PDB: 4ZP4), and the coordinates for CLOCK and BMAL1 were from the CLOCK-BMAL1 complex (PDB: 4F3L). The values of PAS-B domains of HIF-1α and HIF-3α (fatty acid bound) were from high-resolution single domain structures (PDBs: 4H6J and 4WN5), respectively. The PAS-A domain of HIF-3α, and both PAS domains of NPAS2, SIM1 and SIM2 were modeled using the SWISS-MODEL server (Biasini et al., 2014).
Download links
A two-part list of links to download the article, or parts of the article, in various formats.
Downloads (link to download the article as PDF)
Open citations (links to open the citations from this article in various online reference manager services)
Cite this article (links to download the citations from this article in formats compatible with various reference manager tools)
NPAS1-ARNT and NPAS3-ARNT crystal structures implicate the bHLH-PAS family as multi-ligand binding transcription factors
eLife 5:e18790.
https://doi.org/10.7554/eLife.18790


