Metabolite exchange between microbiome members produces compounds that influence Drosophila behavior
- Yale University, United States
- University of Georgia, United States
- University of Connecticut, United States
Figures
Figure 1 with 1 supplement

Drosophila detection of microbe-microbe metabolite exchange.
(A) T-maze setup and quantification. (B) Drosophila behavior toward yeasts (blue), acetic acid bacteria (red), and lactic acid bacteria (brown) (Supplementary file 2). Mean ± SEM of 12–36 replicates (n = 2–6 experiments). Each T-maze replicate uses a technical replicate of a microbial culture and one cohort of Drosophila maintained in separate vials for 3–5 days. Mock (two empty tubes), ACV (25% apple cider vinegar versus water), and benzaldehyde (1% versus paraffin oil [PO]). The one-sample t-test was used to assess the mean deviance from 0. Symbols: NS p>0.05; *p≤0.05; **p≤0.01; ***p≤0.001; ****p≤0.0001. (C) Mean Drosophila behavior toward each microorganism was graphed according to microbial group. The means were compared by one-way ANOVA with Tukey’s post-hoc comparison. (D) Drosophila behavior toward community combinations of a representative yeast, acetic acid bacterium, and lactic acid bacterium in relation to their separate-culture mixture (grown individually and mixed; Sc = S. cerevisiae; Am= A. malorum; Lp = L. plantarum cs) grown for 96 hr; Drosophila preference for the three- versus two-membered community is the last column. Mean ± SEM of 12–18 replicates (n = 2–3 experiments). The one-sample t-test assessed the mean deviance from 0. (E) Drosophila olfactory behavior toward the S. cerevisiae and A. malorum community and its constituent parts relative to media grown for 48–60 hr. Mean ± SEM of 18–30 replicates (n = 5 experiments). A one-way ANOVA followed by post-hoc Tukey’s multiple comparison correction test evaluated whether the means of the experimental groups were different from one another.
-
Figure 1—source data 1
Raw Drosophila preference data for Figure 1B,C.
- https://doi.org/10.7554/eLife.18855.004
-
Figure 1—source data 2
Raw Drosophila preference data for Figure 1D.
- https://doi.org/10.7554/eLife.18855.005
-
Figure 1—source data 3
Raw Drosophila preference data for Figure 1E.
- https://doi.org/10.7554/eLife.18855.006
Figure 1—figure supplement 1

Drosophila melanogaster olfactory behavior toward different culture volumes of Saccharomyces cerevisiae and Acetobacter malorum.
The top three experimental groups are controls: Mock (empty tube versus empty tube) recapitulates alternating of test and control arms, as in all experimental groups; apple cider vinegar (ACV [25% in water]) is the positive control and tested against water only; Benzaldehyde (1%) is the negative control and is a 100-fold dilution of benzaldehyde in paraffin oil (PO) tested against paraffin oil only. In all experimental groups, 10 µl of total volume was used; the culture amount is specified, when appropriate, on the right-hand portion of the plot. The remaining volume in the microbial groups is water. Media control (AJM) is always 5 µl of AJM mixed with 5 µl of water. Data points represent the mean +/- SEM combined from three experiments (n = 12 per experimental group). A one-sample t-test assessed the mean deviance from 0. NS p>0.05; *p≤0.05; **p≤0.01; ***p≤0.001; ****p≤0.0001. Based on this analysis, we used a total microbial culture volume of 5 µl throughout the manuscript, unless otherwise noted.
-
Figure 1—figure supplement 1—source data 1
Raw Drosophila preference data for Figure 1—figuresupplement 1.
- https://doi.org/10.7554/eLife.18855.008
Figure 2 with 1 supplement
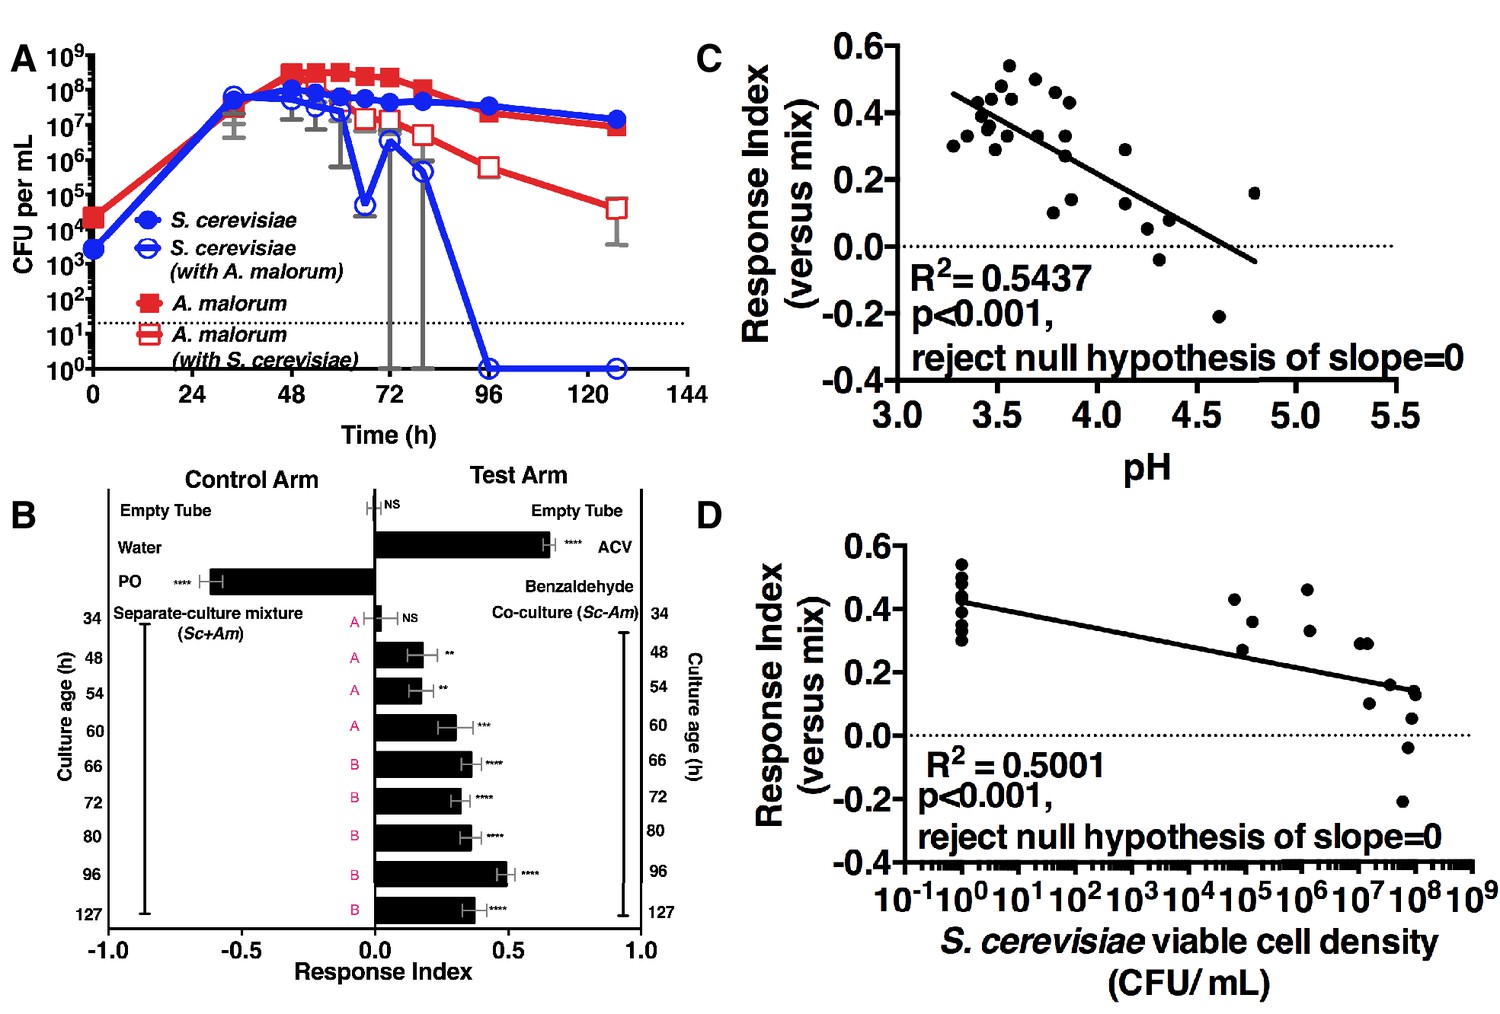
Drosophila temporal preference for metabolite exchange.
(A) S. cerevisiae and A. malorum viable populations. Mean ± SEM of 2–3 experiments with one pooled replicate (2–3 cultures from the same colony) per experiment. Limit of detection is 20 CFU/mL. A curve was fitted to the data with 40 values. Subsequently, an exponential plateau equation was compared between the individual cultures from 0 to 72 hr. The null hypothesis that the k values are the same was not rejected (p>0.05). A separate analysis compared a slope of 0 between S. cerevisiae alone and S. cerevisiae with A. malorum from 48–127 hr. The null hypothesis that the slopes were the same was rejected (p=0.0205). (B) Drosophila olfactory behavior toward co-cultured S. cerevisiae and A. malorum versus its separate-culture mixture as a function of culture age. Mean ± SEM of 16–18 replicates from three experiments. Two statistical tests were run. First, a one-sample t-test assessed whether Drosophila was attracted, neutral, or repelled by the test arm by evaluating mean deviance from 0. Symbols: NS p>0.05; *p≤0.05; **p≤0.01; ***p≤0.001; ****p≤0.0001. Second, a one-way ANOVA followed by Dunnet’s post-hoc multiple comparison test evaluated whether Drosophila was attracted to the co-culture aged 96 hr differently than other aged co-cultures. The results are shown in pink; unique letters indicate difference (p<0.05) from 96 hr. (C) Relationship between pH and Drosophila preference for the S. cerevisiae and A. malorum co-culture versus the separate-culture mixture. Each data point represents the pH of a co-culture and the mean RI of Drosophila toward the same co-culture. A linear standard curve with an unconstrained slope was generated and compared to a null model with slope = 0. The data fit to an unconstrained slope better than to the null model (p<0.0001, slope = −0.3295). (D) Relationship between S. cerevisiae populations and Drosophila preference for the co-culture versus the separate-culture mixture. Each data point represents viable S. cerevisiae populations of the culture along with the mean RI value toward the co-culture containing S. cerevisiae. A semilog standard curve with an unconstrained slope was generated and compared to a null model with slope = 0. The data fit to an unconstrained slope better than to the null model (p<0.0001, slope = −0.0349).
-
Figure 2—source data 1
Raw Drosophila preference data for Figure 2B & Figure 2—figure supplement 1C.
- https://doi.org/10.7554/eLife.18855.010
-
Figure 2—source data 2
Raw Drosophila preference data, microbial population data, and pH data for Figure 2A,C,D & Figure 2—figure supplement 1A,B.
- https://doi.org/10.7554/eLife.18855.011
Figure 2—figure supplement 1
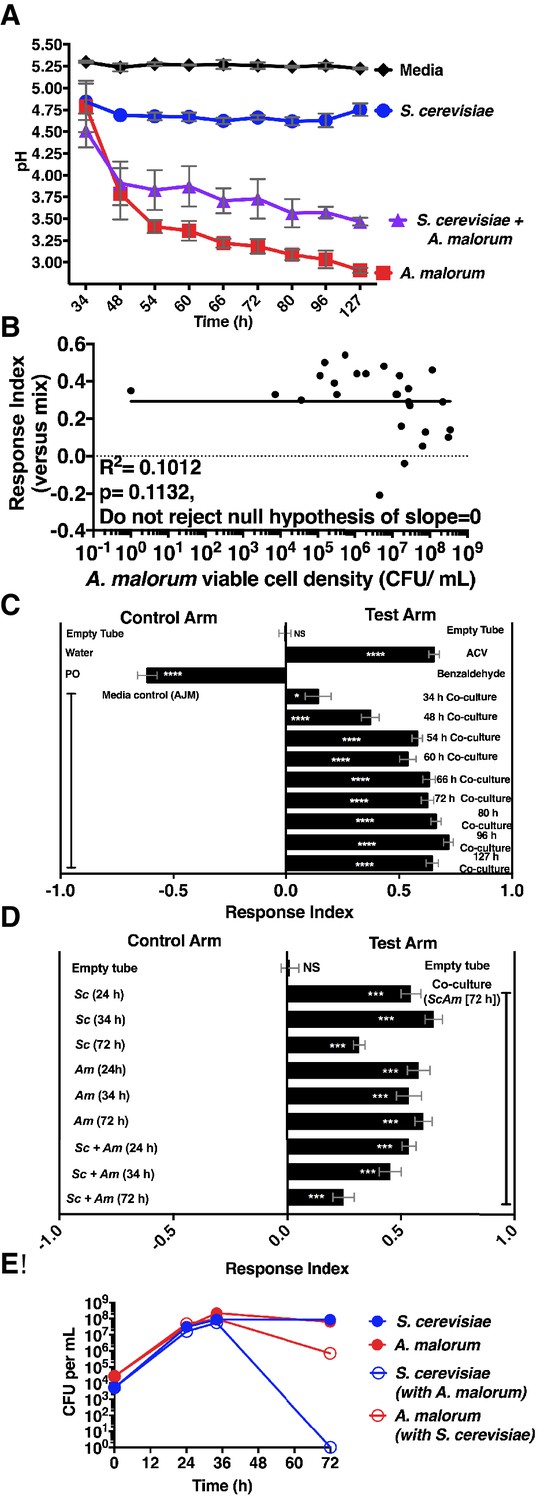
Properties of the co-culture and its relationship to Drosophila preference.
(A) pH of experimental groups as a function of microbial growth time. Mean pH ± SEM of three experiments with one pooled replicate per experiment. (B) Relationship between A. malorum populations and Drosophila preference for the co-culture versus the separate-culture mixture. Each data point represents viable A. malorum populations in the co-culture along with the mean RI behavioral value toward the co-culture containing A. malorum. A semi-log standard curve with an unconstrained slope was generated and compared to a null model with slope = 0. The data do not fit to an unconstrained slope better than to the null slope = 0 model (p=0.1132). (C) Drosophila attraction to the co-culture versus sterile media as a function of co-culture age (grown 34 hr – 127 hr). Mean RI ± SEM of three experiments with 16–18 total replicates. A one-sample t-test assessed whether the group means were different from 0. NS p>0.05; *p≤0.05; **p≤0.01; ***p≤0.001; ****p≤0.0001 Significance is denoted beside or within bars of each experimental group. ACV = apple cider vinegar (25% in water); PO = paraffin oil. (D) Behavior of Drosophila toward the co-culture grown for 72 hr versus S. cerevisiae alone, A. malorum alone, or the separate-culture mixture grown for different periods of time that correspond to different stages of growth (e.g. late log, stationary; see [E]). Mean ± SEM of 11–12 replicates in two experiments. A one-sample t-test compared the experimental group means to 0. (E) Viable populations of conditions in (D) Mean ± SEM of 2 pooled replicates where each replicate contains two replicate cultures.
-
Figure 2—figure supplement 1—source data 1
Raw Drosophila preference data and microbial population data for Figure 2—figure supplement 1D,E.
- https://doi.org/10.7554/eLife.18855.013
Figure 3 with 1 supplement

Role of olfactory receptor mutants in Drosophila detection of inter-species microbial interactions.
(A) The mean rank of the response index of the various Drosophila mutants toward the co-culture was compared with the mean rank of wild-type fly behavior toward the co-culture using the Kruskal-Wallis test followed by Dunn’s post-hoc multiple comparisons testing. Symbols: *p≤0.05; **p≤0.01; ***p≤0.001; ****p≤0.0001. A lack of symbol indicates no difference when comparing each mutant group to the wild-type group. The behavioral responses of all Drosophila (wild-type and each mutant) toward the co-culture was greater than 0 (using the non-parametric Wilcoxon signed rank test in which the medians were compared to 0, p<0.05, no symbols shown). Mean +/- SEM of 12–24 replicates per time point per fly condition (n = 2–4 experiments per time point). (B) The mean rank of mutant fly behavior toward the co-culture was compared between wild-type and the specified conditions using the Kruskal-Wallis test followed by Dunn’s post-hoc host multiple comparisons testing. Mean +/- SEM of 11–12 replicates (n = 2 experiments).
-
Figure 3—source data 1
Raw Drosophila preference data and microbial population data for Figure 3A and Figure 3—figure supplement 1.
- https://doi.org/10.7554/eLife.18855.015
-
Figure 3—source data 2
Raw Drosophila preference data for Figure 3B.
- https://doi.org/10.7554/eLife.18855.016
Figure 3—figure supplement 1
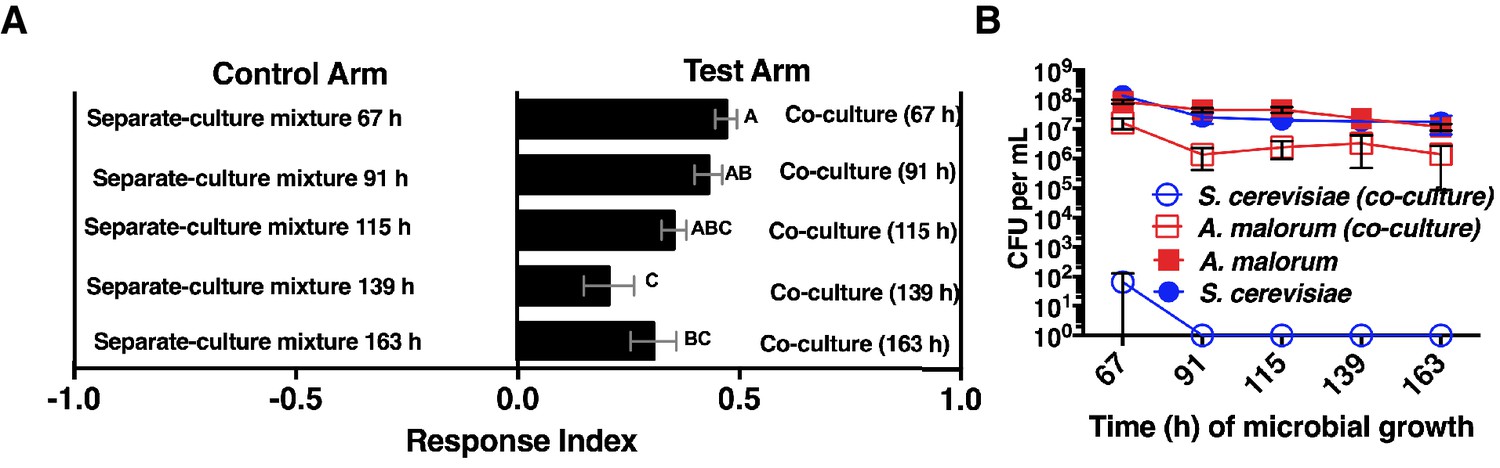
Effect of co-culture age on Drosophila attraction and microbial density.
(A) Attraction of wild-type Drosophila to different aged co-cultures (grown 67–163 hr, S. cerevisiae and A. malorum). Mean ± SEM of 12–24 replicates per group (n = 2–4 experiments). A one-way ANOVA with Tukey’s post-hoc multiple comparisons assessed the difference between all experimental groups. B) Corresponding viable counts at different times of microbial growth. Mean ± SEM of 2–3 replicates.
Figure 4 with 1 supplement
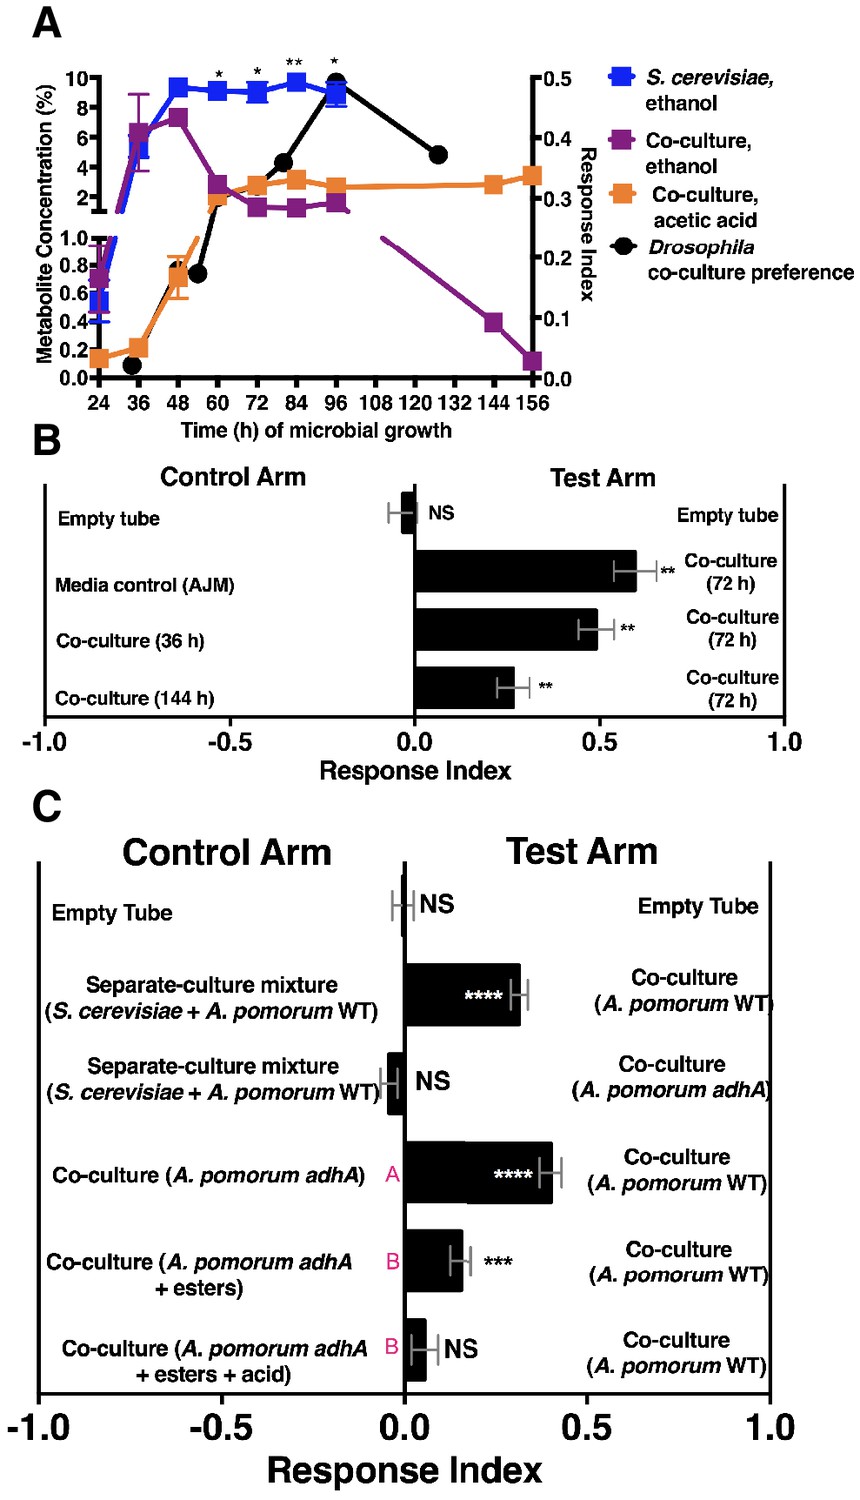
Drosophila behavior and ethanol catabolism.
(A) Dynamics of ethanol, acetic acid, and Drosophila co-culture preference. Acetic acid was only detected in the co-culture. The abundance was derived from a linear regression calculated from standards (Table 1—source data 3). Chemical data is the mean ± SEM of two values calculated from two experiments with three replicates per experiment (except acetic acid and ethanol concentrations at 144 and 156 hr, which are from one experiment with three replicates). Drosophila co-culture preference is the mean value of the preference shown in Figure 2B. The estimated ethanol concentrations in the co-culture and S. cerevisiae culture were compared with multiple t-tests and multiple comparisons correction by the Holm-Sidak method. Symbols: NS p>0.05; *p≤0.05; **p≤0.01; ***p≤0.001; ****p≤0.0001. (B) Drosophila preference for stages of ethanol catabolism. 72 hr is ‘mid’ stage; 36 hr is ‘early’ stage and 144 is ‘late’ stage. The co-culture contains S. cerevisiae and A. malorum grown for the time indicated. AJM= apple juice media. Data points represent the mean ± SEM of the combined results of two experiments with 8–10 total replicates per group. The one-sample t-test was used to assess the mean deviance from 0. (C) Drosophila olfactory behavior toward specified conditions. Mean ± SEM of 2–7 experiments with 10–42 total replicates. Two statistical tests were used to evaluate the behavior. First, a one-sample t-test assessed the mean deviance from 0. Symbols: NS p>0.05; *p≤0.05; **p≤0.01; ***p≤0.001; ****p≤0.0001. Second, a one-way ANOVA with Tukey’s post-hoc comparison assessed whether the means of the bottom three experimental groups were different from one another (differences are denoted by unique pink letters). Esters include ethyl acetate, isoamyl acetate, 2-phenethyl acetate, isobutyl acetate, 2-methylbutyl acetate, and methyl acetate; acid is acetic acid. Amounts added are based on physiological amounts in co-cultures and are found in Table 2. The co-culture contains S. cerevisiae and the specified A. pomorum strain. acid= acetic acid.
-
Figure 4—source data 1
Raw spectral abundance data associated with metabolites graphed in Figure 4A.
- https://doi.org/10.7554/eLife.18855.024
-
Figure 4—source data 2
Raw Drosophila preference data for Figure 4B.
- https://doi.org/10.7554/eLife.18855.025
-
Figure 4—source data 3
Raw Drosophila preference data for Figure 4C.
- https://doi.org/10.7554/eLife.18855.026
Figure 4—figure supplement 1
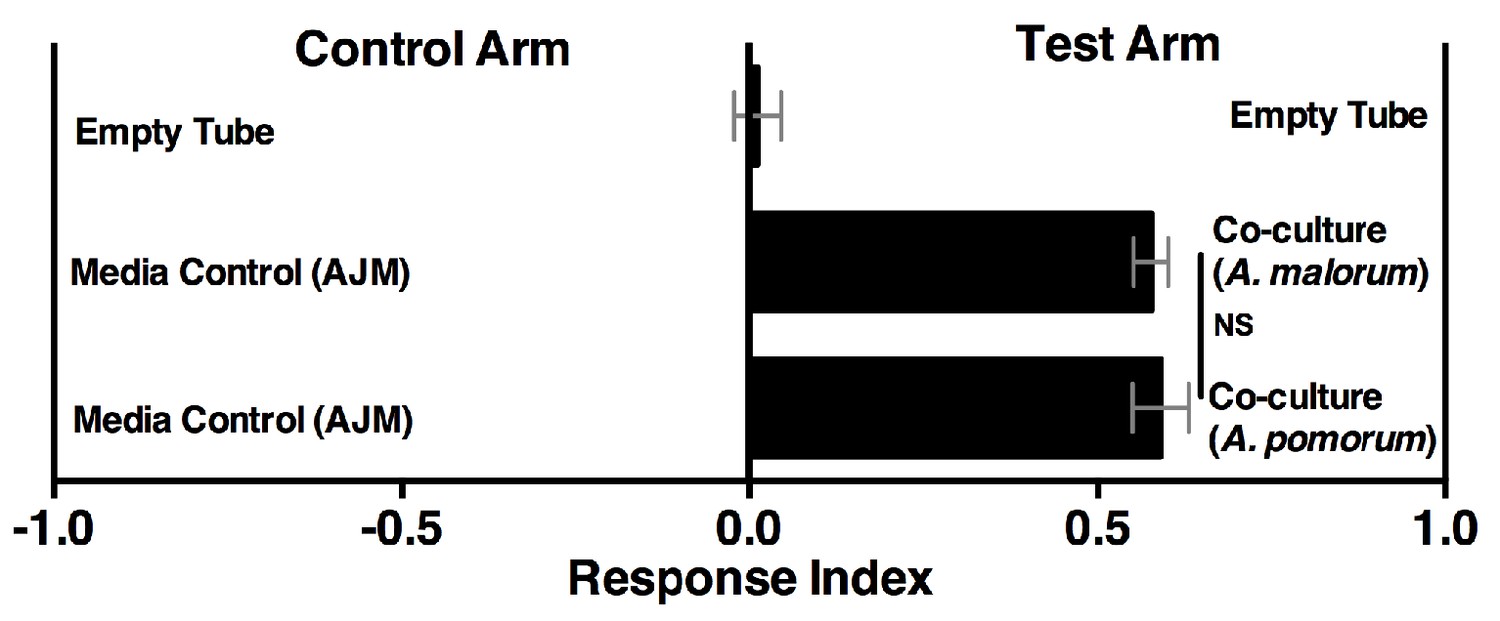
Drosophila behavior toward the co-culture using A. malorum or A. pomorum.
Drosophila behavior toward co-cultures grown for 96 hr using A. malorum or A. pomorum versus a media control (AJM = apple juice medium). Result of two experiments with six replicates each. Data points represent mean ± SEM. An unpaired two-tailed t-test assessed the difference between the co-cultures grown with A. malorum or A. pomorum.
-
Figure 4—figure supplement 1—source data 1
Raw Drosophila preference data for Figure 2—figure supplement 1.
- https://doi.org/10.7554/eLife.18855.028
Figure 5 with 1 supplement
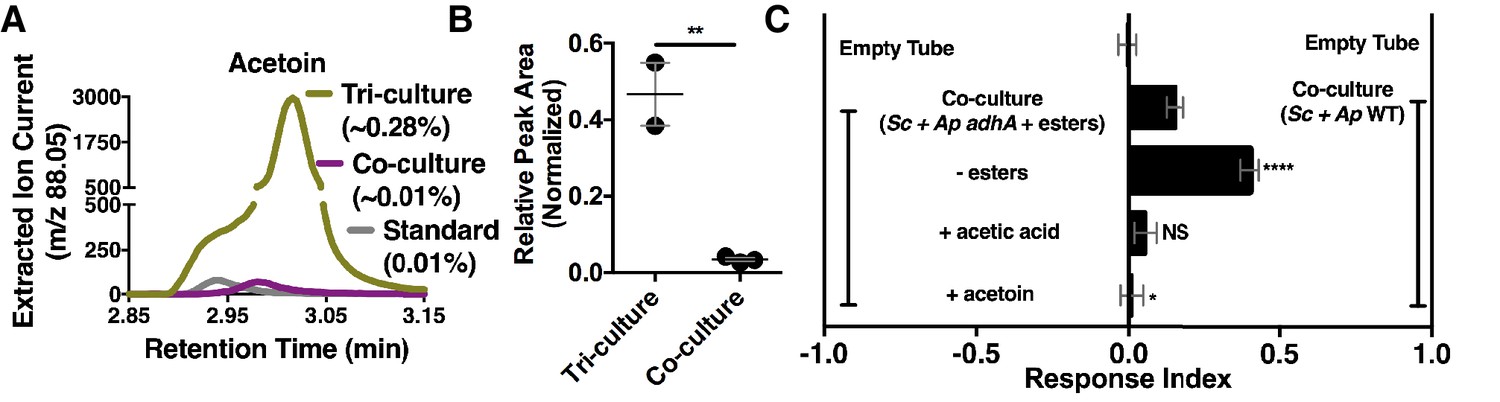
Acetaldehyde metabolic derivatives as attractive microbial community generated metabolites.
(A) Representative chromatogram of m/z 88.05 in the tri-culture (S. cerevisiae-A. malorum-L. plantarum) compared to the co-culture (S. cerevisiae and A. malorum). (B) Estimated quantification is based on a linear regression of acetoin (Figure 6—figure supplement 1). Relative quantification of acetoin in the tri-culture (one replicate with A. malorum and one replicate with A. pomorum from separate days) and the co-culture (one replicate with A. malorum and two replicates with A. pomorum from separate days). Difference in peak areas was assessed by an unpaired two-tailed t-test (**p≤0.01). (C) Mean ± SEM of three experiments with 16–18 total replicates. A one-way ANOVA with Tukey’s post-hoc multiple comparisons correction assessed the differences between Drosophila behavior toward the co-culture with A. pomorum adhA and esters to various groups in which individual molecular groups were removed or added (p>0.05; *p≤0.05; **p≤0.01; ***p≤0.001; ****p≤0.0001). Esters include ethyl acetate, isoamyl acetate, 2-phenethyl acetate, isobutyl acetate, 2-methylbutyl acetate, and methyl acetate. Esters added are based on physiological amounts in co-cultures and are calculated in Table 2 and Table 2—source data 2). Acetoin is added in a similar amount as the tri-culture. Sc = S. cerevisiae, Ap = A. pomorum.
-
Figure 5—source data 1
Extracted ion current for m/z 88.05 in Figure 5A.
- https://doi.org/10.7554/eLife.18855.037
-
Figure 5—source data 2
Peak areas associated with acetoin for Figure 5B.
- https://doi.org/10.7554/eLife.18855.038
-
Figure 5—source data 3
Raw Drosophila preference data for Figure 5C.
- https://doi.org/10.7554/eLife.18855.039
Figure 5—figure supplement 1
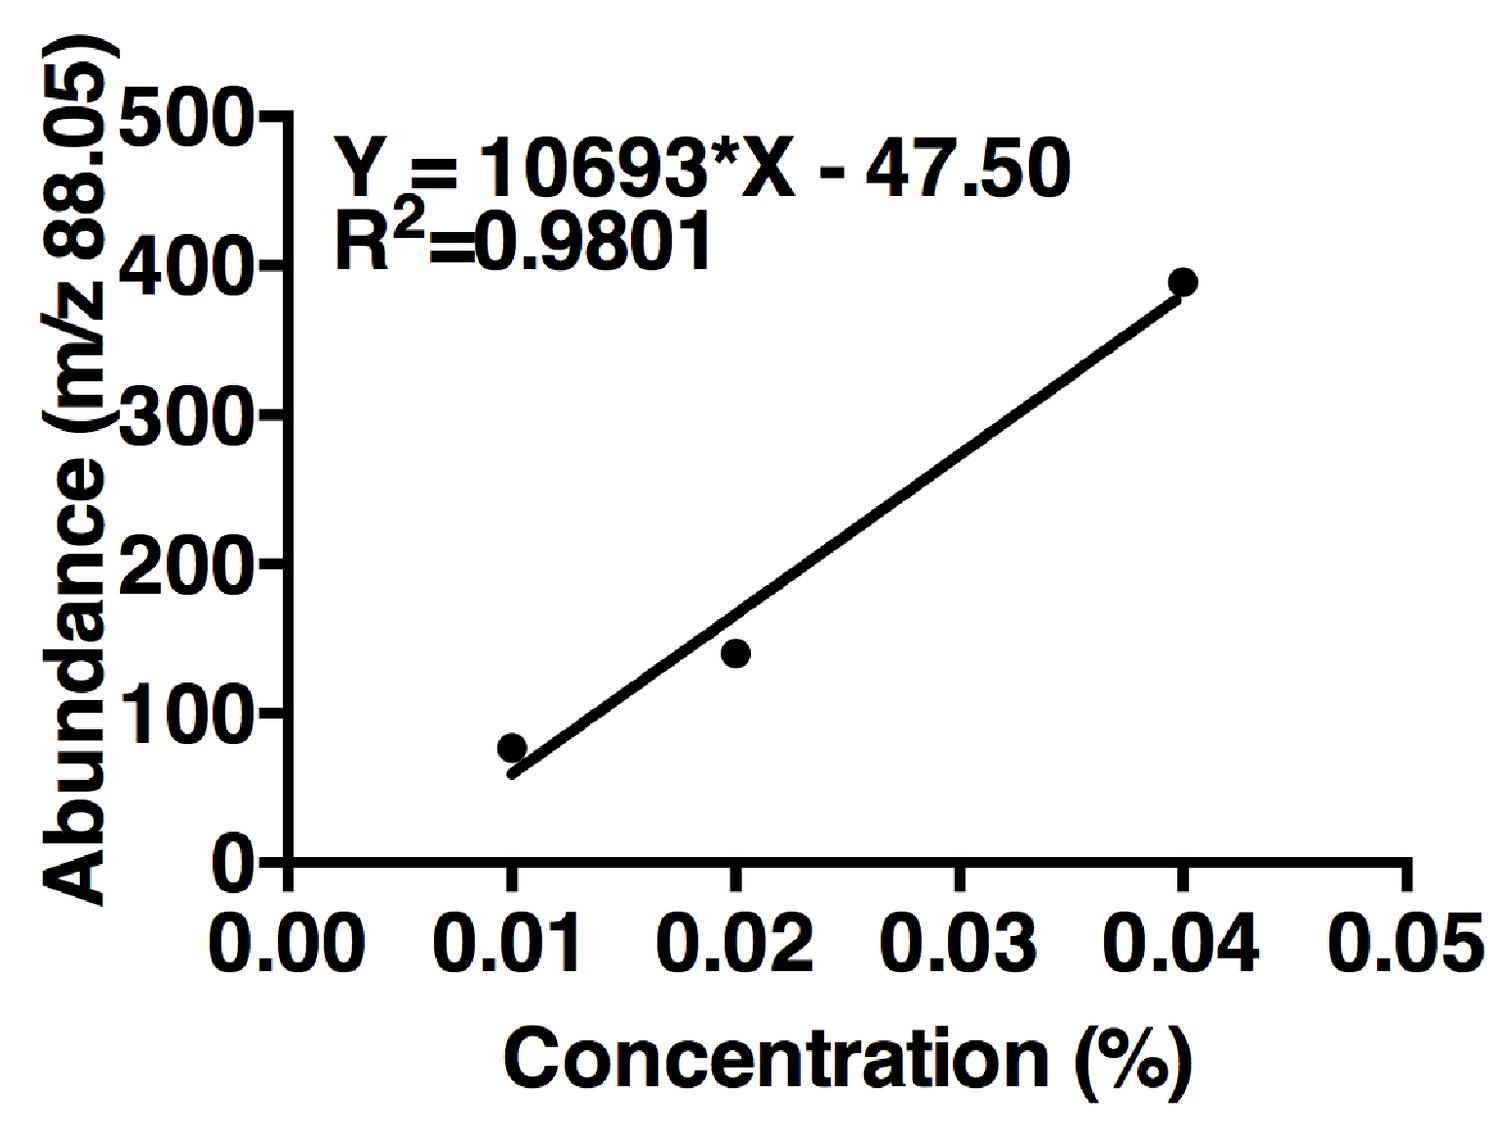
Acetoin linear regression.
The curve is based on maximum m/z values (88.05) of three concentrations of acetoin. One replicate per concentration (n = 1 experiment). The linear regression was used to estimate acetoin concentrations in the tri-culture and the co-culture (Figure 5B).
-
Figure 5—figure supplement 1—source data 1
Extracted ion current for Figure 5—figure supplement 1.
- https://doi.org/10.7554/eLife.18855.041
Figure 6 with 2 supplements
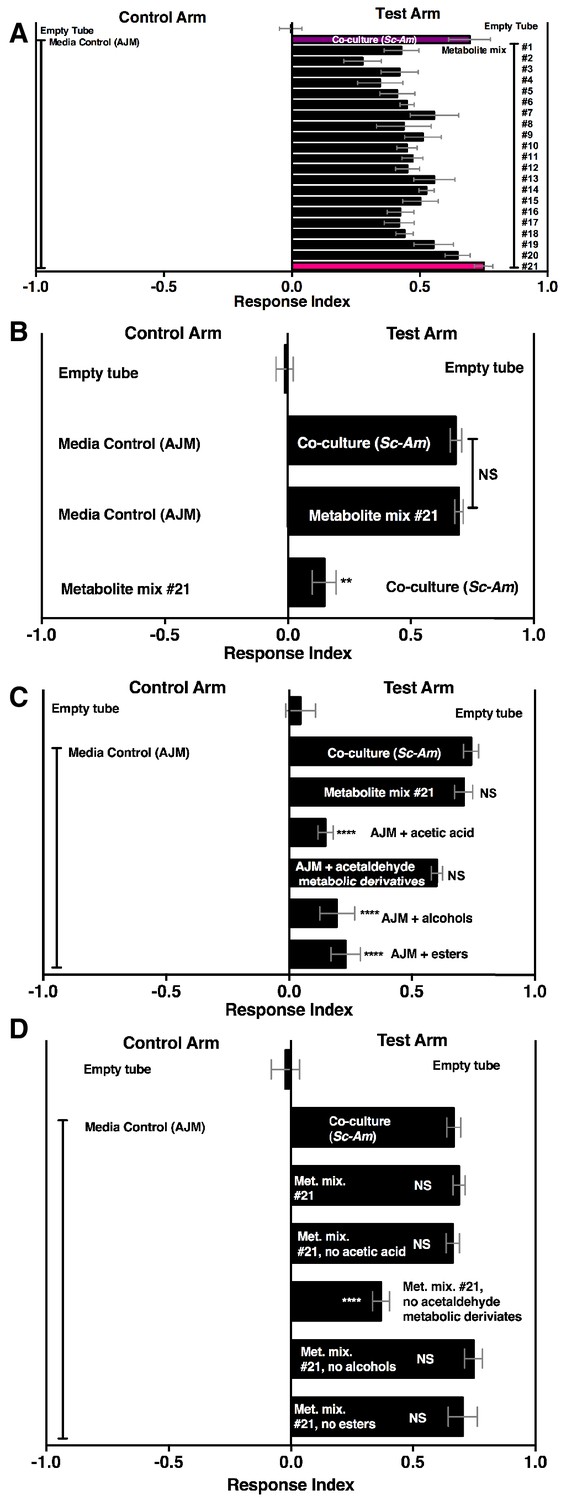
Drosophila behavior toward 21 metabolite mixtures .
(A) Supplementary file 5 contains the concentrations of all mixtures (in 50% AJM). The co-culture was grown for 96 hr. Mean ± SEM of 4–6 replicates per experimental group. Groups were tested over five days. (B) Drosophila attraction to a co-culture grown for 96 hr and metabolite mixture #21. Mean ± SEM of three experiments with 17–18 replicates per group. A Mann-Whitney test compared the median values of the co-culture and metabolite mixture #21; the Wilcoxon Signed-Rank test compared the median value of fly behavior toward the co-culture relative to metabolite mixture #21 to 0. (C) Sufficiency of metabolite groups to attract Drosophila. The individual groups are: acetaldaldehyde metabolic derivatives (1,1-diethoxyethane; acetoin; 2,3-butanedione); alcohols (ethanol; isobutanol; isoamyl alcohol; 2-methyl, 1-butanol; benzeneethanol); esters (isoamyl acetate; ethyl acetate; isobutyl acetate; 2-phenethyl acetate; butyl acetate; 2-methylbutyl acetate; methyl acetate; phenethyl benzoate; propyl acetate; ethyl isobutyrate; ethyl hexanoate; isovaleric acid; butyl ester; ethyl octanoate; ethyl decanoate; ethyl laurate); and acetic acid (acetic acid). Mean ± SEM of 6 replicates of 1 experiment (except the acetaldehyde metabolic derivative group which is 12 replicates from two experiments). A one-way ANOVA followed by Dunnet’s post-hoc comparison assessed the difference between the co-culture and all experimental groups. NS p>0.05; *p≤0.05; **p≤0.01; ***p≤0.001; ****p≤0.0001 (D) The same groups used in C were used and removed from metabolite mix #21. The difference between the co-culture (Sc-Am) and each group was assessed in the same manner as in C. Mean +/- SEM of 6 replicates from one experiment.
-
Figure 6—source data 1
Concentrations of mixtures and raw Drosophila preference data for Figure 6.
- https://doi.org/10.7554/eLife.18855.043
Figure 6—figure supplement 1
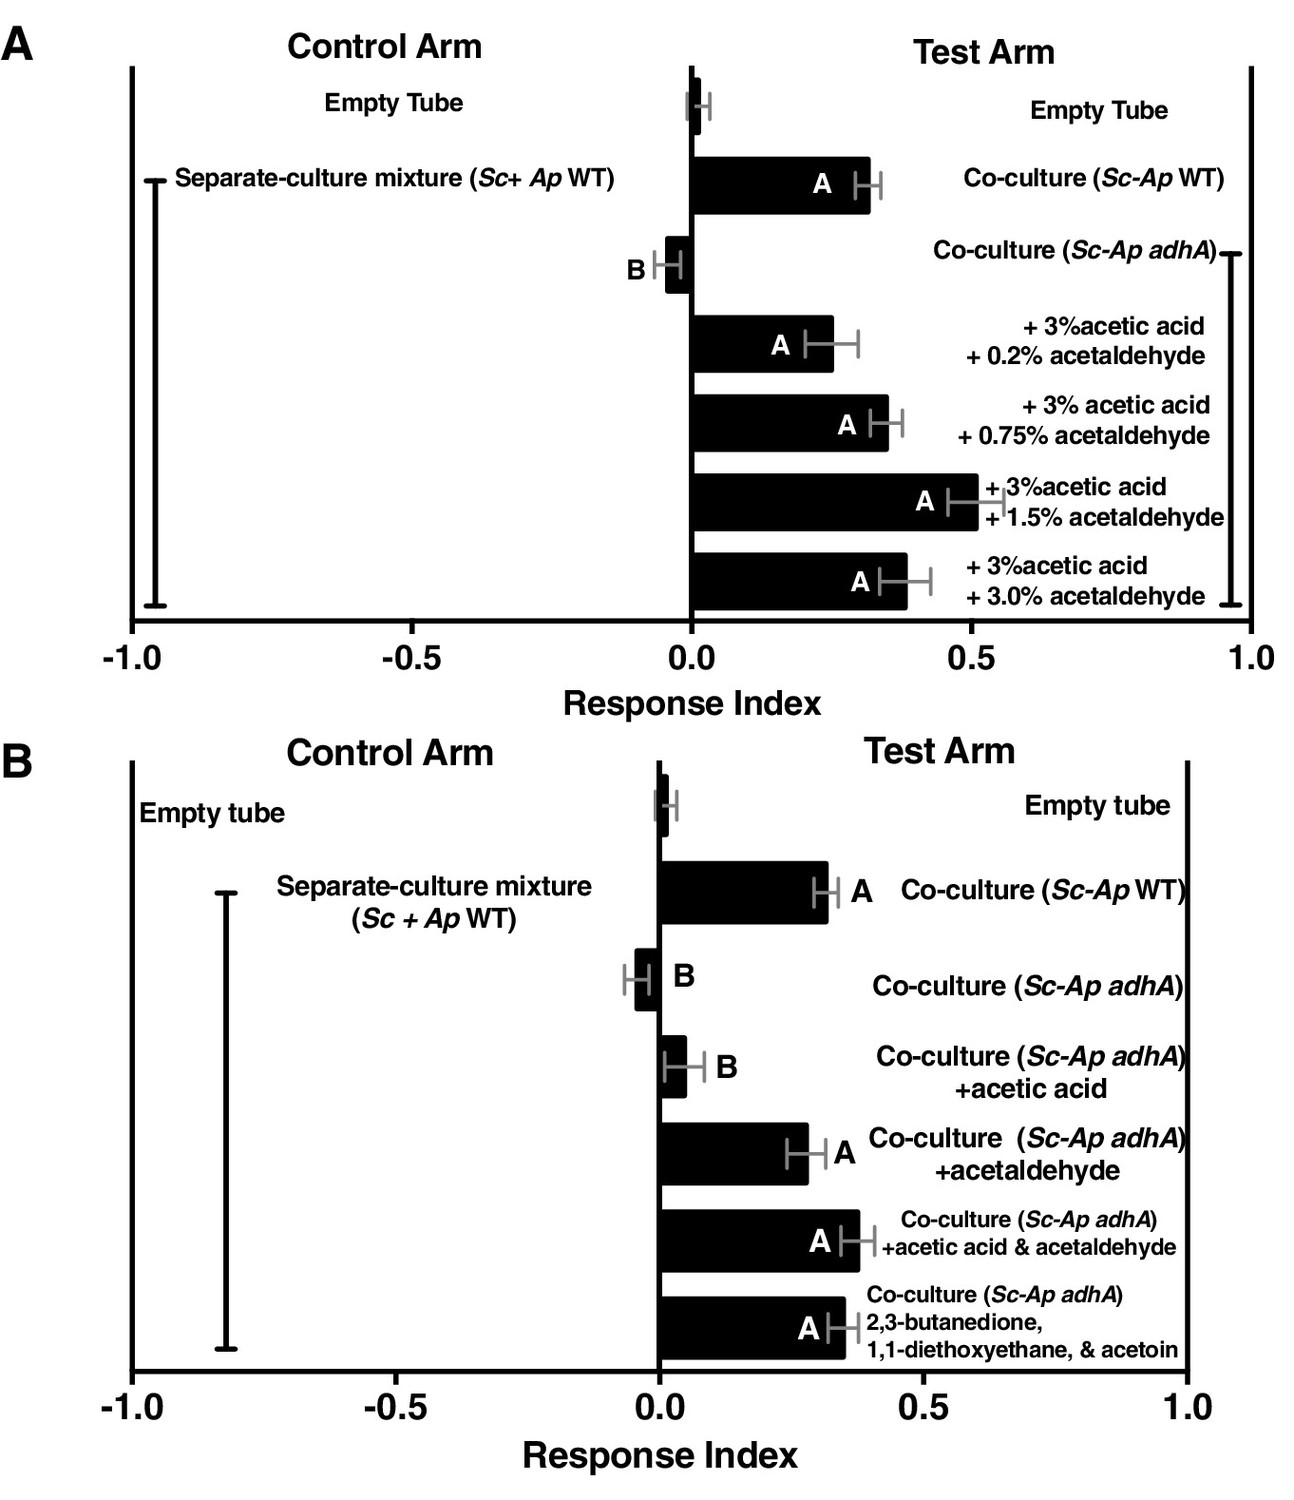
Acetaldehyde metabolic derivatives can complement the co-culture containing A. pomorum adhA, although their physiological concentrations are unknown.
(A) Dose response of acetaldehyde was given to the co-culture containing A. pomorum adhA (along with a constant dose of 3.0% acetic acid). Metabolite additions were added to the culture in the noted percentages, allowed to sit 35 min at room temperature, mixed 1:1 in water, and assessed for Drosophila attractiveness. Mean ± SEM of 1–7 experiments with 12–42 total replicates per group. The mean rank of fly behavior toward all experimental conditions was compared using the Kruskal-Wallis test followed by Dunn’s post-hoc host multiple comparisons testing. Unique letters indicate difference (p<0.05) (B) Role of acetic acid, acetaldehyde, or specified acetaldehyde metabolic derivatives in complementing the co-culture containing A. pomorum adhA. Acetic acid (3.0%) and acetaldehyde (0.75%) were added and allowed to sit at room temperature for 35 min, mixed 1:1 in water, and Drosophila attraction was assayed. 2,3-butanedione (0.15%), 1,1-diethoxyethane (0.01%), and acetoin (0.15%) were added to the culture, mixed 1:1 with water, and Drosophila behavior was assayed. Mean ± SEM of 2–7 experiments with 5–6 replicates per experiment. The mean rank of fly behavior toward all experimental conditions was compared using the Kruskal-Wallis test followed by Dunn’s post-hoc host multiple comparisons testing. Unique letters indicate difference (p<0.05). Sc = S. cerevisiae, Ap = A. pomorum.
-
Figure 6—figure supplement 1—source data 1
Raw Drosophila preference data for Figure 6—figure supplement 1.
- https://doi.org/10.7554/eLife.18855.045
Figure 6—figure supplement 2
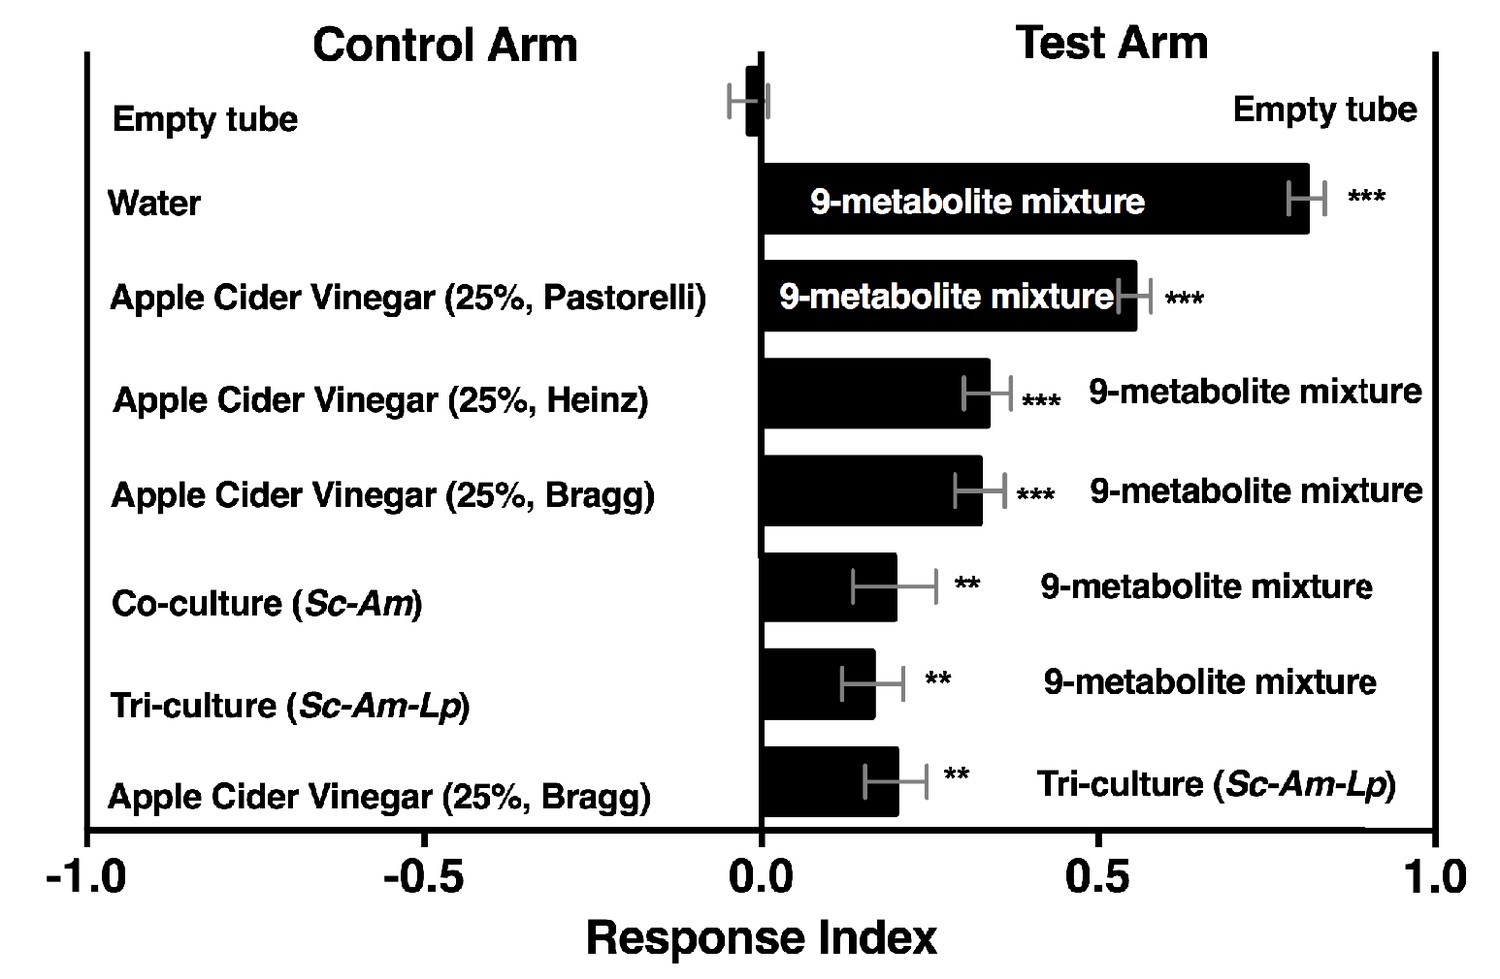
Drosophila behavior toward water amended with nine metabolites (9-metabolite mixture) versus three different apple cider vinegars (ACV), a co-culture (Sc-Am = S. cerevisiae and A. malorum), or tri-culture (Sc-Am-Lp = S. cerevisiae, A. malorum, L. plantarum cs).
Cultures were grown for 72 hr and mixed 1:1 with water, as in all other experiments. Data points represent the Mean ± SEM of two experiments with twelve total replicates. A one-sample t-test assessed whether the mean values of the experimental groups were different from 0. NS > 0.05; *p≤0.05; **p≤0.01; ***p≤0.001; ****p≤0.0001. The acetoin concentration was similar to that calculated from the tri-culture (Figure 5A, 0.3%). The concentrations of all nine metabolites can be found in the materials and methods.
-
Figure 6—figure supplement 2—source data 1
Raw Drosophila preference data for Figure 6—figure supplement 2.
- https://doi.org/10.7554/eLife.18855.047
Figure 7 with 1 supplement

Drosophila egg-laying preference, nutrition, and pathogen protection.
(A) Drosophila was given a choice to lay eggs in a co-culture containing S. cerevisiae and A. pomorum wild-type (WT) or S. cerevisiae and A. pomorum adhA. The co-cultures were grown for 96 hr and mixed 1:1 with a 1.6% agarose solution. Drosophila was allowed to lay eggs for eight hours. The Wilcoxon signed-rank test evaluated whether the median value of each experimental group was different from 0. Mean ± SEM of 16–18 replicates from two experiments. (B) Drosophila (40 females and 15 males) deposited eggs in fly vials for 4 hr containing the co-culture of S. cerevisiae and A. pomorum WT (WT) or the co-culture of S. cerevisiae and A. pomorum adhA (adhA). Subsequently the number of pupae in each condition was monitored over time. Mean ± SEM of 5 replicates of 1 experiment. Between 12–16 d, larvae pupated in 3/5 WT replicates. Multiple unpaired t-tests were used to compare means at each time point. *p<0.05. (C) Drosophila (40 females and 15 males) deposited eggs for 4 hr after which the total number of eggs were counted in the two experimental groups. Mean +/- SEM of 12 replicates of 1 of 2 representative experiments. A Mann-Whitney test compared the medians of each group. NS p>0.05; *p≤0.05; **p≤0.01; ***p≤0.001; ****p≤0.0001. (D) three days after egg-laying the plates containing eggs quantified in (C) were exposed to the open environment and the consequence of exposure was the growth of unidentified fungi, as pictured. Control plates that were not exposed to the environment did not harbor any fungi. In experiment 1, 12/12 of the adhA plates harbored fungi and 0/12 plates of WT plates harbored fungi. In the second experiment 4/6 adhA plates harbored fungi and 0/6 of WT plates harbored fungi. (E, F) Following environmental exposure, the eggs were followed through pupation (E) and adulthood (F). Mean +/- SEM of 12 replicates of 1 of 2 representative experiments. The median values in E and F were compared the same way as in C.
-
Figure 7—source data 1
Raw Drosophila egg-laying preference data for Figure 7A.
- https://doi.org/10.7554/eLife.18855.049
-
Figure 7—source data 2
Raw developmental data for Figure 7B,C,E,F.
- https://doi.org/10.7554/eLife.18855.050
Figure 7—figure supplement 1
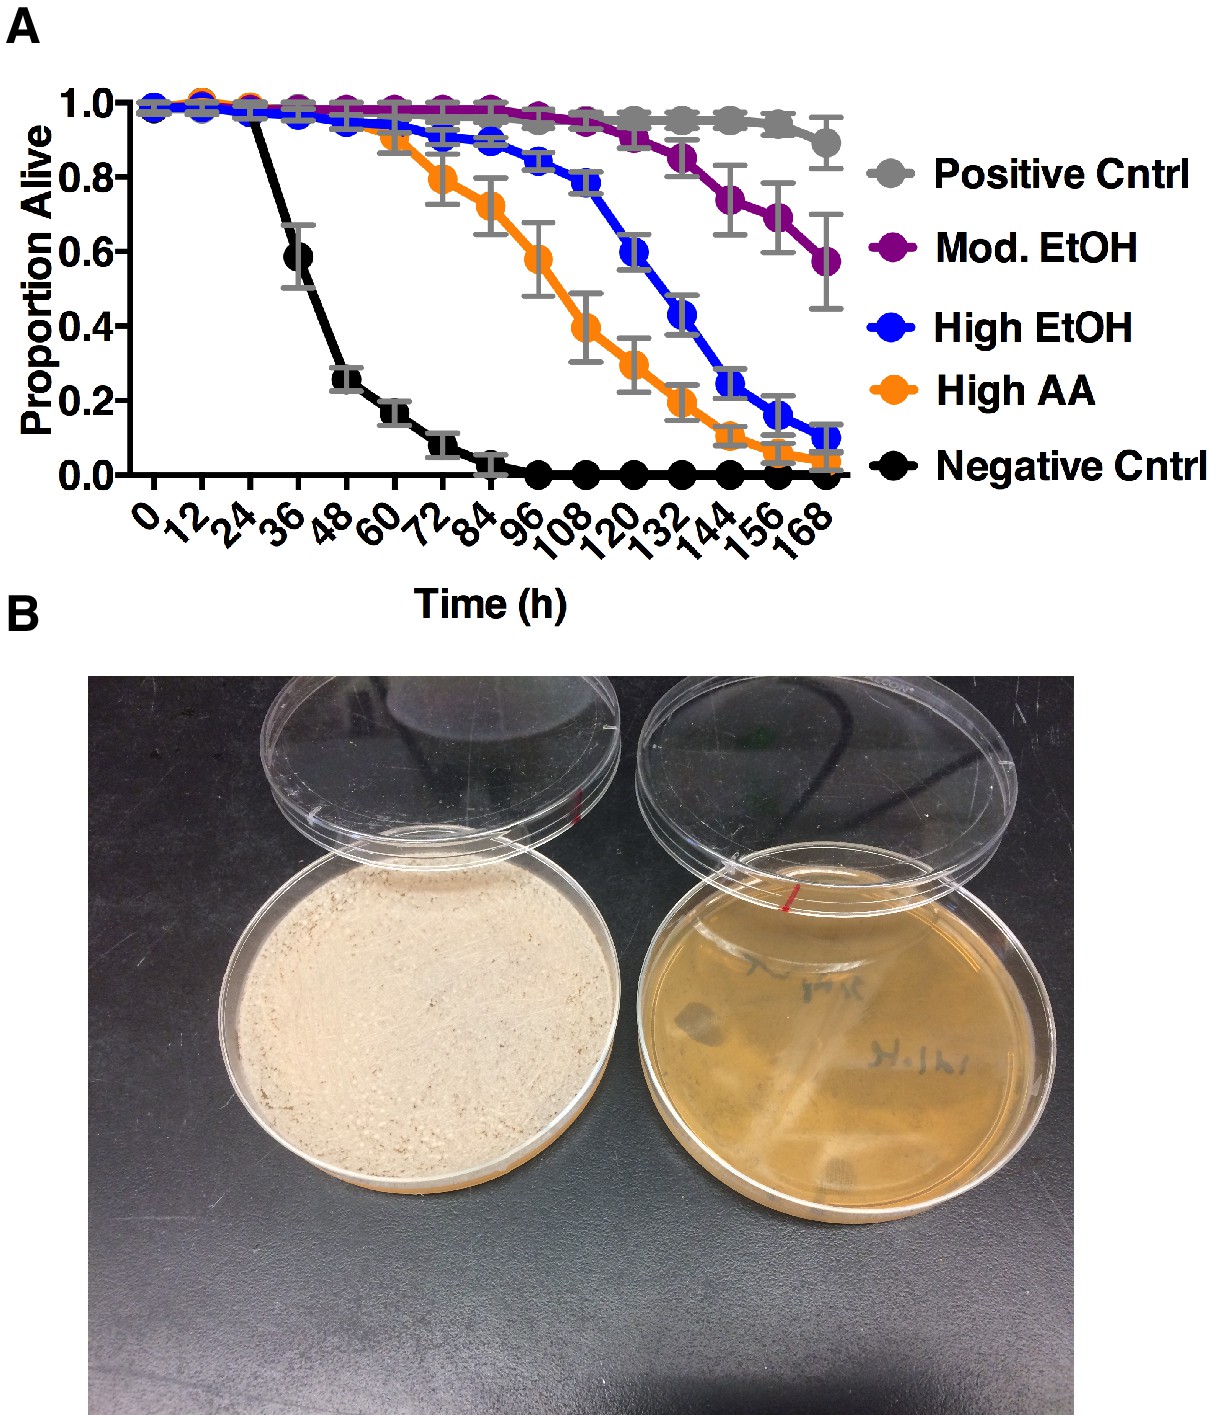
Impact of co-culture metabolites on adult survival and yeast populations.
(A) Drosophila survival in the presence of acetic acid (AA), ethanol (EtOH) or the combination of the two in water. Groupings were based on concentrations of metabolites estimated from pre-ethanol catabolism (9.4% ethanol, High EtOH), middle-staged ethanol catabolism (1.4% ethanol, 2.8% acetic acid, Mod. EtOH, Mod. AA) and post ethanol catabolism (3.42% acetic acid, High AA). Data represent mean +/- SEM of 5–6 replicates of 1 representative experiment of 2. Mod. EtOH, Mod. AA was different from High EtOH condition from 108 hr onward and High AA condition from 72 hr onward (assessed by two-way ANOVA comparing time and condition, p≤0.05, Tukey’s correction). Negative Cntrl is water and Positive Cntrl is Shield’s and Sang M3 Insect Medium. (B) Photograph of yeast populations of a co-culture containing S. cerevisiae and A. malorum adhA (left) and S. cerevisiae and A. malorum WT (right) after growing for 72 hr. 50 ul of the culture was spread onto MRS plates containing a cocktail of antibiotics. Source Data Titles.
-
Figure 7—figure supplement 1—source data 1
Raw survival proportions for Figure 7-figuresupplement1A.
- https://doi.org/10.7554/eLife.18855.052
Figure 8
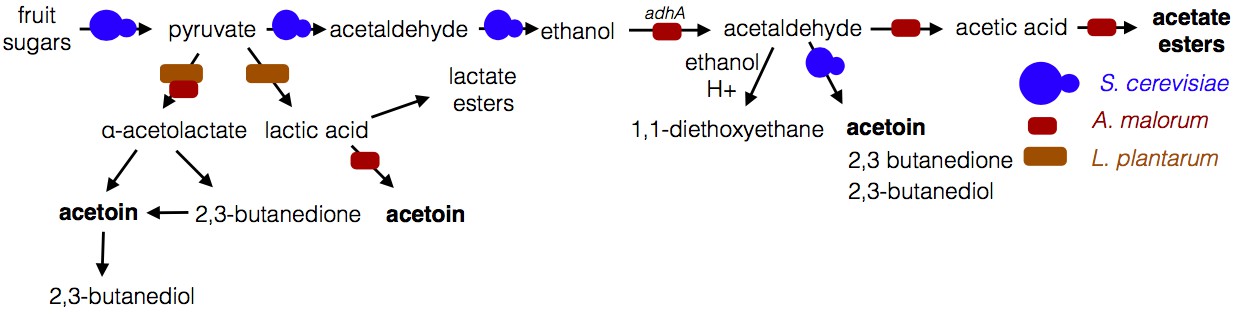
Model of microbe-microbe metabolite exchange.
Bolded are metabolites increased due to microbe-microbe interactions.
Tables
Table 1
Summary of volatiles detected using GC-MS. Relative abundance of volatiles in the co-culture (S. cerevisiae and A. malorum grown together) compared to the separate-culture mixture (S. cerevisiae and A. malorum grown separately, and their quantities added in during analysis). GC-MS captured volatiles with XAD-4 beads suspended above the cultures during growth; subsequently, beads were methanol-extracted (n = 6 experiments, Table 1—source data 1–2). Quantification is based on two experiments in which a linear regression was computed with standards (Table 1—source data 3–4). Quantification is based on beads suspended above the cultures between 84 and 96 hr of culture growth.
Identity | Standard confirmation | Relative quantification (co-culture: separate-culture mixture) |
|---|---|---|
Ethanol | Y | 5.0–12.6-fold reduced |
Isobutanol | Y | 7.3–24.7-fold reduced |
Isoamyl acetate | Y | unique to co-culture |
Isoamyl alcohol | Y | 3.6–6.4-fold reduced |
Acetic acid | Y | unique to co-culture |
-
Table 1—source data 1
Extracted ion chromatograms of five metabolites detected by gas chromatography-mass spectrometry (GC-MS) in Table 1.
Extracted ion chromatograms of the five metabolites detected by gas chromatography- mass spectrometry (GC-MS). (A) Schematic depicting the experimental setup (B-F) Representative extracted ion chromatograms from one replicate (out of three total) of one experiment (out of 3–4 total) of m/z values corresponding to major metabolites identified in the experimental conditions along with appropriate standards. Acetic acid (B), isoamyl alcohol (C), isoamyl acetate (D) isobutanol (E), and ethanol (F) were identified as the five major metabolites in the co-culture (S. cerevisiae and A. malorum). Isoamyl alcohol (C), ethanol (E), and isobutanol (F) were identified as the major metabolites in S. cerevisiae grown alone. Extracted ion chromatograms were constructed using the m/z value in the title of each graph. For acetic acid and isobutanol, the m/z value used corresponds to the molecular weight of the molecule. For ethanol, the m/z used corresponds to the molecular weight minus one (hydrogen). For isoamyl alcohol, the m/z used corresponds to the loss of the hydroxyl group (depicted), which may have picked up hydrogen and been lost as water. For isoamyl acetate, the m/z value corresponds to the molecule shown within the graph. In all cases, figures showing the complete mass spectra between the metabolite and standard are found in Table 1—source data 2. Microorganisms were grown 72–96 hr.
- https://doi.org/10.7554/eLife.18855.019
-
Table 1—source data 2
Representative spectra of metabolites in Table 1.
Representative spectra of acetic acid (A-B), isoamyl alcohol (C-E), isoamyl acetate (F-G), ethanol (H-J) and isobutanol (K-L) in standard and experimental samples. Standard concentrations are denoted on individual graphs. All mass spectra are one replicate (out of 3–4 experiments with three replicates per experiment).
- https://doi.org/10.7554/eLife.18855.020
-
Table 1—source data 3
Linear regression of metabolites using GC-MS in Table 1.
Estimation of volatile quantity using GC-MS. Separate experiments are graphed in panels (A-E) and (F-J). (A-E) Data points represent the value of a single replicate per concentration for each standard. The abundance of a single m/z value at a specific retention time was chosen for each standard. The values were fitted with a linear regression and the equation was used to estimate the concentration of the five metabolites in the experimental samples from the same experiment. (F-J) Data points represent the mean ± SEM of three replicates for a given concentration for each standard. The abundance of a single m/z value at a specific retention time was chosen for each standard. The values were fitted with a linear regression. The equation was used to estimate the concentration of the five metabolites in the experimental samples from the same experiment. When applicable an equation was calculated when the line was forced to go through X,Y = 0,0; these equations were used to calculate the concentrations of isoamyl alcohol, isoamyl acetate, and isobutanol.
- https://doi.org/10.7554/eLife.18855.021
-
Table 1—source data 4
Raw spectral abundance data as a function of concentration used for linear regressions in Table 1—source data 3.
- https://doi.org/10.7554/eLife.18855.022
Table 2
Estimated concentrations of key metabolites in the co-culture using SPME GC-MS. Estimated concentrations of differentially concentrated or unique metabolites in the co-culture. Linear regression equations (Lin. reg. eqs. 1 and 2) were estimated from individual experiments in which peak areas of different concentrations of metabolites were fitted with a linear regression (Table 2—source data 2, 3, 5 and 6). Normalized peak areas correspond to the specified metabolites in co-cultures containing S. cerevisiae and A. malorum. Separate estimates were derived from a normalized peak area estimated from a single experiment (co-culture and standard samples were from a run with similar internal standard signal) or from the mean normalized peak area estimated from all experiments (co-cultures were run over four days, standards were run on two days). The final estimated concentration was an average of all estimated concentrations (n = 4 estimates (two from each standard regression equation times two estimates of the normalized peak area), except for methyl acetate, n = 2 estimates). The estimated concentrations (except acetoin) were added to the co-culture containing A. pomorum adhA (Figure 4C). *Ethyl acetate, acetic acid, and acetoin concentrations were estimated from standards (Table 2—source data 1 and 4).
Metabolite | Lin. Reg. eq. 1 | Lin. Reg. eq. 2 | Normalized peak area (single experiment) | Normalized peak area (Average, All experiments) | Estimated concentration (%) |
|---|---|---|---|---|---|
Isobutyl acetate | Y = 4151X − 0.1319 | Y = 3252X − 0.07251 | 0.29 | 1.16 | 0.00023 |
Isoamyl acetate | y = 8158X | Y = 7800X | 0.78 | 3.8 | 0.00026 |
2-Phenethyl acetate | Y = 5129X −0.04011 | Y = 6972X −0.2013 | 1.2 | 1.9 | 0.00028 |
2-Methylbutyl acetate acetate | Y = 8995X − 0.05042 | Y = 8087X−0.1307 | 0.56 | 3.1 | 0.00023 |
Methyl acetate | Y = 75.22X+0.004457 | NA | 0.018 | 0.040 | 0.00033 |
Ethyl acetate | NA | NA | NA | NA | ~0.02* |
Acetic acid | NA | NA | NA | NA | ~3.0* |
Acetoin | NA | NA | NA | NA | ~0.01* |
-
Table 2—source data 1
Extracted ion chromatograms of differentially emitted or unique metabolites in the co-culture in Table 2.
Extracted ion chromatograms of differentially emitted or unique metabolites in the co-culture according to solid phase microextraction gas chromatography-mass spectrometry (SPME GC-MS). Specific metabolites are displayed above each panel. For each panel, the left-most plot compares the co-culture containing S. cerevisiae and A. malorum to S. cerevisiae grown alone, A. malorum grown alone, or media (AJM [apple juice medium]); the right-most plot compares the co-culture containing S. cerevisiae and A. pomorum wild-type to the co-culture containing S. cerevisiae and A. pomorum adhA, since A. pomorum adhA is required for Drosophila co-culture preference (Figure 5A). The two plots within the same panel contain the same standard. The y-axis for each plot is the ion current for a m/z value that discriminates the metabolite of interest over a specific retention time window. The following m/z values were chosen for each metabolite based on standards or, in the cases of putative and unknown metabolites (I and J) were chosen from the experimental groups: (A) m/z 74.04 (B) m/z 88.08 (C) m/z 73.03 (D) 87.05 (E) 74.02 (F) 104.04 (G) 60.05 (H) 88.05 (I) 101.06 (J) 101.06. Each panel is one representative replicate of 1 experiment (out of 3–5 total replicates in three experiments).
- https://doi.org/10.7554/eLife.18855.030
-
Table 2—source data 2
Linear regression of metabolites in defined metabolite mixtures in Table 2.
Normalized peak areas corresponding to metabolites in a defined metabolite mixture (from SPME GC-MS). A linear regression was calculated to quantify the metabolites in the co-culture. Each concentration is from one replicate. A-E and F-I are two separate experiments. Linear regression was used to estimate the concentration of the metabolites in the co-culture containing S. cerevisiae and A. malorum (Table 2) and to complement the co-culture containing A. pomorum adhA (Figure 4C).
- https://doi.org/10.7554/eLife.18855.031
-
Table 2—source data 3
Peak area as a function of concentration used to estimate metabolite concentrations in co-cultures in Table 2.
- https://doi.org/10.7554/eLife.18855.032
-
Table 2—source data 4
Extracted ion chromatograms of various m/z values used in.
- https://doi.org/10.7554/eLife.18855.033
-
Table 2—source data 5
Peak areas as a function of metabolite concentration used in linear regression in Table 2—source data 2A–E.
- https://doi.org/10.7554/eLife.18855.034
-
Table 2—source data 6
Peak areas as a function of metabolite concentration used in Table 2—source data 2F–I.
- https://doi.org/10.7554/eLife.18855.035
Additional files
-
Supplementary file 1
Drosophila melanogaster stocks used in experiments.
- https://doi.org/10.7554/eLife.18855.054
-
Supplementary file 2
Microorganisms used in experiments and their sources
- https://doi.org/10.7554/eLife.18855.055
-
Supplementary file 3
Chemicals or solutions used in T-maze and GC-MS experiments.
- https://doi.org/10.7554/eLife.18855.056
-
Supplementary file 4
Metabolite mixture concentrations used for identification and quantification in SPME GC-MS.
- https://doi.org/10.7554/eLife.18855.057
-
Supplementary file 5
Composition of metabolite mixtures 1-21 used in Figure 6.
- https://doi.org/10.7554/eLife.18855.058
Download links
A two-part list of links to download the article, or parts of the article, in various formats.
Downloads (link to download the article as PDF)
Open citations (links to open the citations from this article in various online reference manager services)
Cite this article (links to download the citations from this article in formats compatible with various reference manager tools)
Metabolite exchange between microbiome members produces compounds that influence Drosophila behavior
eLife 6:e18855.
https://doi.org/10.7554/eLife.18855


