Autocorrelation structure at rest predicts value correlates of single neurons during reward-guided choice
- University College London, United Kingdom
- University of California, Berkeley, United States
Figures
Figure 1 with 2 supplements

Homogeneity and heterogeneity of chosen value correlates.
(A) At decision time, chosen value correlates appeared homogenous across regions in their expression. The coefficient of partial determination (CPD) for chosen value averaged across populations of DLPFC (n = 310), OFC (n = 214) and ACC (n = 333) neurons (lines denote mean ± SE for each region). CPD was calculated by regressing chosen value onto firing rate during the choice period of a cost-benefit decision making task (see Materials and methods). Chosen value correlates were not significantly different between any brain region (permutation tests; DLPFC v OFC, no cluster survived thresholding, DLPFC v ACC, p=0.2706, OFC v ACC, no cluster survived thresholding; see Materials and methods). Dashed lines mark the null hypothesis level for CPD in each cortical area (see Materials and methods). (B) Population averages when chosen value was regressed onto firing rate during reward delivery. OFC showed stronger chosen value correlates following reward onset than ACC and DLPFC (permutation tests; OFC v DLPFC, p=0.0010, OFC v ACC, p=0.0028; see Materials and methods). (C and D) Within each region, chosen value correlates were heterogeneous across neurons. Chosen value correlates of the individual neurons contributing to the population averages in A and B respectively. Within each matrix: each row is a neuron (sorted by maximum CPD within the corresponding epoch and area), each column is a 10 ms time bin. Hence, neurons are sorted in a different order in C and D. Chosen value coding at reward delivery was weaker than at choice. Figure 1—figure supplement 1 shows the fraction of neurons with reliable coding of chosen value at choice and at the outcome. Figure 1—figure supplement 2 shows that OFC codes chosen value, as opposed to chosen benefit alone, at the time of reward delivery.
Figure 1—figure supplement 1
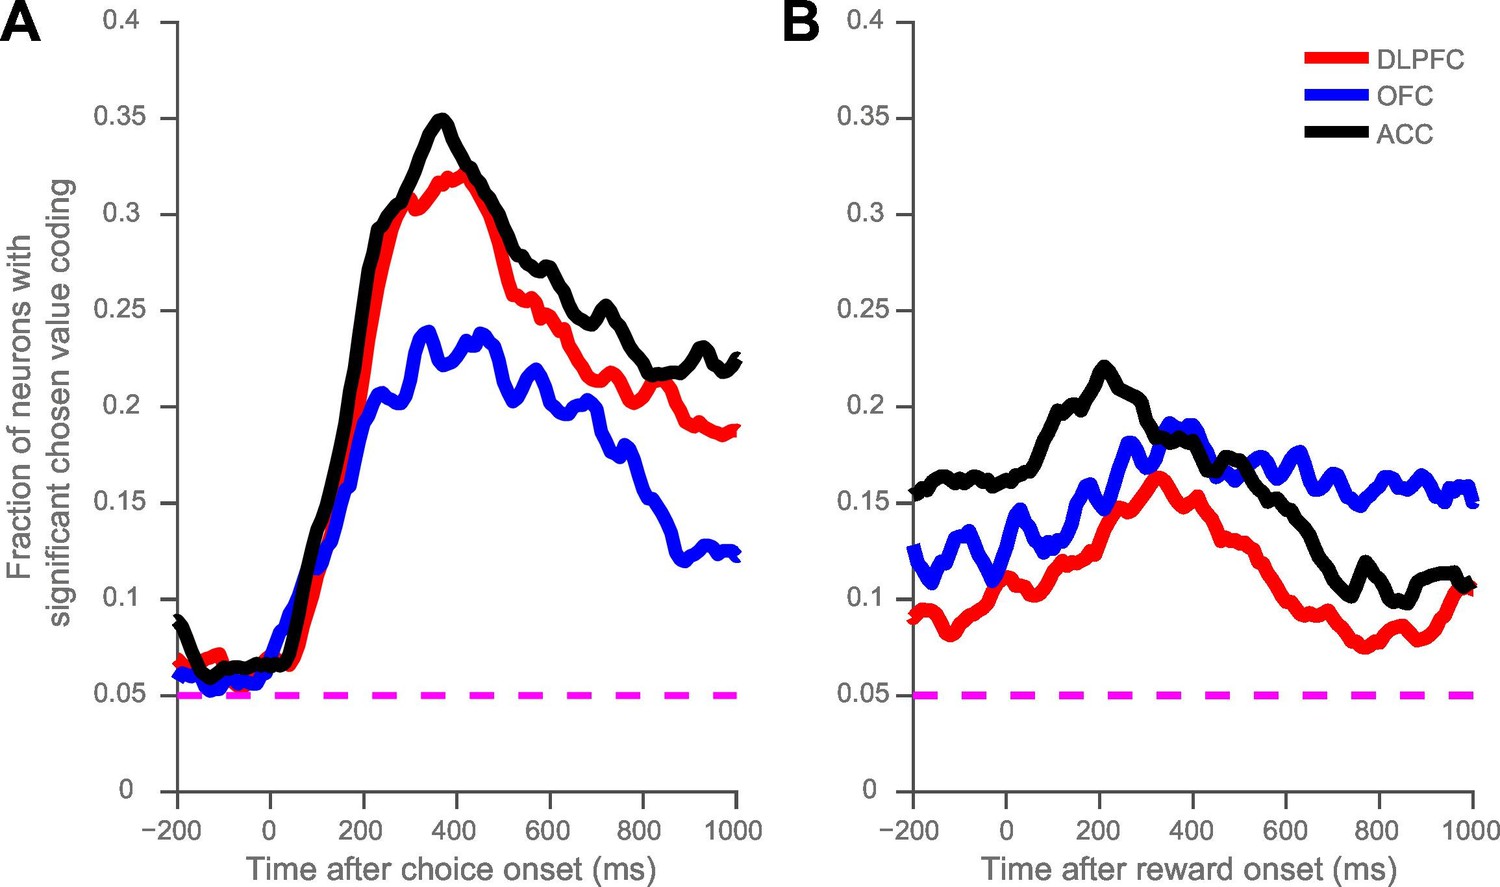
Fraction of neurons with reliable coding of chosen value at choice (A) and at outcome (B).
The regression coefficient for each neuron at each time point was assessed for significance to p<0.05 level. The proportion of significant neurons within each cortical area was smoothed across five 10 ms time points. The fraction of significant neurons exceeds the null hypothesis (dashed magenta line) for all time points after choice onset.
Figure 1—figure supplement 2

Orbitofrontal cortex codes chosen value, as opposed to chosen benefit alone, at the time of reward delivery.
The regression analysis from Figure 1 was repeated, with the chosen value predictor split into chosen benefit and chosen cost components for each trial. Both chosen benefit and chosen cost coding are present at the time of reward delivery. (A) and (B) plot the population average coefficient of partial determination for the chosen benefit and cost regressors timelocked to reward onset. Dashed lines mark the null hypothesis level for CPD in each cortical area (see Materials and methods). (C) and (D), as in Figure 1—figure supplement 1, show the fraction of neurons coding chosen benefit (C) or cost (D) within each cortical area. The dashed magenta lines indicate the null hypothesis fraction of significant coding neurons.
Figure 2 with 4 supplements
Single neurons show variability in resting autocorrelation structure.
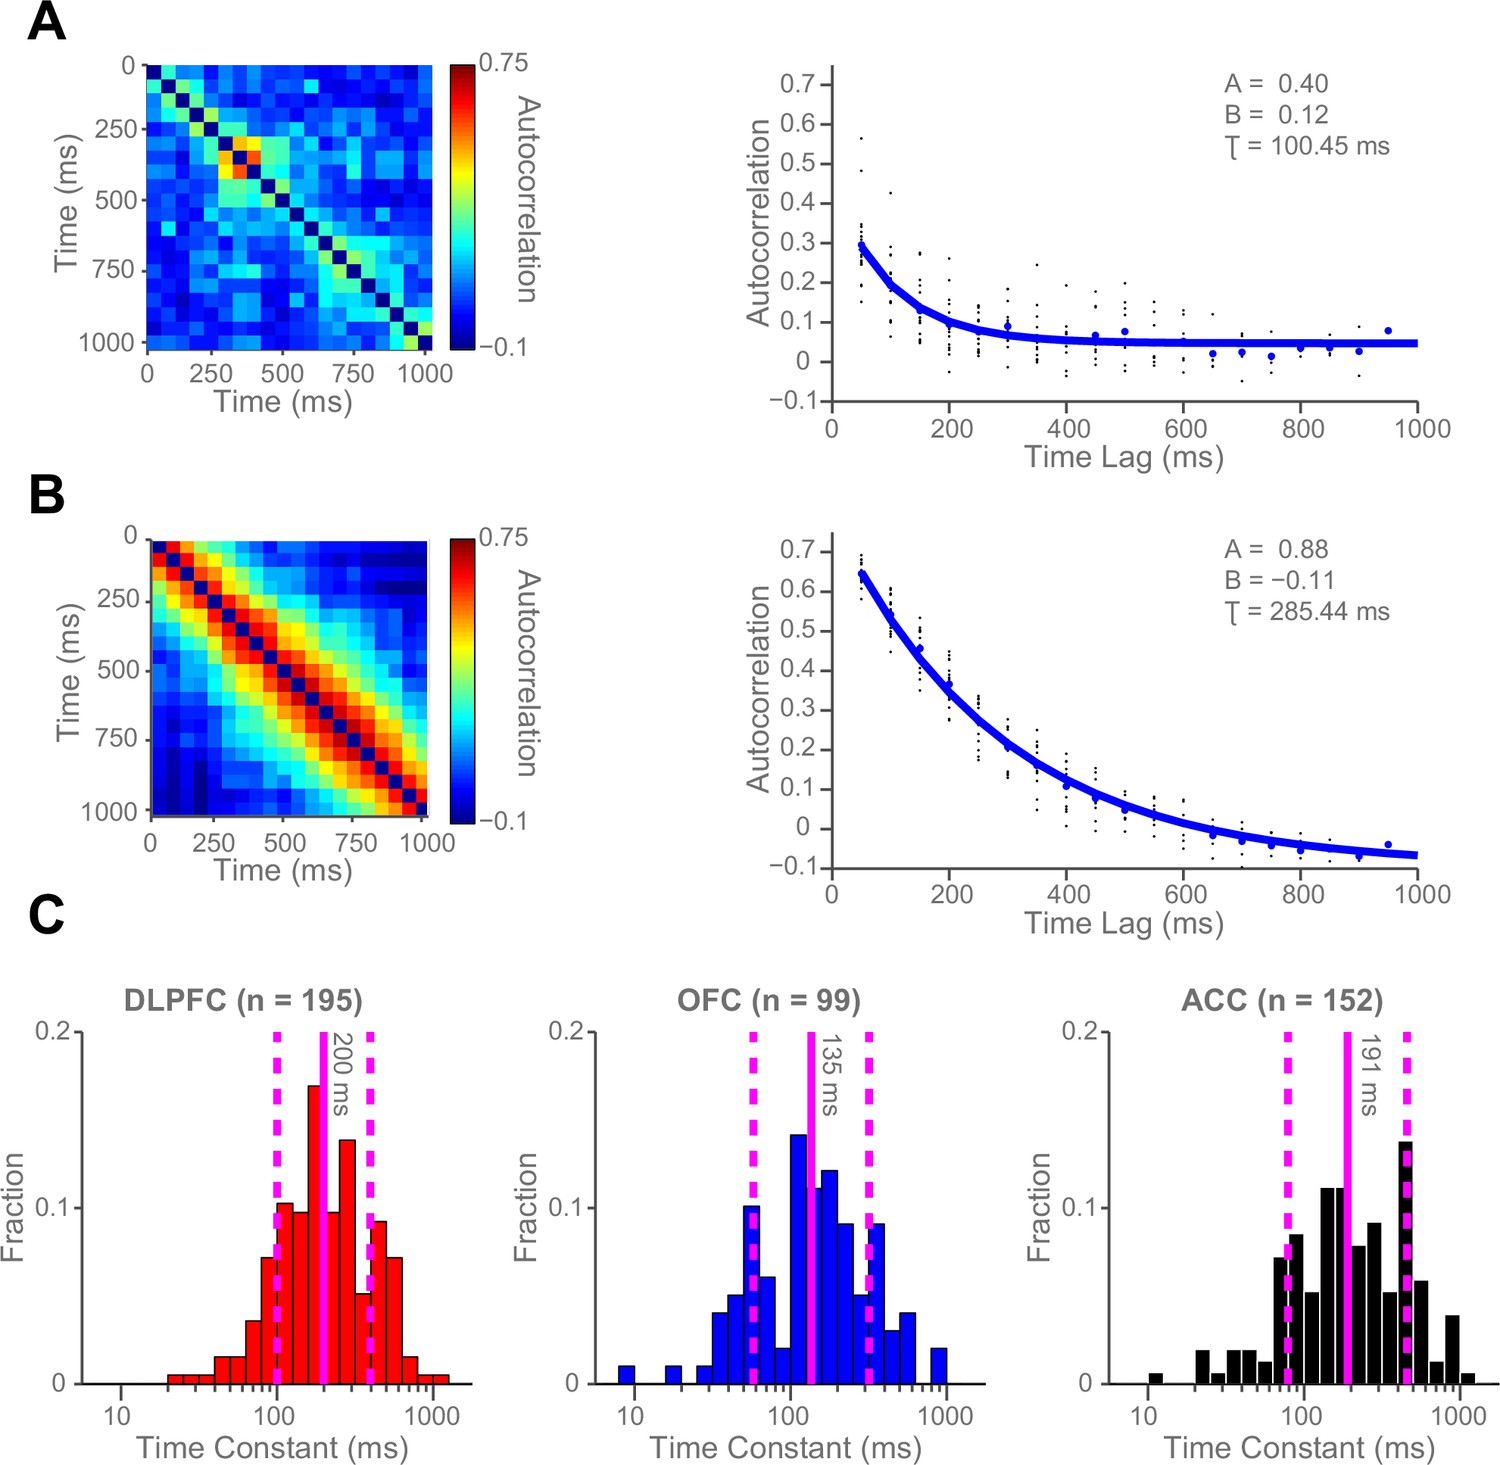
(A) Autocorrelation matrix and structure of an example low time constant OFC single neuron. (B) Autocorrelation matrix and structure of an example high time constant single OFC neuron. This neuron has a stable autocorrelation maintained across time. Fitting of time constants was only performed on cells that showed an exponentially decaying autocorrelation. See Figure 2—figure supplement 1 for single neuron examples of excluded cells. (C) Histograms of the time constants within the three PFC brain regions. Time constants are highly variable across neurons; with the greatest heterogeneity present within OFC and ACC populations. Solid and dashed vertical lines represent mean(Log(τ)) and mean(Log(τ)) ± SD(Log(τ)) respectively. See Figure 2—figure supplement 2 for autocorrelation structure at the population level. Figure 2—figure supplement 3 for population autocorrelation when trials are filtered for fluctuations in firing rate. Figure 2—figure supplement 4 shows the population autocorrelation across trial time.
Figure 2—figure supplement 1
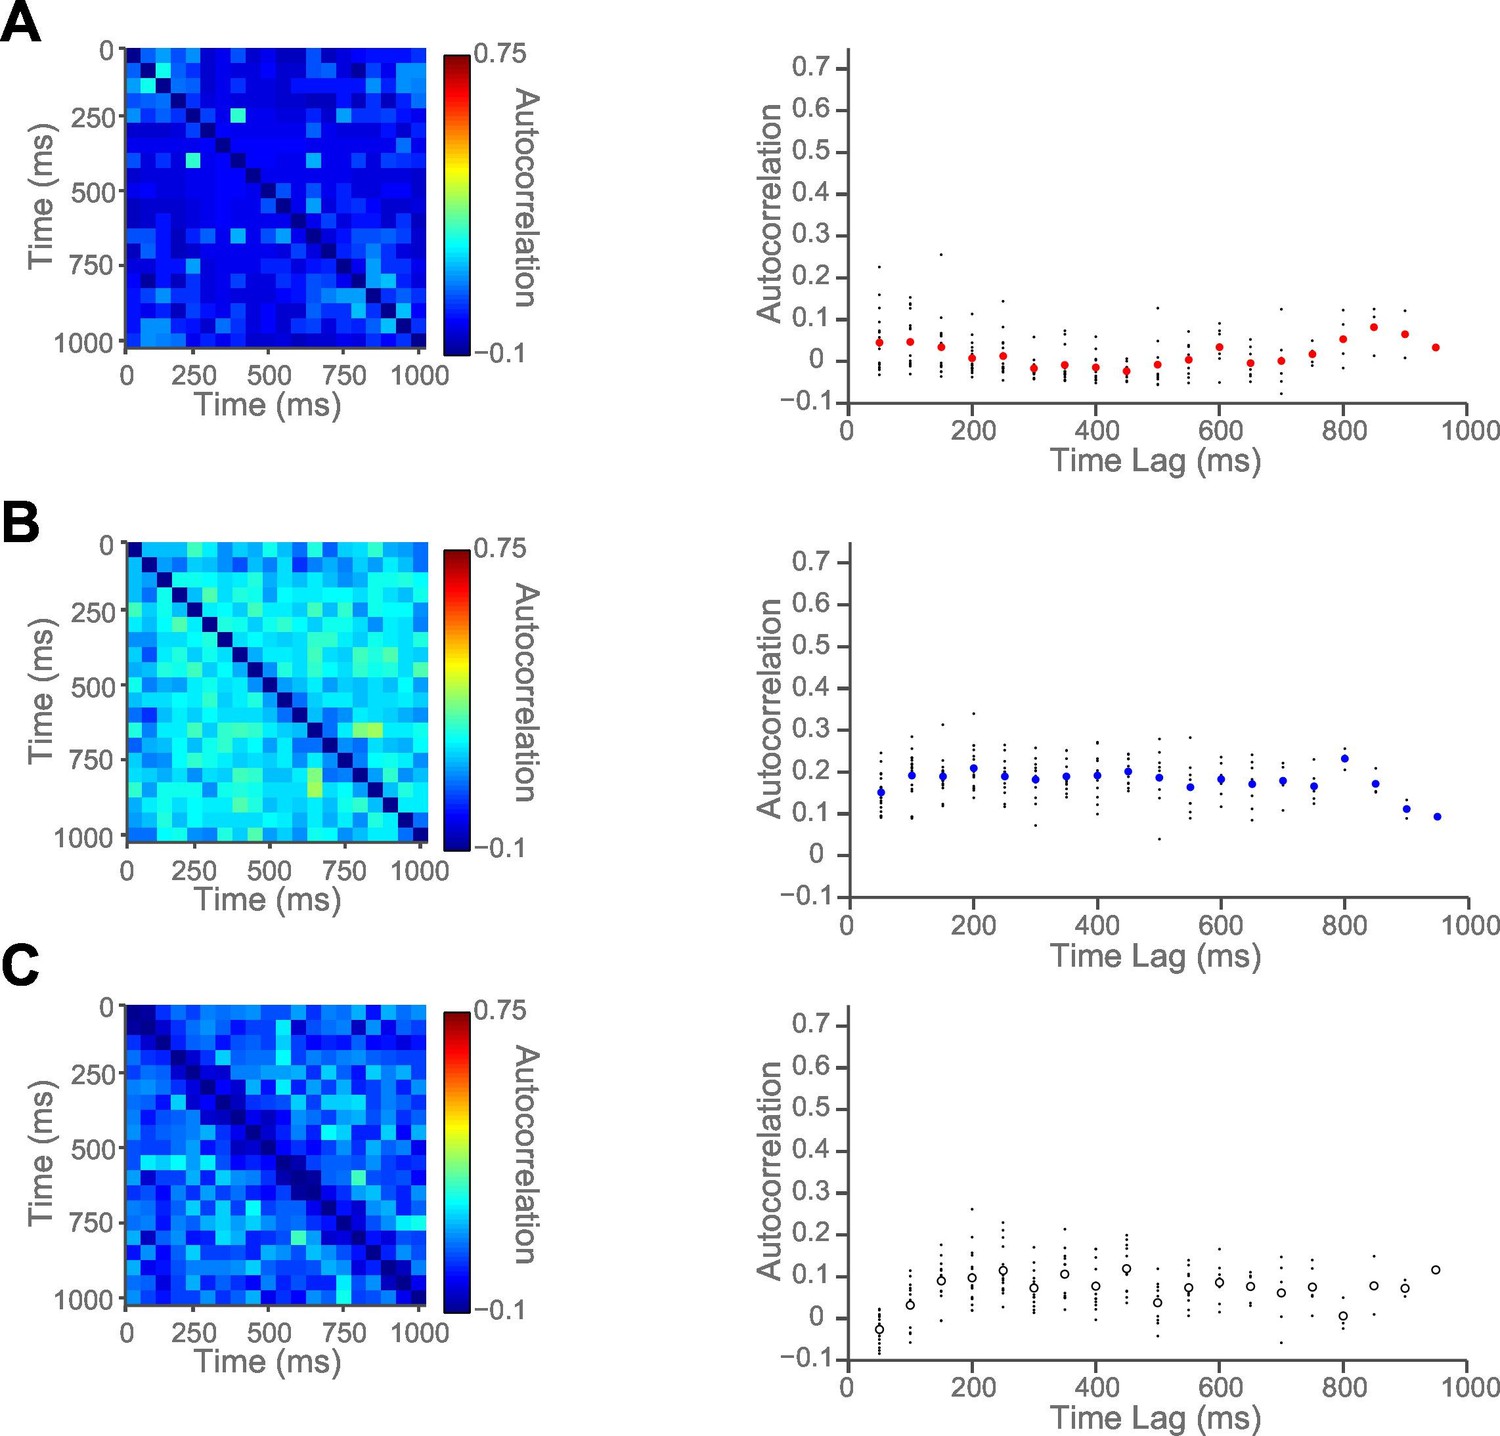
Autocorrelation of example single neurons that were excluded from all subsequent analyses.
We manually excluded 411 cells (48.1% of all neurons) from all subsequent analyses which could not be adequately described as showing an exponential decay in spike count autocorrelation (see Materials and methods). Three example neurons which were not assigned time constants because their autocorrelation did not decay exponentially. (A) An example DLPFC neuron with a low, flat autocorrelation. (B) An example OFC neuron with a persistent, non-decaying autocorrelation. (C) An example ACC neuron with an initial increase in autocorrelation at short time lags, and no subsequent decay.
Figure 2—figure supplement 2

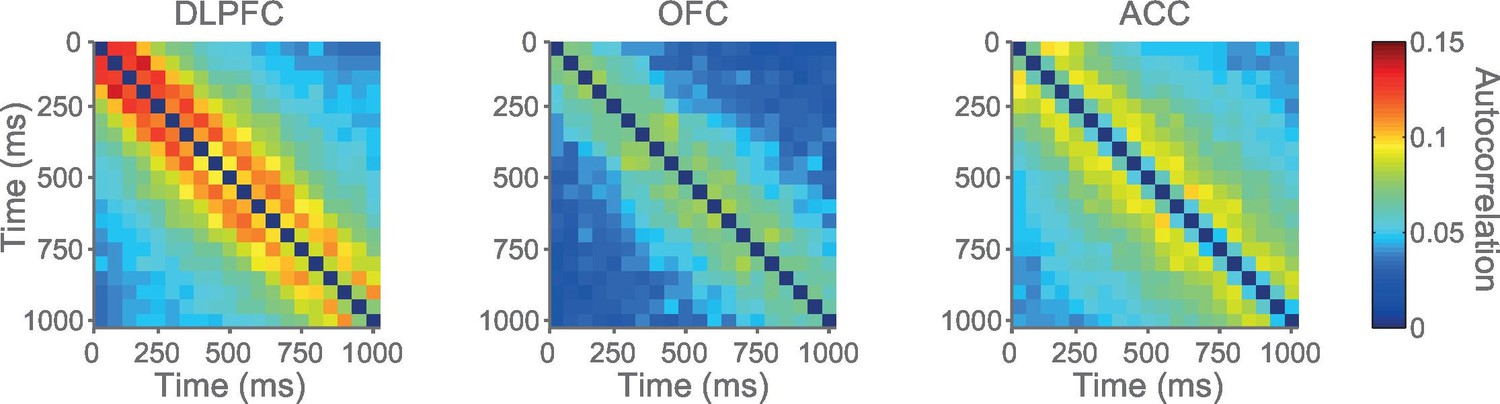
Autocorrelation structure of the DLPFC, OFC and ACC populations.
Time constant (tau parameter from the displayed equation), captures the maintenance of autocorrelation over time. ACC had the highest time constant of all regions studied. See also Figure 2—figure supplement 3 for autocorrelation when trials were filtered for drifting firing rate (see Materials and methods) and Figure 2—figure supplement 4 for population autocorrelation across trial time.
Figure 2—figure supplement 3

The autocorrelation structure of the DLPFC, OFC and ACC population when trials were filtered for drifts in resting firing rate.
Spike count autocorrelation was only performed on trials where the resting firing rate was statistically stationary (see Materials and methods). Similar results were obtained to Figure 2—figure supplement 2.
Figure 2—figure supplement 4
Population Autocorrelation across trial time.
A 1 s fixation period is subdivided into non-overlapping 50 ms bins. Spike count from each bin was correlated with all other bins then averaged across the population to generate these matrices.
Figure 3 with 1 supplement
Resting time constant predicts chosen value correlates during decision phase.
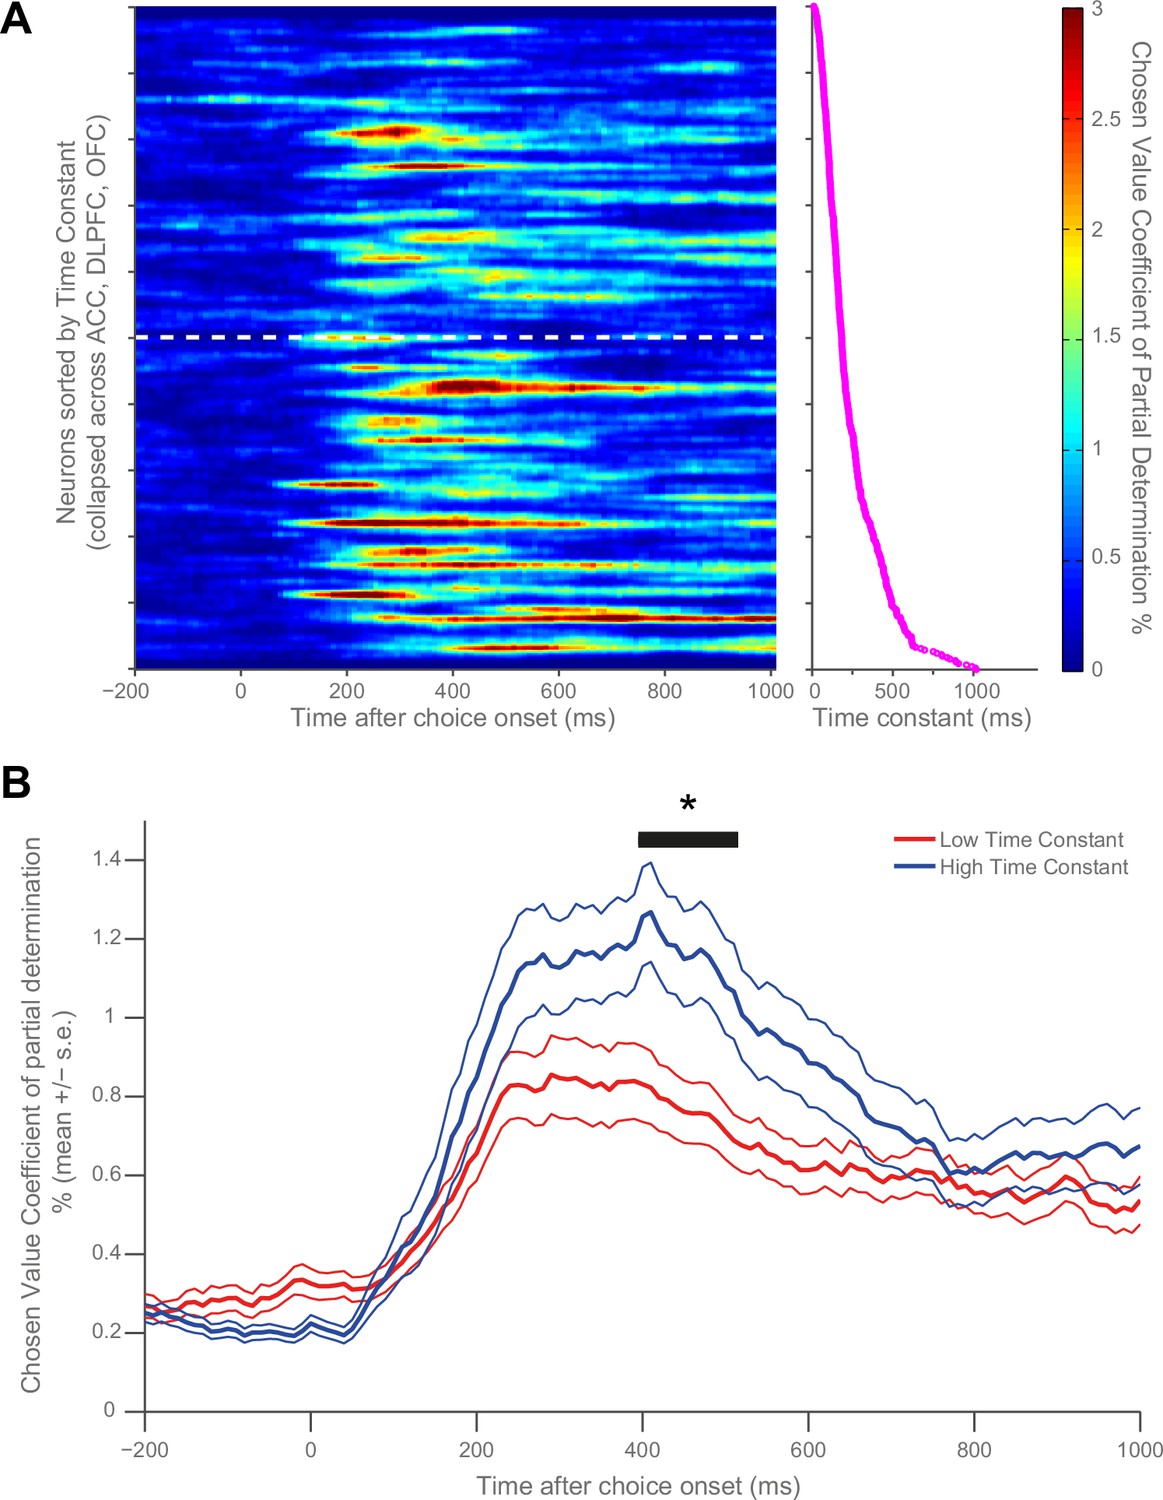
(A) Strong chosen value correlates were more prevalent in neurons with higher time constants. Coefficient of partial determination (CPD) for chosen value across time for each PFC neuron (n = 446) was stacked into a matrix. The rows of the matrix (i.e. each individual neuron) were sorted by increasing time constant, and then convolved with a Gaussian function (see Materials and methods). The white dashed line indicates a median split by time constant; high time constant neurons are beneath the line, low time constant neurons are above. The graph to the right of this matrix shows the individual decay time constant for each neuron (row) in the matrix. (B) When all neurons are subdivided by a median split of time constant, those with a higher time constant exhibit stronger chosen value correlates. Black trace indicates a significant cluster of bins, corrected for multiple comparisons across time (see Materials and methods, p=0.0298). CPD (mean ± SE) for chosen value was calculated by multiple linear regression analysis (see Materials and methods). Figure 3—figure supplement 1 shows a rank correlation of resting time constant with chosen value coding across time.
Figure 3—figure supplement 1
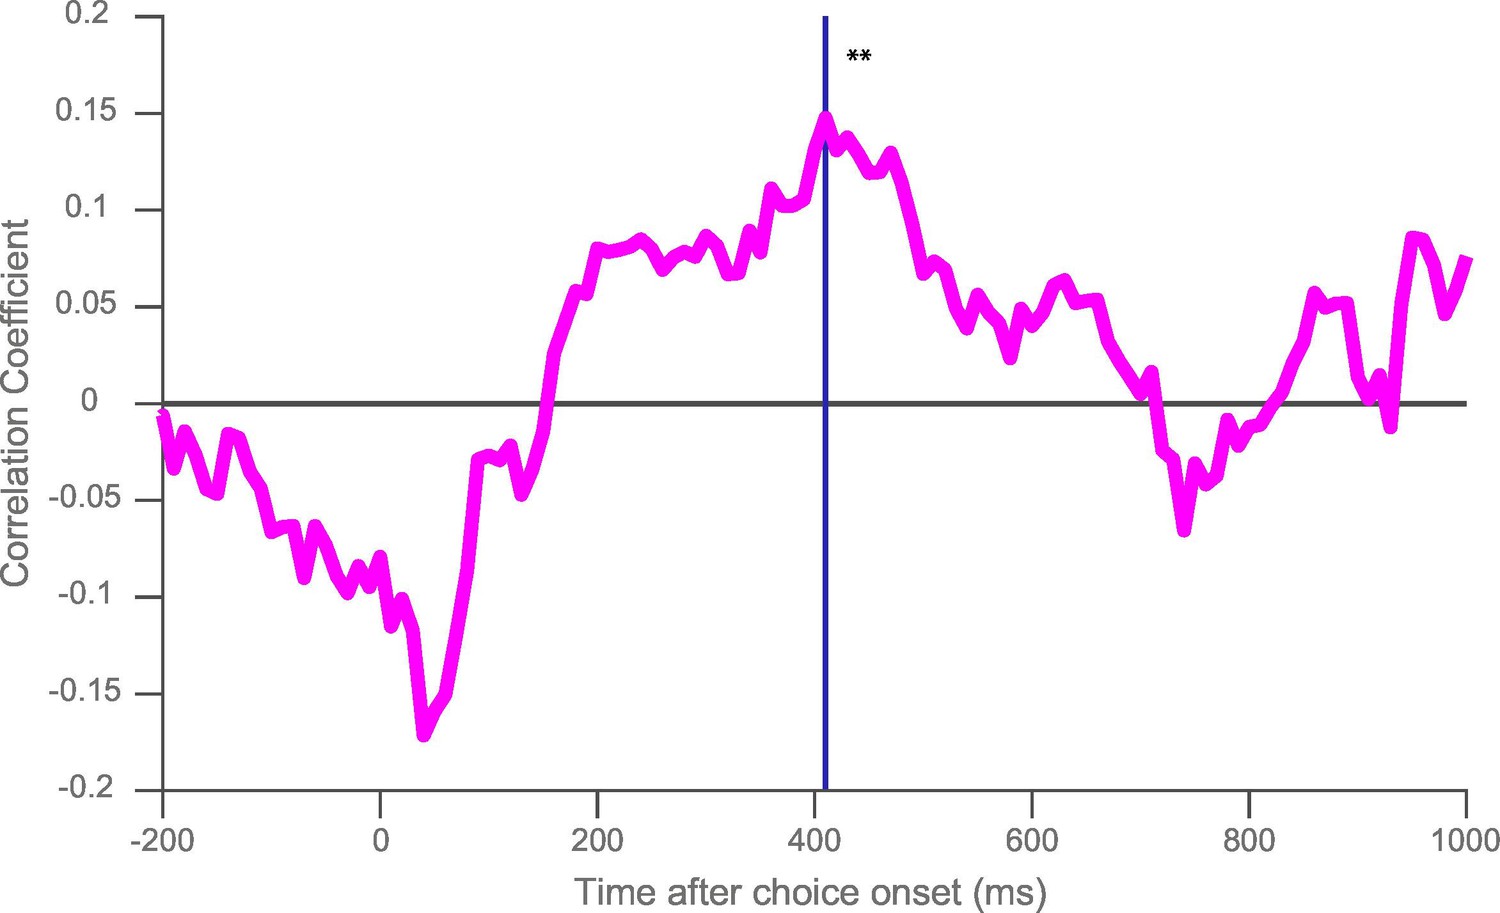
Rank correlation between resting time constant and chosen value correlates during the decision phase.
At the time of maximum population-average chosen value coding (indicated by the blue line), there is a positive correlation between time constant and the coefficient of partial determination (CPD) for chosen value (correlation coefficient = 0.148; p=0.0018). ** represents p<0.01.
Figure 4 with 1 supplement
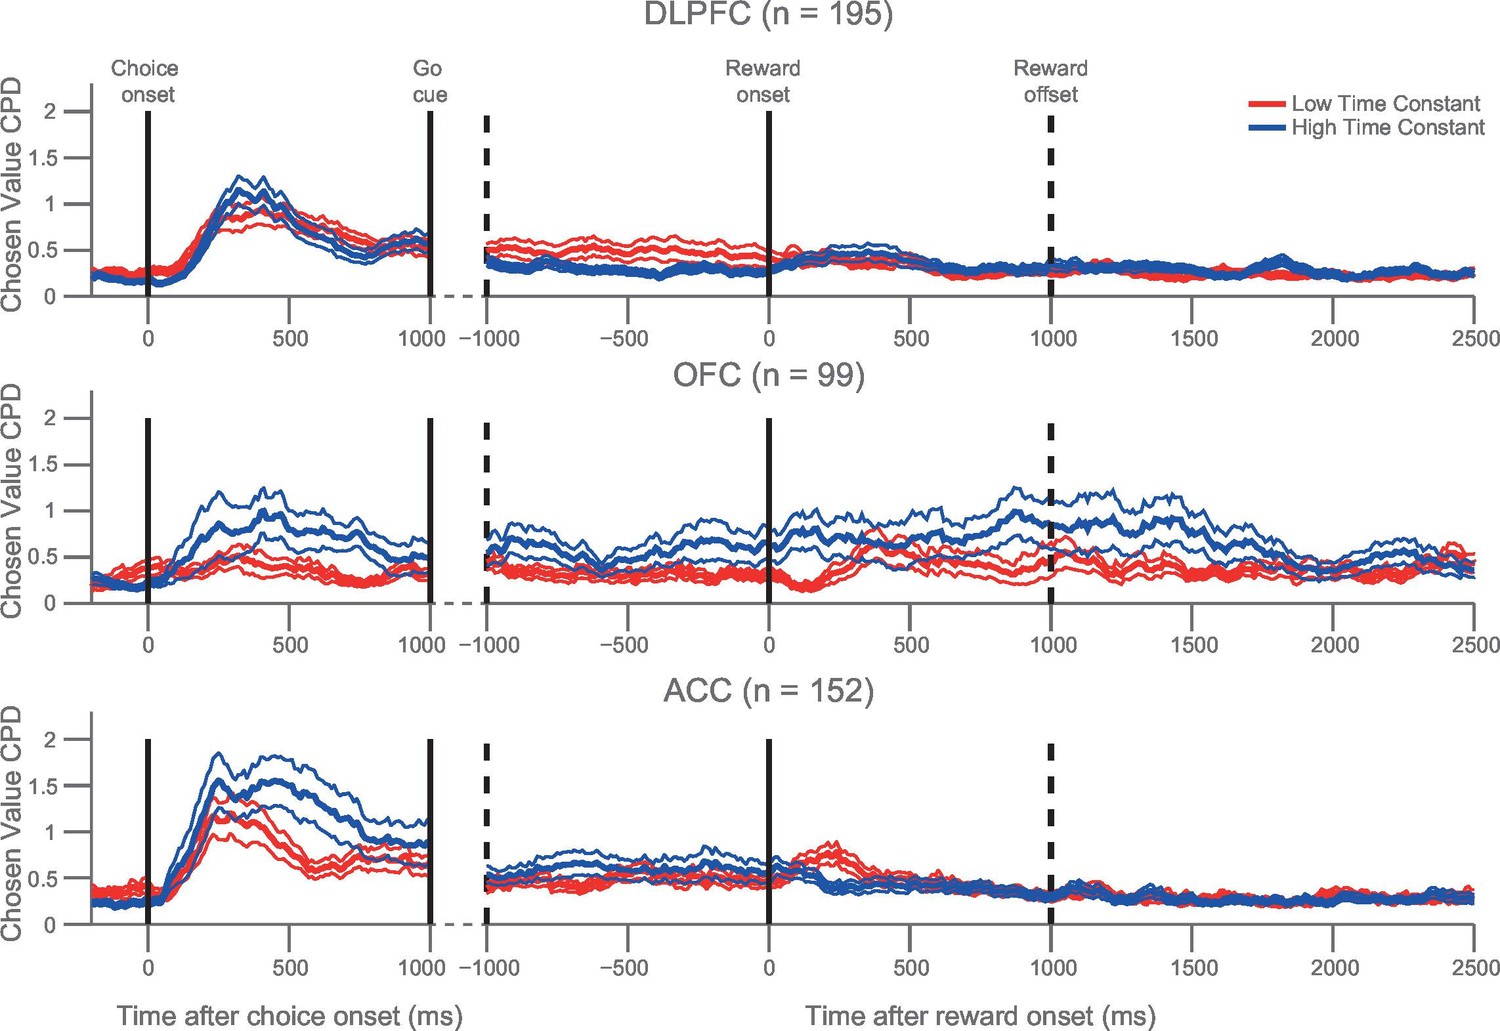
Orbitofrontal neurons with higher resting time constant maintain a representation of chosen value from choice through the experience of reward delivery.
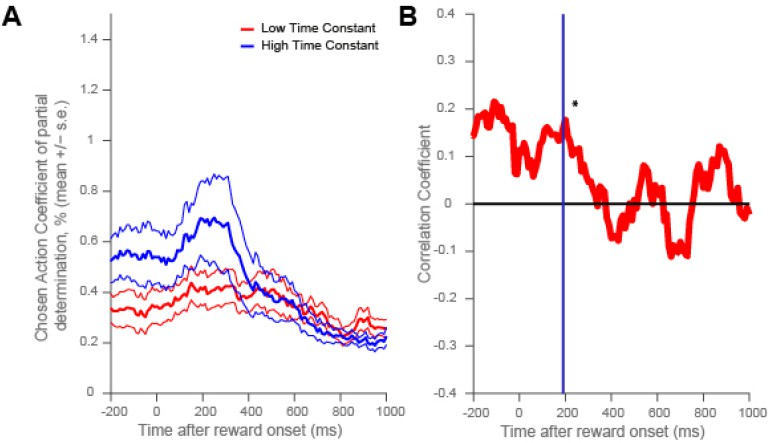
As in Figure 3B, a median split of neurons by their resting time constant was performed within each PFC area. The coefficient of partial determination (CPD) for chosen value in high time constant (blue) and low time constant (red) neurons is plotted timelocked to both choice and reward onset. Chosen value explained more of the variance in neuronal firing in the OFC neurons with a higher time constant both at choice (p=0.0066) and shortly after reward delivery (p=0.0082). Chosen value is therefore maintained across the trial within OFC, but returns to baseline before the next trial begins. CPD (mean ± SE) for chosen value was calculated by multiple linear regression analysis (see Materials and methods). Figure 4—figure supplement 1 shows a rank correlation of resting time constant with chosen value coding during the decision phase and reward delivery.
Figure 4—figure supplement 1
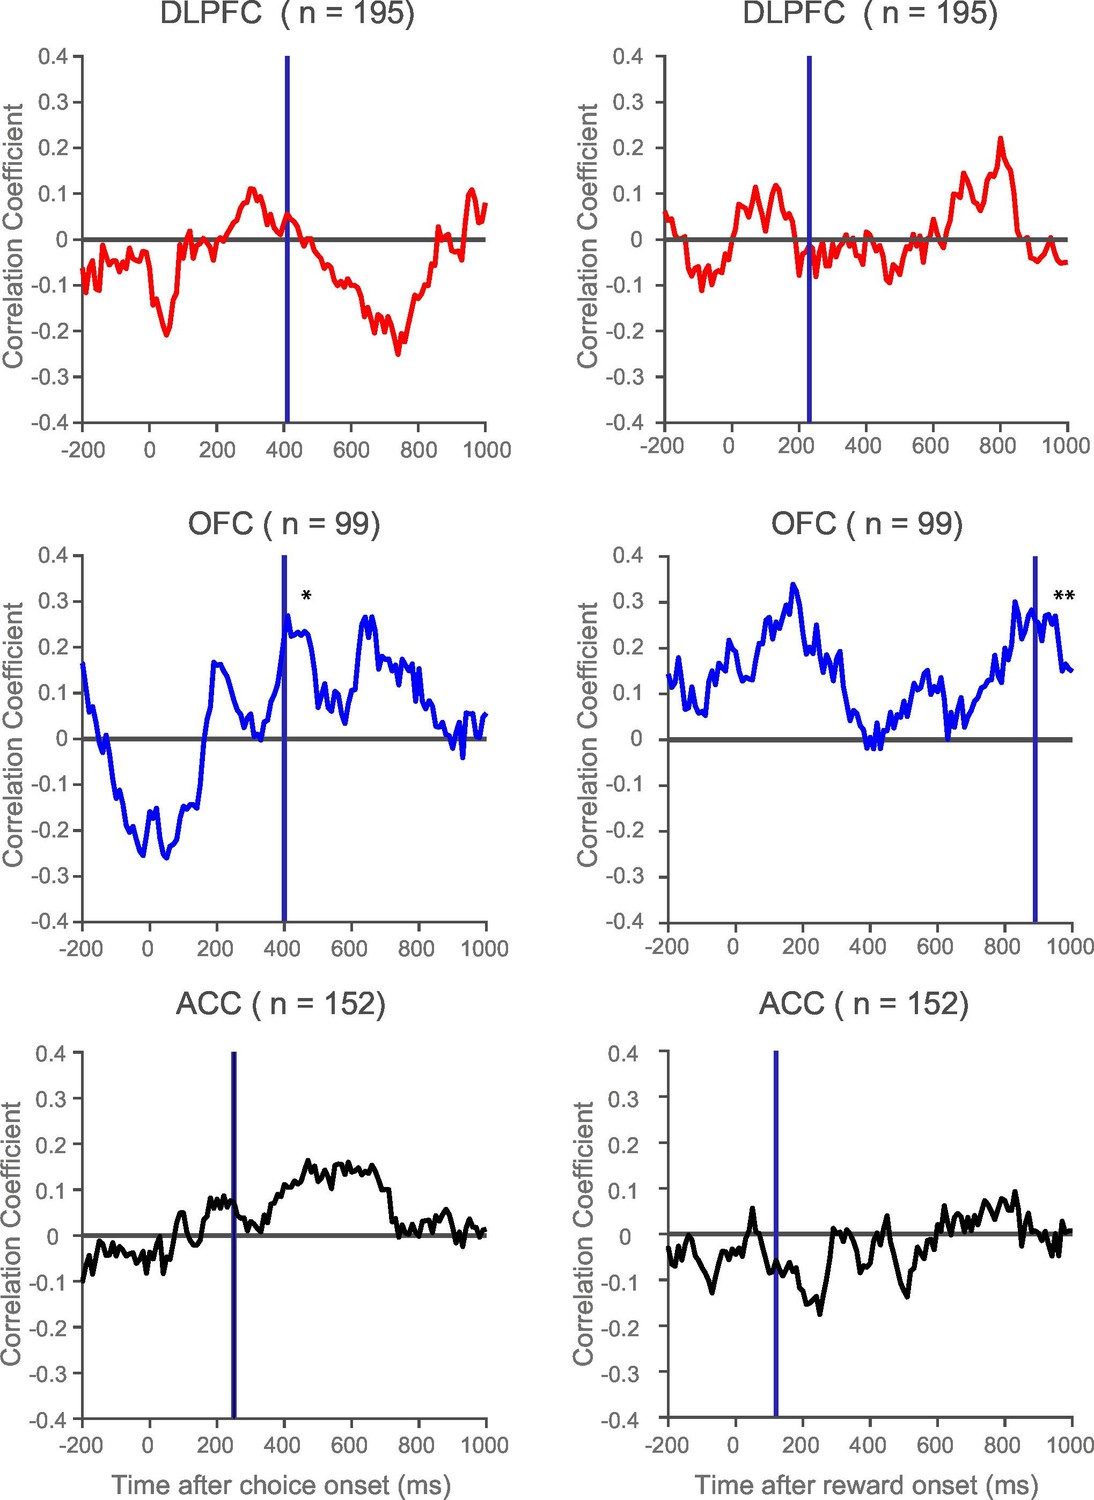
Rank correlation between resting time constant and chosen value correlates during choice and following reward.
Within the orbitofrontal cortex (OFC), there was a positive correlation between resting time constant and the coefficient of partial determination (CPD) for chosen value at the time of the maximum population-average CPD during choice (vertical purple line, correlation coefficient = 0.2268, p=0.0242) and outcome (vertical purple line, correlation coefficient = 0.2608, p=0.0093). This effect was also present shortly after the onset of reward delivery. The relationship between resting time constant and chosen value correlates was weaker within the dorsolateral prefrontal cortex (DLPFC) and anterior cingulate cortex (ACC) at choice. Towards the end of the decision phase, when DLPFC transitions between primarily chosen value correlates to coding the chosen action (Hunt et al. 2015), a negative correlation between resting time constant and chosen value CPD emerges. There was no relationship between time constant and the chosen value coding within DLPFC and ACC at the time of outcome. * represents p<0.05; ** represents p<0.01.
Figure 5 with 2 supplements
The same OFC neurons correlate strongly with chosen value at both choice and during reward delivery, but only those with high time constants.
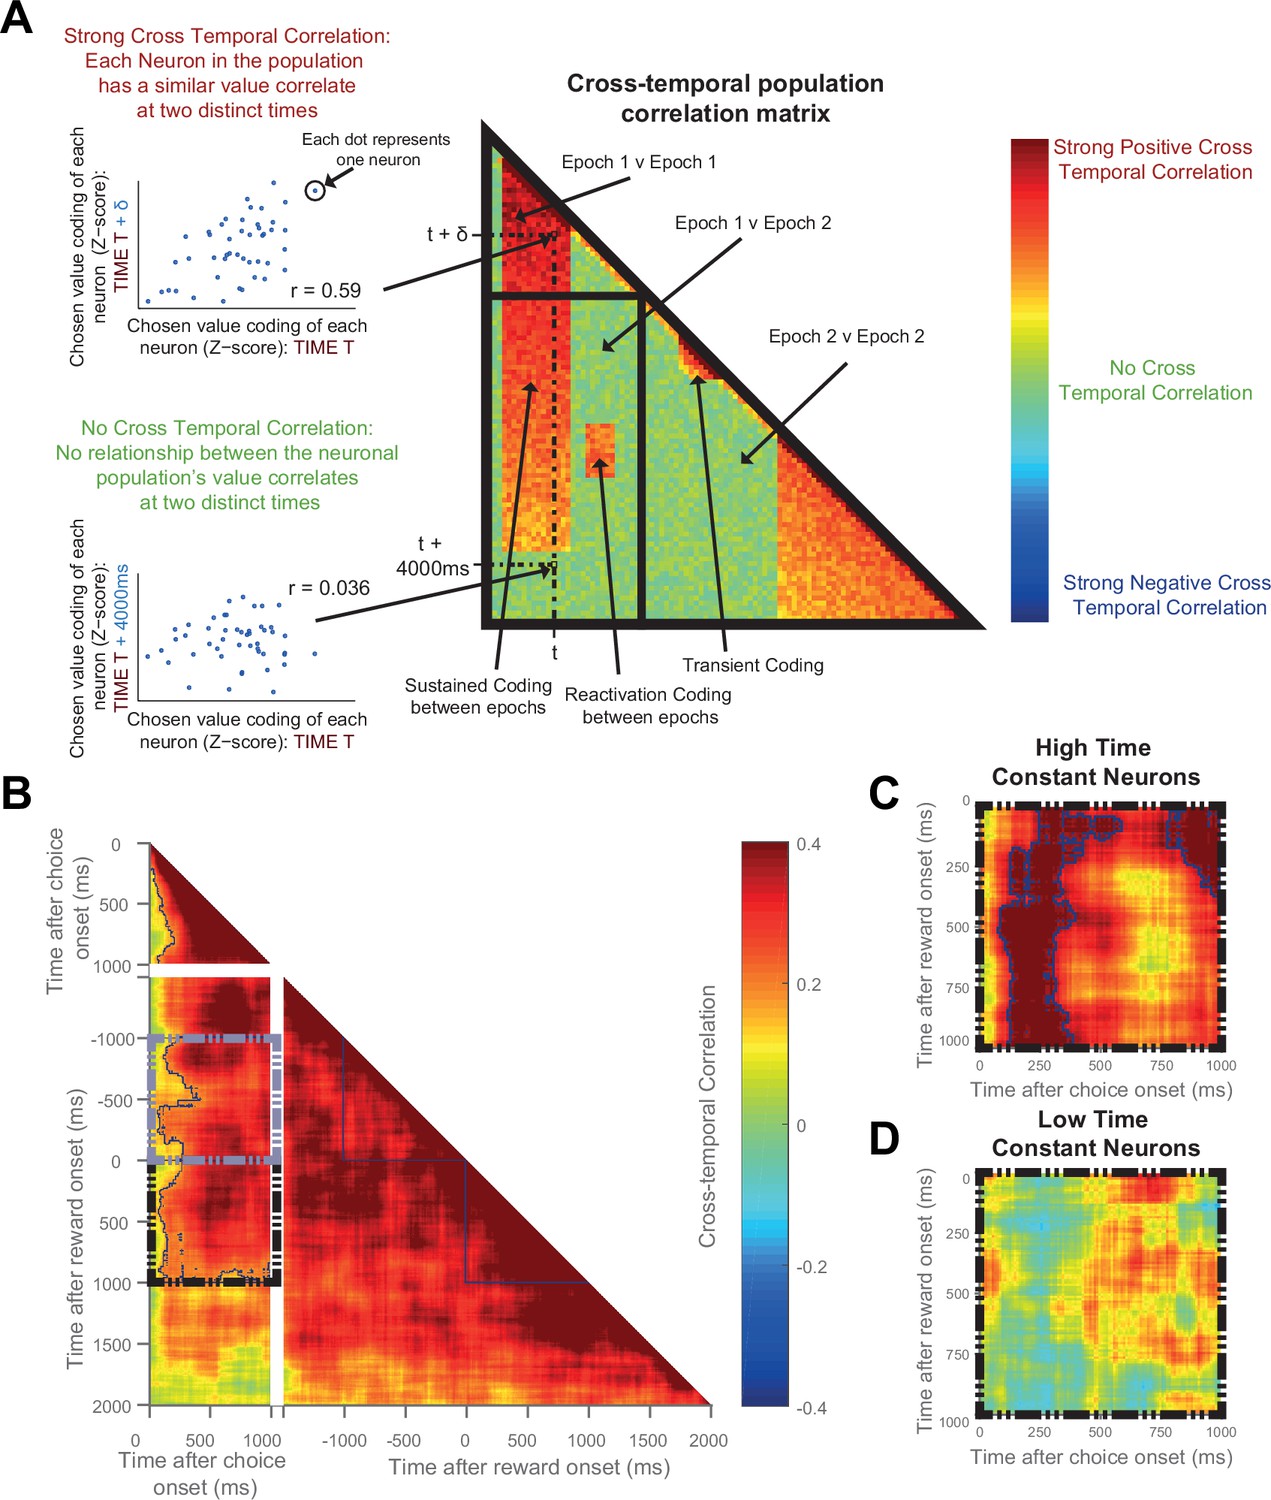
(A) Schematic representing the cross-temporal pattern analysis. Each pixel represents a correlation coefficient between two population vectors. Entries into the vectors contain each neuron’s chosen value regression coefficient at Time T and at Time T + δt. If the chosen value correlates are consistent across the neuronal population at the two distinct time points, there will be a strong cross-temporal correlation (red colour). At two points close in time, chosen value correlates of each neuron will inevitably be similar. If these correlates are consistent for only a short period of time, there will be a transient population code; whereas if each neuron’s chosen value correlate is consistent for a prolonged period, there will be a sustained population code. If each neuron within a population correlates with chosen value at two separate points of a trial (e.g. choice and outcome), in the absence of sustained coding bridging the two, there is a reactivation population code. (B) Cross-temporal pattern analysis of OFC neurons (n = 214). There is clear evidence for sustained coding of the chosen value at choice (top left), as well as before and throughout outcome (bottom right), reflected by strong correlations extending off the diagonal of the plot. Blue lines indicate a significant area of cross-correlation (p<0.05, see Materials and methods). There is also sustained coding of the chosen value signal from choice through outcome, shown by a strong cross-temporal correlation both prior (grey dashed box) and during reward (black dashed box). Within the dashed areas, blue lines indicate a significant area of cross-correlation (p<0.05, see Materials and methods). (C and D) The black dashed inset (bottom left quadrant in B) is then performed in high (C) and low (D) time constant OFC neurons separately. The sustained coding is present specifically in high time constant cells (largest cluster of cross correlation, p=0.0002), but absent in low time constant cells (p=0.2248; permutation test, see Materials and methods). See also Figure 5—figure supplement 1 and 2: Sustained chosen value correlates are present at choice and outcome within DLPFC and ACC, but sustained coding from choice through outcome is absent. Sustained coding between choice and outcome was much stronger in OFC than in DLPFC or ACC (permutation tests; OFC v DLPFC, p=0.0008, OFC v ACC, p<0.0001, see Materials and methods).
Figure 5—figure supplement 1

Cross-temporal analysis of DLPFC activity.
Chosen value correlates are present at choice and outcome, but sustained coding between choice and outcome is absent. Blue lines indicate a significant area of cross-correlation (p<0.05, see Materials and methods). (B and C) The black dashed inset (bottom left quadrant in A) is then performed in high (B) and low (C) time constant DLPFC neurons separately. There is no sustained coding present in either high or low time constant cells; only a small cluster of reactivation coding is evident in low time constant cells (p=0.029, see Materials and methods).
Figure 5—figure supplement 2

Cross-temporal analysis of ACC activity.
Sustained chosen value correlates are present at choice and outcome, but sustained coding from choice through outcome is absent. However, there appears to be maintenance of chosen value coding from choice until the period immediately preceding reward delivery (grey dashed box). Blue lines indicate a significant area of cross-correlation (p<0.05, see Materials and methods). (B and C) The black dashed inset (bottom left quadrant in A) is then performed in high (B) and low (C) time constant ACC neurons separately. There is no evidence for sustained coding from choice through outcome in either low or high time constant cells. This contrasts with an OFC (Figure 5C–D), where the sustained code from choice is also present through reward delivery specifically in high time constant neurons.
Author response image 1

Population averages when chosen action was regressed onto firing rate during reward delivery.
DLPFC showed stronger chosen action correlates following reward onset than ACC and OFC (permutation tests; DLPFC v OFC, p = 0.0006, DLPFC v ACC, p = 0.0002; see Methods). Dashed lines mark the null hypothesis level for CPD in each cortical area (see Methods).
Author response image 2
Dorsolateral prefrontal cortex neurons with higher resting time constant code chosen action more strongly around reward onset.
(A) As in Figure 4, a median split of neurons by their resting time constant was performed within DLPFC. The coefficient of partial determination (CPD) for chosen action in high time constant (blue) and low time constant (red) neurons is plotted timelocked to reward onset. CPD (mean ± SE) for chosen action was calculated by multiple linear regression analysis (see Methods). (B) As in Figure 4—figure supplement 1, a rank correlation between resting time constant and chosen action coding is plotted. There was a positive correlation between resting time constant and the coefficient of partial determination (CPD) for chosen action at the time of the maximum population-average CPD during outcome (vertical purple line and asterisk, correlation coefficient = 0.1607, p = 0.0249).
Download links
A two-part list of links to download the article, or parts of the article, in various formats.
Downloads (link to download the article as PDF)
Open citations (links to open the citations from this article in various online reference manager services)
Cite this article (links to download the citations from this article in formats compatible with various reference manager tools)
Autocorrelation structure at rest predicts value correlates of single neurons during reward-guided choice
eLife 5:e18937.
https://doi.org/10.7554/eLife.18937


