Regulation of X-linked gene expression during early mouse development by Rlim
- University of Massachusetts Medical School, United States
- Konyang University, Korea
- Massachusetts Institute of Technology, United States
- Broad Institute of MIT and Harvard, United States
- Ragon Institute of MGH, MIT and Harvard, United States
- Howard Hughes Medical Institute, Massachusetts Institute of Technology, United States
Figures
Figure 1 with 1 supplement
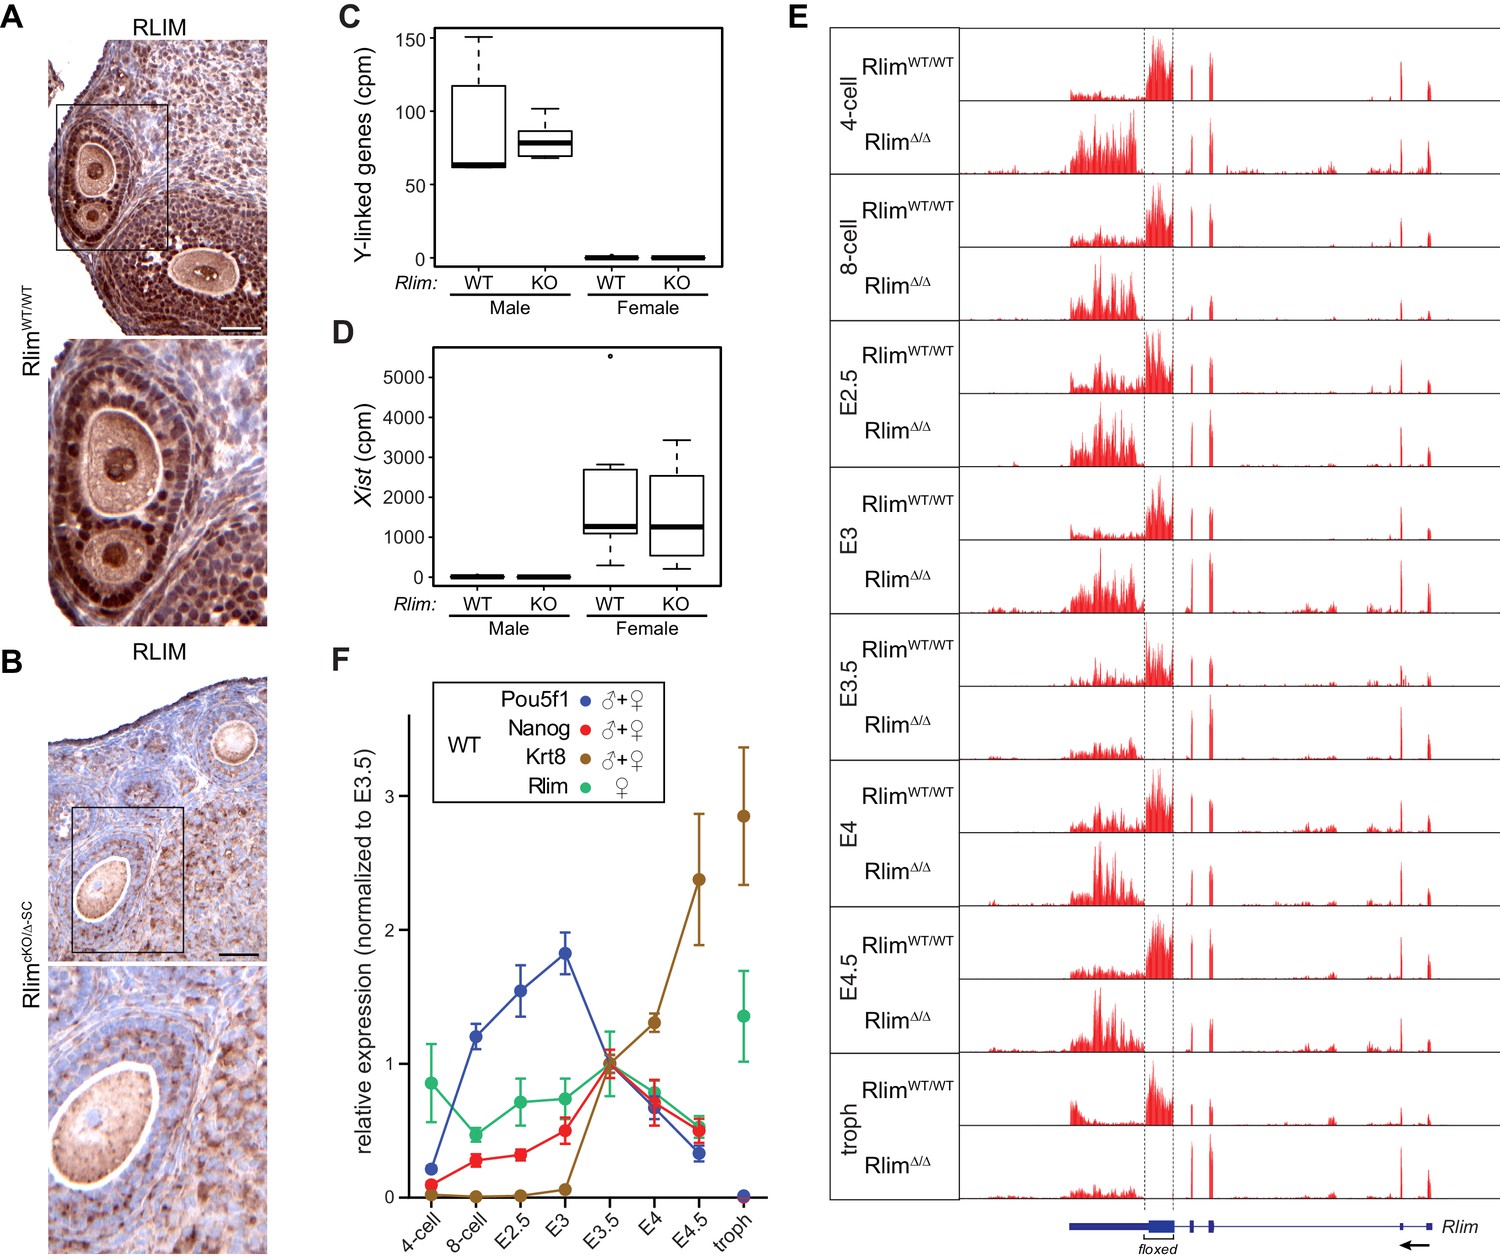
Elucidating the transcriptome of mouse pre/peri-implantation development via RNA-seq of single embryos WT and KO for Rlim.
All Rlim germline KO (Δ) embryos were generated by RlimcKO/Δ-SC x RlimΔ/Y crosses. Embryonic stages are indicated, troph = trophoblasts. (A, B) Lack of RLIM in oocytes of RlimcKO/Δ-SC females. Immunohistochemical stainings of representative ovarian sections of adult RlimWT/WT (A) and RlimcKO/Δ-SC (B) females (n = 3, each) using antibodies directed against RLIM. Scale bars, 60 μm. Boxed regions are shown in higher magnification below. Note the lack of RLIM immunoreactivity in nuclei and pronuclei of both somatic cell types and oocytes in RlimcKO/Δ-SC females, respectively. (C, D) Gender determination of embryos in RNA-seq on whole preimplantation embryos WT and KO for Rlim. As example, the distributions of reads at the 8-cell stage normalized to autosomes of Y-linked genes (C) and Xist (D) are shown in box-plots. Note that embryos with high levels of Y-linked genes display low levels of Xist and were therefore categorized as males, whereas those with low and high levels of Y-linked genes and Xist, respectively, were categorized as females. cpm = counts per million mapped reads. (E) Modified from the UCSC Genome Browser: Cumulative mapped raw reads on the Rlim locus of pooled embryos WT/WT or Δ/Δ for Rlim (females only) at all developmental stages (variable scales). Structure of the Rlim gene is shown below in blue with boxed exon regions. Protein coding regions are indicated in thicker stroke. Arrow indicates direction of transcription. Floxed area deleted in the Rlim cKO is indicated. Note the lack of reads in the floxed area of RlimΔ/Δ females. This was also true for male RlimΔ/Y embryos (data not shown). (F) Developmental profile of relative expression of selected single genes in WT embryos. Data representing Oct4/Pou5f1 and Nanog (ES cell markers) and Krt8 (trophoblast) were pooled from WT females and males. Rlim data were collected from WT/WT females only. Reads were normalized to those at stage E3.5, because all of the selected genes are expected to be active at this stage.
Figure 1—figure supplement 1
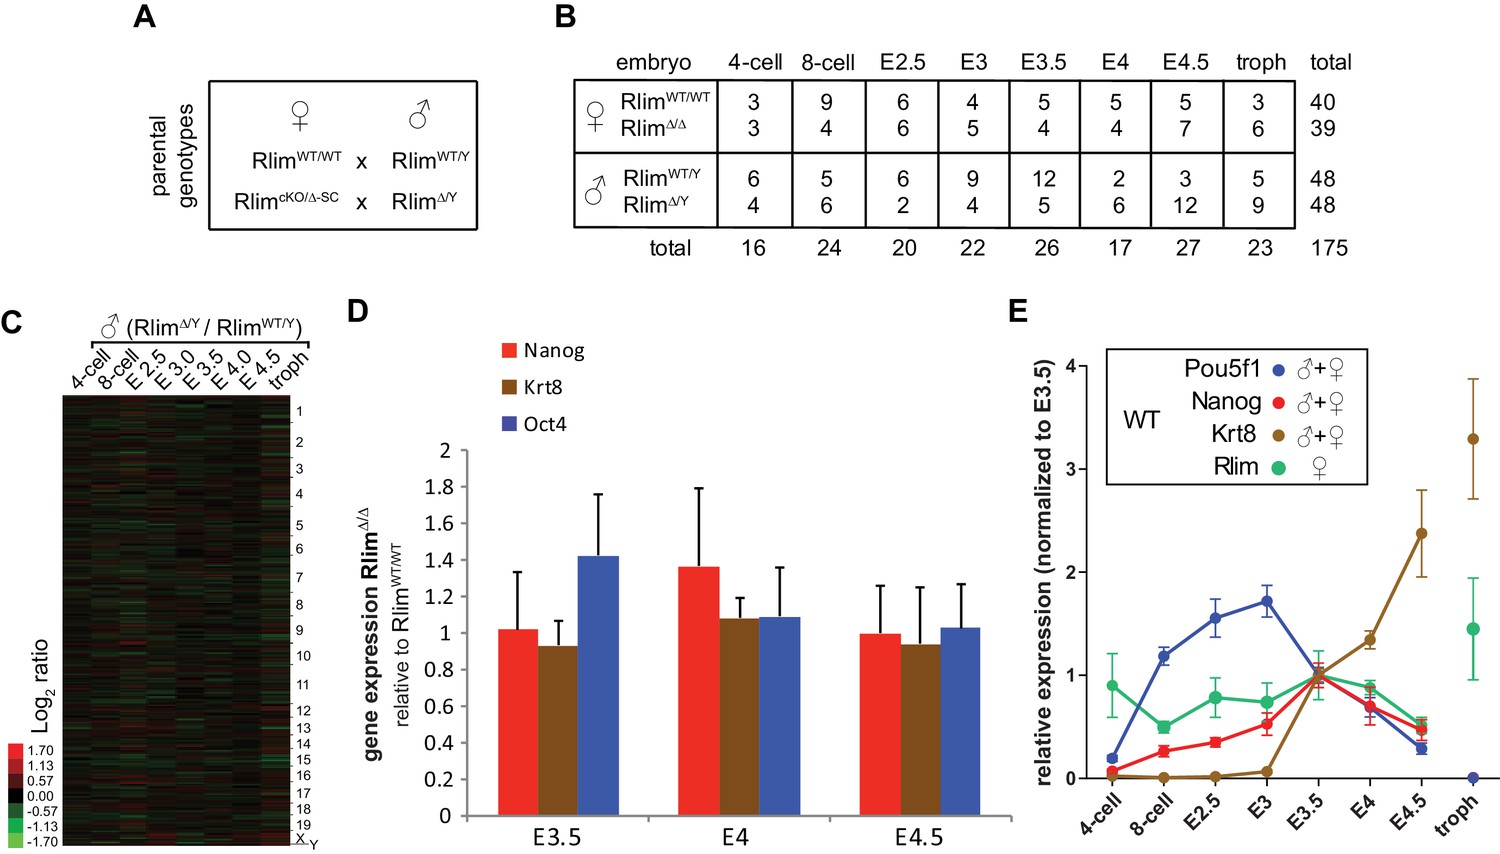
Details of RNA-seq experiments on single embryos WT and KO for Rlim.
(A) Parental genotypes used for generating WT and germline Rlim KO embryos. (B) Summary of genotypes, embryonic stages, and sample numbers of embryos used for whole embryo RNA-seq experiments. (C) No significant differences in overall gene expression between RlimΔ/Y and RlimWT/Y males. Heat map representing Log2-transformed data comparing global mRNA expression level ratios. Chromosomes are indicated. (D) Similar expression of cell markers between female RlimΔ/Δ and RlimWT/WT embryos at blastocyst stages. Data representing Oct4/POU5F1 and Nanog (ES cell markers) and Krt8 (trophoblast) were pooled from RlimWT/WT females and compared to those of RlimΔ/D (should be Δ/Δ) females. (E) Random downsizing each library to 200.000 reads does not significantly change/affect results obtained by RNA-seq (see also Figure 2—figure supplement 1B and Figure 3—figure supplement 1A,B). Representative results (n=3) obtained from the WT/RlimKO dataset with each library randomly adjusted to 200k reads: Analysis of Oct4/Pou5f1, Nanog, Krt8 and Rlim expression profiles in WT embryos.
Figure 2 with 1 supplement
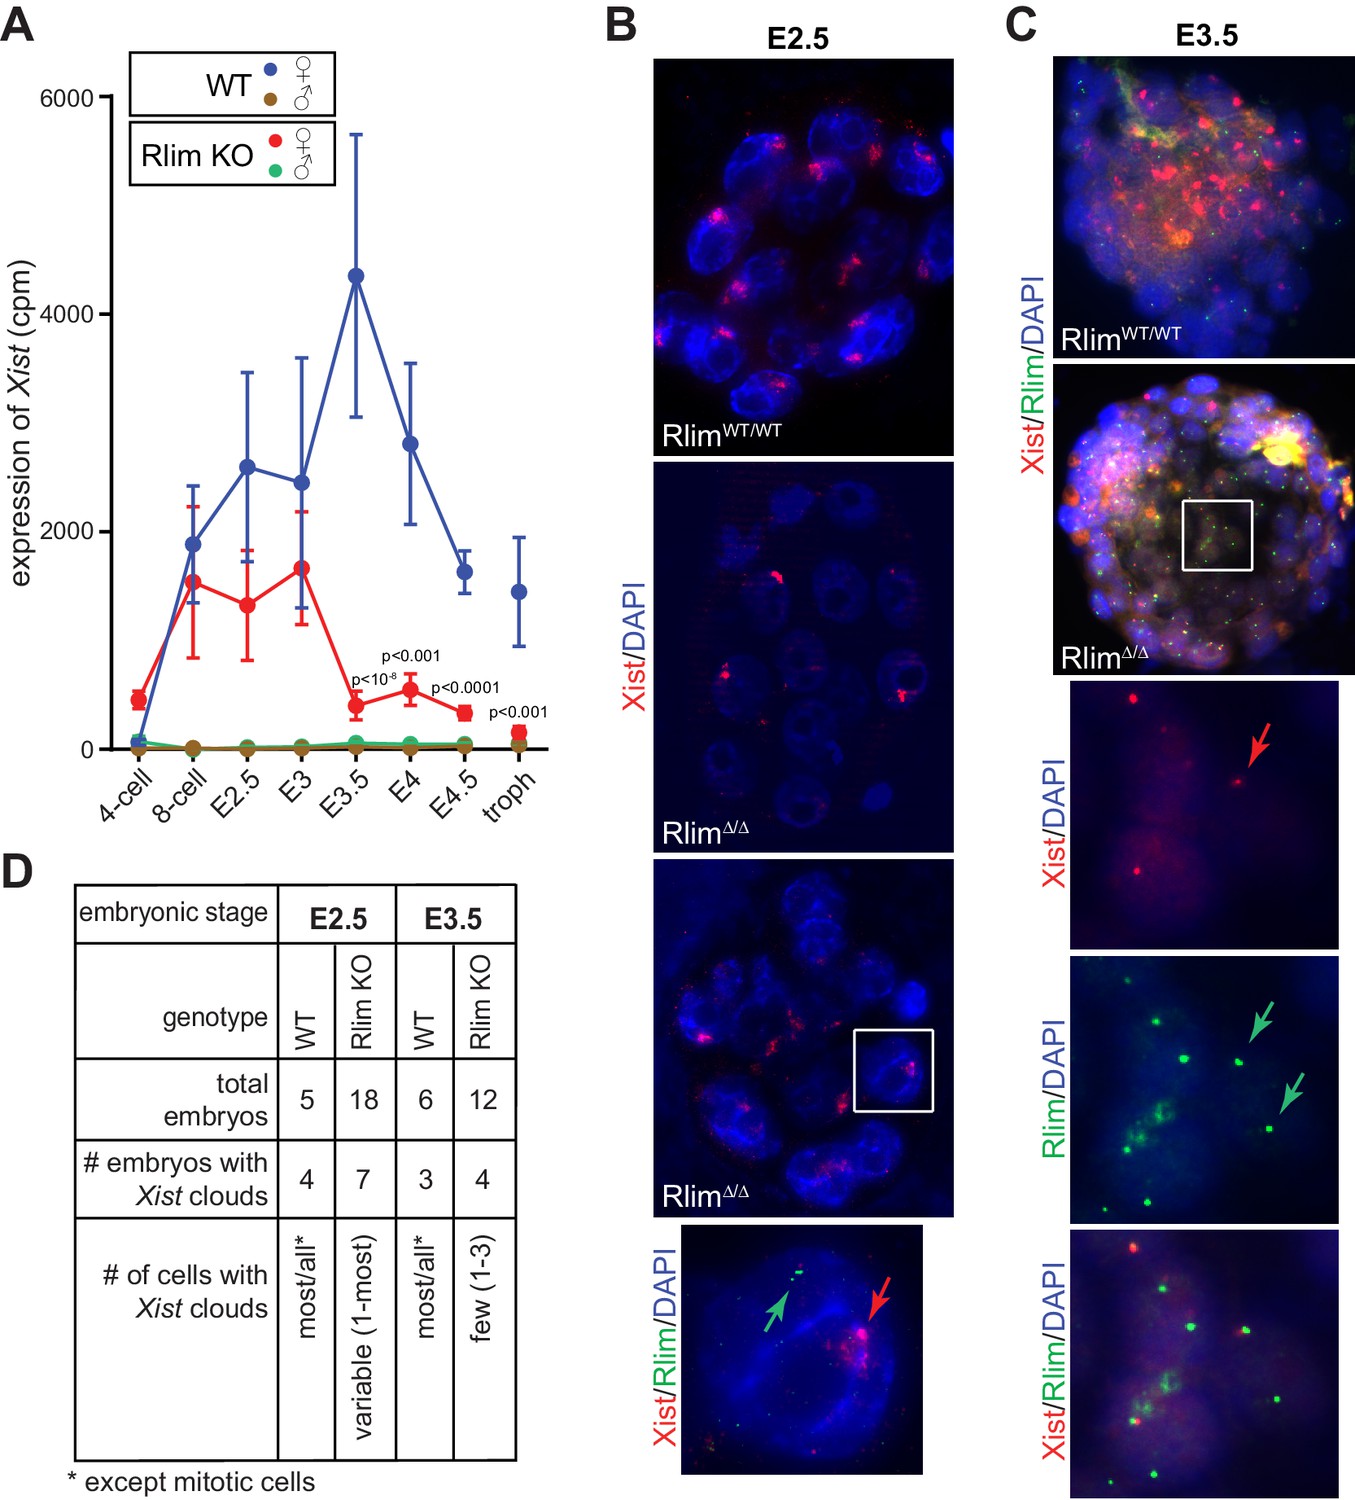
Rlim is required for the maintenance of Xist expression and Xist clouds at blastocyst stages.
(A) Expression profiles from the Xist locus in preimplantation embryos WT and KO for Rlim. Error bars indicate standard error of the mean (SEM). Significant differences of Xist levels in WT and KO females P<0.01 are indicated (Student’s t-test). (B) WT and RlimKO embryos at E2.5 were co-stained with probes recognizing Xist (red) and Rlim (green) via RNA FISH. Two representative RlimΔ/Δ embryos are shown. The boxed area is magnified in the panel below. Arrows point at Xist cloud and Rlim transcription focus. (C) RNA FISH on WT and RlimKO embryos at E3.5. The boxed area is magnified in the panels below. Arrows point at Xist and Rlim transcription foci. (D) Tabular summary of Xist clouds detected in B and C.
Figure 2—figure supplement 1

Rlim regulates Xist levels and Xist clouds at blastocyst stages.
(A) Modified from the UCSC Genome Browser: Cumulative mapped raw reads of pooled E4.5 female embryos WT/WT (blue) or Δ/Δ (red) for Rlim on the Tsix/Xist gene locus (variable scales). Structure of the Tsix and Xist genes is shown below in blue. Exons are boxed. Arrows indicate direction of transcription. Two alternatively spliced forms of Xist are shown. Note that >90% of reads in the locus map within the Xist transcription unit. (B) Random downsizing each library to 200.000 reads does not significantly change/affect Xist expression profiles. Representative results (n = 3) obtained from the WT/RlimKO dataset with each library randomly adjusted to 200k reads. (C) RT-qPCR analysis of Xist expression in RlimWT/WT and RlimΔ/Δ at E2.5, E3.5 and E4.5. Data represent values obtained from three embryos for each stage and genotype. Gender of each embryo was determined via Zfy. Xist values were normalized against actin and are shown relative to WT/WT control. Error bars indicate SEM.
Figure 3 with 2 supplements
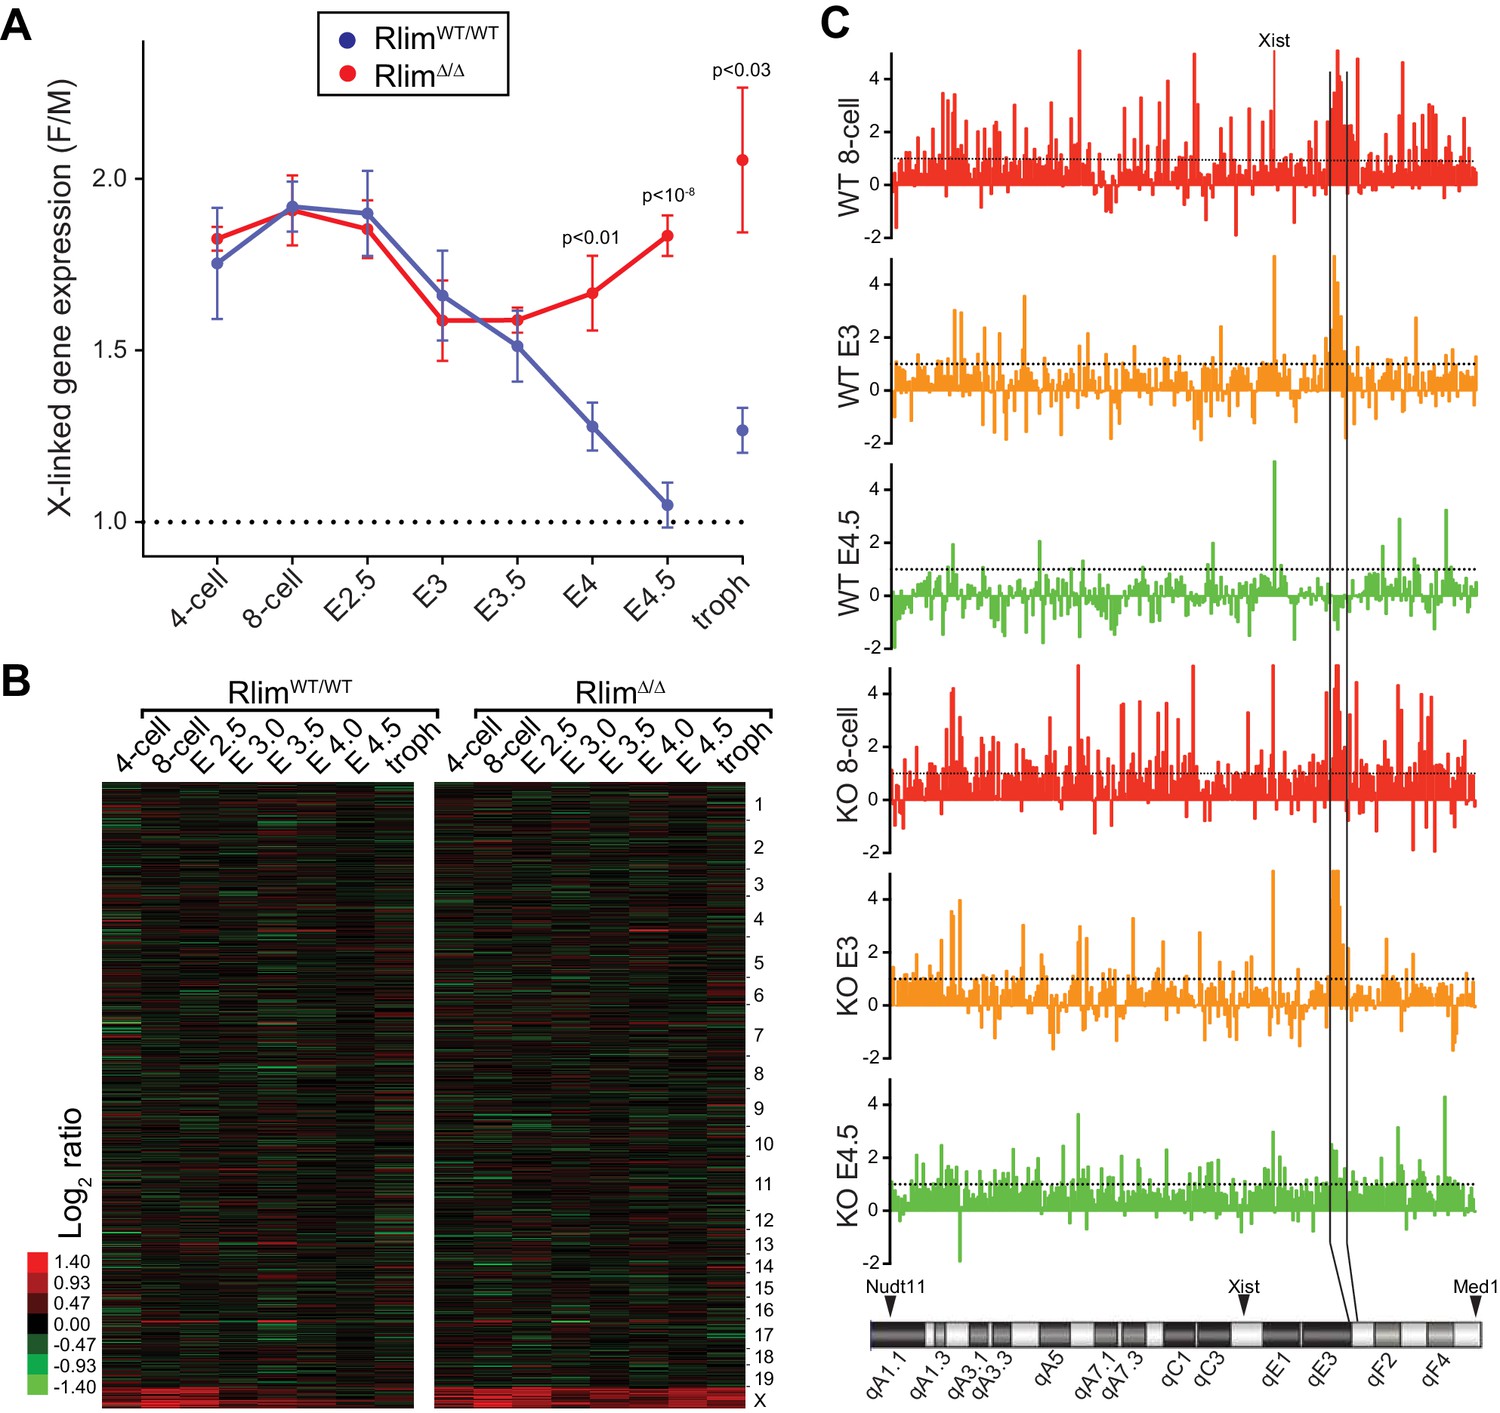
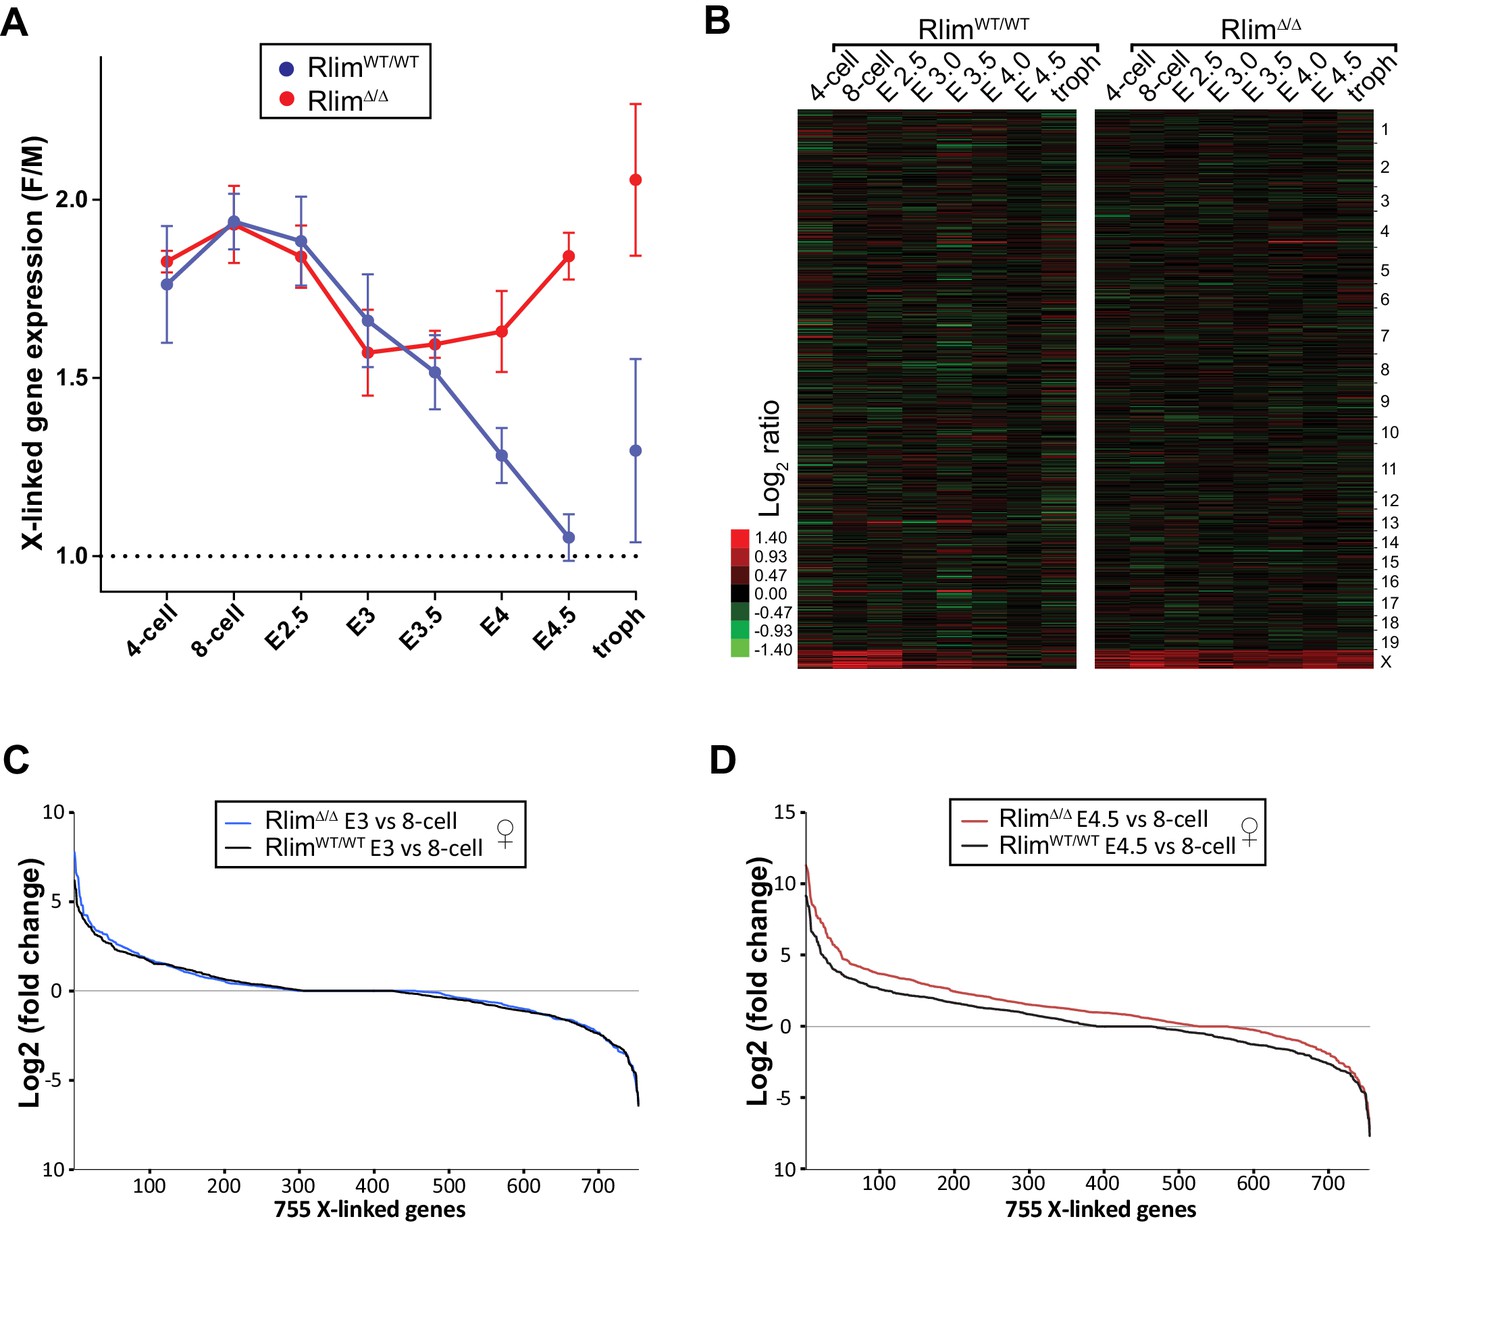
Rlim is required for X-silencing in females during blastocyst stages.
Female expression data collected from RlimWT/WTor RlimΔ/Δ were compared with those of male (pooled KO and WT) embryos (F/M). Embryonic stages are indicated, troph = trophoblasts. (A) Developmental profile of X-silencing during iXCI in vivo as determined by comparing mean female/male (F/M) expression ratios of X-linked transcripts (minus Xist; in Fragments per kilobase of exon per million reads mapped (FPKM)). Error bars indicate SEM. Significant p values p<0.01 are indicated (Student’s t-test). (B) Heat map representing Log2 transformed data comparing global F/M mRNA expression level ratios from chromosomes (excluding the Y) of WT and KO embryos. Chromosomes corresponding to gene expression are indicated. (C) Gene silencing during iXCI occurs within most regions on the X chromosome. Log2 F/M ratios of 351 X-linked genes at the 8-cell stage, E3 and E4.5 in WT and RlimKO are shown (values within 4.5 and -2). Horizontal dotted lines indicate Log2 values of 1. The mouse X chromosome is shown below. Arrowheads indicate locations of the most centromeric (Nudt11) and most telomeric (Med1) genes included in this analysis. Expression and location of Xist is indicated. Expression of genes within a region indicated by vertical black lines is silenced late at blastocyst stages during iXCI.
Figure 3—figure supplement 1
Rlim is required for X-silencing in female blastocysts.
(A, B) Random downsizing each library to 200.000 reads does not significantly change/affect results obtained by RNA-seq. Representative results (n = 3) obtained from the WT/RlimKO dataset with each library randomly adjusted to 200k reads. F/M profile of X-linked gene expression (A). Heat map F/M of Log2 transformed data (B). Error bars indicate SEM. (C, D) Expression ratio distributions of 755 X-linked genes in WT/WT and RlimΔ/Δ females. 755 X-linked genes with cpms >1 in at least 3 samples of 8-cell, E3.0 and E4.5 stages of WT/WT and RlimΔ/Δ female embryos were selected, normalized to autosomal gene expression prior to calculating the Log2 fold-changes of E3 versus 8-cell (C) and E4.5 versus 8-cell stages (D).
Figure 3—figure supplement 2
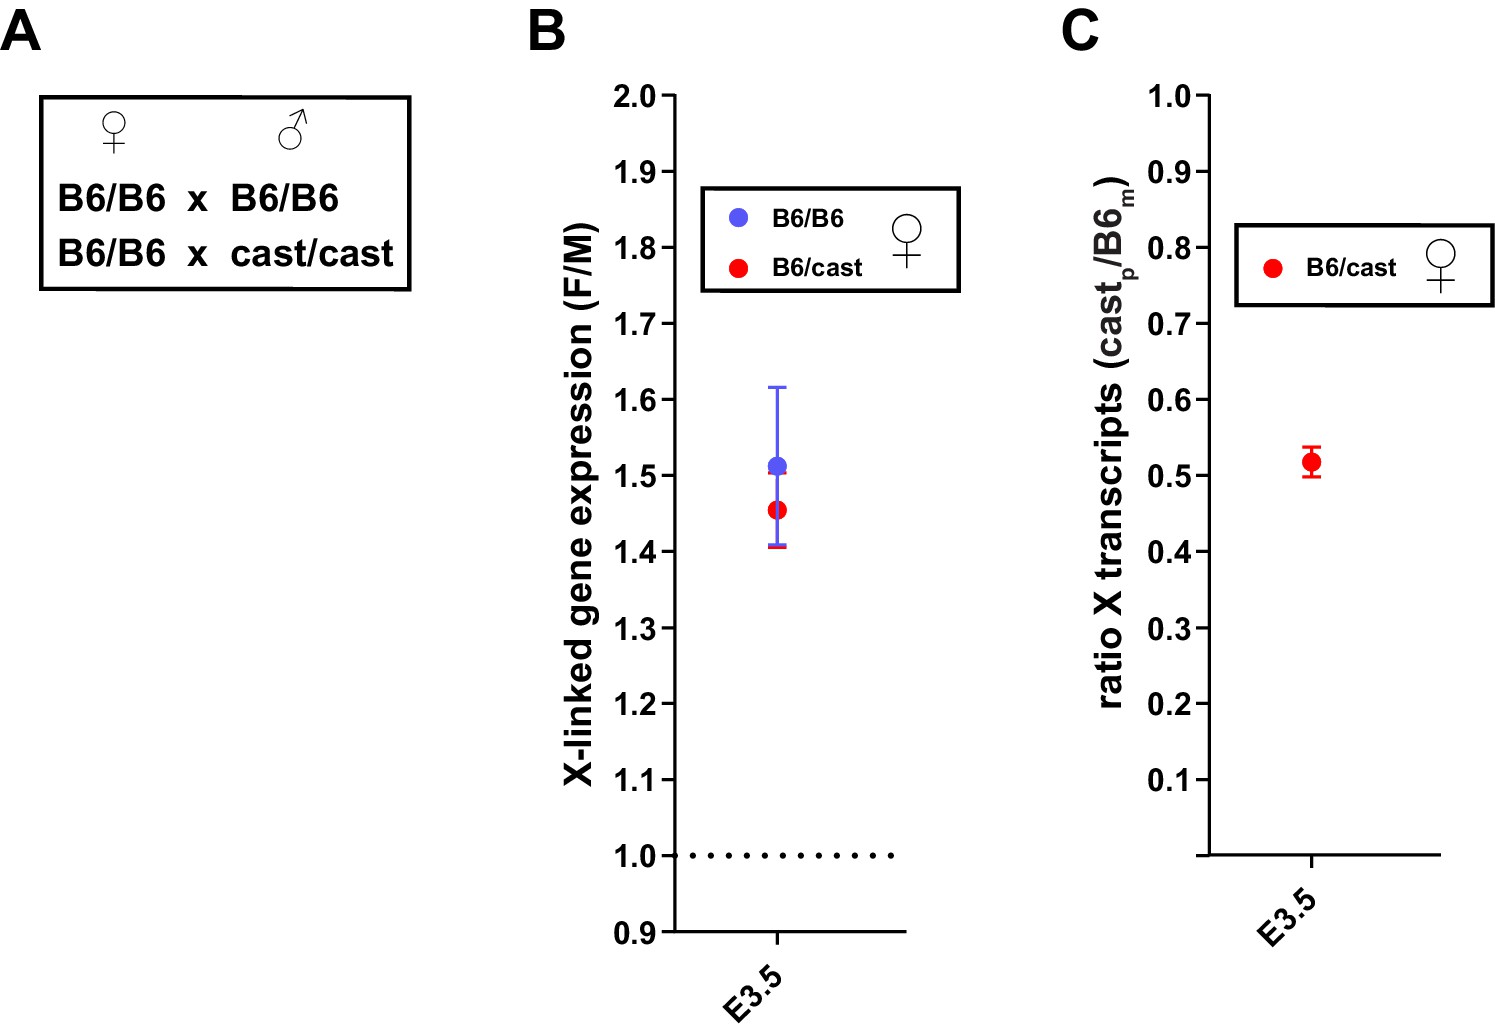
Comparison of X dosage compensation using F/M or allelic approach.
Analyses of whole embryo RNA-seq data of B6/cast heterozygous embryos in B,C were carried out on 3 male and 3 female embryos at E3.5. (A) Parental genotypes, all WT for Rlim, used for generating embryos with B6/B6 congenic genetic background and B6/CAST heterozygous genetic background. (B) Similar F/M values for B6/B6 and B6/CAST at E3.5. B6/B6 values (blue) were taken from Figure 3A. F/M values for B6/cast animals were calculated as those described in Figure 3A. (C) Analysis of allelic expression of X linked transcripts in B6/CAST heterozygous females. Note that in female embryos transcripts originating from Xp are silenced to about 50% when compared to the Xm.
Figure 4

Embryonically expressed RLIM is required for iXCI in female mice.
The cKO of Rlim in female embryos was targeted via a paternally transmitted Rosa26-Cre (R26C) transgene. (A, B) Schematic diagram of born pups generated via indicated mating schemes. Parental genotypes with respect to Rlim and R26C are shown. For each mating, the total number (n) of F1 offspring is indicated. Numbers of female and male pups and their genotypes with respect to Rlim are indicated. The Rlim cKOm allele in pups is indicated in red. Percentages of cKOm to fl distribution in female or male pups are shown below. Note no female offspring with an R26C-induced cKO of the maternal Rlim allele. (C) Robust deletion in E3.5 embryos via a paternally transmitted R26C transgene. Parental genotypes and genotypes of embryonal littermates are indicated. A slightly slower migrating band in PCRs using primers that for the Y-linked gene Zfy is unspecific. Note that the maternally transmitted floxed allele is no longer detectable in Cre-positive embryos. Positive control (P); negative control (N). The last two bands in Zfy (P; N) originate from the same gel but have been inverted to reflect the general loading pattern. (D, E) Inhibition of Xist clouds and X-silencing in trophoblasts of E4 female blastocyst outgrowths with an R26-Cre induced deletion of maternally transmitted Rlim. RNA-FISH experiments on representative R26C-Rlim cKOm female embryos using Xist (green) and Rlim (red) probes. Note lack of Xist clouds in cKO/Δ trophoblasts (D) accompanied by X-silencing defects in most trophoblast cells as indicated by side-by-side Rlim and Xist transcription foci (E). Inner cell mass, ICM; trophoblasts, troph.
Figure 5 with 1 supplement

Xist is crucial for X dosage compensation throughout preimplantation development.
All embryos were generated by crossing WT/WT females with XistΔ/Y males. (A) Gender determination of embryos via Y-linked gene expression. As example, the distributions of reads at the 8-cell stage of Y-linked genes are shown in a box-plot. (B) Heat map representing Log2 transformed data comparing the mRNA expression level ratios from chromosomes (excluding Y) between female and male embryos during pre/peri-implantation development. Chromosomes are indicated. (C) Developmental profile of X-silencing during iXCI in XistWT/Δp females as determined by comparing F/M expression of X-linked transcripts. Data were processed as described for those obtained for the WT/RlimKO dataset which were incorporated for comparison as dotted lines (see Figure 3A). (D) Comparison of F/M values for XistWT/Δp and RlimΔ/Δ with those obtained for WT/WT (set to 1). P values of P<0.05 are indicated (paired t-test).
Figure 5—figure supplement 1
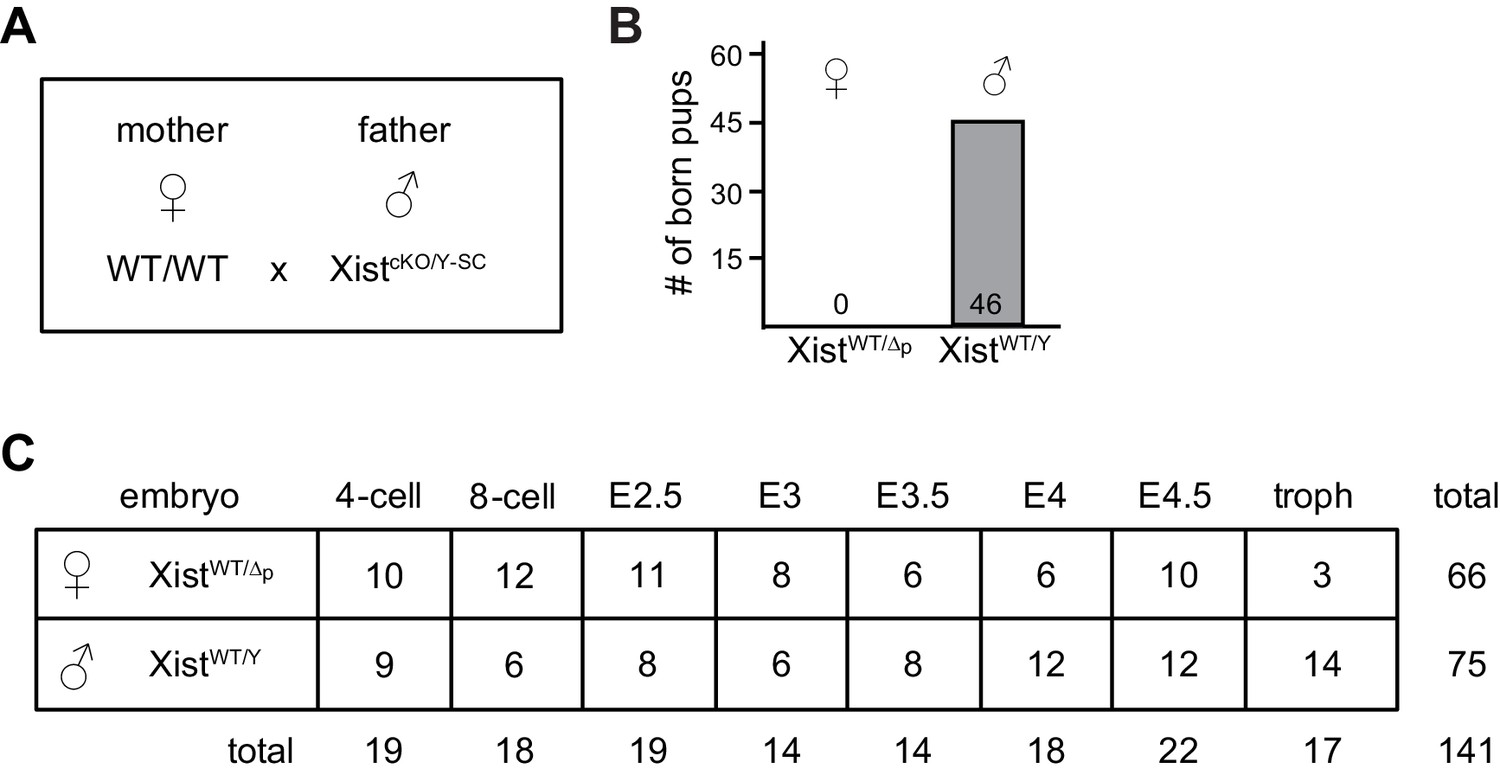
Details of RNA-seq analyses of single embryos lacking Xist at pre/peri-implantation stages.
(A) Parental genotypes used for generating female embryos carrying a paternal germline KO of Xist. (B) Embryonic lethality of female XistWT/Δp embryos. Shown are genotypes of born pups from a total of 13 litters. (C) Genotypes, embryonic stages, and sample numbers of embryos used for whole embryo RNA-seq.
Figure 6 with 1 supplement
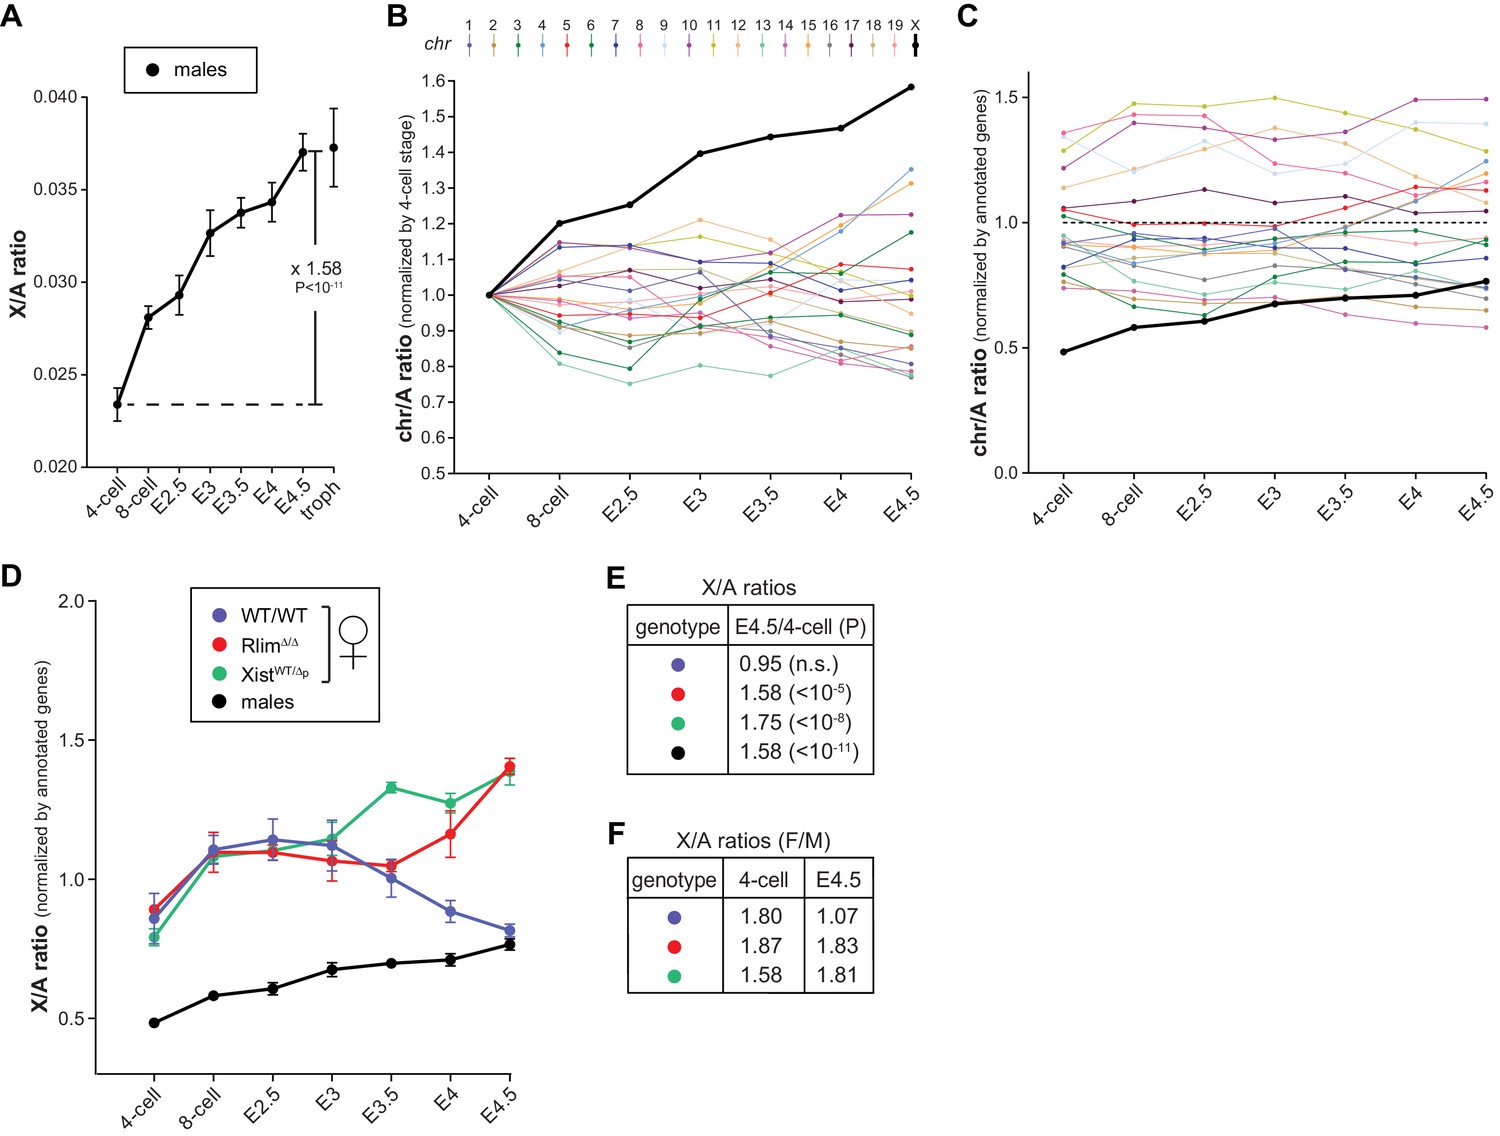
Dynamics of X-linked gene expression in preimplantation embryos.
(A) X/A expression profile in males. Male data were collected from males of RlimKO/WT and XistKO datasets. For each embryo, the total FPKM expression of X-linked genes was divided by the total FPKM expression of autosomal genes. Shown is the average X/A values for each developmental stage. The increase of 1.58-fold in X/A values from the 4-cell stage to E4.5 is highly significant (P<10–11; Student’s t-test). (B) Comparison of gene expression profiles from chromosomes 1 to 19 and X during male pre/peri-implantation development. Data were collected from male embryos of both datasets. At each developmental stage the total FPKM expressed from each chromosome was divided by the total FPKM expression of all autosomal genes. Values obtained for each chromosome at the 4-cell stage are set to 1. (C) Dynamics of the relative gene expression expressed from single chromosomes in male embryos. The total FPKM/total number of annotated genes of each chromosome was divided by the total FPKM of all autosomal genes/total number of autosomal genes. Male data were collected from all males of both datasets. Note that expression from the X is markedly lower at early stages (around x0.5), increasing to x0.77 to that of the average autosome (1.0; dotted line) by E4.5. (D) Female and male X/A expression profiles normalized to annotated genes. The total FPKM/total number of annotated genes on the X was divided by the total FPKM of all autosomal genes/total number of annotated autosomal genes. Female genotypes are indicated. (E) The E4.5/4-cell stage ratios of X/A values are shown for WT/WT, XistWT/Δ and RlimΔ/Δ females as well as males. P values (Student’s t-test) are indicated; n.s. = not significant. (F) Comparison of X/A values according to gender: F/M ratios of X/A values at the 4-cell and E4.5 stages are shown for WT/WT, XistWT/Δ and RlimΔ/Δ. Error bars indicate SEM.
Figure 6—figure supplement 1
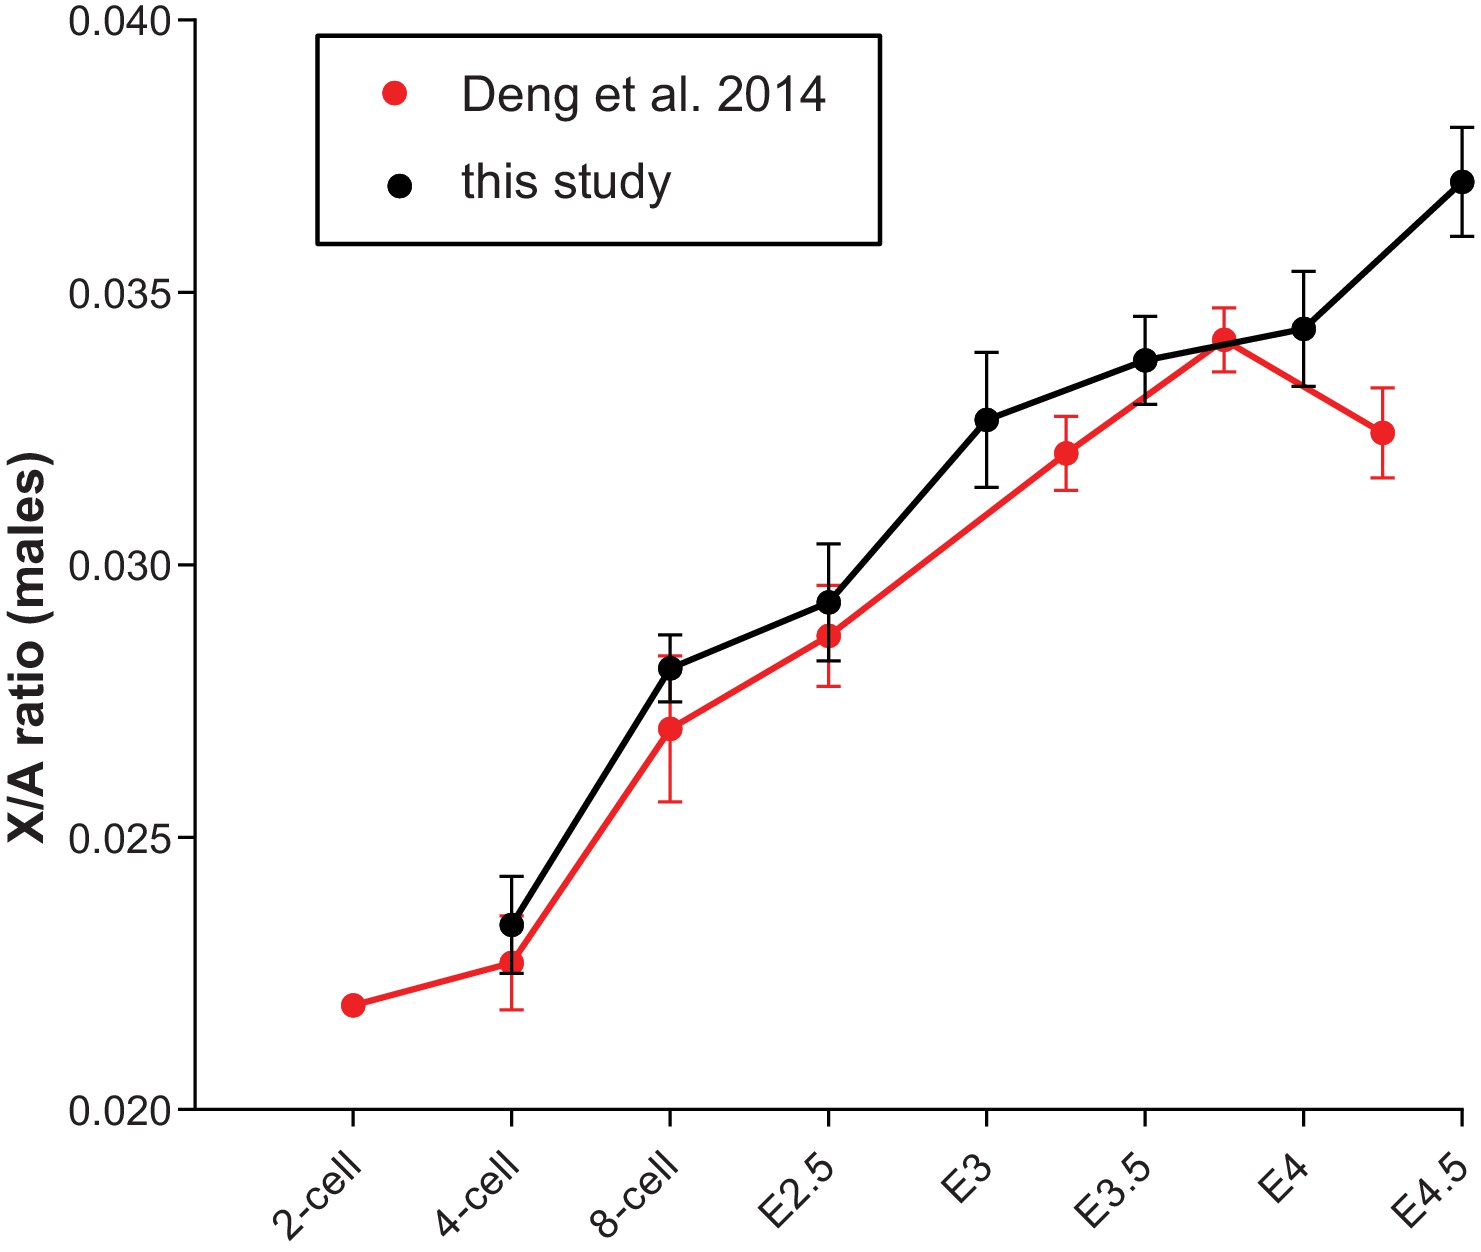
X/A profile in male mouse embryos comparing data obtained by single embryo RNA-seq (see Figure 6A) with data obtained by single-cell RNA-seq (Deng et al., 2014).
Total FPKM of X-linked genes were divided by total autosomal FPKM. For the Deng et al. dataset, to ensure male gender only cells with high total Y-linked gene expression >5 FPKM (late 2-cell and 4-cell stages) and >50 (8-cell to E4.5) were considered. Early, mid and late blastocyst stages (Deng et al., 2014) were incorporated at E3.25, E3.75 and E4.25, respectively. Note the similar upregulation of X-linked genes in both datasets.
Additional files
-
Supplementary file 1
RlimKO/WT dataset: List of FPKM for all embryos at all stages (4-cell, 8-cell, E2.5, E3, E3.5, E4, E4.5 and troph).
- https://doi.org/10.7554/eLife.19127.014
-
Supplementary file 2
XistKO dataset: List of FPKM for all embryos at all stages (4-cell, 8-cell, E2.5, E3, E3.5, E4, E4.5 and troph).
- https://doi.org/10.7554/eLife.19127.015
Download links
A two-part list of links to download the article, or parts of the article, in various formats.
Downloads (link to download the article as PDF)
Open citations (links to open the citations from this article in various online reference manager services)
Cite this article (links to download the citations from this article in formats compatible with various reference manager tools)
Regulation of X-linked gene expression during early mouse development by Rlim
eLife 5:e19127.
https://doi.org/10.7554/eLife.19127


