Profound regulation of Na/K pump activity by transient elevations of cytoplasmic calcium in murine cardiac myocytes
- University of Texas Southwestern Medical Center at Dallas, United States
Figures
Figure 1
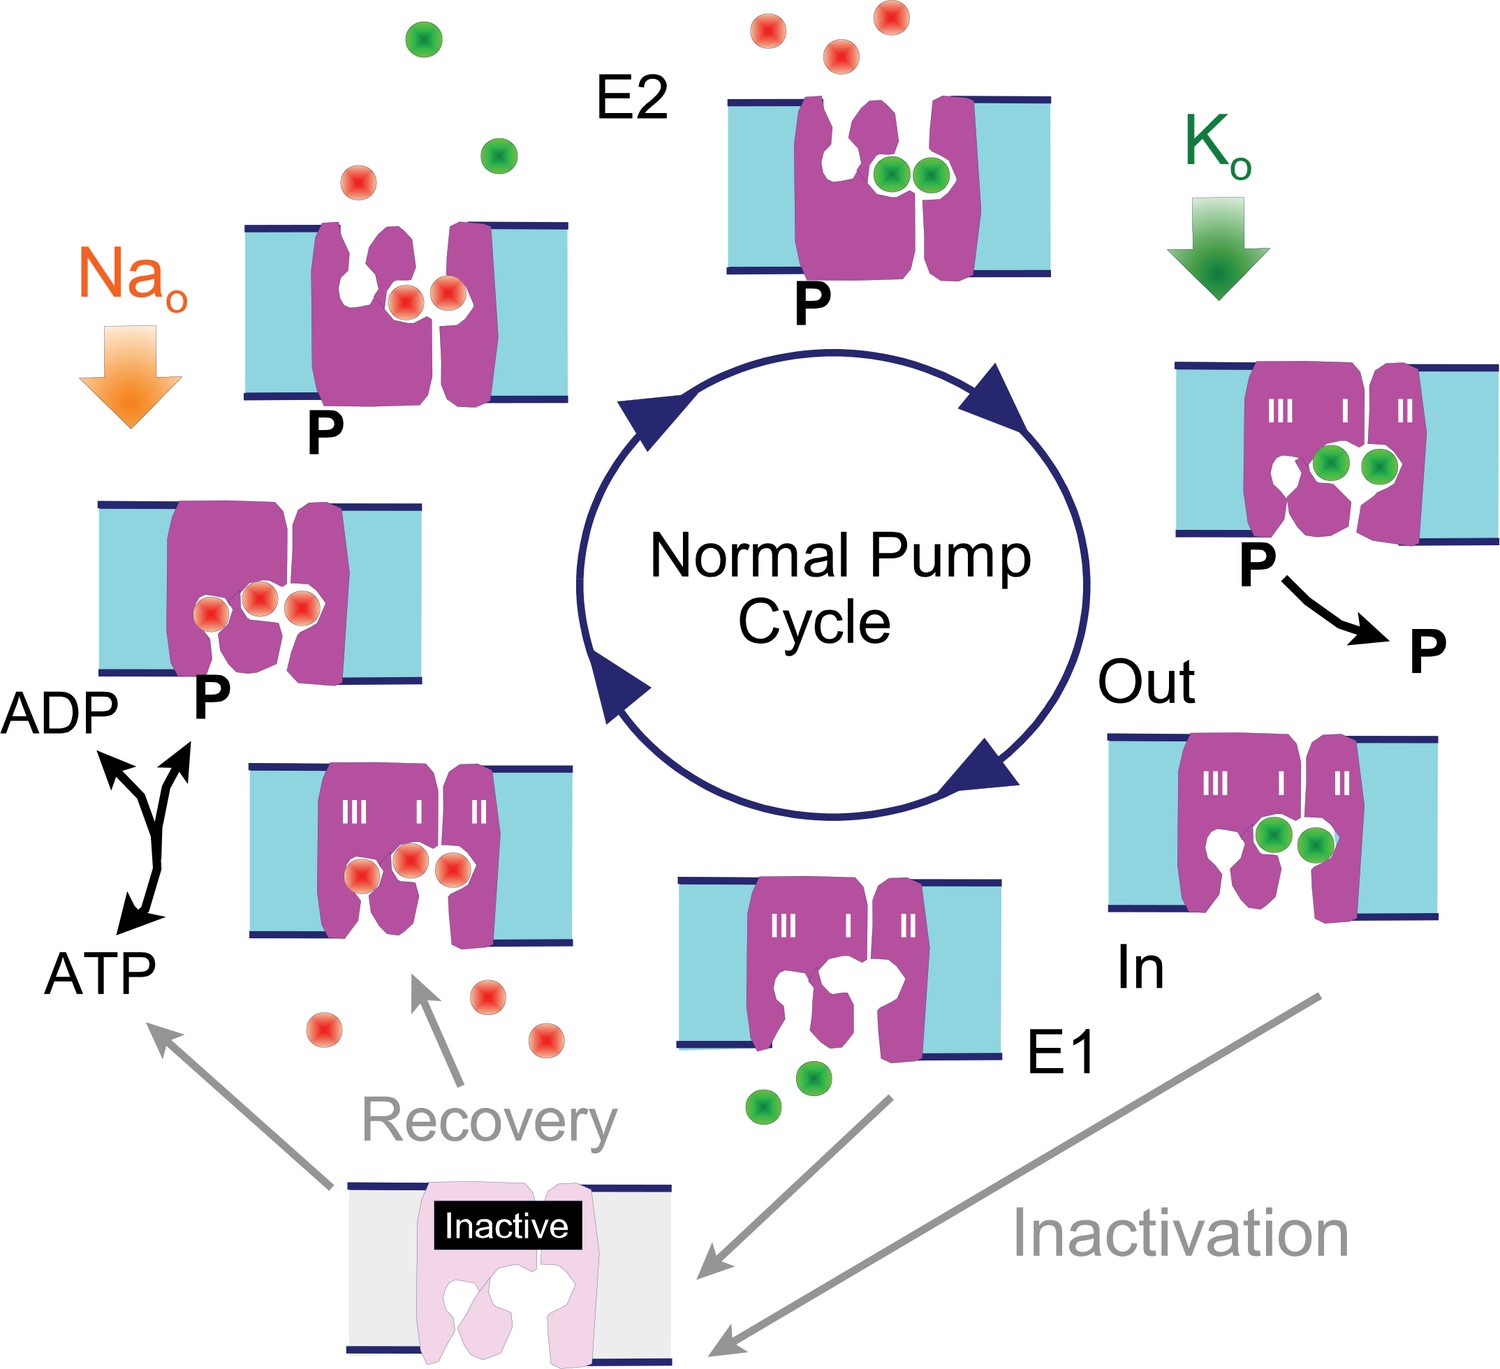
Reaction scheme of the Na/K pump with inactivation from E1 states.
E1 states are open to the cytoplasmic side and can bind 3 Na ions, Site III being a Na-selective site. Upon phosphorylation the Na ions are occluded and released to the outside in E2 states, followed by binding and occlusion of 2 K ions. Upon dephosphorylation pumps open to the cytoplasmic side in the E1 configuration and release K ions. Hypothetically, Na/K pump current decay occurs as an inactivation reaction taking place preferentially (but probably not exclusively) from 'E1' states in which the Na-selective ion binding site is not occupied by Na. Inactivation might occur with a lower probability from other states, including E2 states. Recovery from inactivation may be promoted by Na binding to inactive exchangers.
Figure 2
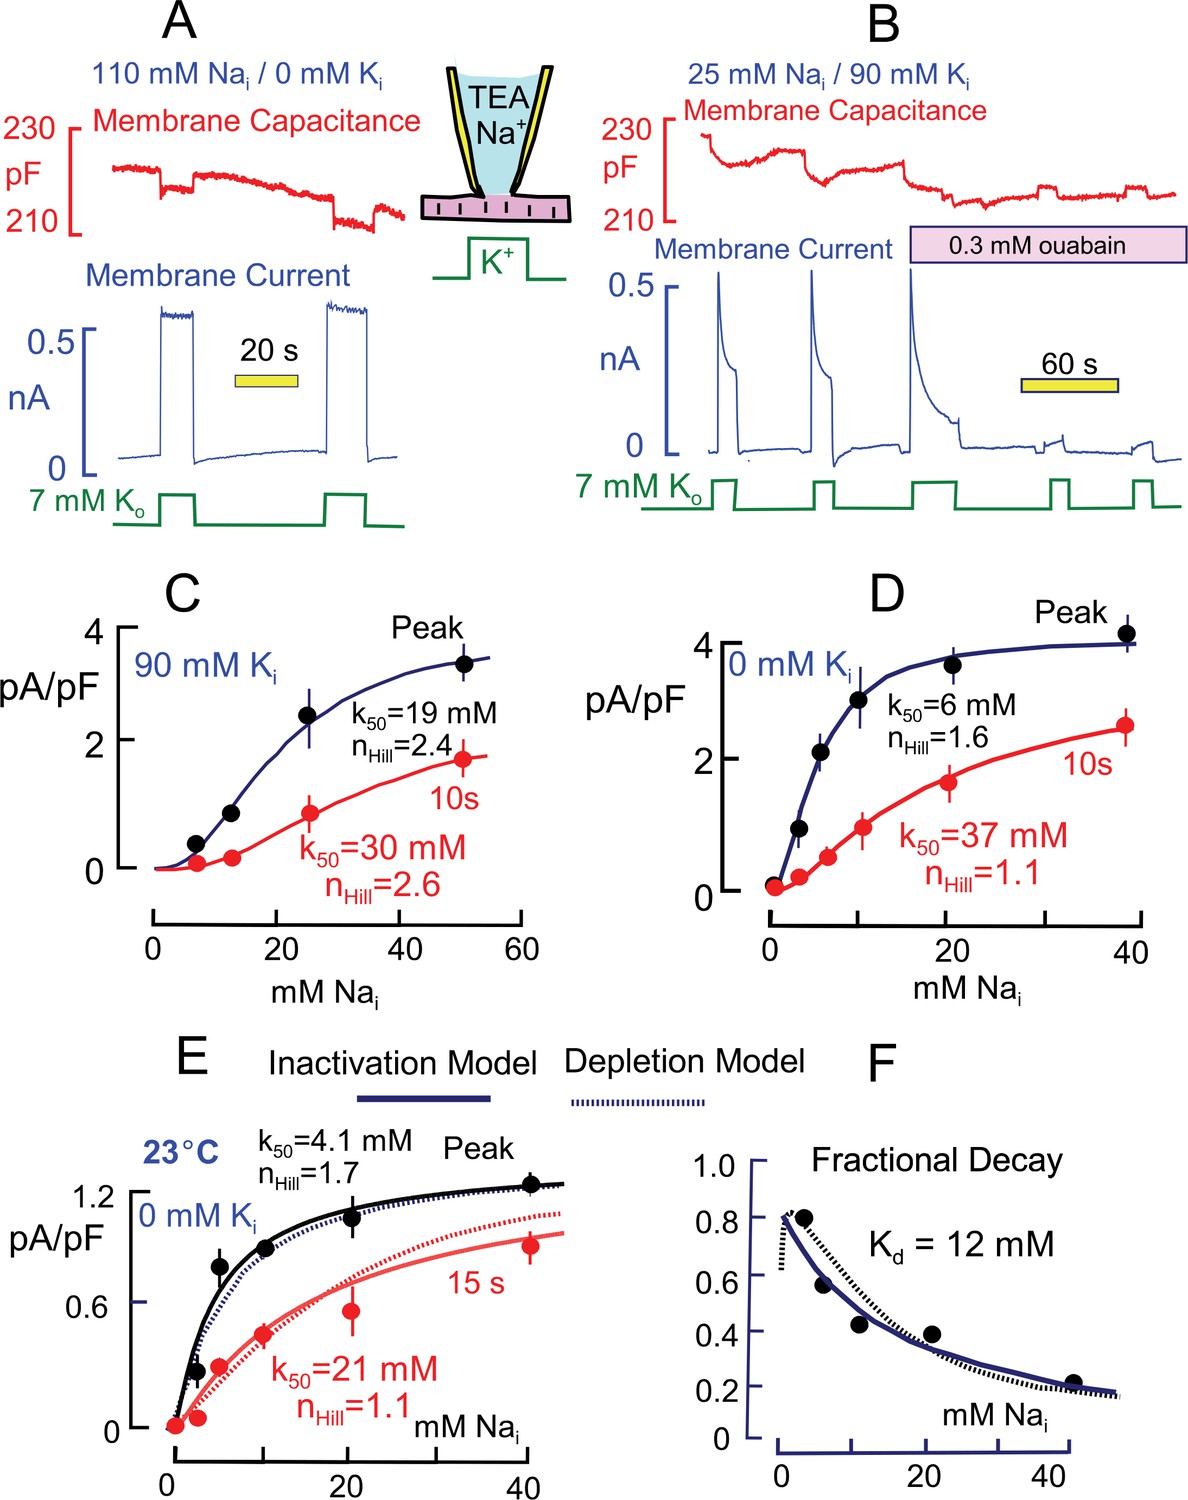
Basic properties of Na/K pump currents in murine cardiac myocytes.
Solutions contain 20 mM TEA on both sides to minimize K currents, 4 mM Mg on the outside to promote seal formation without Ca, and NMG as the major extracellular cation. Pump currents are initiated by replacing 7 mM Na for 7 mM K on the extracellular side. (A) Outward Na/K pump currents in the presence of 110 mM cytoplasmic Na and no cytoplasmic K are large (>6 pA/pF) and stable. Capacitance decreases and increases by ~1% within solution switch times when K is applied and removed, respectively. (B) Outward Na/K pump currents in the presence of 25 mM cytoplasmic Na and 90 mM cytoplasmic K decay over several seconds by more than 50%. Membrane capacitance decreases immediately during K application, as just described, and can then continued to decrease slowly but to a lesser extent during current decay; capacitance recovers slowly over 20 s after removing extracellular K. Typical for rodent Na/K pumps, currents are quite resistant to heart glycosides but can be rapidly and effectively blocked by a high concentration of ouabain (0.3 mM). (C and D) Cytoplsmic Na dependence of peak and steady state (10 s) pump currents at 37°C with and without 90 mM cytoplasmic K. (C) In the presence of 90 mM K, the K50 for peak current is 19 mM Na and the Hill coefficient is 2.4, while the 10 s current shows a K50 of 30 mM and Hill slope of 2.6. (D) In the absence of cytoplasmic K, peak currents are best described by a Hill equation with a K50 of 6 mM cytoplasmic Na and a Hill slope of 1.6. The 10 s current is shifted to a K50 of 37 mM with a Hill slope of 1.1 Although currents are smaller in the presence of cytoplasmic K, the fractional decay of current is greater at all Na concentrations. (E) Cytoplasmic Na dependence of peak and quasi steady state (15 s) pump currents at 23°C without cytoplasmic K. Data points are the average of values from at least 5 separate myocytes. (F) The Na dependence of the fractional decay of pump current (1–15 s/peak) is well described by the occupancy of a single Na binding site with an apparent Kd of 12 mM. The solid and dotted lines in panels E and F are predictions for overtly simplified Na depletion and inactivation models, described in Materials and methods.
Figure 3
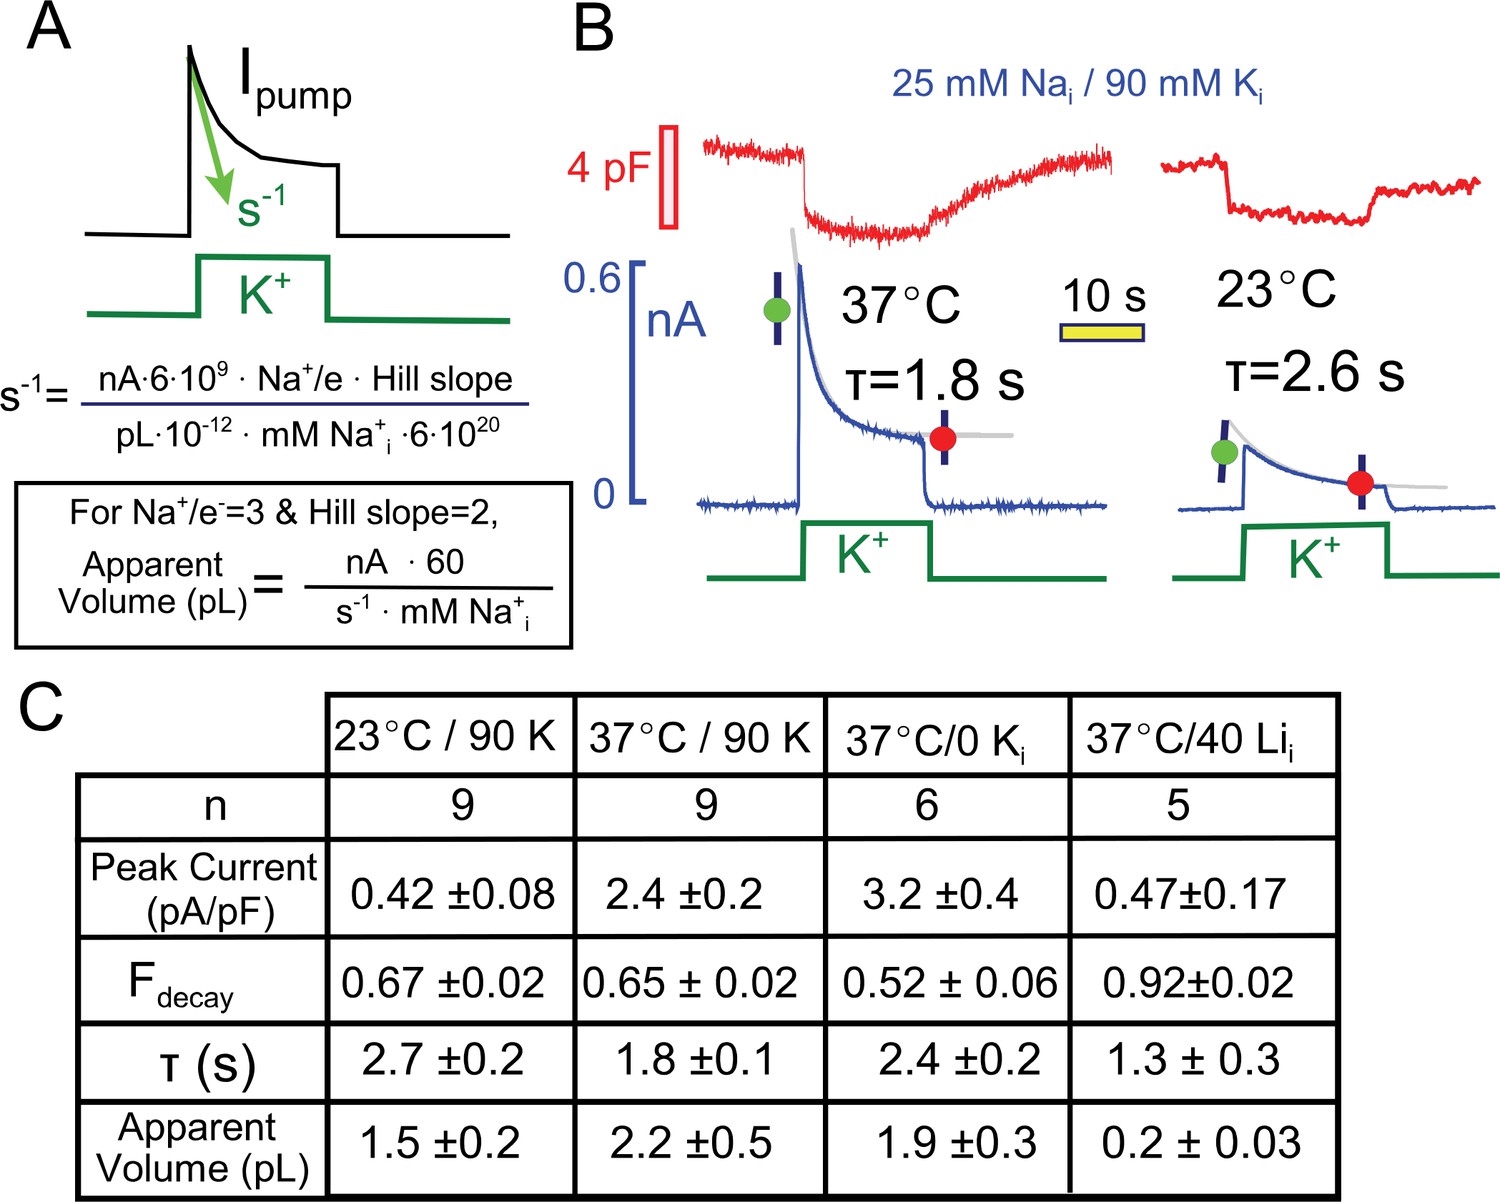
Quantitative analysis of pump current decay in relation to predictions for cytoplasmic Na depletion.
(A) The initial rate of decline of current should be predictable from the current magnitude, the number of Na moved per charge moved (Na/e = 3), the slope of the Na-current relation ('Hill slope', ~2), the cytoplasmic volume in which Na mixes, and the cytoplasmic Na concentration. Alternatively, the apparent cell volume can be calculated from the other equation parameters. (B) Pump currents at 37 and 23°C with 25 mM Na and 90 mM cytoplasmic K with current decay fitted to single exponential functions. (C) Composite results from experiments with 25 mM cytoplasmic Na at 37°C and 23°C with 90 mM K Na, at 37°C without K, and at 37°C with 40 mM Li and no K. Pump currents are four-fold smaller at 23°C, but the fractional decay is similar; currents are increased by removal of K, but fractional current decay is decreased; and currents are small with a high Li concentrations, while fractional current decay is increased. All results are inconsistent simple depletion models.
Figure 4
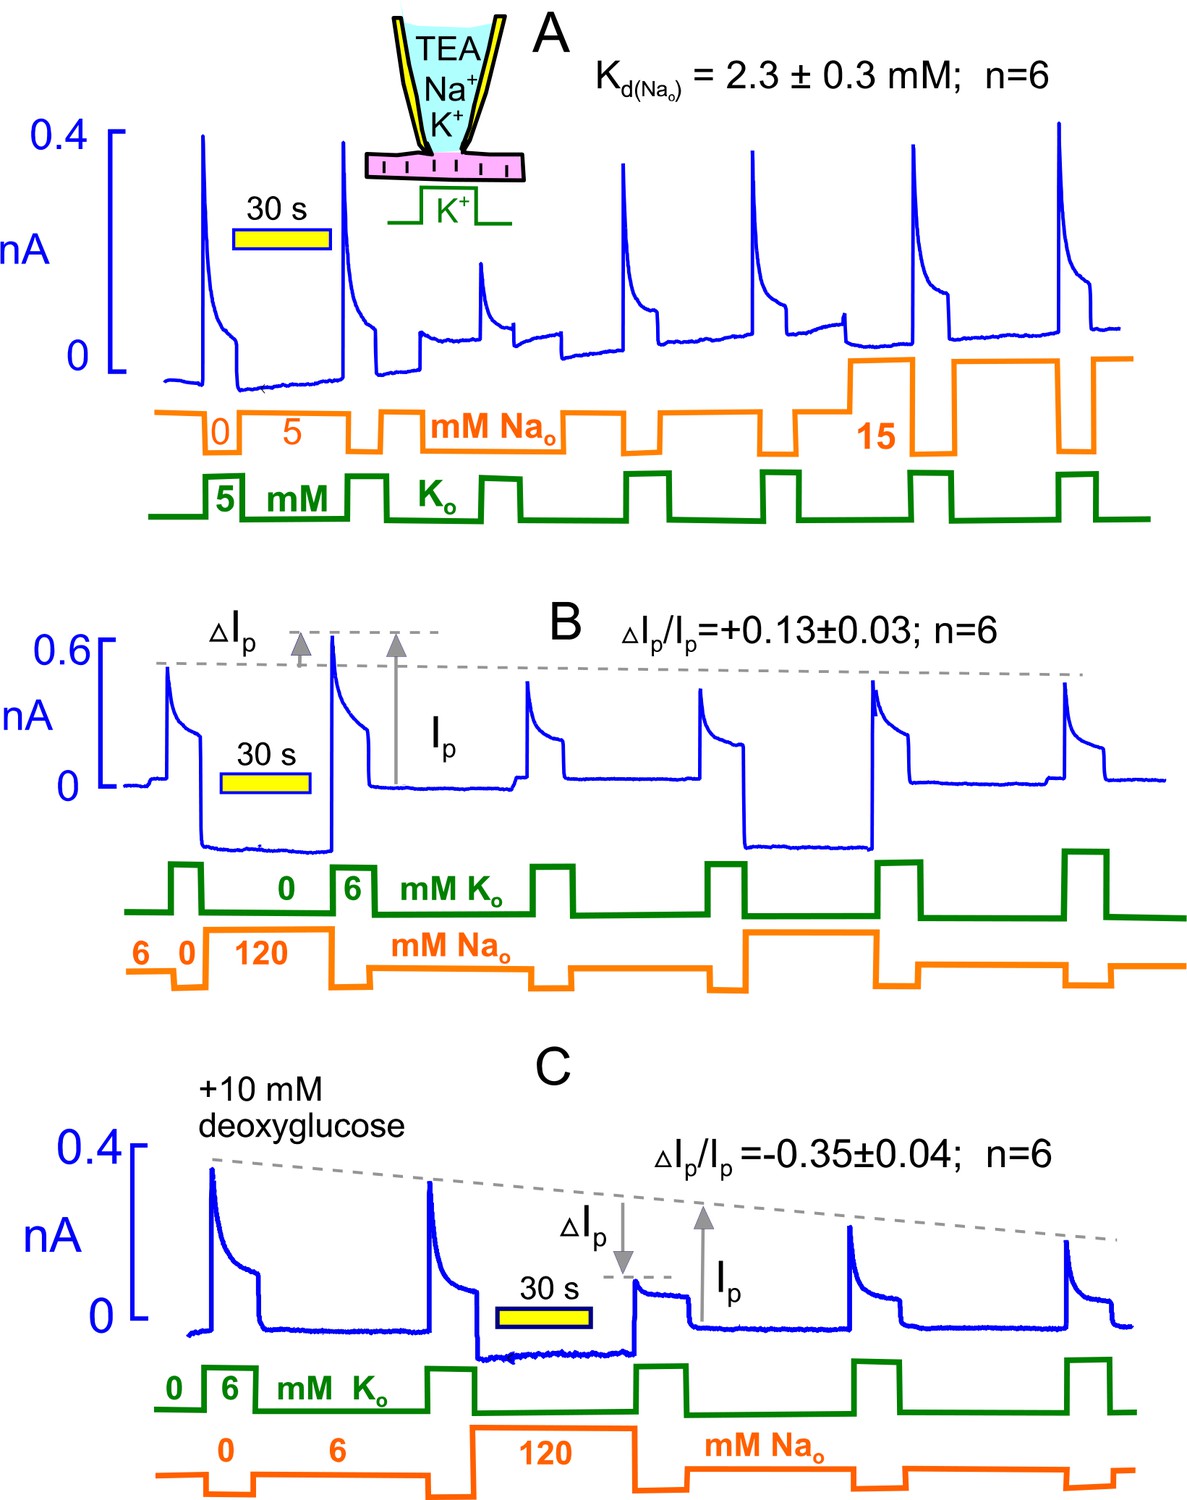
Extracellular Na rescues Na/K pumps from steady state inactivation but promotes inactivation when reverse transport reactions are enabled by ADP.
(A) Employing standard solutions, pump currents were initially activated twice by replacing 5 mM Na with 5 mM K. Removal of Na without application of K activates a small current, and the pump current activated subsequently with 5 mM K is less than one-half of the control pump current. Thus, pumps inactivate in nominally Na free solution, presumably because pump activity supported by contaminating K is adequate to allow inactivation. Pump currents recover in the presence of 5 mM Na, and the application of 15 mM has very little further rescue effect. From 6 experiments, employing 5, 15 and 120 mM Na, the half-maximal Na concentration required to rescue pump currents was 2.3 mM. (B) Under standard conditions, 120 mM Na was applied, instead of NMG, for 30 s before applying K in the absence of Na. Peak pump currents were increased by 13% on average, compared to currents activated after incubation with 7 mM Na. (B) Na/K pump inactivation is promoted by conditions that allow backward pump reactions from E2 to E1 states. With 10 mM deoxyglucose in the pipette solution, to promote ATP hydrolysis and generation of ADP by hexokinsaes, pump currents ran down slowly over several minutes. After application of 120 mM Na for 30 s, peak pump currents activated by K were decreased to nearly their 15 s value, as expected if inactivation had occurred in the presence of extracellular Na. This result verifies a key prediction of the inactivation model presented in Figure 1.
Figure 5
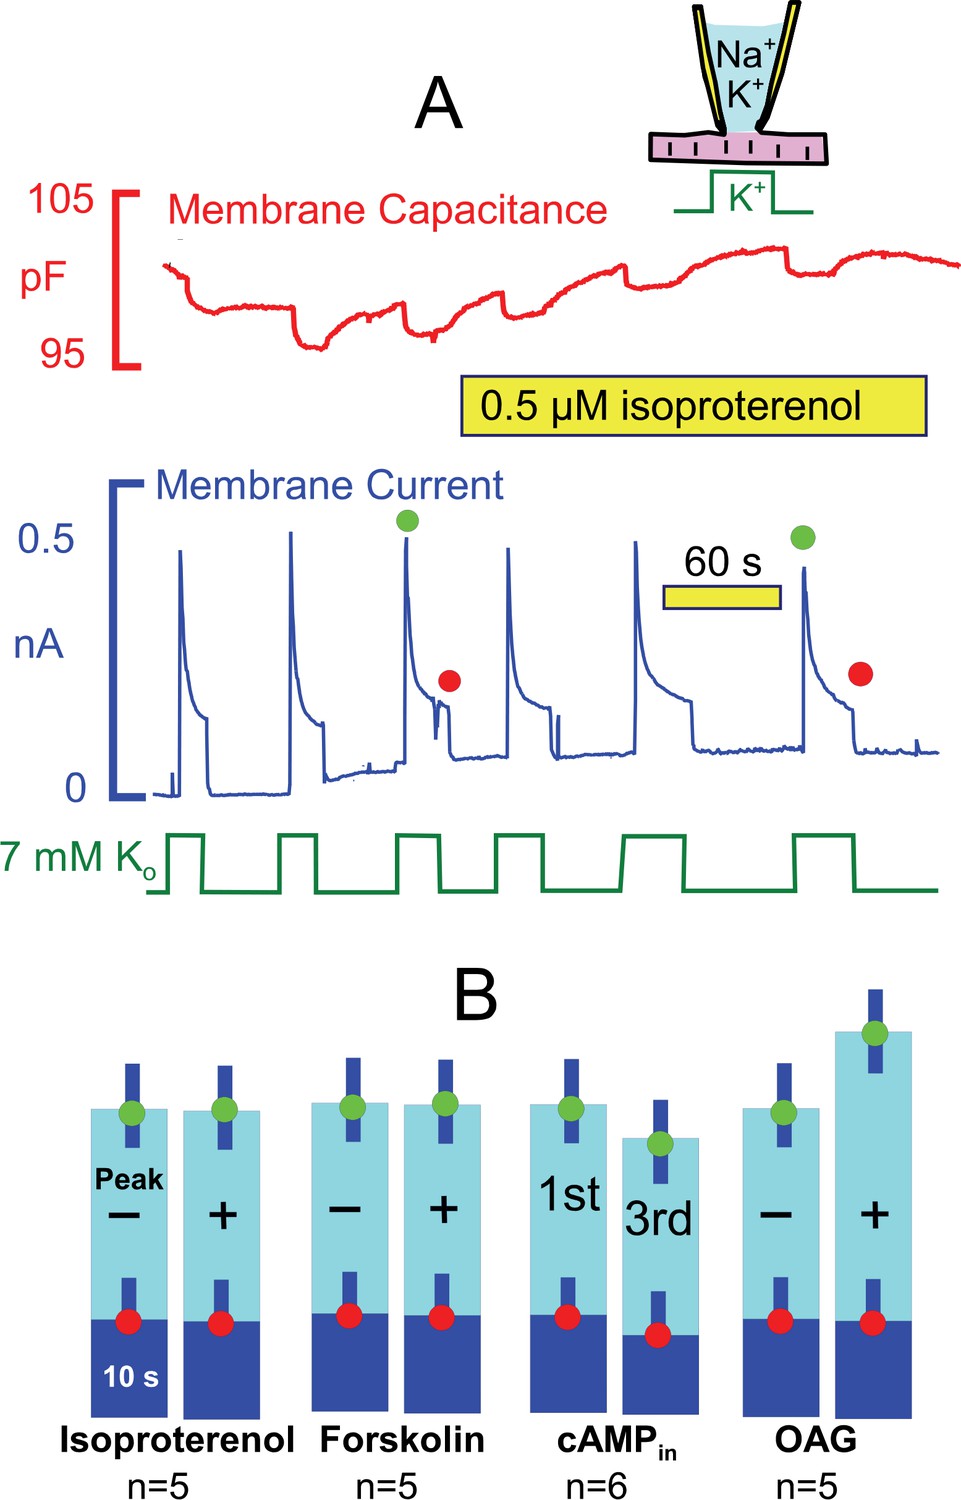
Stimulation of Na/K pump currents by activating protein kinase A (PKA) and protein kinase C (PKC) is weak or absent.
(A) Under standard conditions, Na/K pump currents were activated repeatedly by applying extracellular K, and then isoproterenol (0.5 μM) was applied by moving the myocyte to separate solution lines containing the drug. (B) From left to right, composite results are presented for equivalent experiments in which isoproterenol (0.5 μM) or forskolin (20 μM) was applied to activate PKAs, in which 2 mM cAMP was included in pipette solutions, and in which 1-oleoyl-2-acetyl-sn-glycerol (OAG, 5 μM) was applied to activate PKCs. Only OAG has a significant effect to weakly increase the peak Na/K pump currents.
Figure 6

Transient Ca elevations robustly activate Na/K pump currents when cytoplasmic Na is submaximal but do not enhance maximal pump currents (A versus B).
Na/K pump currents were activated repeatedly under standard conditions with 25 mM Nai (A) and with 40 mM Nai (B) for 15 s. Between two activation sequences, reverse Na/Ca exchange current was activated for 3 s by application of Ca (5 mM). After a few vigorous contractions, myocytes relaxed completely and then remained relaxed, while membrane capacitance typically increased by 2 to 5% over 30 s. With 25 mM Nai (A), peak pump currents often increased by two-fold with an average of 54%, current decay during application of K was largely attenuated, and pump current at 10 s was increased three-fold on average. Thereafter, pump currents decreased nearly to baseline values with a time constant of ~150 s. With 40 mM Nai(B), pump currents decayed rapidly by 19% on average, and this decay was fully attenuated after the Ca elevation. Peak currents were decreased by 18% on average after the Ca elevation. Average changes of peak and 10 s pump currents are given in bar graphs to the right of both recordings.
Figure 7
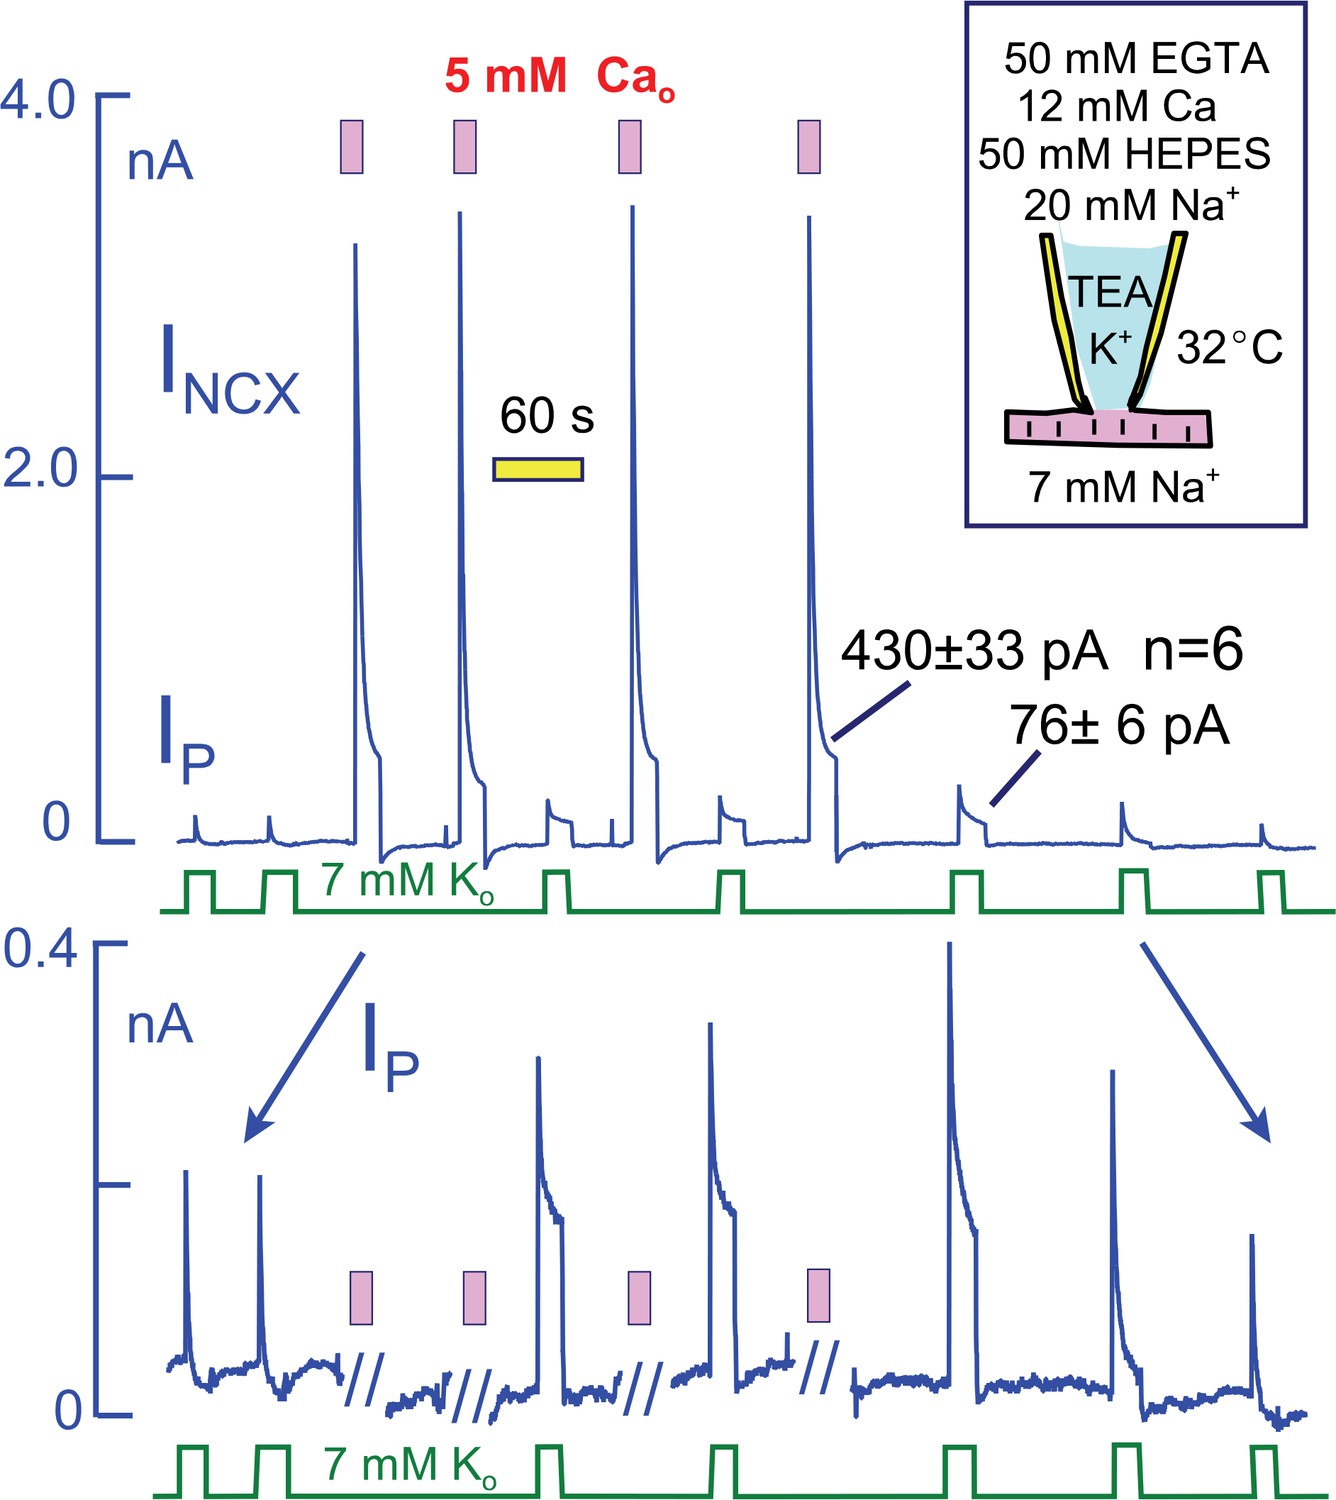
Na/K pump and Na/Ca exchange currents in myocytes that overexpress NCX1 Na/Ca exchangers by more than five-fold.
The cytoplasmic (pipette) solution is designed to highly buffer free Ca and protons. The magnitudes of exchange currents after 15 s are much greater than the 15 s pump currents. Thus, Na/K pumps and Na/Ca exchangers cannot be sharing a restricted subsarcolemmal space. Top panel. Complete current record in which Na/K pump currents and Na/Ca exchange curerrents were activated alternately. Bottom panel. Expanded view of the current record to accurately depict the Na/K pump current. Pump currents decay completely before activation of Na/Ca exchange. In response to Na/Ca exchange currents, peak pump currents double and a maintained current develops. These changes reverse completely over 3 min after the last Ca elevation.
Figure 8
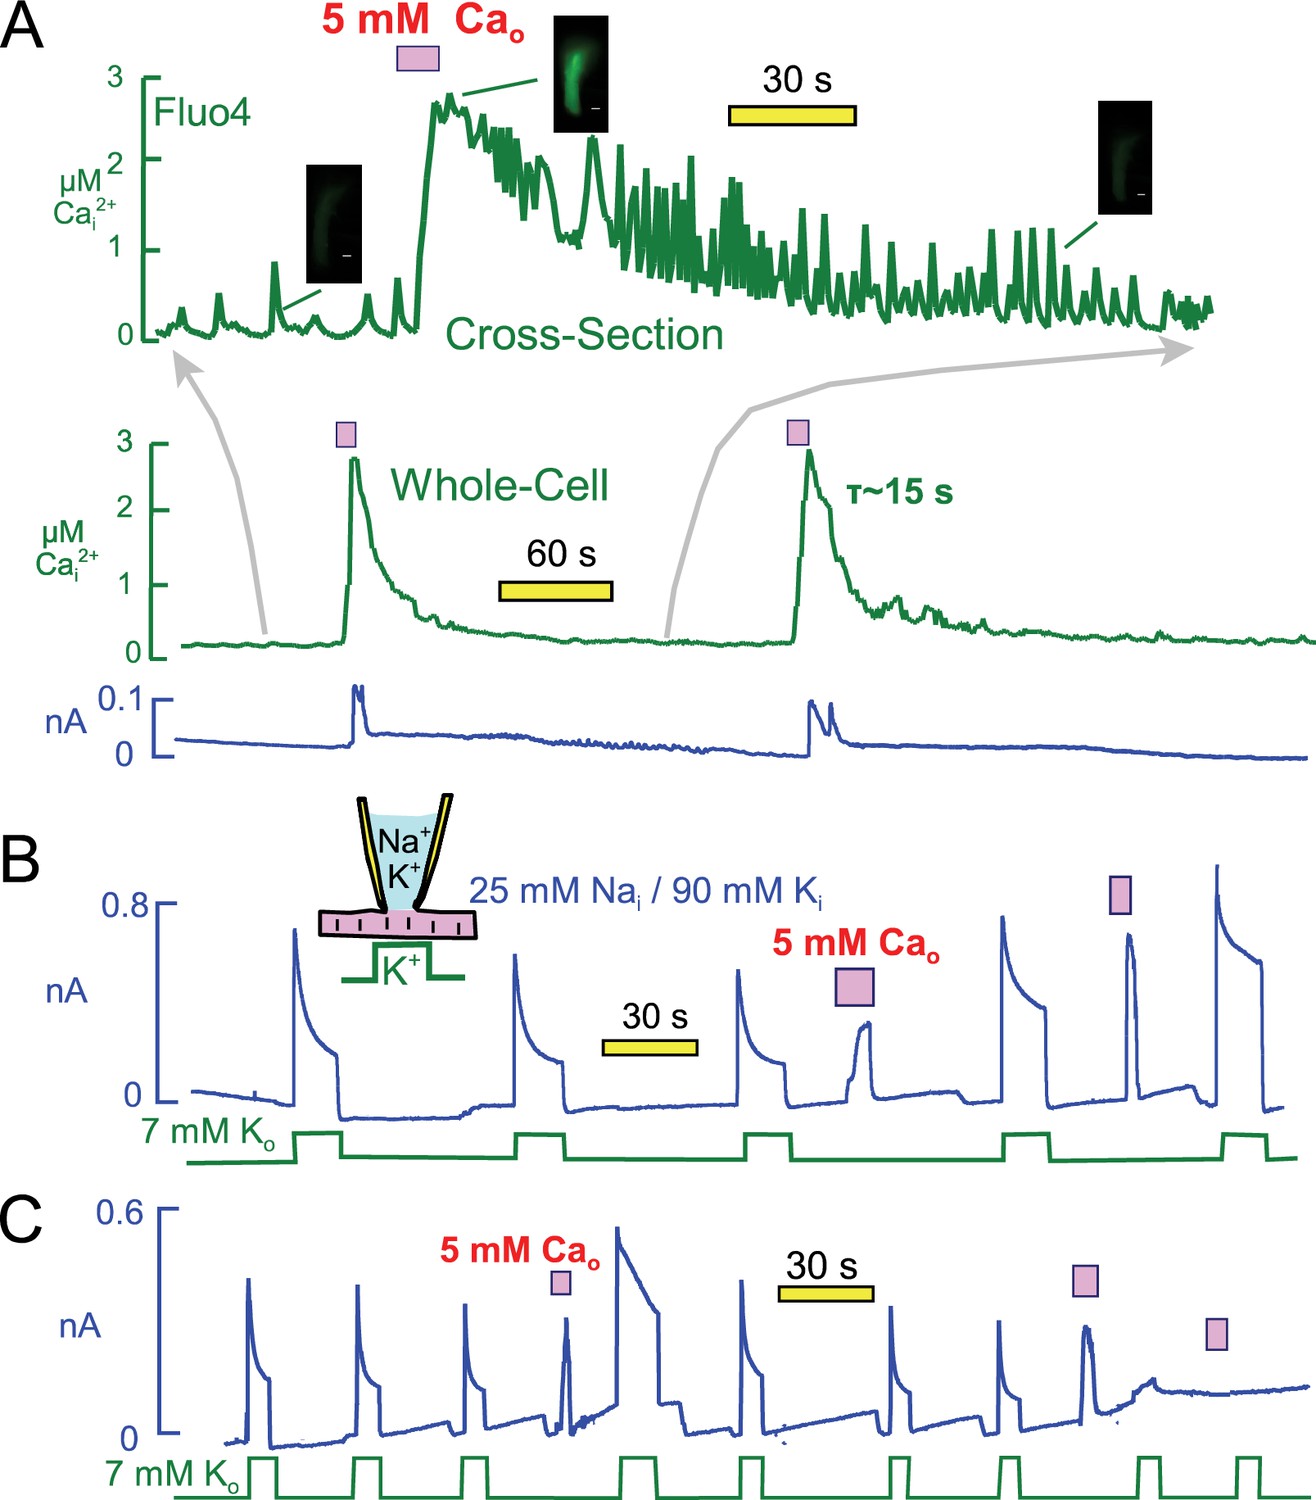
Free cytoplasmic Ca changes and their effects on Na transport currents during repeated Ca elevations.
(A) Free Ca measurements with Fluo4. The center record presents the whole-cell free Ca signal measured with Fluo4. Fluorescence increased by 3.7 ± 0.4 fold (n = 7) during application of extracellular Ca and returned to baseline with a time constant of ~25 s. Correcting for dye nonlinearity, the fall of cytoplasmic Ca probably occurs with a time constant of ~15 s. The upper record shows in an expanded time scale fluorescence from a cross-sectional slice in the middle of themyocyte, revealing that extensive Ca waves are taking place in the myocytes. These waves become more rapid an large as free Ca declines, and finally they decline in both magnitude and frequency. (B) Representative for >400 observations, Na/Ca exchange current shows a time-dependent activation phase on first application of extracellular Ca. This secondary rise corresponds to the regulatory activation of exchangers that occurs as cytoplasmic Ca rises (Matsuoka et al., 1993). On second application of Ca, the exchange current activates immediately and to a higher magnitude than on initial Ca application. Thereafter, pump current is increased beyond its peak after the first Ca elevation. (C) After three or more Ca elevations, and infrequently after the second repetition, both Na/K pump and exchange currents decreased and often became negligible. The loss of transporter currents was often accompanied by declining membrane capacitance during Ca elevations, indicative of massive endocytosis (Lariccia et al., 2011).
Figure 9
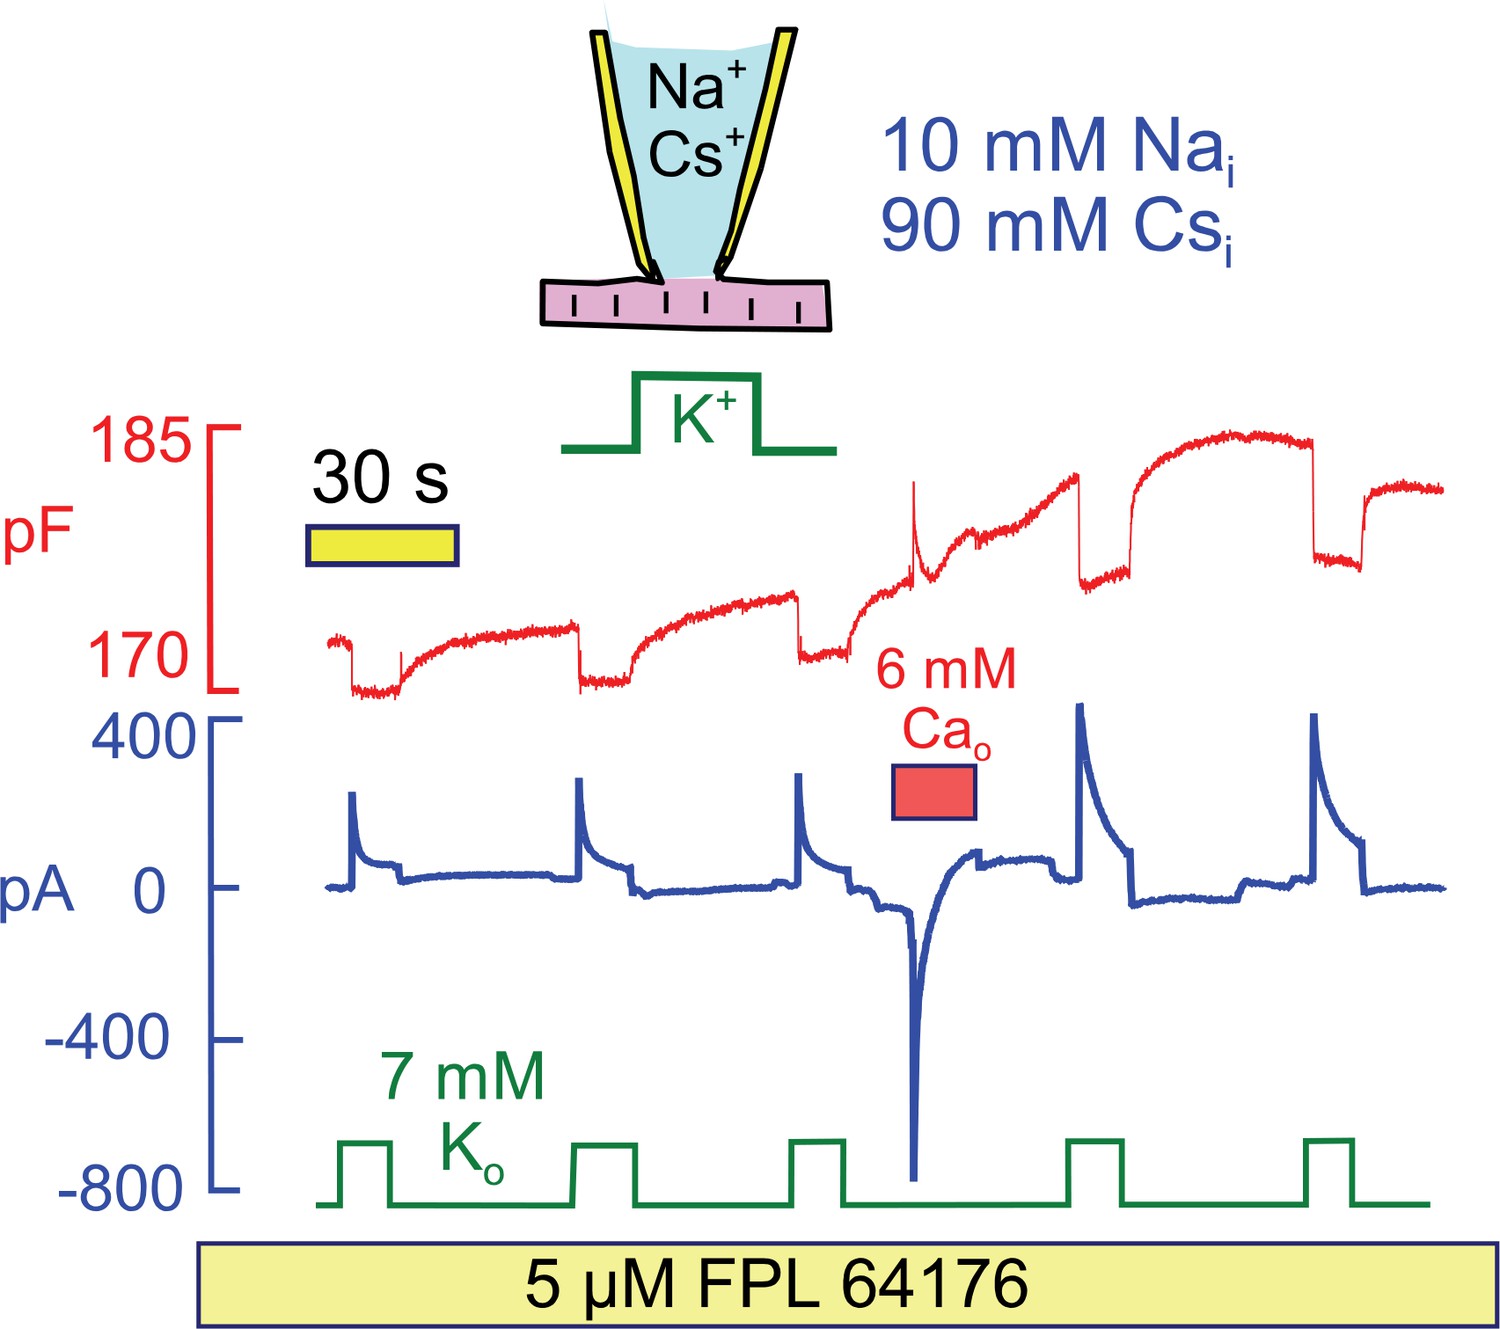
Stimulation of Na/K pump current in the presence of physiological (10 mM) cytoplasmic Na and in the absence of cytoplasmic K.
To evoke significant Ca influx in the presence of low cytoplasmic Na, FPL64176 was employed to lock L-type Ca channels open at 0 mV. On application of 6 mM extracellular Ca, inward Ca current amounted several hundred pA, and current inactivated with a time constant of about 1 s. Thereafter, Cm increased by 3%, similar to results with reverse Na/Ca exchange, and peak and 12 s pump currents were roughly doubled. Similar results were obtained in 4 similar experiments.
Figure 10

Interactions of hydrophobic cations and anions with the sarcolemma track the stimulation and inhibition of pump currents by Ca elevations.
(A) Na/K pump currents were activated repeatedly for 8 s and hexyltriphenylphosphonium (C6-TPP, 15 μM) currents were activated alternately with the pump currents for 3 s. Pump current increased and then decreased in the usual manner and rate in response to Ca elevation. Currents carried by C6-TPP increased by 39% on average and then decreased in parallel with pump currents. A second Ca elevation causes profound inhibition of pump current and a 60% decrease of C6-TPP current. As indicated, C6-TPP currents decreased on average by 62% during the time over which pump currents ran down almost completely. (B) Niflumic acid induces a capacitive binding signal, when applied at a concentration of 120 μM, which propably involves expansion of the membrane. In response to Ca elevation, the capacitive binding signal increases on average by 80% (n = 5). Thus, both cationic and anionic membrane probes bind more effectively after Ca elevations.
Figure 11
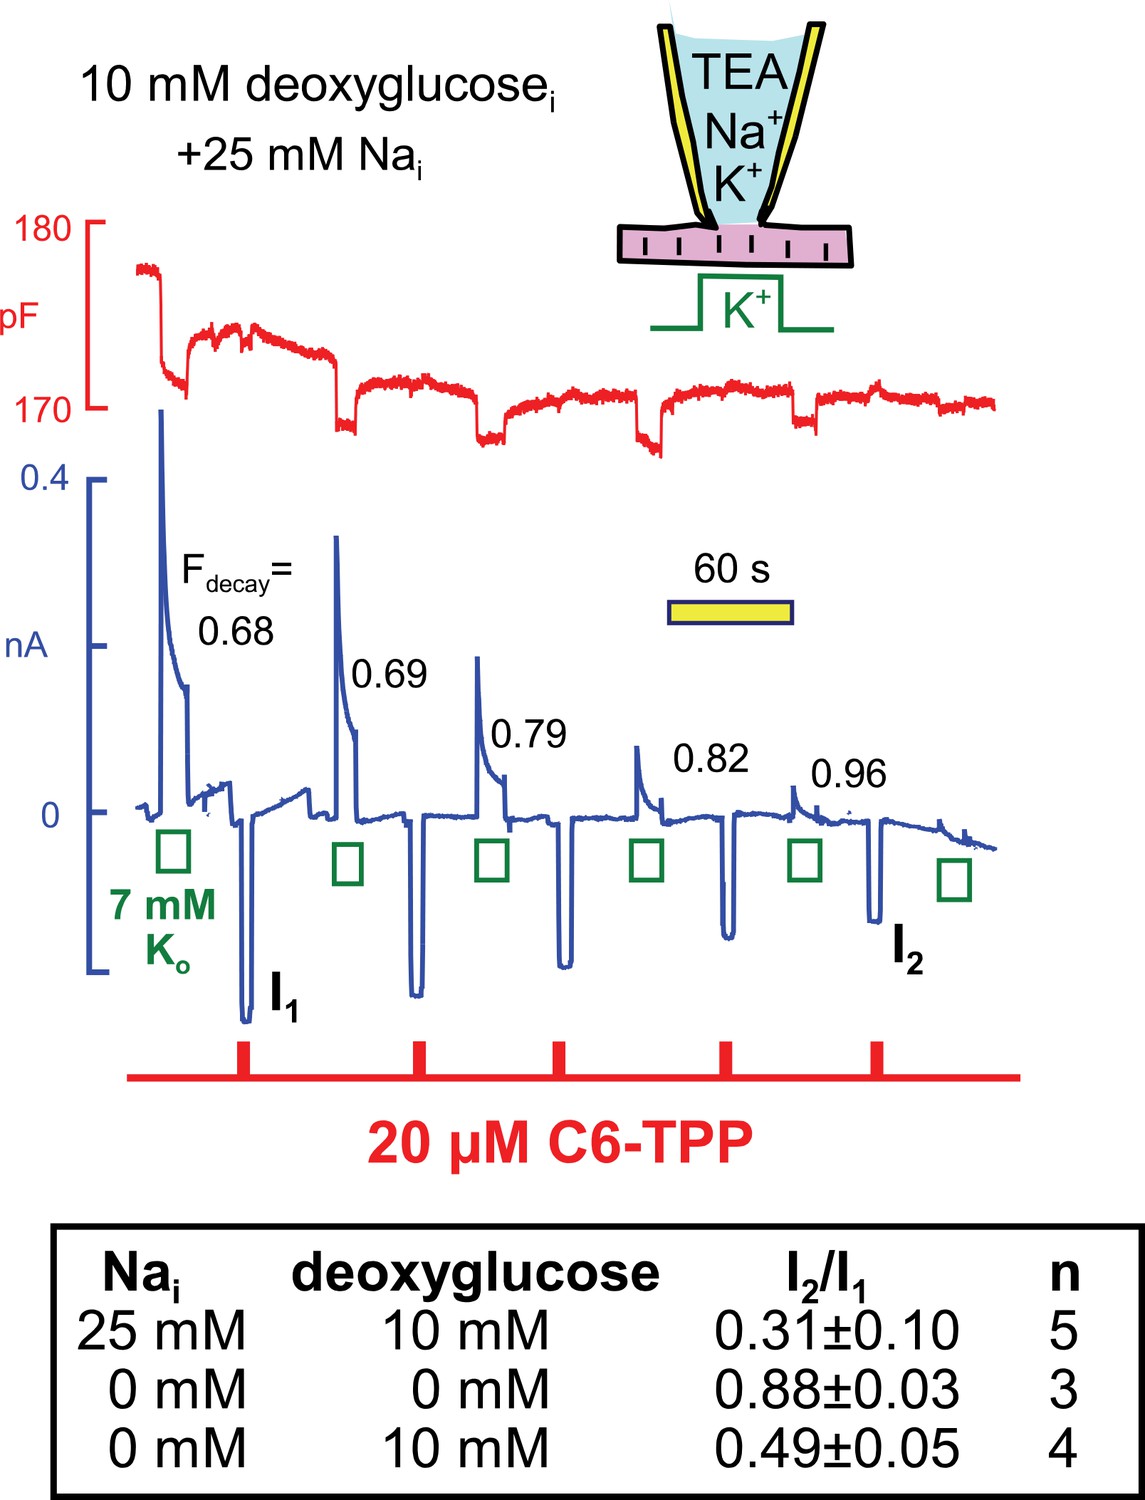
Parallel decay of pump currents and C6-TPP currents when deoxyglucose (10 mM) is included in the pipette solution.
Pump currents were activated for 10 s alternatively with C6-TPP currents for 2 s. Fractional decay of pump currents increases from 0.68 to > 0.9 as pump current declines, and the C6-TPP current decreases by 69% on average. The table beneath the figure gives statistics for equivalent experiments without deoxyglucose, with deoxyglucose but without Na, and with deoxyglucose and 25 mM cytoplasmic Na.
Figure 12
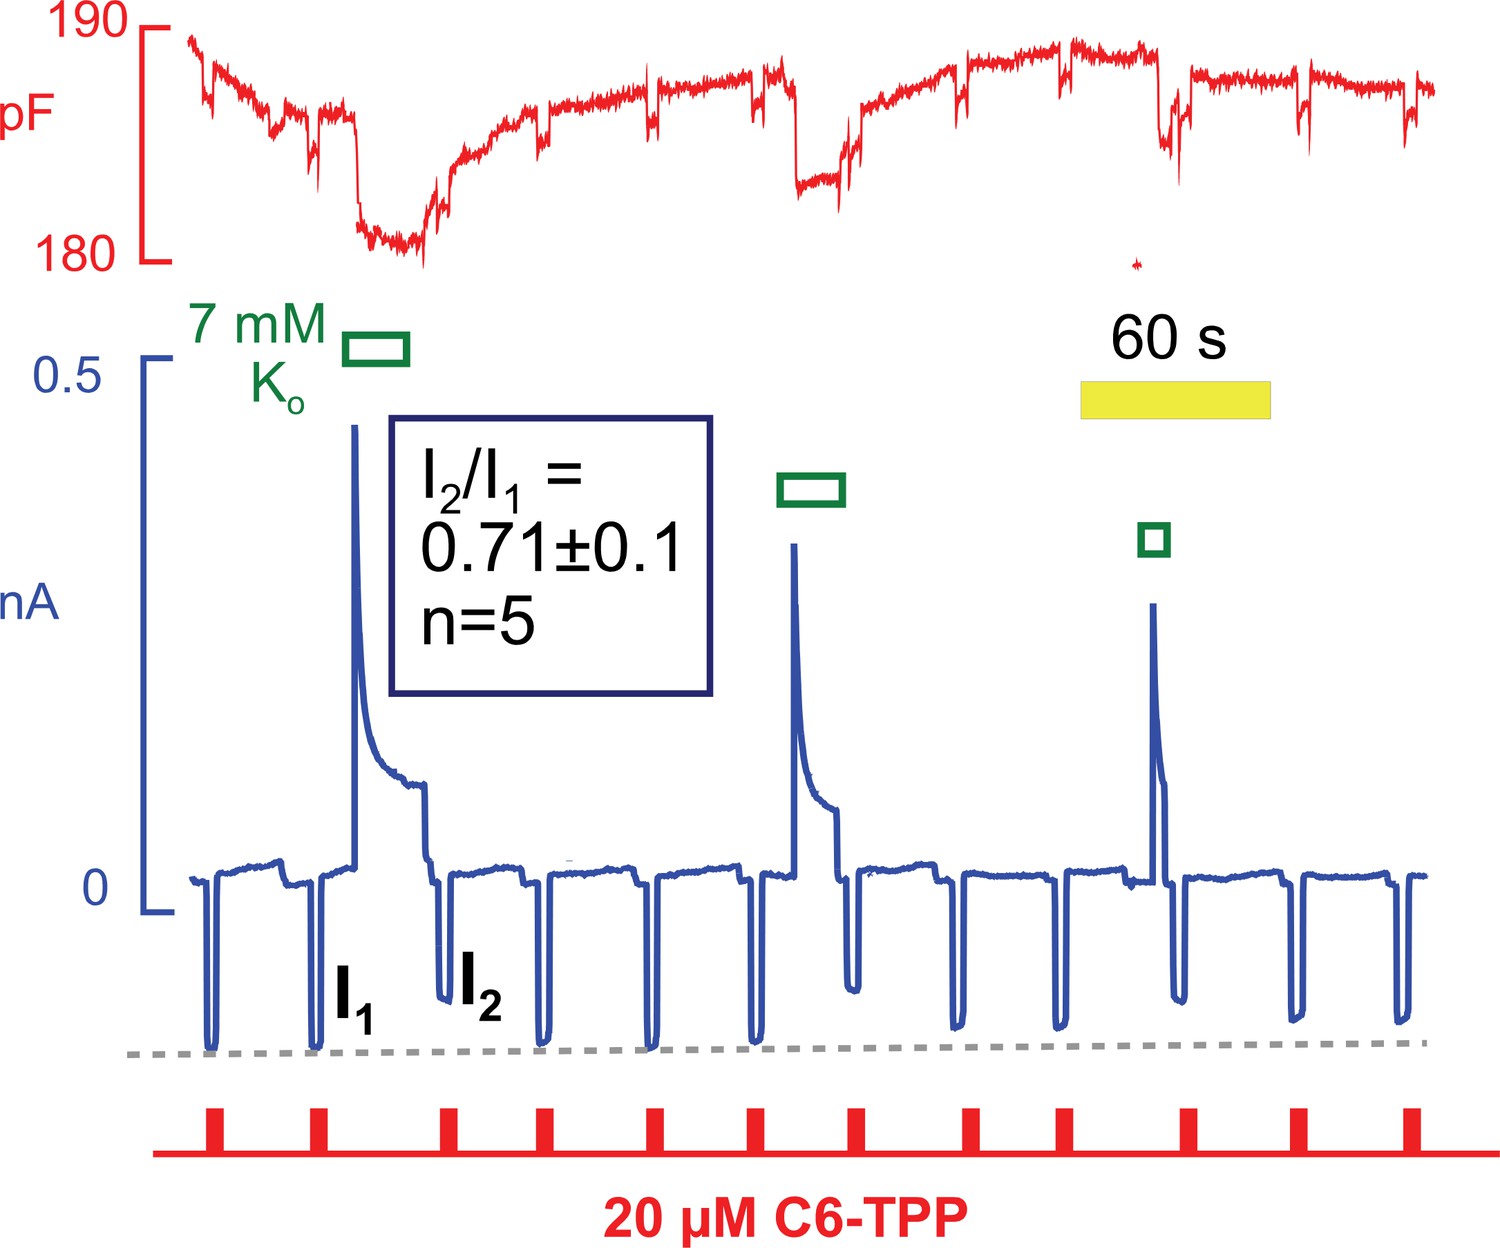
C6-TPP currents decrease in response to the apparent inactivation of Na/K pumps.
C6-TPP currents were repeatedly activated for 2 s, and Na/K pump currents were activated multiple times between a series of C6-TPP currents. The C6-TPP currents were decreased on average by 29% subsequent to pump activity and current decay, and the C6-TPP current recovered with a time course very similar to the recovery of pump activity and membrane capacitance.
Figure 13
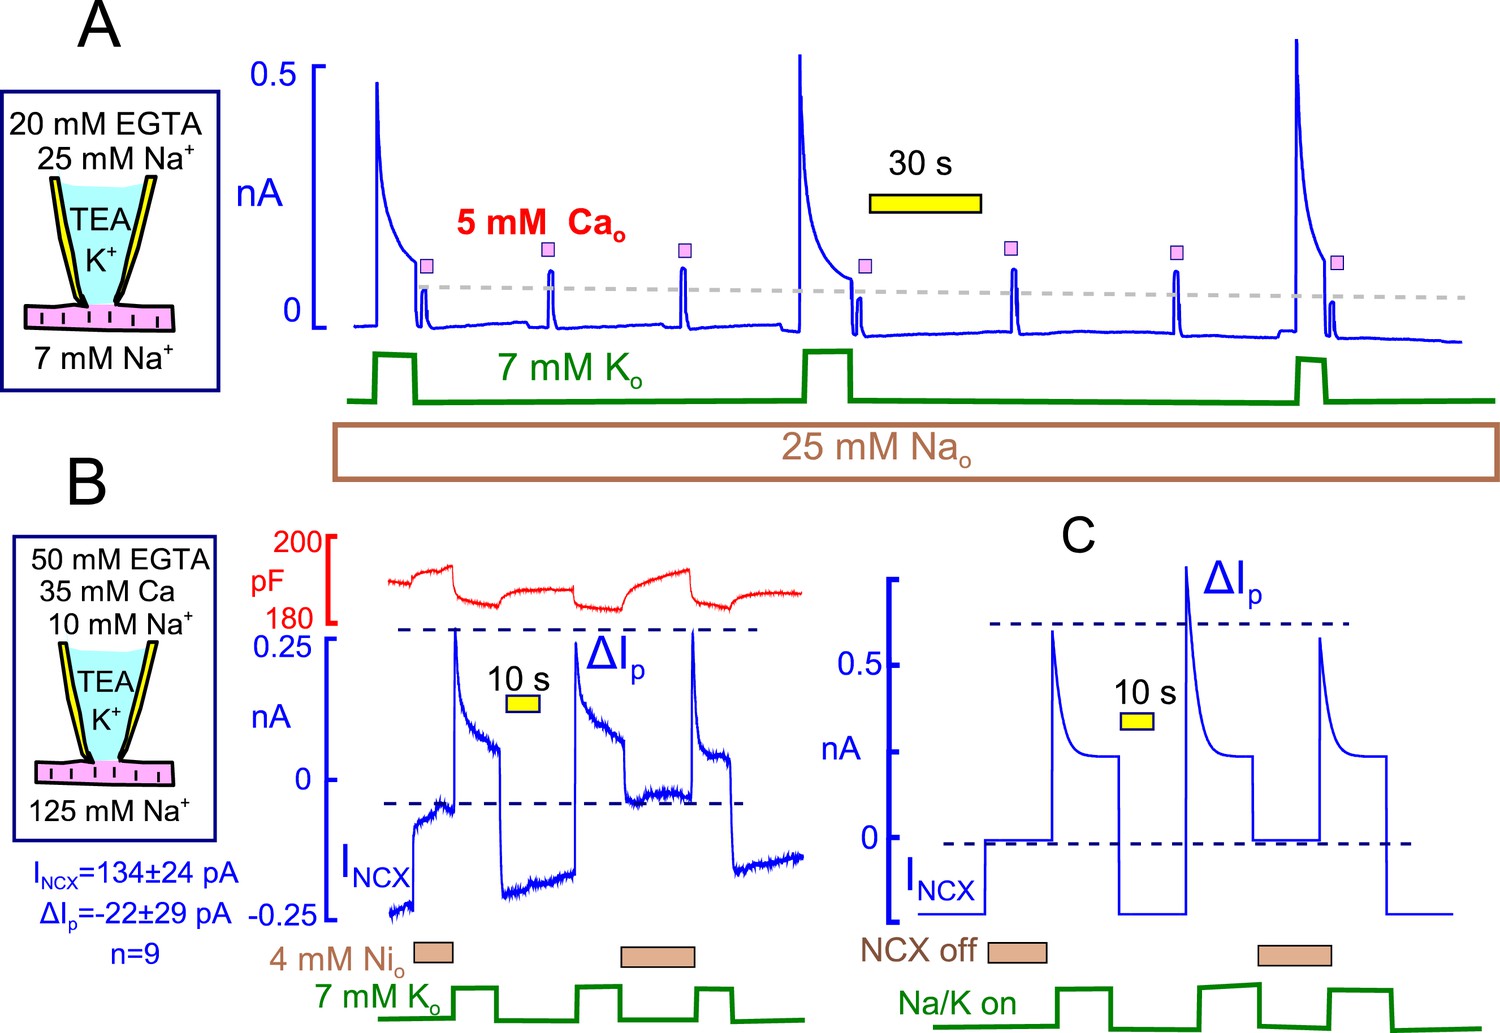
Evidence for and against Na/K pump - Na/Ca exchange cross-talk via submembrane Na changes.
(A) Standard cytoplasmic solution was modified to effectively buffer cytoplasmic free Ca to ~0.2 µM (25 mM EGTA + 6 mM Ca). Reverse Na/Ca exchange currents were activated repeatedly for 2 s before and after Na/K pump currents were activated for 15 s. Exchange currents, like C6-TPP currents in Figure 12, are suppressed immediately after pump activity and recover over 20 s. (B) K-free cytoplasmic solution was buffered to contain 0.5 µM free Ca, thereby supporting a large, continuous inward exchange current (i.e. Na influx and Ca extrusion). 50 mM EGTAi+ 35 mM Cai, 10 mM Nai, and 125 mM Nao. Inward exchange current was initially blocked, as indicated, by applying 4 mM Ni on the extracellular side. Pump current was then activated by extracellular K and exchanger block was released by removing Ni at the same time. Subsequently, Na/K pump current was activated once without and once with Na/Ca exchange block. The presence or absence of inward exchange current, before activation of pump current, does not affect the magnitude of peak pump currents. Composite results for 9 experiments are tabulated below the cartoon. (C) Predictions of a simple Na+ depletion model. Pump currents were simulated with a hyperbolic dependence on cytoplasmic Na+ (K50, 5 mM), and the cytoplasmic space was limited to a value of 3 pL to promote submembrane Na changes. When Na depletion during pump activity limits pump currents and suppresses reverse exchange currents, as in Panel A, forward exchange currents should very significantly enhance pump currents under the conditions of Panel B, and that is not the case.
Tables
Table 1
Normalized results for interventions tested to modify pump current stimulation by Ca elevations using the standard protocol (25 mM Nai with 90 mM Ki). Currents are normalized to the peak current before application of Ca. Results are given for peak and 10 s currents before applying extracellular Ca, followed by the average fractional decay of that current, and for the first peak and quasi steady state (10 s) current after applying Ca, followed by the average fractional decay of that current. See text for annotation of the major results. Abbreviations: PLM, phospholemman; BIM, Bisindolylmaleimide; DTT, dithiothreitol; SOD, Superoxide Dismutase.
| Pre-Ca2+ | Post-Ca2+ | ||||||
|---|---|---|---|---|---|---|---|
| Peak | 10 s | Fdecay | Peak | 10 s | Fdecay | n | |
| Control (25 mM Nai) | 100 | 35 ± 2 | 0.65 | 154 ± 12 | 111 ± 10 | 0.28 | 12 |
1. Basic Mechanism | |||||||
| Blebbistatin (5 μM) | 100 | 44 ± 8 | 0.60 | 138 ± 8 | 80 ± 15 | 0.40 | 6 |
| Thapsigargin (2 μM) | 100 | 36 ± 5 | 0.74 | 198 ± 70 | 118 ± 50 | 0.41 | 4 |
| Ryanodine (2 μM) | 100 | 34 ± 5 | 0.67 | 154 ± 8 | 84 ± 10 | 0.44 | 5 |
2. Phospholemman (PLM) | |||||||
| PLM -/-mice | 100 | 74 ± 4 | 0.26 | 125 ± 10 | 114 ± 10 | 0.09 | 9 |
3. Membrane cytoskeleton | |||||||
| Phalloidin, 3 μM | 100 | 57 ± 10 | 0.43 | 147 ± 25 | 116 ± 20 | 0.19 | 5 |
| Latrunculin, 3 μM | 100 | 37 ± 11 | 0.63 | 135 ± 9 | 96 ± 22 | 0.25 | 4 |
4. Serine/threonine phosphorylation | |||||||
| KN93, 3 μM | 100 | 54 ± 7 | 0.46 | 121 ± 13 | 112 ± 10 | 0.06 | 4 |
| CAMK Pep., 15 μM | 100 | 57 ± 6 | 0.43 | 131 ± 9 | 93 ± 9 | 0.28 | 6 |
| CK59, 20 µM | 100 | 25 ± 6 | 0.78 | 183 ± 30 | 75 ± 2 | 0.54 | 4 |
| H7, 0.3 mM | 100 | 35 ± 4 | 0.65 | 157 ± 12 | 95 ± 10 | 0.39 | 6 |
| BIM, 4 μM 1 hr | 100 | 27 ± 4 | 0.73 | 131 ± 4 | 86 ± 5 | 0.34 | 6 |
| PKC19-31, 10 μM | 100 | 24 ± 1 | 0.77 | 195 ± 58 | 136 ± 46 | 0.34 | 9 |
| Cyclosporin A, 3 µM | 100 | 48 ± 6 | 0.52 | 126 ± 6 | 101 ± 5 | 0.25 | 5 |
5. Redox and NOS signaling | |||||||
| PRD6 -/- mice | 100 | 33 ± 5 | 0.66 | 189 ± 24 | 134 ± 17 | 0.26 | 8 |
| Oxy-glutathione, 5 mM | 100 | 31 ± 4 | 0.69 | 195 ± 18 | 120 ± 11 | 0.37 | 6 |
| Glutathione, 8 mM | 100 | 38 ± 7 | 0.62 | 130 ± 14 | 89 ± 15 | 0.30 | 4 |
| DTT, 0.2 mM (in & out) | 100 | 28 ± 3 | 0.73 | 148 ± 31 | 100 ± 35 | 0.35 | 5 |
| SOD, 3 mg/ml | 100 | 26 ± 2 | 0.74 | 170 ± 18 | 101 ± 12 | 0.67 | 5 |
| L-NAME, 0.1 mM | 100 | 25 ± 6 | 0.75 | 190 ± 41 | 120 ± 27 | 0.36 | 4 |
6. Mitochondrial signaling | |||||||
| CGP37157, 20 μM | 100 | 22 ± 4 | 0.78 | 184 ± 24 | 83 ± 15 | 0.55 | 4 |
| RU360, 20 µM | 100 | 44 ± 7 | 0.56 | 111 ± 7 | 94 ± 15 | 0.17 | 6 |
7. Lipid metabolism | |||||||
| PLD1-PLD2 -/-mice | 100 | 34 ± 3 | 0.66 | 114 ± 4 | 86 ± 9 | 0.25 | 9 |
| DHHC5-GT mice | 100 | 31 ± 3 | 0.69 | 115 ± 5 | 83 ± 5 | 0.27 | 6 |
| U73122, 10 μM | 100 | 39 ± 4 | 0.61 | 165 ± 8 | 117 ± 11 | 0.29 | 5 |
| Wortmannin, 10 μM | 100 | 48 ± 6 | 0.51 | 125 ± 8 | 120 ± 10 | 0.03 | 4 |
8. Nonspecific membrane modifiers | |||||||
| Genistein, 25 μM | 100 | 16 ± 6 | 0.84 | 6 ± 0 | 0 ± 0 | -- | 5 |
| Daidzein, 20 µM | 100 | 40 ± 4 | 0.59 | 104 ± 9 | 54 ± 5 | 0.48 | 6 |
| Quercetin, 100 μM | 100 | 57 ± 11 | 0.43 | 96 ± 54 | 62 ± 31 | 0.31 | 5 |
| Methylene Blue, 3 μM | 100 | 41 ± 4 | 0.59 | 54 ± 19 | 42 ± 15 | 0.22 | 8 |
| Triacsin C, 2 μM | 100 | 43 ± 6 | 0.57 | 43 ± 21 | 31 ± 15 | 0.25 | 7 |
Download links
A two-part list of links to download the article, or parts of the article, in various formats.
Downloads (link to download the article as PDF)
Open citations (links to open the citations from this article in various online reference manager services)
Cite this article (links to download the citations from this article in formats compatible with various reference manager tools)
Profound regulation of Na/K pump activity by transient elevations of cytoplasmic calcium in murine cardiac myocytes
eLife 5:e19267.
https://doi.org/10.7554/eLife.19267


