Inhibition in the auditory brainstem enhances signal representation and regulates gain in complex acoustic environments
- University of Leipzig, Germany
- Radboud University, Netherlands
Figures
Figure 1
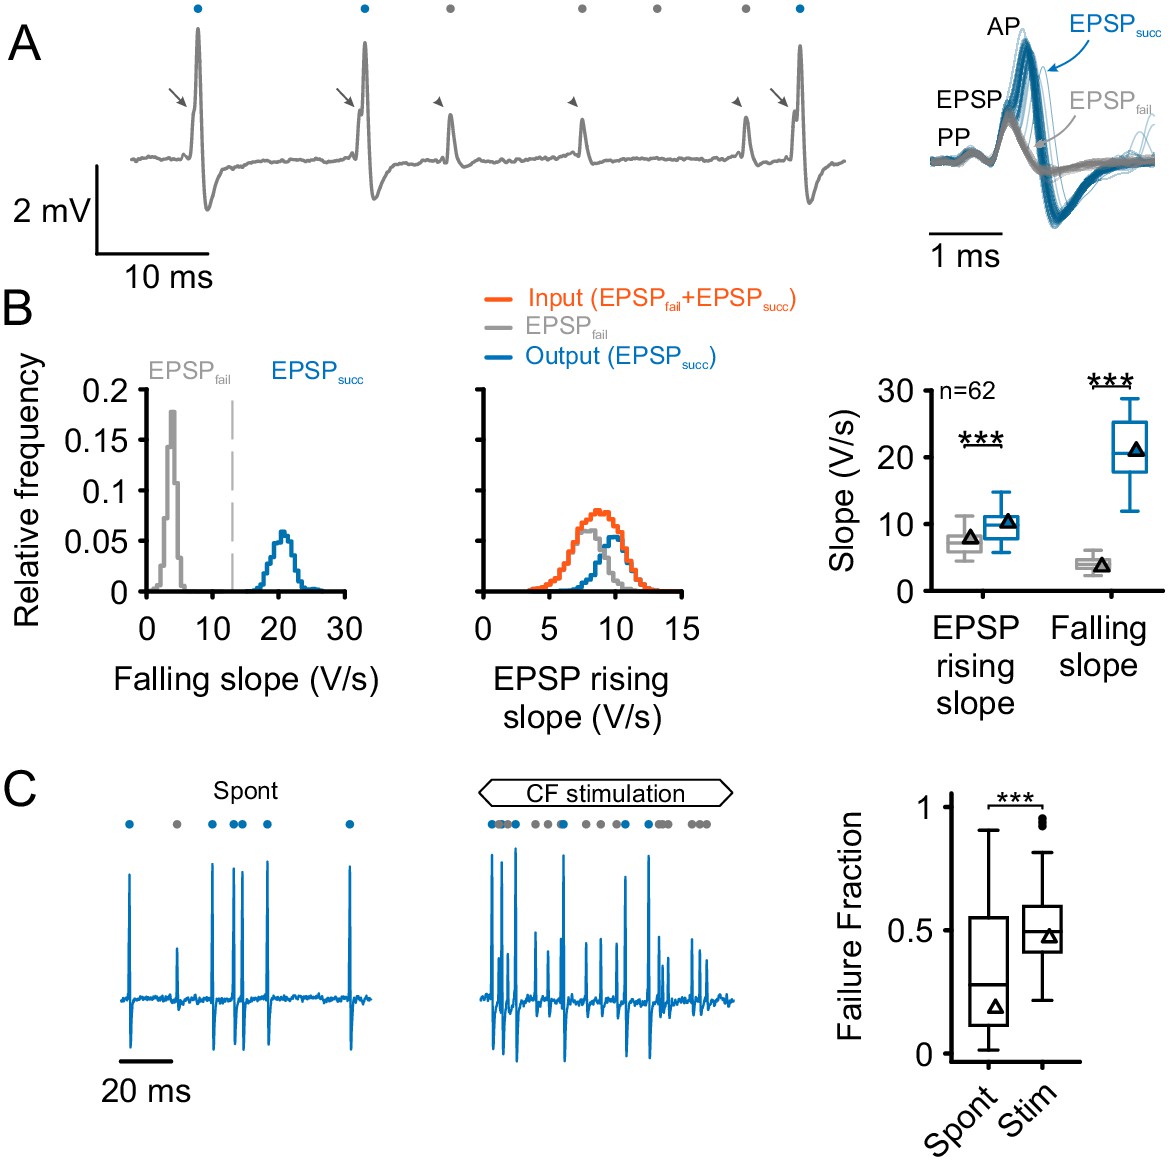
Separation and attribution of pre- and postsynaptic neuronal response components.
(A) Left: Representative trace of an in-vivo loose-patch recording of a spherical bushy cell (SBC) showing both EPSPs followed by an action potential (arrows, blue dots) and EPSPs which fail to trigger an AP (arrowheads, gray dots). Right: Superimposing the events (50 events of each type) shows that both signal types share the presence of a prepotential (PP) and an EPSP, but may (EPSPsucc) or may not (EPSPfail) trigger a postsynaptic AP. (B) Left: Both types of events are clearly separable by the maximum falling slope, with APs showing much steeper falling slopes (blue, EPSPsucc) than EPSPs that fail to trigger an AP (gray, EPSPfail). Middle: EPSP rising slopes of EPSPsucc (blue) and EPSPfail (gray) show considerable overlap, with EPSPfail having consistently smaller rising slopes than EPSPsucc. Note the mono-modal, Gaussian distribution of all EPSP inputs (orange), suggesting that both types of events originate from the same source. Right: Population data of 62 units: EPSP falling slopes show completely different value ranges (right, p<0.001) which made it possible to clearly separate the two types of events. The respective EPSP rising slopes show considerable overlap (left), but still, the rising slopes of EPSPsucc were consistently higher than for EPSPfail (p<0.001). Triangles indicate the respective values of the representative cell on the left. Box plots show medians, interquartile and minimum/maximum values. (C) Left: During spontaneous activity, not all EPSPs trigger a postsynaptic AP, gray dots indicate EPSPfail, blue dots indicate EPSPsucc. Middle: When stimulated at CF, the discharge rate increases, but the ANF-SBC synapse becomes increasingly unreliable indicated by a high proportion of EPSPfail. Right: Population data show the considerable variance of failure fraction during spontaneous activity, and a consistent increase in failure fraction during acoustic stimulation. CF = characteristic frequency. Dots indicate values > 1.5 interquartile range.
-
Figure 1—source data 1
Rising and falling slope for EPSPfail and EPSPsucc, and failure fractions during spontaneous activity and acoustic stimulation.
Shown are the average maximum rising slopes of the EPSPs and the maximum falling slopes of the events for EPSPfail and EPSPsucc for each cell in the dataset (n = 62). Data are in V/s. The data set also contains the average failure fraction in the absence of sound and during acoustic stimulation.
- https://doi.org/10.7554/eLife.19295.004
Figure 2

Preceding activity has only a minor, facilitating influence on EPSP rising slopes.
(A) Left: Estimation of threshold EPSP for a representative cell: The EPSP rising slopes were binned (0.5 V/s bin size) and the proportion of EPSPsucc calculated for each bin. A Boltzmann function was fit to these data. The symmetric inflection point of this function was considered the threshold EPSP and indicates the EPSP rising slope necessary to generate an AP with >50% probability. Middle: The inter-event-interval (IEI) between synaptic inputs had only a small influence on the EPSP rising slope, with small IEIs being correlated with moderately increased EPSP rising slopes. A more prominent difference was observed between EPSPfail (gray) which showed consistently smaller rising slopes than EPSPsucc (blue) and these differences prevailed over a wide range of IEIs. For IEI < 2 ms the SBCs relative refractoriness renders virtually all EPSPs unsuccessful in triggering a postsynaptic AP. The black line indicates the threshold EPSP. Right: Grand average of normalized EPSP slope, threshold EPSP (left ordinate), and failure fraction (right ordinate) in dependence of preceding IEI pooled for EPSPsucc and EPSPfail (n = 62 cells). The average EPSP slope (green, left ordinate) showed facilitation for IEIs between 2–20 ms (error bars indicate standard deviation). The median threshold EPSP (black line, left ordinate) was elevated only for IEIs < 2 ms and well below average EPSP size for larger IEIs (shaded area indicates first and third quartile). The elevated threshold EPSP resulted in an increased failure fraction for IEIs < 2 ms, while for longer IEIs the reliability of AP generation seemed not to be affected (orange, right ordinate). (B) Consideration of a wider time span of preceding activity: Sketch of the quantification of preceding activity by exponentially weighting [W] all preceding EPSP rising slopes [S] (ANF activity) or AP amplitudes (SBC activity) depending on the distance to the event under investigation. (C) Left: EPSP rising slopes for the representative cell showed only minor dependence on previous ANF activity levels. Note that the EPSPfail (gray) showed consistently lower EPSP rising slopes (histogram on the left); still, the EPSPs slopes tend to increase during periods of high activity. The threshold EPSP (black line) increased as a function of ANF activity. Threshold EPSP was calculated for different levels of ANF activity (bin size = 0.5). Right: signal amplitudes of EPSPfail (gray) and APs (blue) as a function of preceding SBC activity showed decreasing AP amplitudes but increasing EPSP amplitudes. (D) Population data for 62 units (n = 62): While EPSP slopes tend to be elevated after periods of high activity (left), AP amplitudes showed a negative correlation with preceding SBC activity (p<0.001, one-sample t-test against zero). Triangles indicate the data of the representative cell. Organization of the graph as described above. .
-
Figure 2—source data 1
Correlation between EPSP slopes and signal amplitudes on preceding ANF activity.
Shown are the Spearman correlation coefficient values obtained from the correlations of maximum EPSP slopes and signal amplitude vs. preceding ANF activity levels, separately for EPSPsucc and EPSPfail (n = 62).
- https://doi.org/10.7554/eLife.19295.006
Figure 3
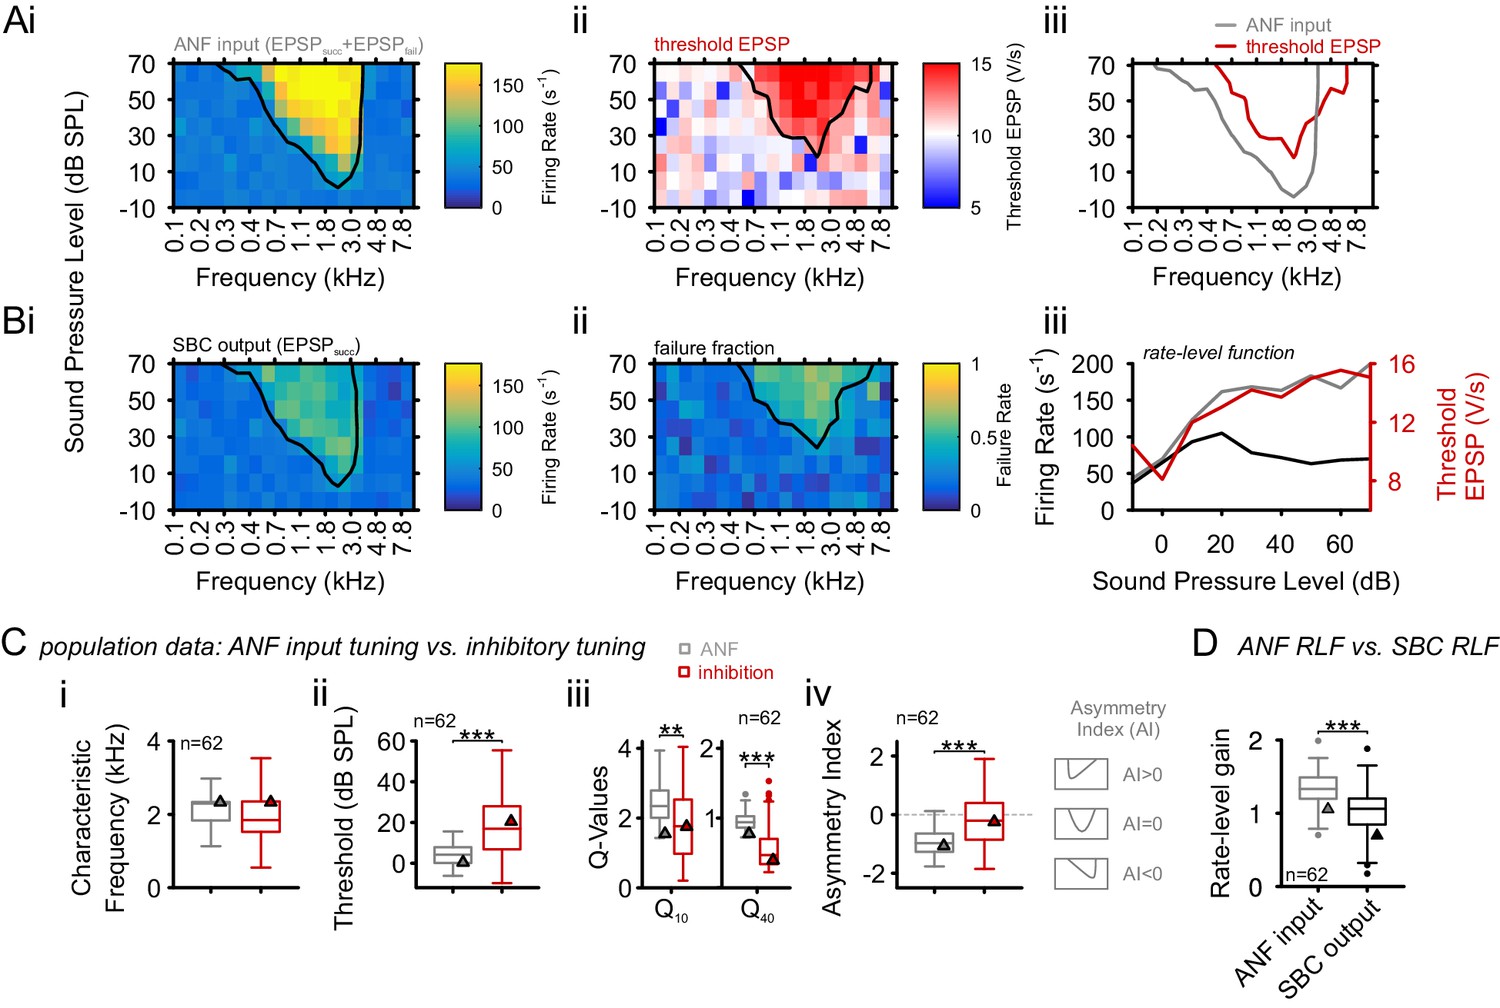
Inhibition at SBC is co-tuned with excitation and broadband, not off-CF and narrowband.
(A) i: Representative frequency response area (FRA) of the excitatory ANF input (EPSPfail and EPSPsucc) characterized by a well-defined CF, the typical steep high-frequency flank, the formation of a low-frequency tail, and the absence of frequency-intensity domains of inhibition. ii: The same recording showed elevated threshold EPSPs throughout most of the excitatory response area and extending up to two octaves above CF. The frequency, where the lowest relative intensity caused elevated threshold EPSP, matched the units CF. iii: For the same unit, comparison of excitatory (ANF, gray) response area and frequency-intensity domain of inhibition (threshold EPSP elevation, red). The inhibitory domain was symmetrically arranged around the unit’s CF. (B) i: FRA of the SBC output (EPSPsucc) shows a considerable reduction in firing activity compared to the ANF input. ii: Failure fraction, i.e. the proportion of EPSPfail. The increase in failure fraction is most prominent around the units CF. Note the similarity of the frequency-intensity domains of EPSP threshold increase and the respective domains with increased EPSPfail in Aii. iii: Rate-level functions of ANF input (gray line, left ordinate) and SBC output (solid black line, left ordinate) compared to threshold EPSP (red, solid line, right ordinate). Increasing sound pressure levels result in a monotonic increase in ANF firing and correspondingly the threshold EPSP shows a monotonic increase. The SBC output is maximal at 20 dB SPL and declines towards higher stimulus intensities. (C) Population data: comparison of excitatory (ANF, gray) and inhibitory (threshold EPSP, red) FRA indicates (i) on-CF inhibition although (ii) with higher thresholds (p<0.001, paired t-test), which is (iii) broadly tuned (Q10: p<0.01, Q40: p<0.001, two-way RM ANOVA), and (iv) shows a more symmetric tuning (p<0.001, paired t-test; the schematic drawing on the right indicates FRA shapes for different asymmetry indices). (D) Finally, the rate-level functions were shallower and showed a reduced gain in firing rate in the output compared to the input. SBC = spherical bushy cell, CF = characteristic frequency, EPSP = excitatory postsynaptic potential, ANF = auditory nerve fibers, FRA = frequency response area.
-
Figure 3—source data 1
Tuning properties of excitatory and inhibitory inputs onto SBCs.
Shown are the characteristic frequency (in kHz), threshold (in dB SPL), Q-values, asymmetry index, and rate-level gain for the excitatory ANF input and the inhibitory area determined by an elevation in threshold EPSP (n = 62).
- https://doi.org/10.7554/eLife.19295.008
Figure 4
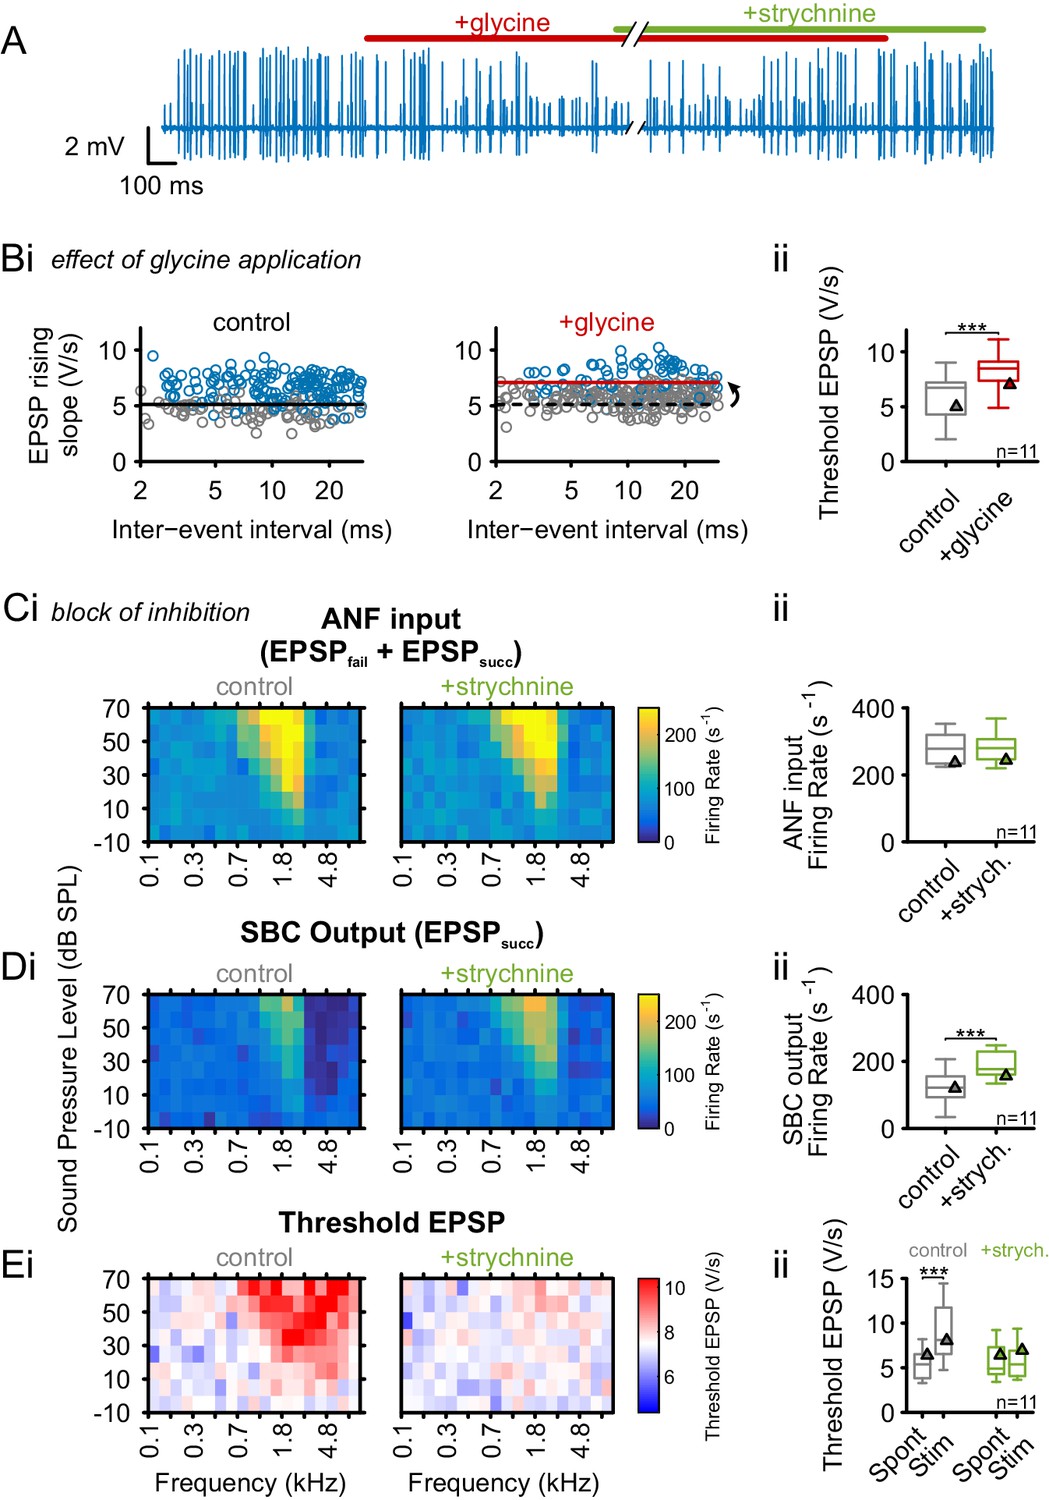
Glycinergic inhibition elevates threshold EPSP and becomes activated during acoustic stimulation.
(A) Representative recording of spontaneous activity with iontophoretically applied glycine to block SBC spiking (red bar). This effect is suspended by strychnine application (green bar). (B) (Bi) Left: During spontaneous activity, small EPSPs fail to generate APs (gray = EPSPfail, blue = EPSPsucc, black line = threshold EPSP). Right: Iontophoretic application of glycine elevates the threshold EPSP (solid red line) for spike generation resulting in an increased failure fraction (dashed black line shows threshold EPSP from control condition). (Bii): Population data for 11 units showing the effect of glycinergic inhibition on the increase of threshold EPSP. (C) and (D): Acoustically evoked FRAs while blocking glycinergic inhibition. (Ci) No effect on input FRA was observed when inhibition was blocked. (Cii) Population data confirming the lack of glycine effect on the input activity. (Di) SBC output FRA shows increased firing rates during the blockade of glycinergic inhibition. Note the absence of the inhibitory sideband after inhibition block. (Dii) Population data show a considerable increase in SBC firing after block of inhibition (p<0.001, paired t-test). (Ei) Left: Under control condition, t threshold EPSP is elevated during acoustic stimulation, indicating the presence of acoustically evoked inhibition. Right: This threshold elevation is absent when the glycinergic inhibition is blocked. (Eii) Population data showing the threshold EPSP during spontaneous activity and acoustic stimulation at the units’ CF for control condition (gray, p<0.001, two-way RM ANOVA) and under inhibition block (green). Note the absence of threshold EPSP elevation during acoustic stimulation under the inhibition block. Blocking glycinergic inhibition had no effect on threshold EPSP during spontaneous activity. Triangles in Bii–Eii denote representative cells from Bi–Ei.
-
Figure 4—source data 1
Iontophoretic application of glycine and strychnine.
Shown are the threshold EPSPs (in V/s) during control condition and during glycine application (n = 11). The data set also contains the ANF input firing rates, SBC output firing rates (in Hz) and threshold EPSPs during spontaneous activity and acoustic stimulation for both control conditions and during strychnine application (n = 11).
- https://doi.org/10.7554/eLife.19295.010
Figure 5
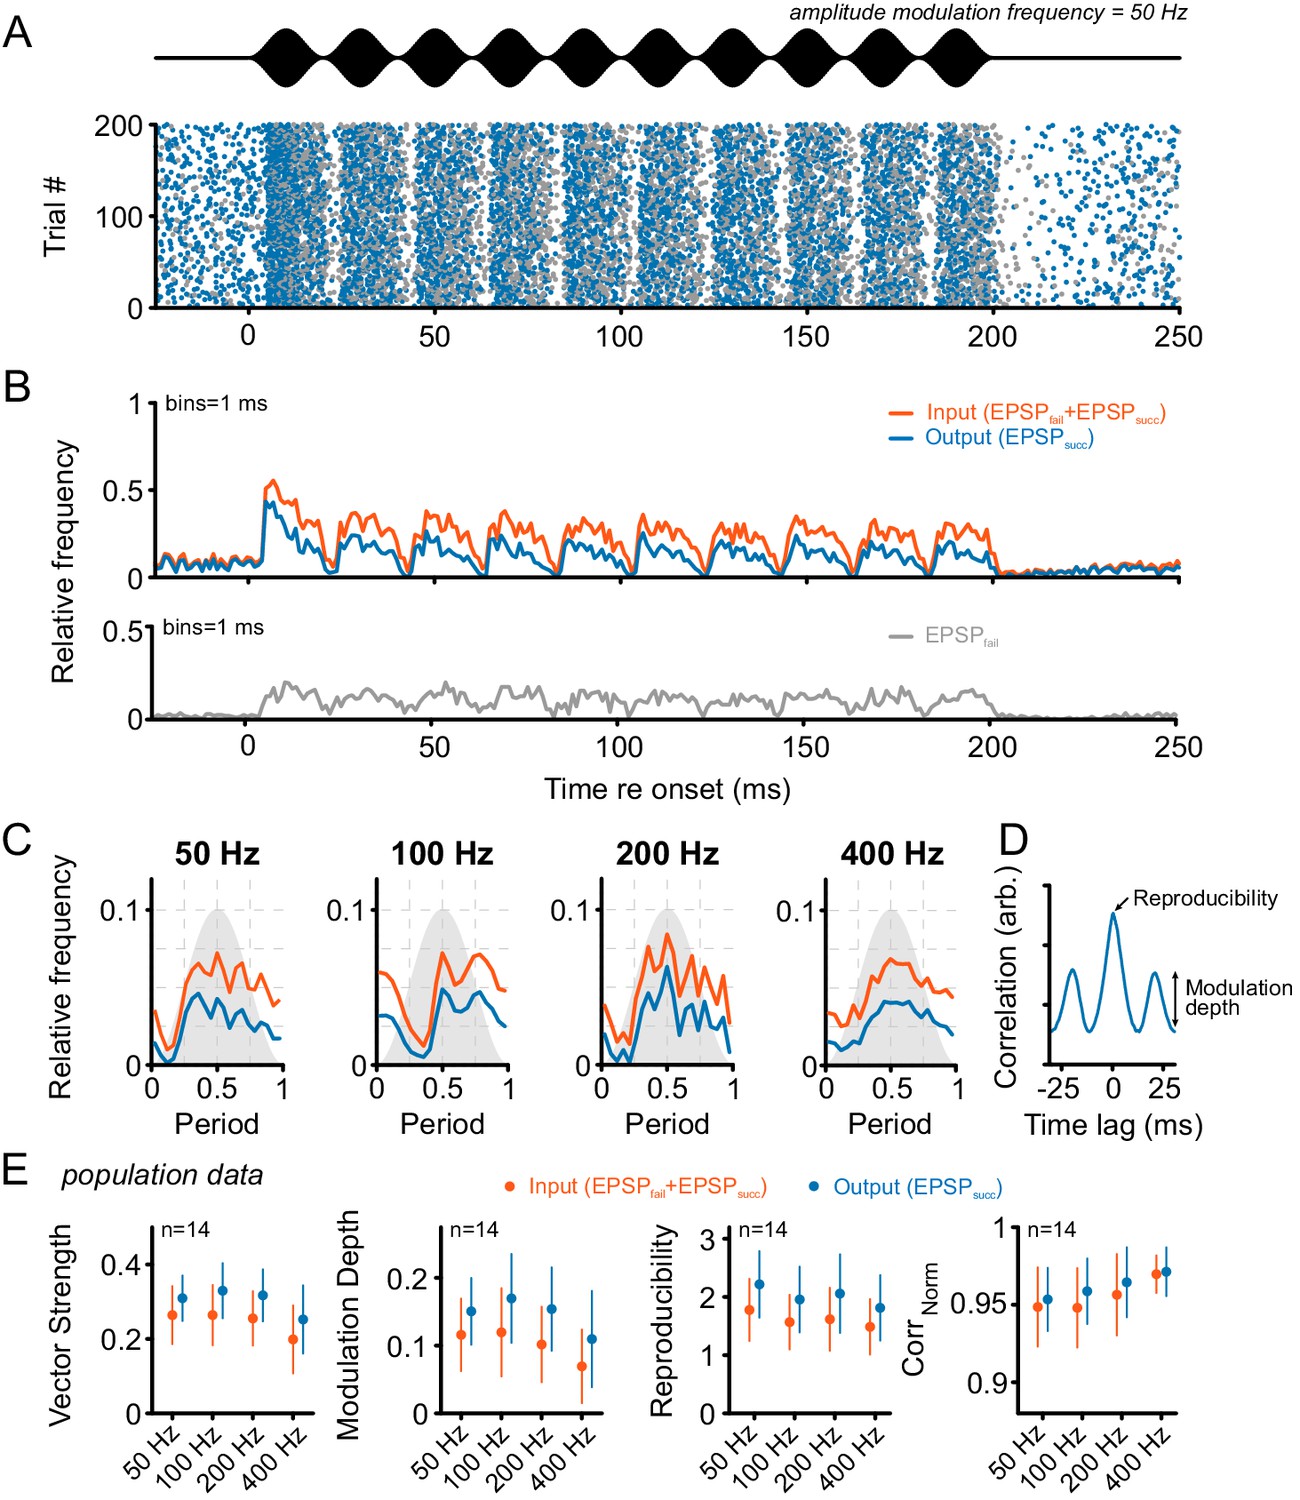
Tone bursts with sinusoidal amplitude modulations (SAM) of different modulation frequencies were used to investigate the input-output function under the condition of dynamically altered amplitude profiles.
Overall, SAM testing revealed higher temporal precision and reproducibility from ANF input to SBC output. (A) The upper panel (black) shows the stimulus and the lower panel the dot-raster plot of the discharges of a representative SBC to 200 stimulus presentations with a differentiation between EPSPsucc (blue) and EPSPfail (gray). (B) Histogram of the discharge activity shown in A. Upper panel: blue = EPSPsucc, orange = ANF input, i.e. EPSPsucc+EPSPfail). Lower panel: The EPSPfail is also locked to the SAM, following the ANF input dynamics. (C) Period histograms of ANF input (orange) and SBC output (blue) to increasing modulation frequencies. For comparison, all histograms are centered to the maximum of the ANF input. Gray background indicates the stimulus modulation. (D) Trial-to-trial reproducibility and modulation depth were calculated from the cross-correlation between trials. Reproducibility was defined as the peak of the normalized cross correlation and modulation depths as the standard deviation of the first cycle. (E) Population data for 14 SBCs. Different measures of temporal precision and trial-to-trial reproducibility all revealed higher accuracy for the SBC output compared to its ANF input: The SBC output showed consistently higher vector strength (left, p<0.001, two-way RM ANOVA), increased modulation depth (middle left, p<0.001, two-way RM ANOVA), higher reproducibility (middle right, p<0.01, two-way RM ANOVA) and higher representation of the stimulus envelope (right, p<0.05, two-way RM ANOVA) throughout all modulation frequencies. Markers indicate mean ± standard deviation.
-
Figure 5—source data 1
Metrics of temporal precision and reproducibility during SAM stimulation.
Shown are the vector strength, modulation depth, reproducibility and CorrNorm values for each modulation frequency separately for ANF input and SBC output. (n = 14).
- https://doi.org/10.7554/eLife.19295.012
Figure 6
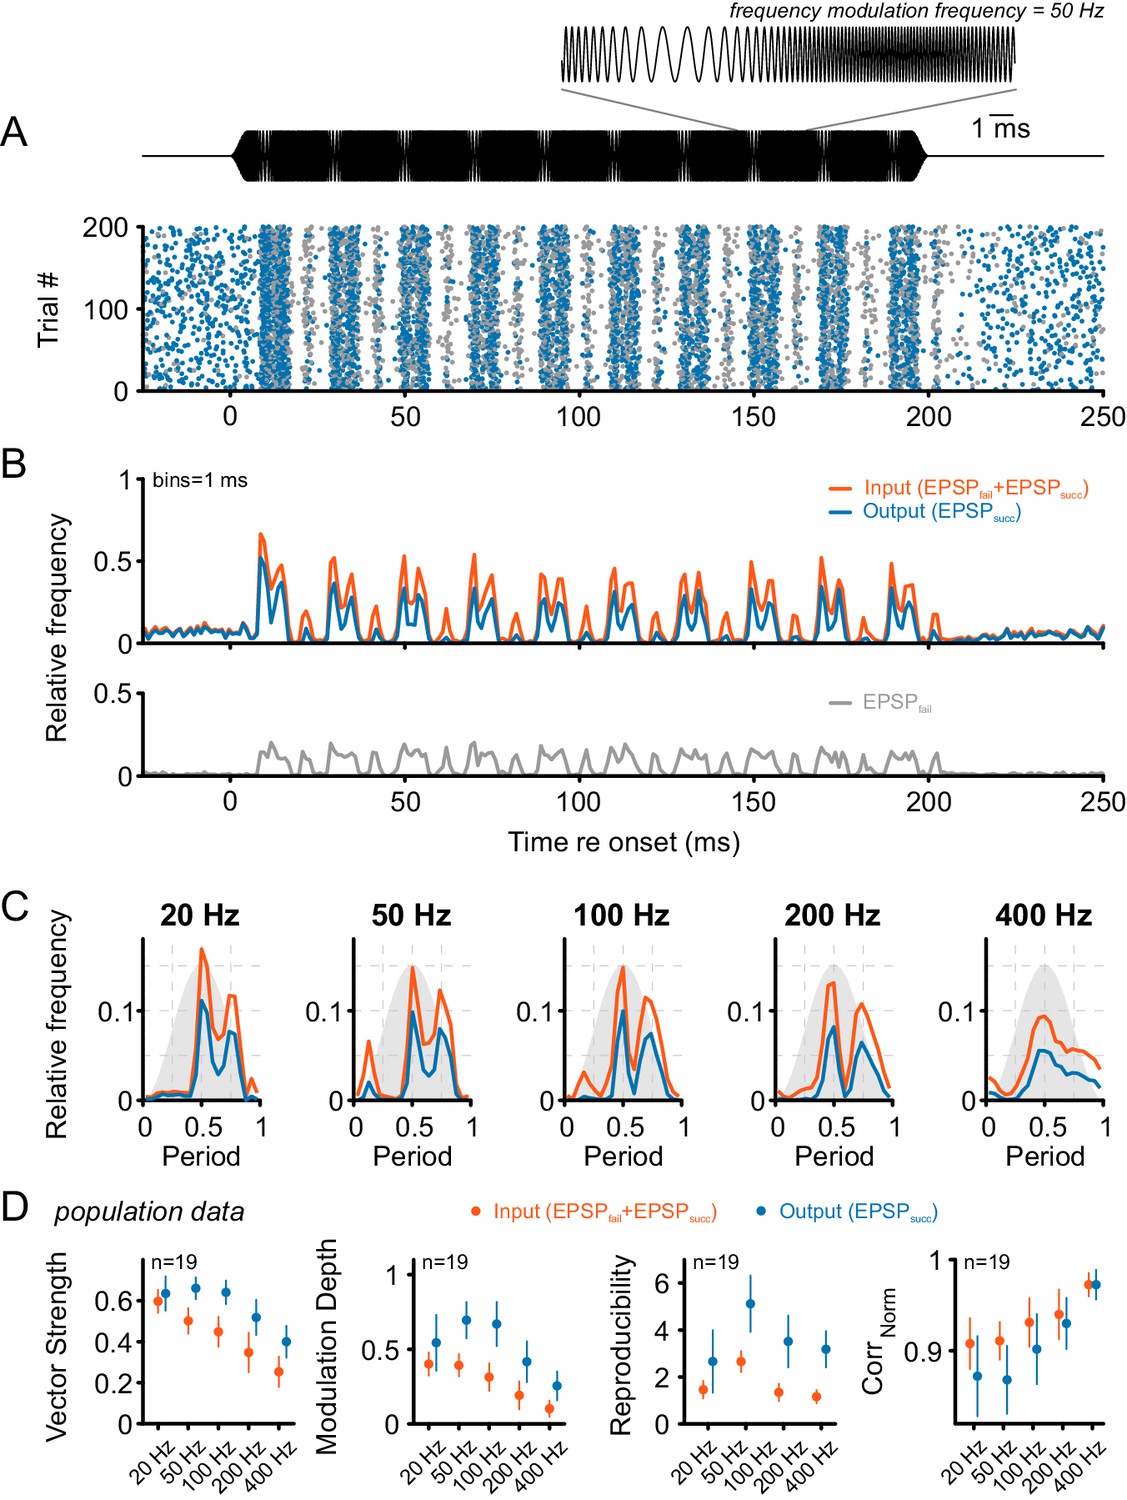
Tone bursts with sinusoidal frequency modulations (SFM) of different modulation frequencies were used to investigate the input-output function under the condition of dynamically altered frequency profiles.
Overall, SFM testing revealed improved temporal precision and across-trial reproducibility across the ANF-SBC synapse. (A) The upper panel (black) shows the SFM stimulus with a detail enlargement visualizing the dynamic frequency modulation. The dot-raster plot (lower panel) shows the activity of a representative SBC (CF = 1.8 kHz) to 200 stimulus repetitions with a differentiation between EPSPsucc (blue) and EPSPfail (gray). (B) Histogram of the discharge activity shown in A. Upper panel: blue = EPSPsucc, gray = EPSPfail, orange = ANF input, i.e. EPSPsucc+EPSPfail. Lower panel: The EPSPfail is also locked to the SFM but showed reduced fine structure compared to the ANF input. (C) Period histograms for the same cell as in A and B at different modulation frequencies (orange = ANF input, blue = SBC output). Design of the graph is identical to Figure 5C. Note the multiple peaks of the response in the period histogram. (D) Population data for 19 cells: Across all frequencies tested, the SBC output shows increased vector strength (left; p<0.001, two-way RM ANOVA), higher modulation depths (mid left; p<0.001, two-way RM ANOVA), and better across-trial reproducibility (mid right; p<0.001, two-way RM ANOVA) compared to its ANF input. The stimulus reproduction (CorrNorm) was consistently lower at the SBC level (right; p<0.001, two-way RM ANOVA). Markers indicate mean ± standard deviation.
-
Figure 6—source data 1
Metrics of temporal precision and reproducibility during SFM stimulation.
Shown are the vector strength, modulation depth, reproducibility and CorrNorm values for each modulation frequency separately for ANF input and SBC output. (n = 19).
- https://doi.org/10.7554/eLife.19295.014
Figure 7
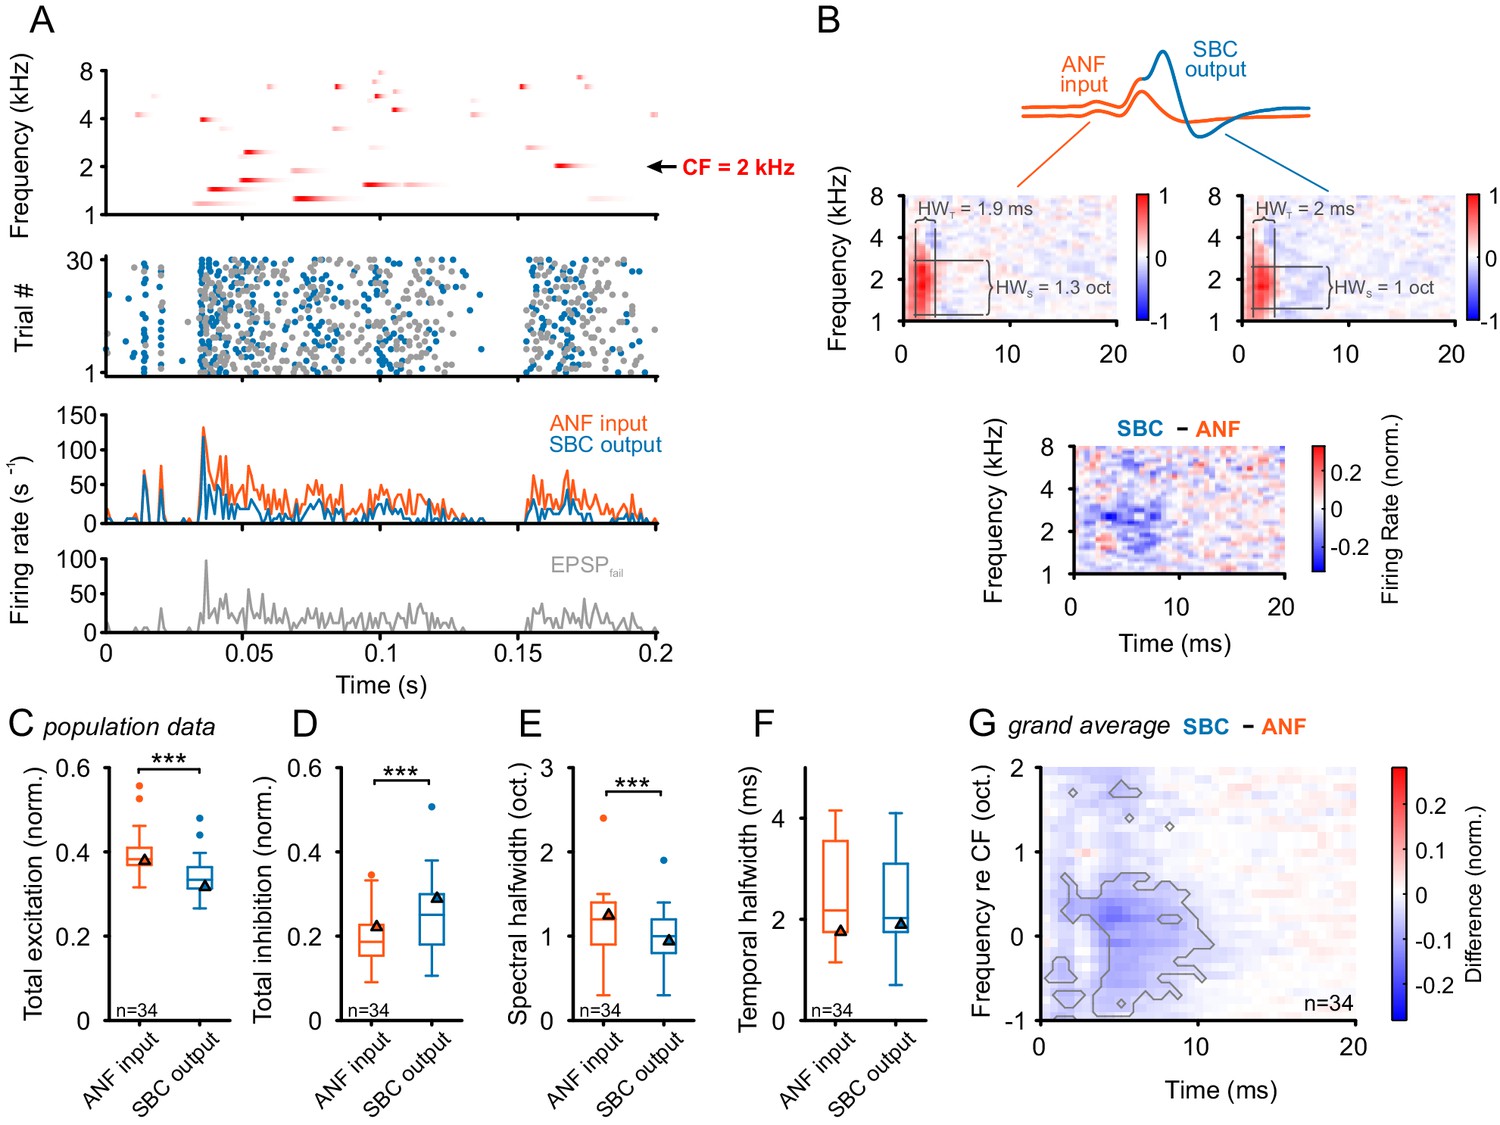
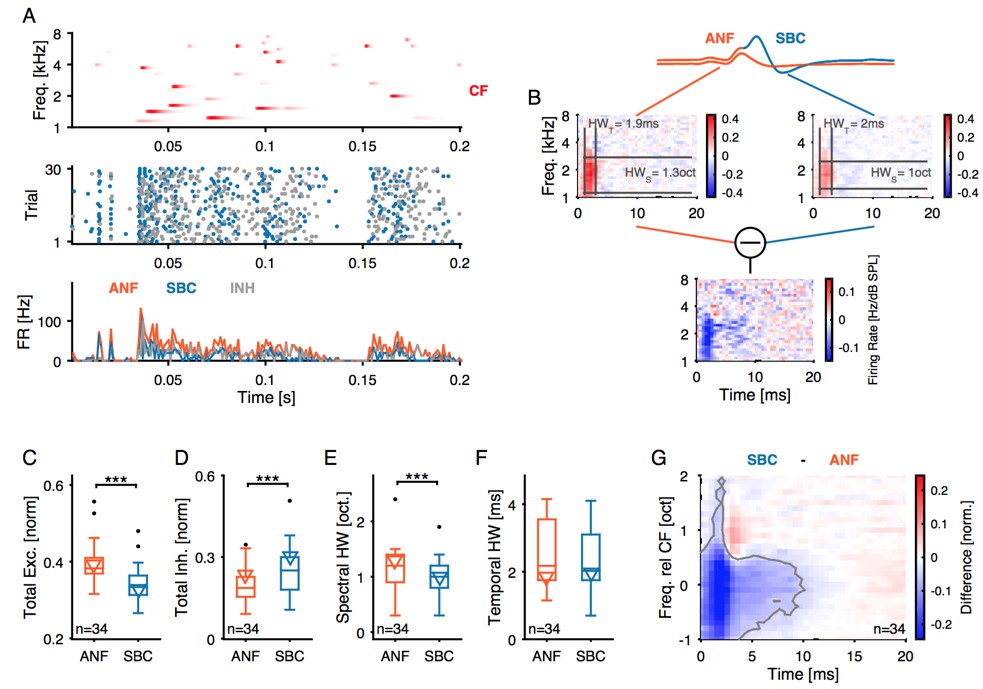
Input-output comparison of spectrotemporal receptive fields (STRF) indicates minor spectral sharpening and confirms broad, slow inhibitory action.
(A) Top panel: Randomized gamma-tone sequence (RGS, scaling of red color indicates stimulus levels with a maximum of 70 dB SPL, see Materials and methods for stimulus details) were used to estimate STRFs of SBC output and its ANF input. The RGS spanned one octave below and two octaves above the unit’s CF; in the present example 2 kHz. Second panel: Dot raster of discharges of an exemplary SBC evoked by 30 repetitive RGS presentations (blue = EPSPsucc, gray = EPSPfail). Third panel: PSTH of the recording shown above; the graph differentiates between the total of the ANF input (EPSPfail + EPSPsucc, orange) and SBC output (SBC APs, blue). Fourth panel: From the same recording the histogram of the EPSPs that fail to trigger an SBC AP (EPSPfail, gray). Note that EPSPs that elicited APs tended to be more prominent at the onset of excitatory response components. (B) STRF of the unit shown in A. Upper panel: Sketch of the two signal types, i.e. the totality of all EPSPs were considered to indicate the ANF input (orange), while EPSPs that generate an AP defined the SBC output (blue). Middle panel: corresponding STRFs. Note that there are clearly delineated areas of increased activity 2–3 ms after response-evoking stimulus components (red) which are distinct from areas with reduced activity. The spectrotemporal shape of the modulation at the ANF-SBC junction was quantified by the averaged difference-STRF. The STRFs of both ANF (left) and SBC (right) were computed separately and then subtracted (bottom panel). Relative temporal alignment was achieved by time-locking both ANF input activity and SBC output on the respective timing of maximum EPSP slope. The difference reveals changes in stimulus responsiveness in spectrotemporal coordinates. Negative values indicate a reduction in responsiveness, most likely caused by local inhibition. (C–G) Population data for all recorded SBCs (n = 34); triangles in the graphs indicate the respective values of the unit shown in A and B. (C) Stimulus-driven excitation was significantly reduced from the ANF input to SBC output, measured as the sum of all positive STRF bins (p<0.001, Wilcoxon signed rank test). (D) Stimulus-driven inhibition was significantly increased, measured by the negative sum of all negative STRF bins from the ANF input to SBC output (p<0.001, Wilcoxon signed rank test). (E) Spectral precision improved at the ANF-SBC junction, indicated by a reduced spectral half-width of the excitation (p<0.001 Wilcoxon signed rank test). (F) Temporal precision, estimated as the temporal half-width, was not changed between ANF input and SBC output (Wilcoxon signed rank test, p=0.16). (G) The average difference-STRF (n = 34 cells) exhibited a prominent and broad ( > 2 octaves) reduction around CF, which remained effective for ~10 ms (black line indicates significant deviation, adjusted for a false discovery rate < 0.01).
-
Figure 7—source data 1
Metrics of STRFs obtained with RGS stimulation.
Shown are the excitation, inhibition, spectral half width (in octaves), and temporal half width (in ms) obtained from the STRFs (n = 34).
- https://doi.org/10.7554/eLife.19295.016
Figure 8 with 1 supplement
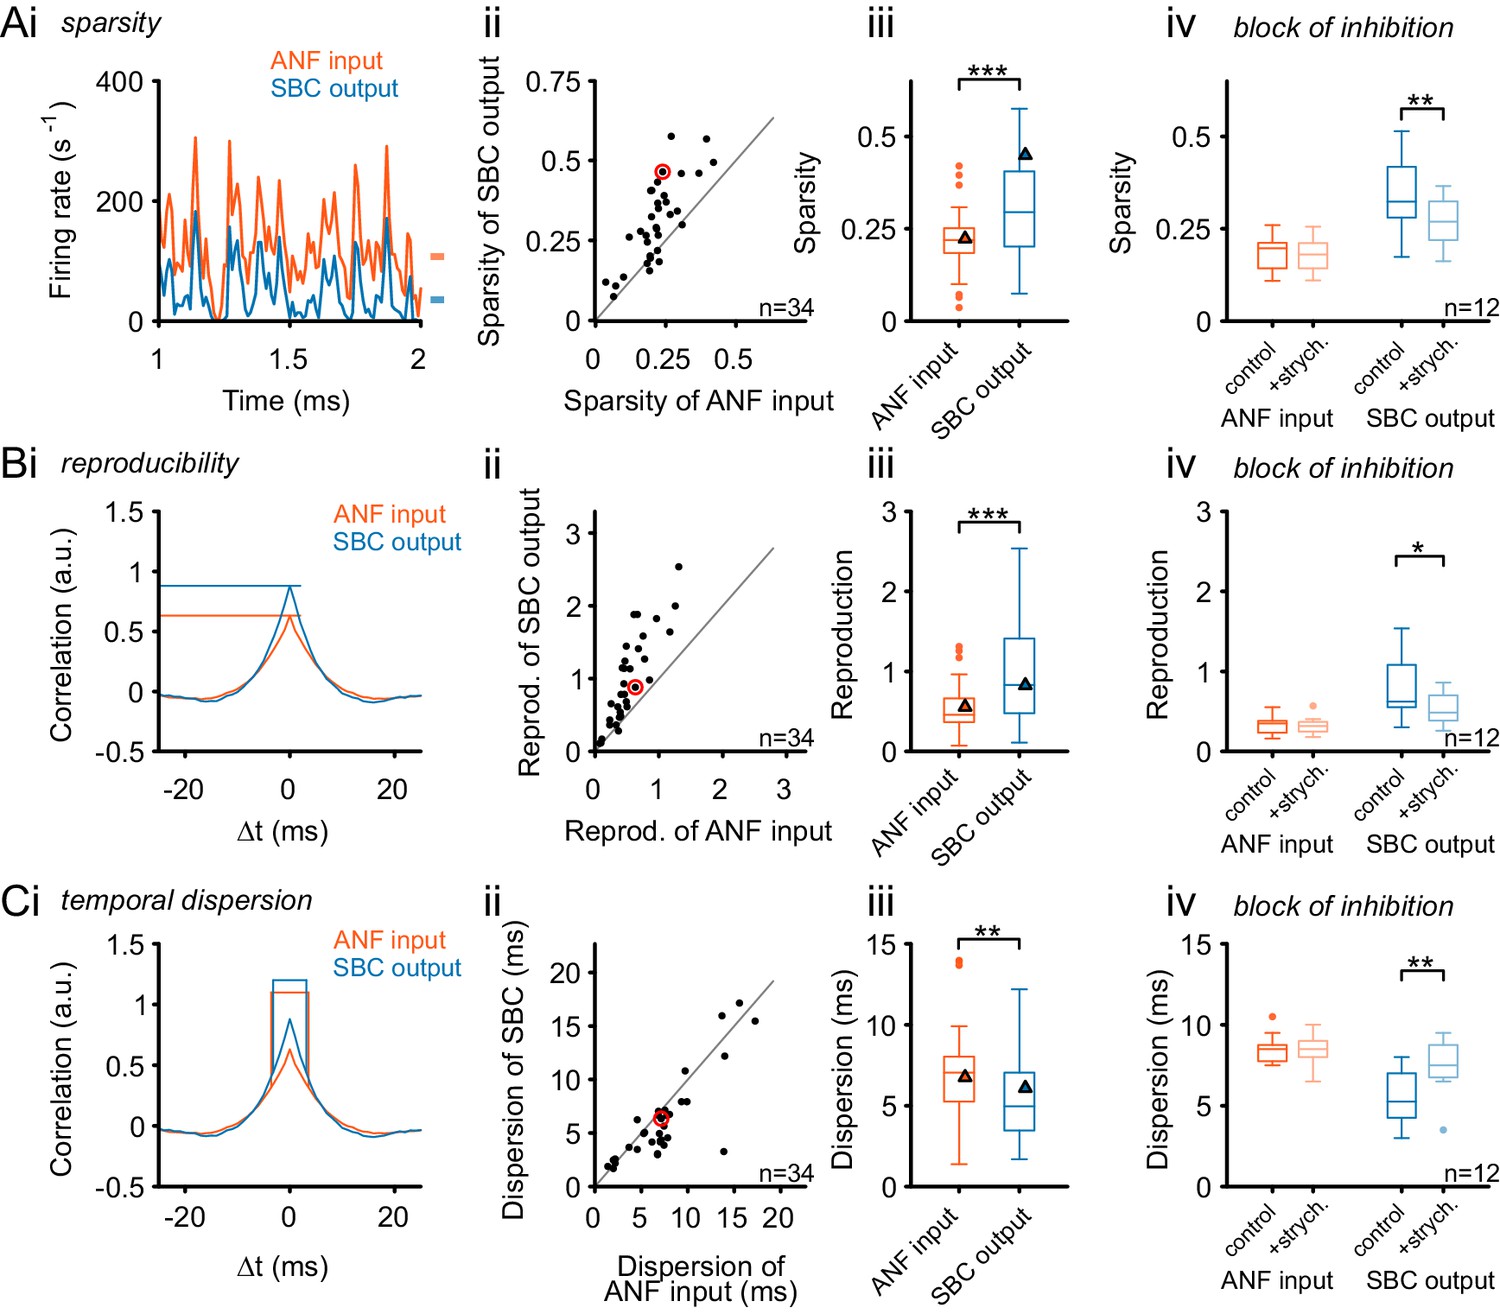
Inhibition renders the SBC responses sparse and increases across-trial reproducibility.
(A) (i) Representative recording during RGS stimulation (2 s-section displayed) shows significantly sparser SBC output activity (blue) than the ANF input activity (orange). Marks on the right indicate the mean firing rate for ANF input and SBC output. (ii) Population data for all recorded SBCs (n = 34). Quantification of sparsity as the variance of the normalized firing rates shows that this relation holds for almost all units (dots above line of equality; red mark indicates representative unit on the left) and (iii) results in highly significant input-output differences (p<0.001, Wilcoxon signed rank test; triangle indicates the representative unit on the left). (iv) Blocking glycinergic inhibition in vivo by strychnine (n = 12) deteriorated the improved sparsity of the SBC output and rendered it similar to the ANF input (p<0.01, Wilcoxon signed rank test), while the ANF input remained unchanged. (B) The reproducibility of the response improved from ANF input to SBC output. Reproducibility was calculated as the time-aligned correlation between the neuron’s responses to identical stimulus trials. High reproducibility indicates that the neural response is more constant across trials. (i) In the representative unit, higher reproducibility is seen for the SBC output (blue) compared to the ANF input (orange). (ii) Population data (n = 34) shows that the same relation holds for almost all units (data point marked in red indicates the unit shown on the left), and (iii) the statistical analysis yielded a high significant input-output difference (p<0.001, Wilcoxon signed rank; triangles indicate the respective values from the exemplary unit). (iv) Application of strychnine impoverished reproducibility in the SBC output (light blue) significantly compared to the control condition (dark blue; p<0.01, Wilcoxon signed rank test). The reproducibility of the ANF input (orange) was not influenced by blocking the inhibition (light orange). (C) The temporal dispersion for repetitive acoustic stimulation decreased from the ANF input to SBC output. The temporal dispersion was quantified as the half-width of the cross-correlation within each signal across trials (i). Population analysis showed improved temporal precision, i.e. reduced half-width/dispersion in the SBC output compared to the ANF input in most of the tested cells (ii, iii, same color coding as above, p<0.01, Wilcoxon signed rank test). As above, blocking inhibition increases temporal dispersion of the SBC output to the level of the ANF input (iv, p<0.01, Wilcoxon signed rank test).
-
Figure 8—source data 1
Sparsity, reproducibility and temporal dispersion for ANF input and SBC output.
Shown are the sparsity, reproducibility, and temporal dispersion (in ms) separately for ANF input and SBC output for both control condition (n = 34) and during the block of glycinergic inhibition (n = 12).
- https://doi.org/10.7554/eLife.19295.018
Figure 8—figure supplement 1
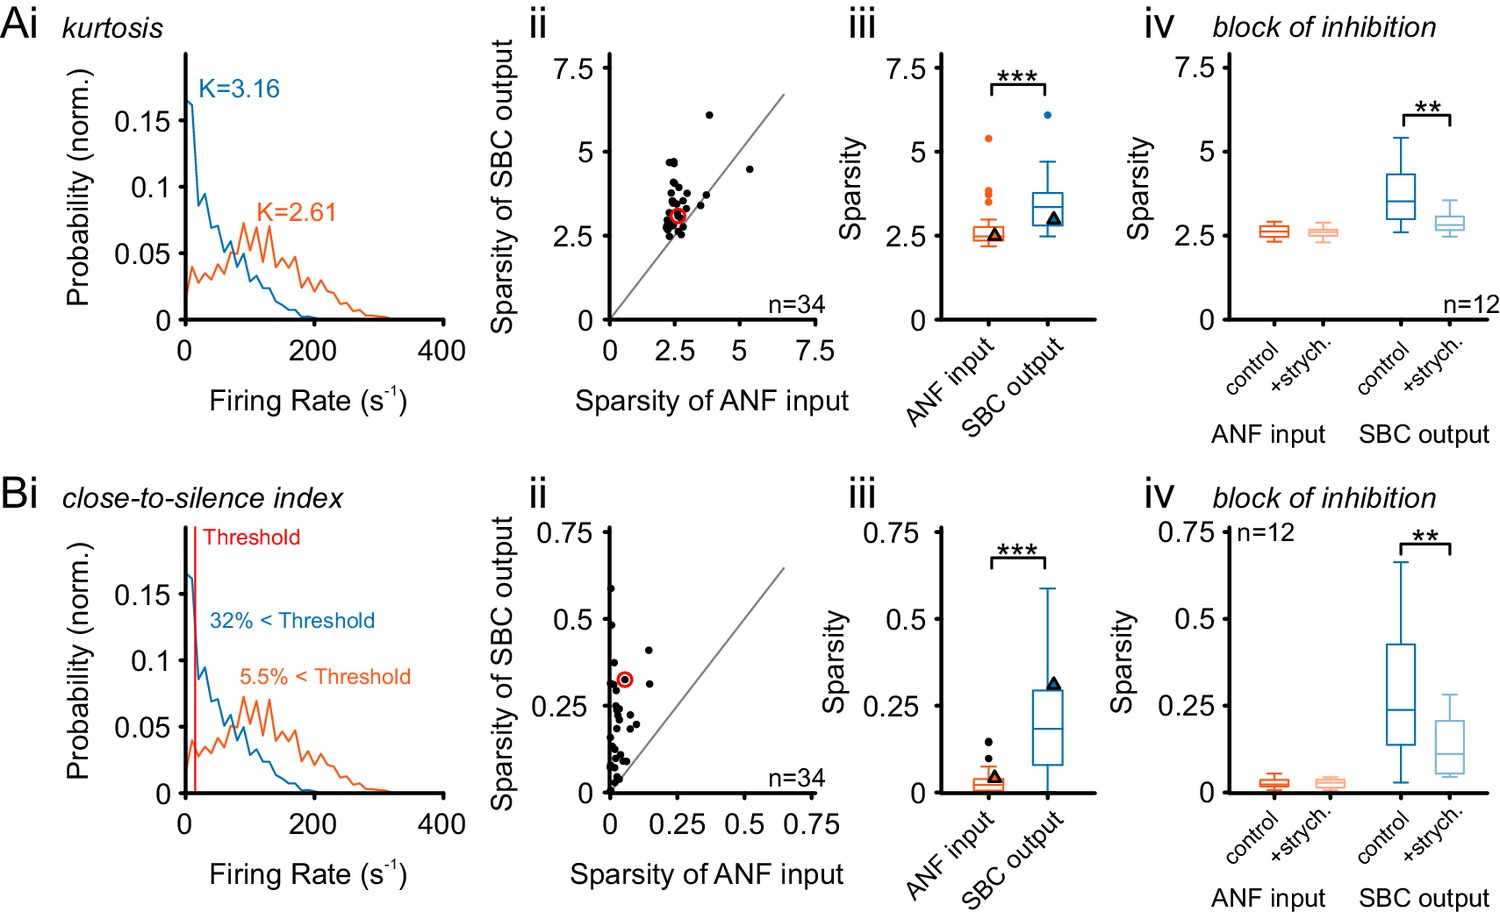
Alternative measures of temporal sparsity lead to consistent results.
Temporal sparsity can be quantified with different measures. While Sparsity was quantified using a popular variance-related measure (Rolls and Tovee, 1995) in Figure 8, other measures lead to consistent results (see Materials and methods for details). (A) A classical measure – kurtosis of the firing rate distribution over time – is evaluated (Field, 1994), indicated as K in Ai for both ANF and SBC). As before the sparsity of SBCs is higher than for ANFs, for the large majority of cells, and thus highly significant on the population level (p<0.001, Wilcoxon signed rank test; triangle indicates example unit on the left). All conventions as in Figure 8. (B) We defined an easily interpretable measure, the ‘Close-to-Silence-Index’ (CSI), which simply quantifies which fraction of firing rate bins are above a certain threshold firing rate (here: Threshold = 15 Hz was chosen). As for the other two measures, sparsity measured by CSI was significantly larger for SBCs than for ANF (p<0.001, Wilcoxon signed rank test). All conventions as in Figure 8.
Figure 9 with 2 supplements
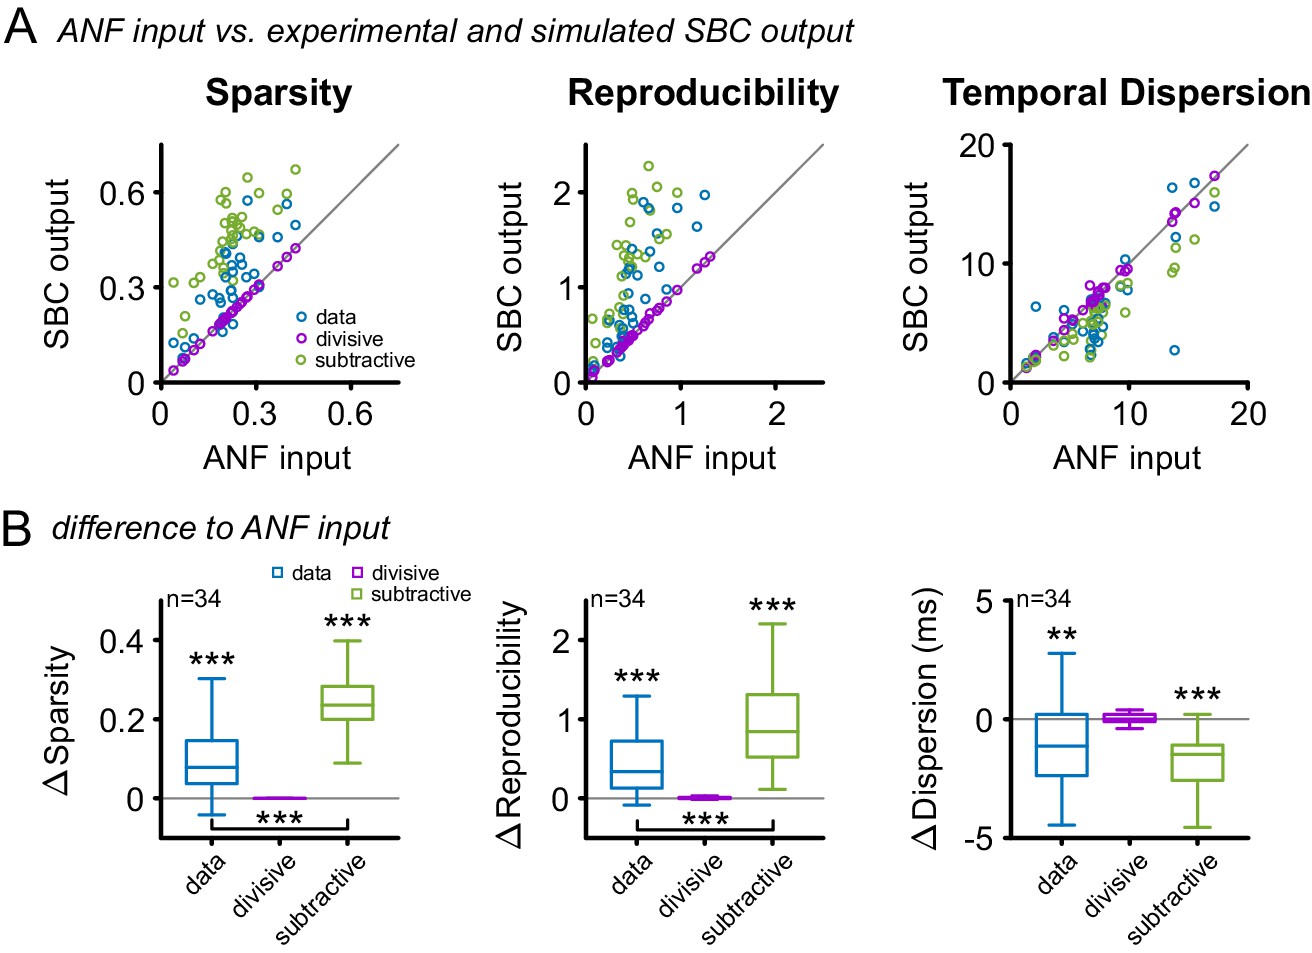
Subtractive inhibition, but not divisive inhibition can account for the improvement in sparsity, reproducibility, and temporal precision.
(A) In response to the RGS stimulus, the SBC output (blue) showed a consistent increase in sparsity (left), reproducibility (middle) and decreased temporal dispersion (right). The simulated subtractive inhibition (green) showed similar improvements as the experimental data, while divisive inhibition (purple) had no effect on sparsity, reproducibility, and temporal dispersion. (B) These relations are also reflected in the population data, with significant changes in both the experimental data and the simulated subtractive inhibition (p<0.001, one-way RM ANOVA).
-
Figure 9—source data 1
Simulation of divisive and subtractive inhibition.
Shown are the values of sparsity, reproducibility and temporal dispersion (in ms) obtained from the simulation of pure subtractive or pure divisive inhibition. The data set also contains the experimentally obtained data separately for ANF input and SBC output.
- https://doi.org/10.7554/eLife.19295.021
Figure 9—figure supplement 1
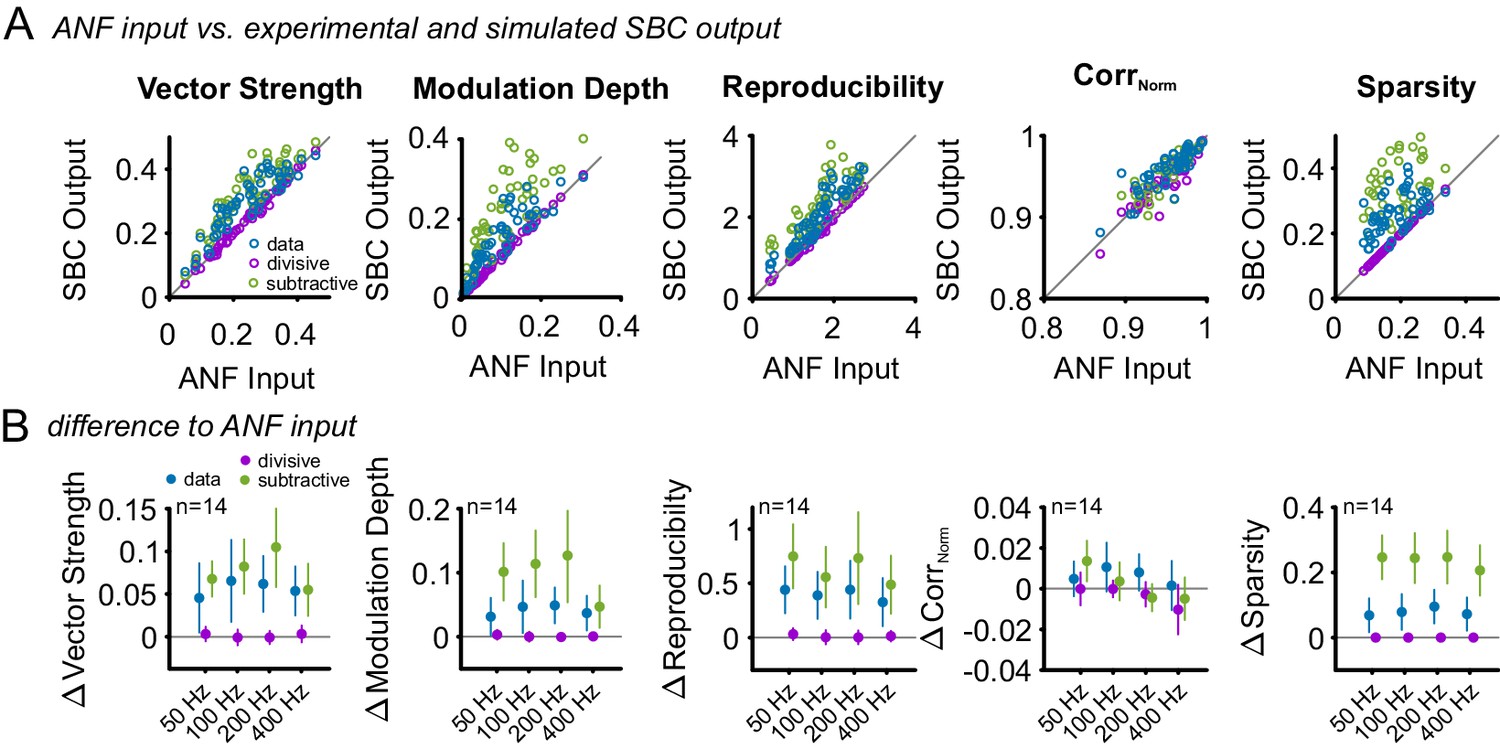
Subtractive inhibition improves temporal precision and trial-to-trial reproducibility during SAM stimulation.
To test, if the subtractive or divisive effect of inhibition are sufficient to explain the observed increase in temporal precision and reproducibility of the SBC output, the ANF input was compared to the experimental SBC output data and simulated SBC outputs caused by either subtractive or divisive inhibition. For the simulated SBC output, the ANF input spikes were removed to match the experimentally observed failure fraction. (A) Vector strength, modulation depth, reproducibility stimulus reproduction (CorrNorm), and sparsity of the ANF input was compared to the experimental data (blue) and the simulated SBC output influenced by either divisive (purple) or subtractive (green) inhibition Pure divisive inhibition had no effect on temporal precision or reproducibility (dots on line of equality, gray). Pure subtractive inhibition matched the experimental data well and showed an increase in vector strength, modulation depths, reproducibility, and sparsity of the SBC output (dots above line of equality). (B) Population data showing the difference between ANF input and SBC output for the experimental (blue) and simulated divisive (purple) and subtractive inhibition (green) for different modulation frequencies. The experimental SBC output showed increased vector strength, modulation depth, reproducibility, and sparsity for all modulation frequencies. This change was also observed under simulated divisive inhibition, but absent for pure subtractive inhibition. Markers indicate mean ± standard deviation.
Figure 9—figure supplement 2
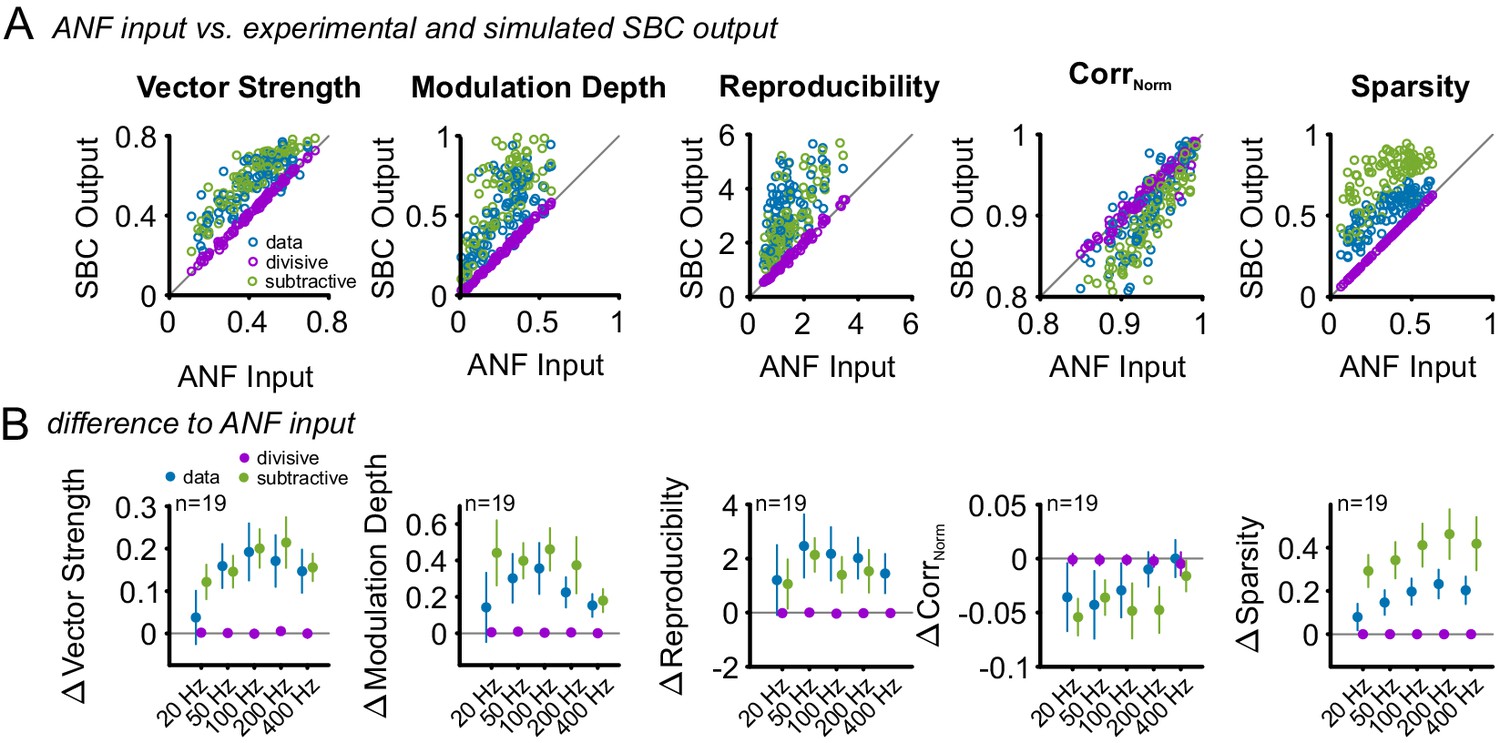
Subtractive inhibition, but not divisive inhibition can account for the improved temporal precision and reproducibility during SFM stimulation.
Similar to the SAM analysis, the effect of an increased failure fraction during SFM stimulation was simulated as purely divisive or subtractive inhibition and compared to the experimental data. (A) Pooled data across all modulation frequencies. The experimental data showed an increase in vector strength, modulation depths, reproducibility, and sparsity of the SBC output (blue dots above line of equality, gray). This change was present only for the simulated subtractive inhibition but absent for pure divisive inhibition. (B) Population data showing the difference between ANF input and SBC output for the experimental (blue) and simulated divisive (purple) and subtractive inhibition (green) for different modulation frequencies. The experimental SBC output showed increased vector strength, modulation depth and reproducibility for all modulation frequencies. This change was well matched by pure subtractive inhibition, but absent at pure divisive inhibition. The stimulus reproduction (CorrNorm) decreased in the experimental SBC output and the simulated subtractive inhibition but remained unchanged for pure divisive inhibition. Markers indicate mean ± standard deviation.
Author response image 1
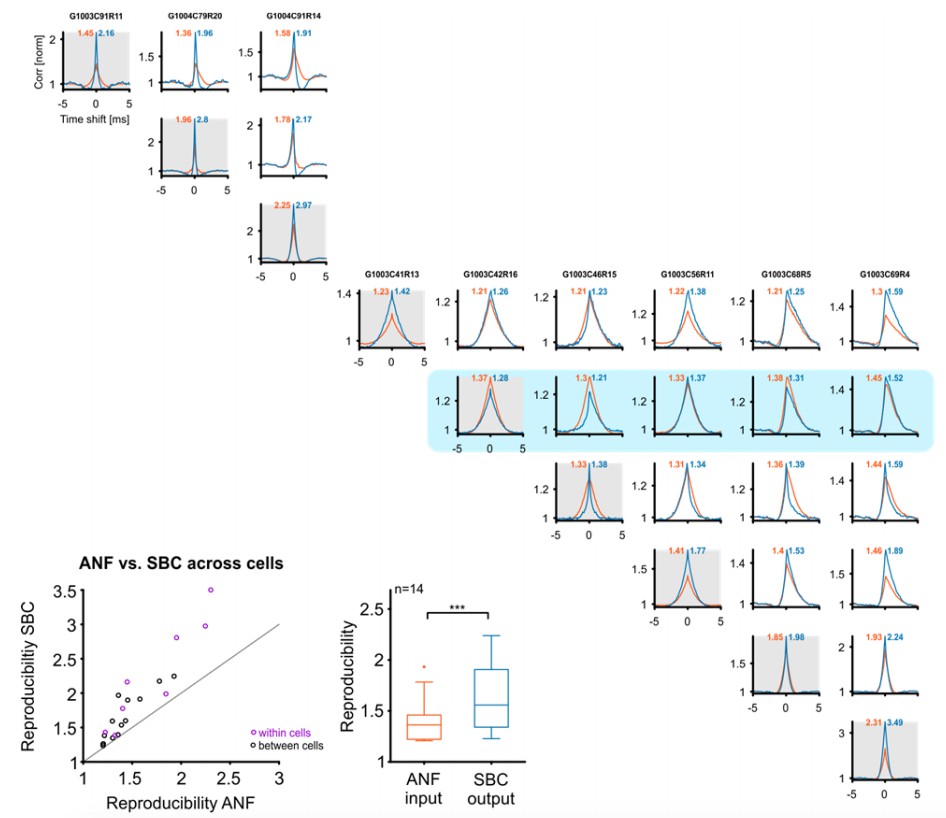
Reproducibility of the SBC output also improves across cells, if these are well matched in their CF and stimulus.
Top/right: Cross-correlograms between ANF input (orange) and SBC output (blue) across pairs of cells (columns and rows enumerate the cells, diagonal is the same cell (gray background), for comparison). Our sample contained 9 cells (one group of 3, and one of 6 cells), which were stimulated with the identical RGS stimulus, giving a total of 18 across pairs. One of the cells did not show an improvement in reproducibility (with itself) and correspondingly did also not show an improvement with other cells (blue background). Since the reviewers asked about improvements in reproducibility, this cell is excluded from the population analysis below. Bottom left: Reproducibility between ANF input and SBC output within (purple) and between (black) cells. Reproducibility also increased between different cells with similar tuning properties (dots above line of equality). Bottom middle: Population data indicate a significant increase in reproducibility of the SBC output compared to the ANF input between cells (p<0.001, n=14, Wilcoxon signed rank test.
Author response image 2
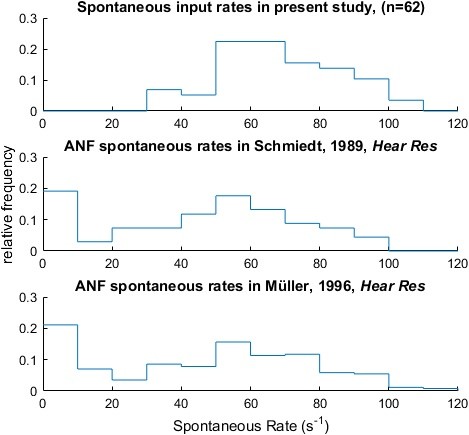
The experimentally determined ANF input (top) showed spontaneous rates consistent with previously published auditory nerve recordings of the Mongolian Gerbil (middle & bottom; data extracted from Figure 7 in Schmiedt (Hearing Research, 1989) and from Figure 3 in Mueller (Hearing Research, 1996) respectively).
https://doi.org/10.7554/eLife.19295.025
Author response image 3
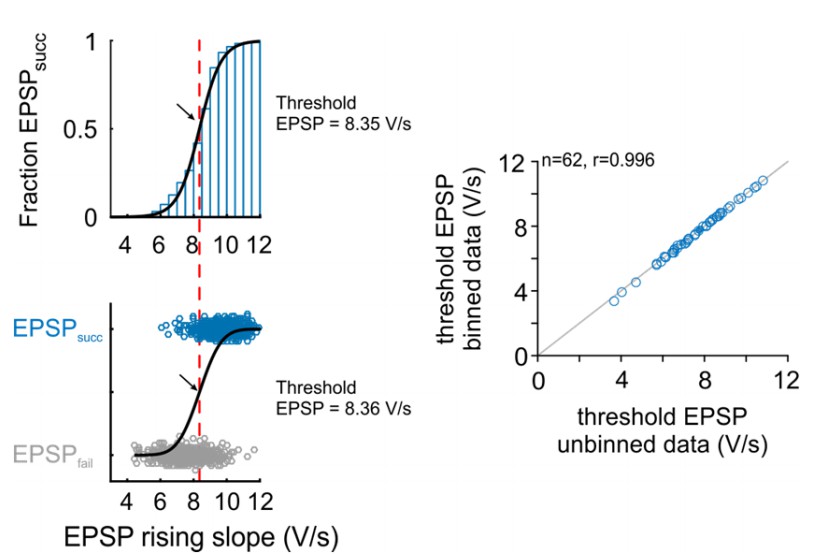
Comparison of threshold EPSP estimation methods: Right: Representative cell.
The version in the revised manuscript is based on the probability distribution of EPSPsucc as a function of binned EPSP slope (top). The original version was based on a unbinned binary distribution between the EPSPsucc and EPSPfail (bottom). Black arrow and red line indicate estimated threshold EPSP. Right: Population data for 62 cells show that both methods provide almost identical estimation for threshold EPSP.
Author response image 4
Download links
A two-part list of links to download the article, or parts of the article, in various formats.
Downloads (link to download the article as PDF)
Open citations (links to open the citations from this article in various online reference manager services)
Cite this article (links to download the citations from this article in formats compatible with various reference manager tools)
Inhibition in the auditory brainstem enhances signal representation and regulates gain in complex acoustic environments
eLife 5:e19295.
https://doi.org/10.7554/eLife.19295


