CPEB4 is regulated during cell cycle by ERK2/Cdk1-mediated phosphorylation and its assembly into liquid-like droplets
- Institute for Research in Biomedicine, Spain
- The Barcelona Institute of Science and Technology, Spain
- Institució Catalana de Recerca i Estudis Avançats, Spain
Figures
Figure 1 with 1 supplement
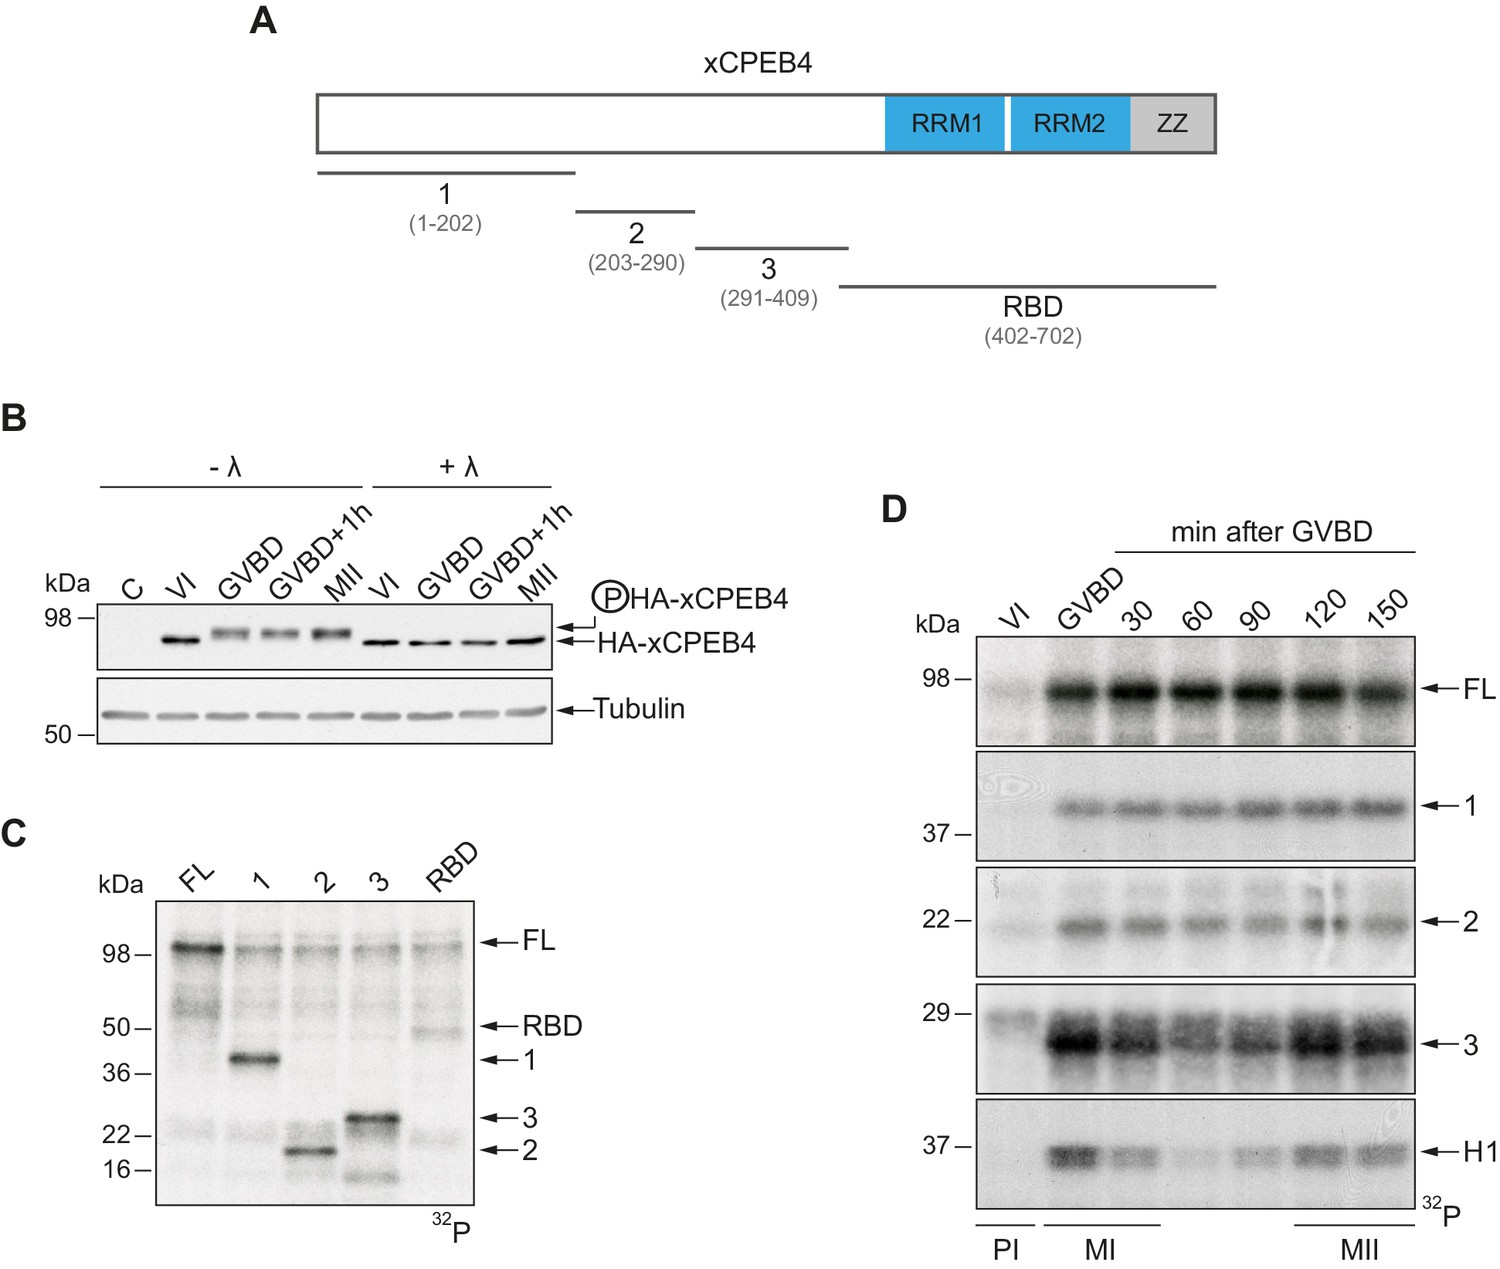
xCPEB4 NTD is phosphorylated in response to progesterone.
(A) Schematic representation of xCPEB4 protein. The four protein fragments generated are: 1, from amino acid (aa) 1 to 202; 2, from aa 203 to 290; 3, from aa 291 to 409; and RBD, from aa 402 to 702. RRMs are shown in blue and the ZZ domain, in grey. (B) Lambda-phosphatase assay (λ) of oocytes overexpressing HA-xCPEB4 collected at the indicated times (VI, prophase I; GVBD, germinal vesicle breakdown; MII, metaphase II). Western blots with anti-HA antibody and anti-tubulin (as a loading control) are shown. C, control, corresponds to non-injected oocytes. (C) In vitro kinase assay of recombinant xCPEB4, full-length (FL) or the fragments 1, 2, 3 or RBD, using metaphase II oocyte extracts as the source of kinases (autoradiography, 32P). (D) Time course of the in vitro kinase assay of recombinant xCPEB4, FL or fragments (1, 2 and 3), using oocyte extracts collected at the indicated times (autoradiography, 32P). Histone H1 phosphorylation was used to follow Cdk1 activity. Three independent biological replicates were performed, with equivalent findings each time. See also Figure 1—figure supplement 1.
Figure 1—figure supplement 1
Loading controls for in vitro kinase assays.
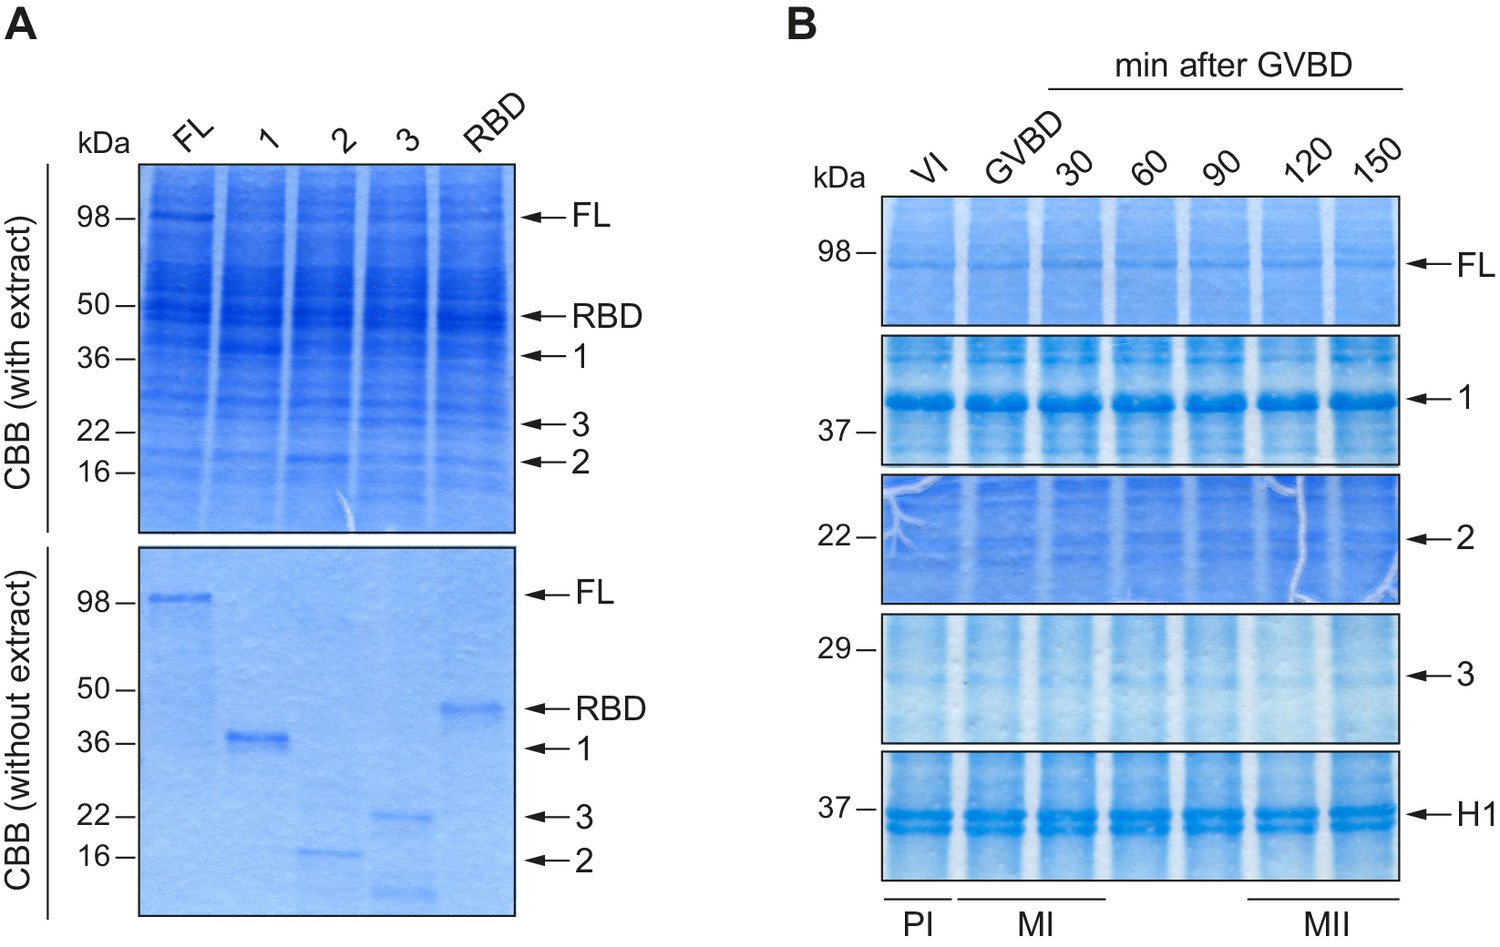
(A) Loading control for Figure 1C. Upper panel corresponds to the Coomassie blue–stained gel (CBB with extract). In the lower panel, equivalent protein amounts used in the assay were loaded for a clearer loading control (CBB without extract). (B) Loading control for Figure 1D, in a Coomassie blue–stained gel.
Figure 2 with 4 supplements
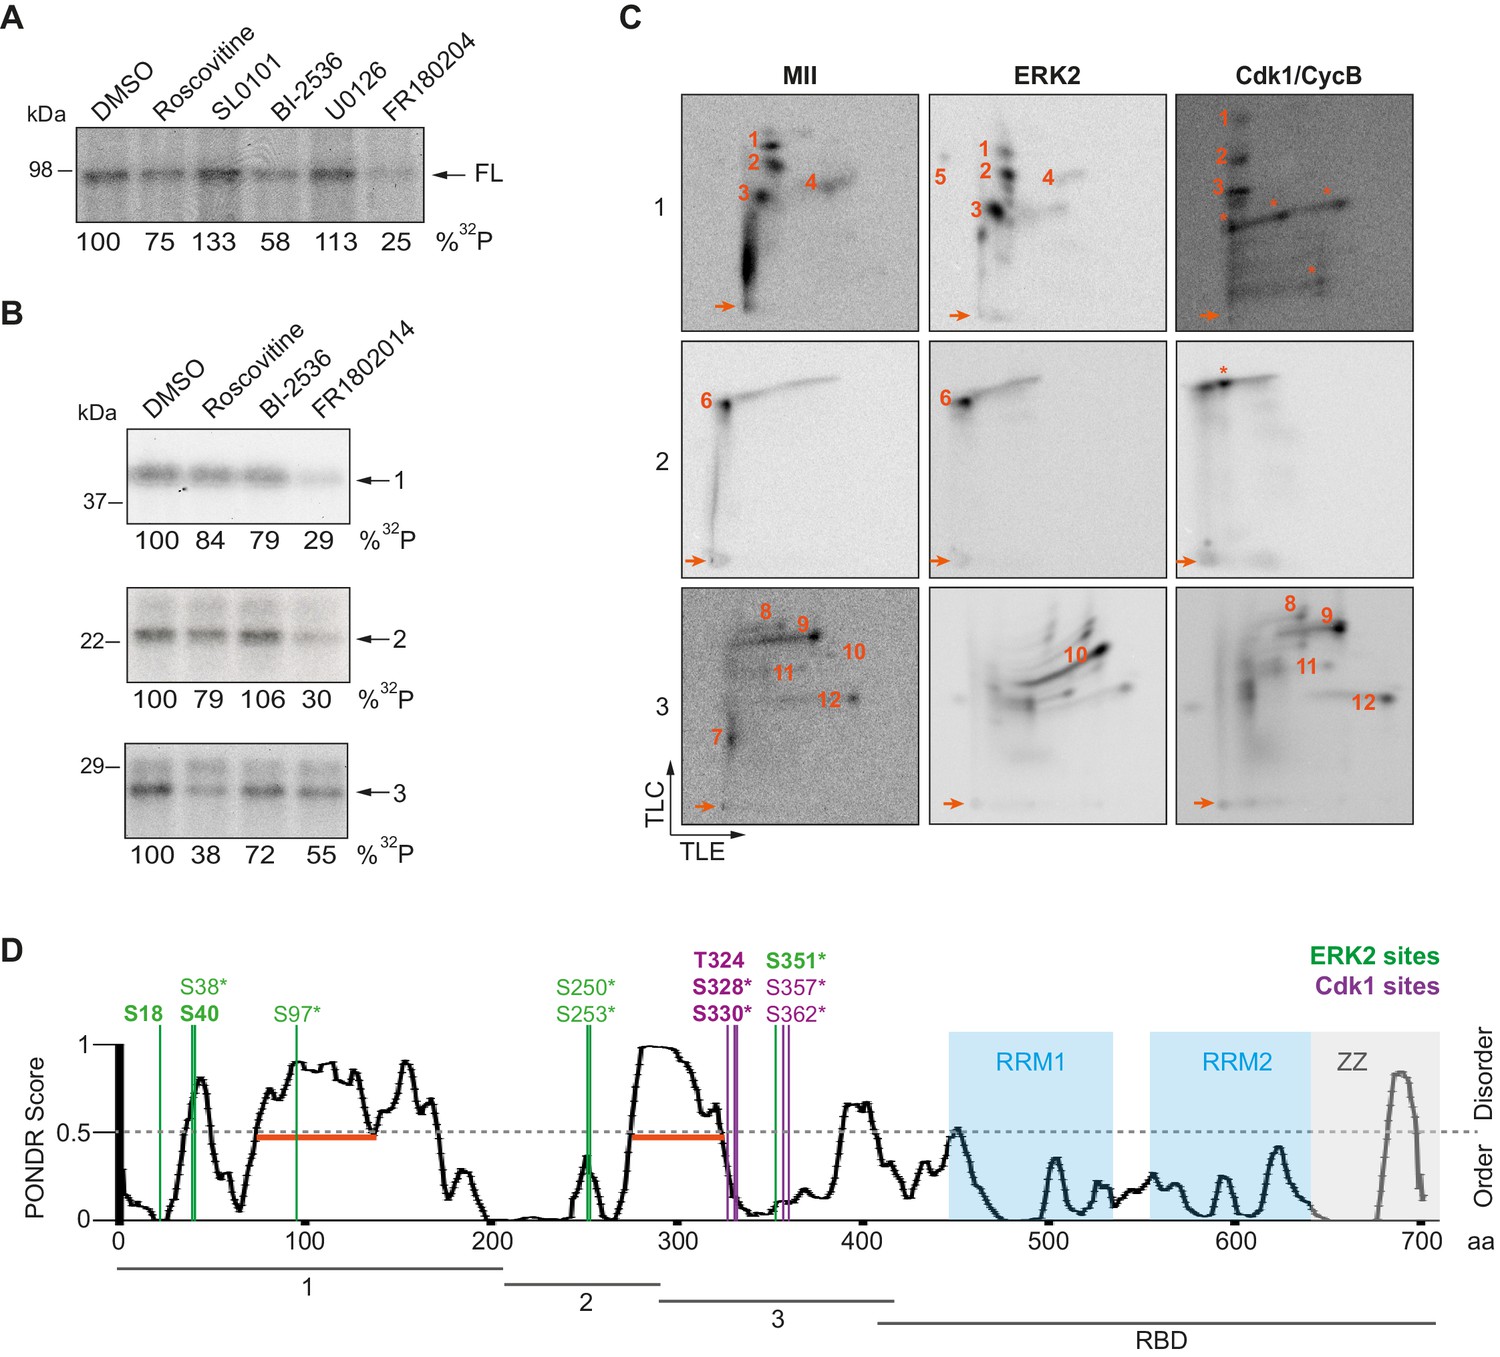
ERK2 and Cdk1 phosphorylate the xCPEB4 NTD.
(A, B) In vitro kinase assay of (A) recombinant FL xCPEB4 or (B) fragments (1, 2 and 3) with metaphase II oocyte extracts treated with specific kinase inhibitors (roscovitine, Cdk inhibitor; SL0101, p90Rsk inhibitor; BI-2536, Plk1 inhibitor; U0126, MEK inhibitor; and FR180204, ERK inhibitor). DMSO was used as a negative control. The percentage of phosphorylation compared to DMSO is indicated (autoradiography, 32P). A representative experiment from three independent biological replicates is shown. See also Figure 2—figure supplement 1–2. (C) Two-dimensional phosphopeptide maps of xCPEB4 fragments (1, 2 and 3) phosphorylated with metaphase II (MII) oocyte extracts or with recombinant ERK2 or Cdk1/cyclin B. Phosphopeptides were resolved by thin-layer electrophoresis (TLE) followed by thin-layer chromatography (TLC). Arrows indicate sample origin. Phosphopeptides detected in MII were numbered. Asterisks (*) indicate phosphopeptides generated with recombinant kinases not present in MII. A representative experiment from three independent biological replicates is shown. See also Figure 2—figure supplement 3. (D) Disorder tendency (PONDR VL-TX predictor) and mass spectrometry phosphorylation site identification of xCPEB4. Asterisks (*) indicate phosphosites identified with MII extracts. Bold letters indicate phosphosites identified with either ERK2 or Cdk1/cyclin B. Green indicates ERK2 phosphorylation sites, while purple indicates Cdk1 phosphorylation sites. Red lines represent large disordered regions. The xCPEB4 fragments used are outlined. See also Figure 2—figure supplement 4.
Figure 2—figure supplement 1
Loading controls for in vitro kinase assays with inhibitors.
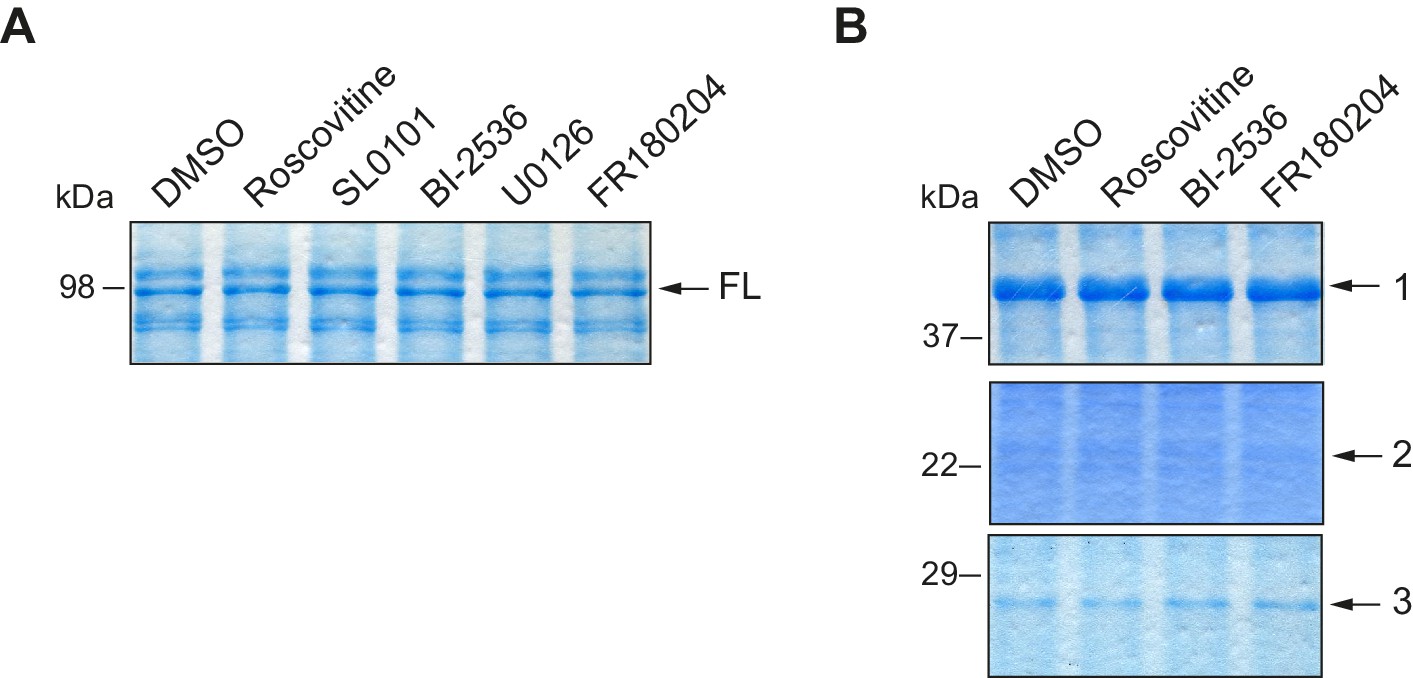
(A) Loading control for Figure 2A, in a Coomassie blue–stained gel. (B) Loading control for Figure 2B, in a Coomassie blue–stained gel.
Figure 2—figure supplement 2
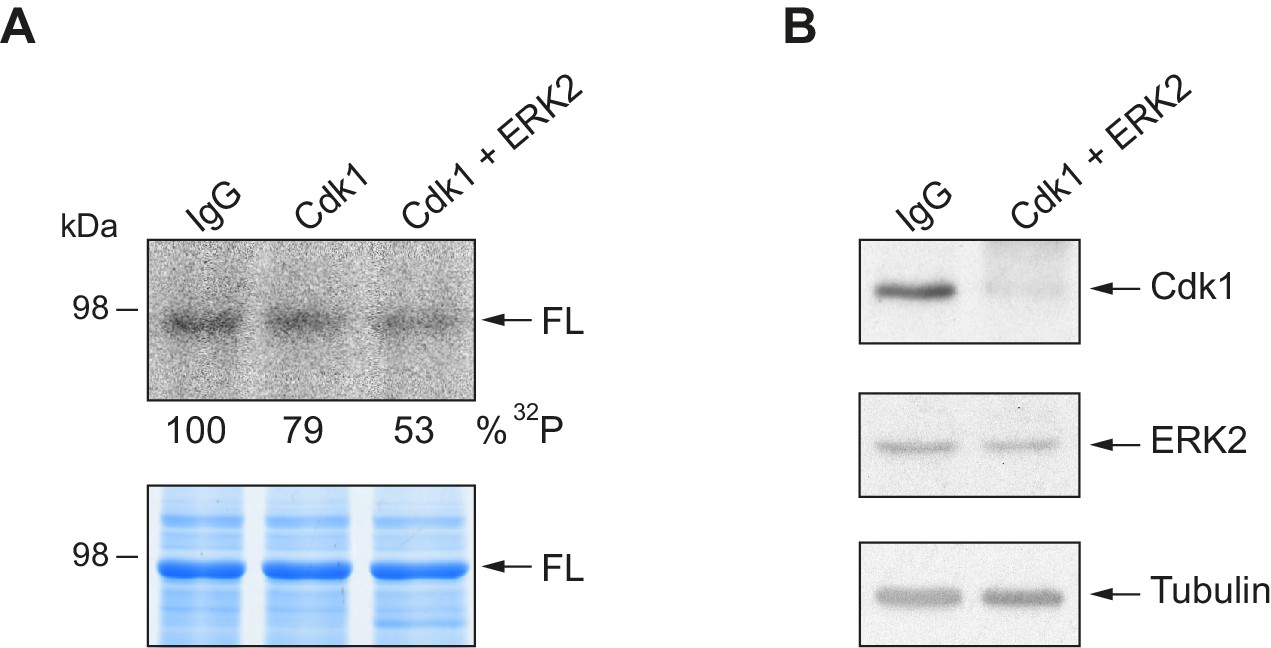
In vitro kinase assay with Cdk1 and ERK2 immunodepleted extracts.
(A) In vitro kinase assay of recombinant xCPEB4 full-length protein (FL), using metaphase II oocyte extracts immunodepleted for Cdk1 or Cdk1/ERK2. IgG was used as negative control. The upper panel shows the autoradiography (32P), while the lower panel shows the loading control in a Coomassie blue-stained gel. (B) Western blot showing the efficiency of depletion of Cdk1 and ERK2. Tubulin was used as a loading control.
Figure 2—figure supplement 3
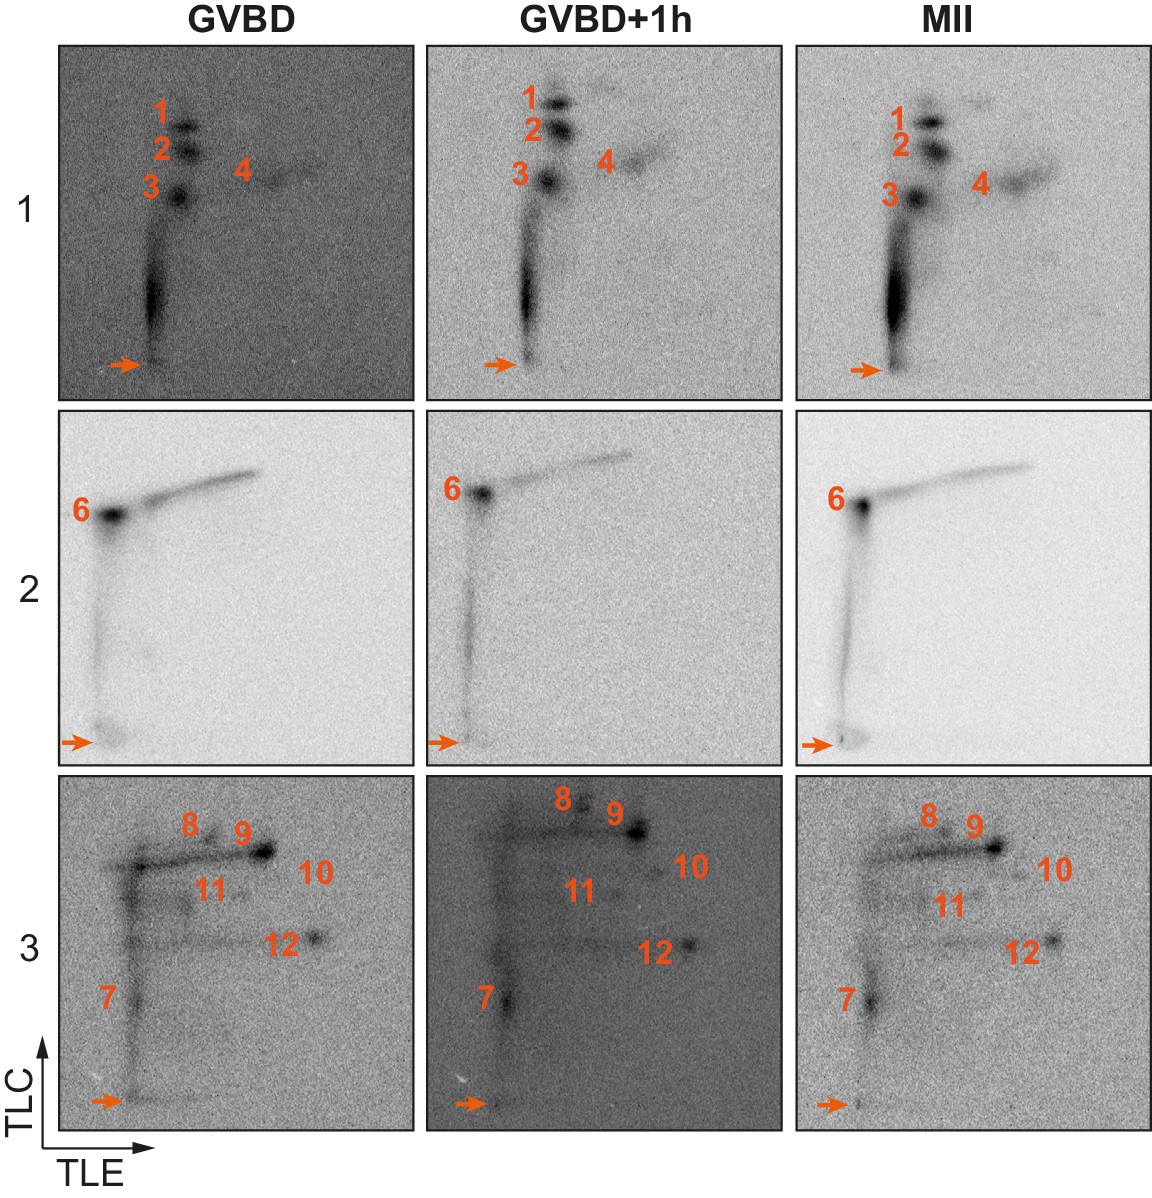
Two-dimensional phosphopeptide maps kinetic.
Two-dimensional phosphopeptide maps of xCPEB4 fragments (1, 2 and 3) phosphorylated with oocytes extracts collected at indicated times (GVBD, germinal vesicle breakdown; MII, metaphase II). Phosphopeptides were resolved by thin-layer electrophoresis (TLE) followed by thin-layer chromatography (TLC). Arrows indicate sample origin. Phosphopeptides are numbered. Three independent biological replicates were performed, with equivalent findings each time.
Figure 2—figure supplement 4

Confirmation of detected phosphosites.
(A, B) Two-dimensional phosphopeptide maps of xCPEB4 fragments (1, 2 and 3), wild-type (WT) or phosphorylation mutants, phosphorylated with (A) metaphase II oocyte extract or (B) recombinant ERK2 or Cdk1/cyclin B. Phosphopeptides were solved by TLE followed by TLC. Arrows indicate sample origin. Phosphopeptides detected in WT conditions are numbered. Asterisks indicate unspecific phosphopeptides present only in xCPEB4 mutants. The mutations are specified at the bottom of panel A. (C) Lambda-phosphatase assay (λ) using extracts from oocytes overexpressing HA-CPEB4 collected at the indicated times (VI, prophase I; MII, metaphase II). Wild-type (WT) HA-CPEB4 and the 12A mutant (with 12 phosphorylation sites mutated to alanine) were analysed. The phosphorylation status of xCPEB4 was determined by western blot with anti-HA antibody and anti-tubulin (as a loading control). The control, C, corresponds to non-injected oocytes. Three independent biological replicates were performed, with equivalent findings each time.
Figure 3 with 4 supplements
xCPEB4 hyperphosphorylation is required for cytoplasmic polyadenylation and meiotic progression.
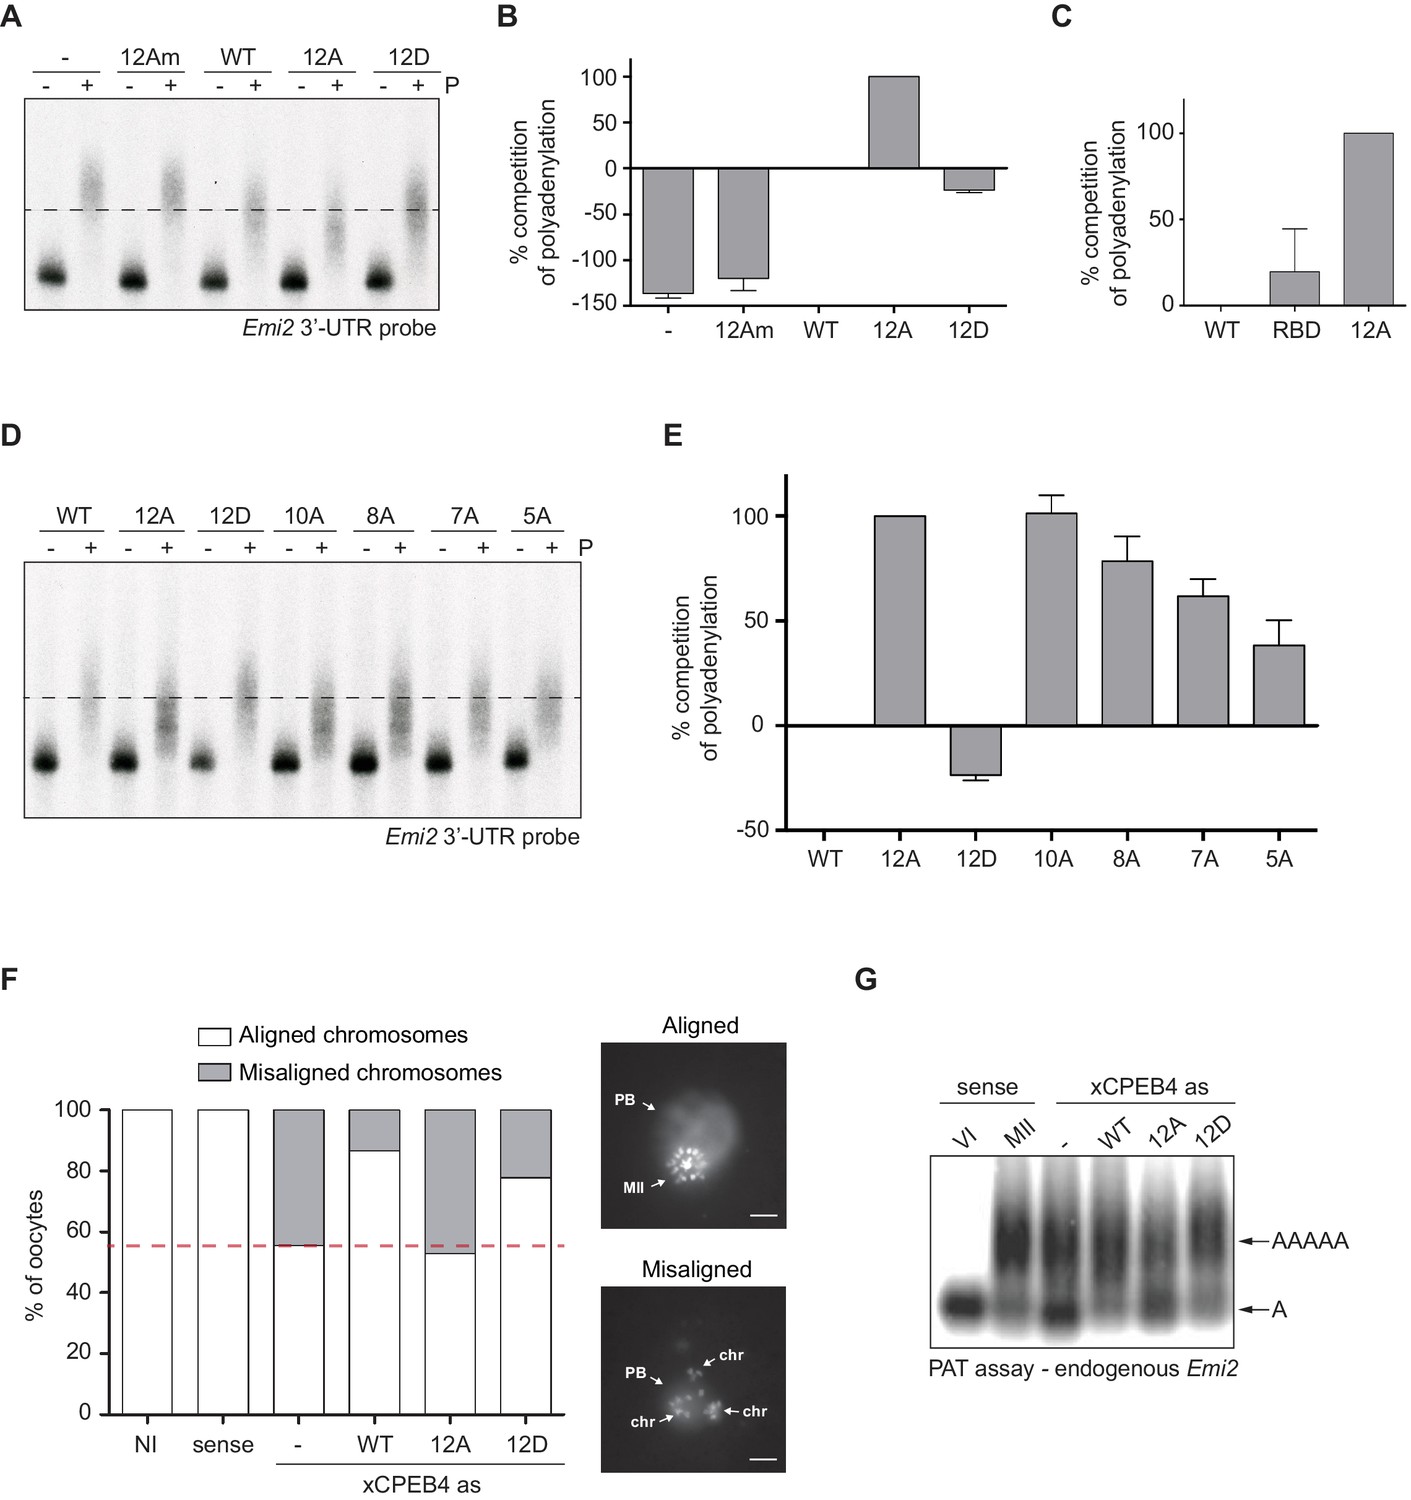
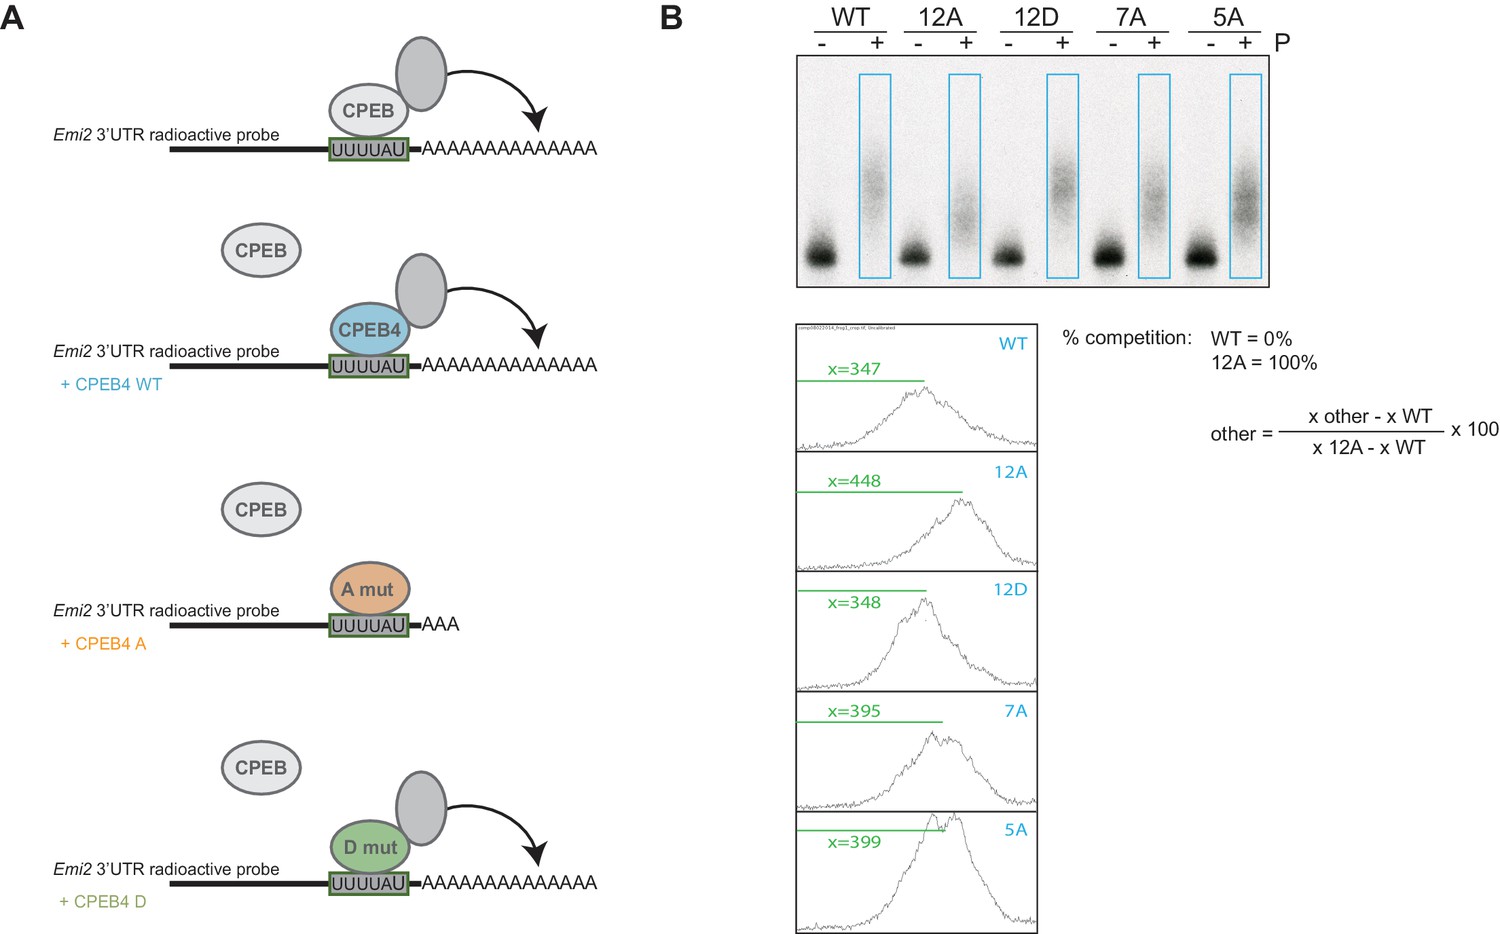
(A–E) In vivo competition assays. (A, D) Emi2 3′-UTR radioactive probe polyadenylation in the absence (–) or presence (+) of progesterone (P) in oocytes overexpressing wild-type (WT) HA-xCPEB4 or the following mutants: 12A or 12D, which have the 12 phosphosites mutated to alanine or aspartic acid, respectively; 12Am, 12A mutant with two additional mutations that disrupt RNA binding in the RBD; 10A, with all the identified phosphosites except S18 and S40 mutated to alanine; 8A, with S250/253/T324/S328/330/351/357/362 mutated to alanine; 7A, with ERK2 phosphosites mutated to alanine; 5A, with Cdk1 phosphorylation sites mutated to alanine. The dashed line marks the median polyadenylation in the WT. (B, C, E) Percentage of competition of polyadenylation calculated from three independent biological replicates. Results are shown as means and SEM. See also Figure 3—figure supplement 1–2. (F, G) Rescue experiment. Oocytes were injected with xCPEB4 sense or antisense (as) oligonucleotides (NI, non-injected oocytes). After 16 hr, oocytes were injected with mRNAs encoding WT HA-xCPEB4 or the 12A or 12D phosphorylation mutants. (F) Oocytes were collected at metaphase II, fixed and stained with Hoechst. A representative image of each phenotype observed, with aligned or misaligned chromosomes, is shown (PB, first polar body; MII, second metaphase plate; chr, misaligned chromosomes). The percentage of oocytes with each phenotype is plotted in the graph (n = 10). The red line marks the percentage of oocytes with aligned chromosomes in the antisense condition. Scale bar, 10 µm. A representative experiment from three independent biological replicates is shown. (G) RNA from metaphase II oocytes was extracted and the polyadenylation status of endogenous Emi2 mRNA was measured by Poly(A) tail (PAT) assay followed by Southern blot. See also Figure 3—figure supplement 3, Figure 3—figure supplement 4.
Figure 3—figure supplement 1
Experimental design and analysis of the competition experiment.
(A) Schematic diagram of the competition experiment. Wild-type xCPEB4 (blue) or phospho-null ('A mut'; in orange) or phospho-mimetic ('D mut'; in green) mutants were overexpressed in X. laevis oocytes. After an overnight incubation, the oocytes were injected with a radiolabelled Emi2 3′-UTR RNA probe in order to follow polyadenylation upon progesterone stimulation. The Emi2 3′-UTR radioactive probe is shown in black, with a grey box highlighting the CPE sequence (the three CPE elements present in the probe are shown as one for simplicity). The polyadenylation status of the RNA probe under the specific conditions is shown. Endogenous xCPEBs and the polyadenylation machinery are depicted in grey. (B) Quantification method to determine the percentage of competition by wild-type HA-CPEB4 and phosphorylation mutants. Using the Fiji software, the intensity profiles of the blue rectangles were plotted. The percentage of competition was calculated with the formula shown, using the measurement of the distance from the top of the lane to the peak of maximum intensity (x).
Figure 3—figure supplement 2
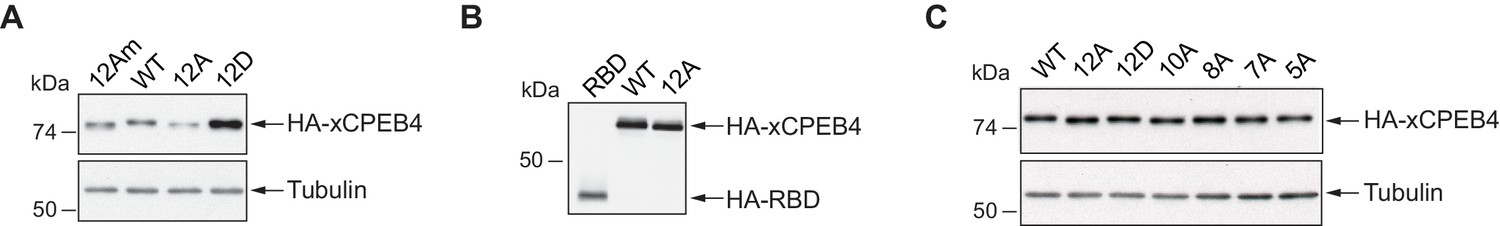
Expression levels of xCPEB4 variants used in competition experiments.
(A–C) Western blots with anti-HA antibody to show the levels of overexpression in the competition assays. (A) Relative to Figure 3A,B. (B) Relative to Figure 3C. (C) Relative to Figure 3D,E. Tubulin was used as a loading control.
Figure 3—figure supplement 3
In vivo rescue experiment.
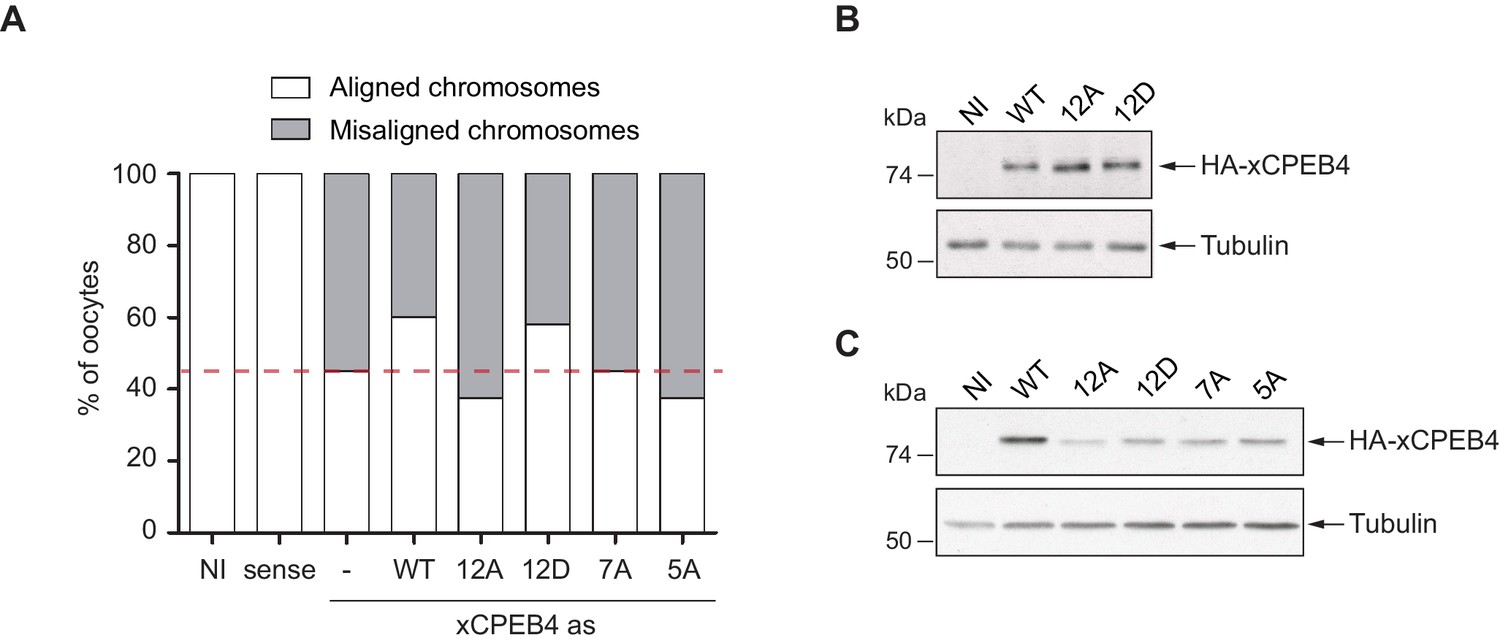
(A) In vivo rescue experiment. Oocytes were injected with sense or antisense (as) xCPEB4 oligonucleotides (NI, non-injected oocytes). After 16 hr, oocytes were injected with mRNAs encoding wild-type (WT) HA-xCPEB4 or the phosphorylation mutant 12A, 12D, 7A, or 5A. Oocytes were collected at metaphase II, fixed and stained with Hoechst. The percentage of oocytes with each phenotype (e.g. aligned or misaligned chromosomes) is plotted in the graph (n = 15). The red line marks the percentage of oocytes with aligned chromosomes in the antisense condition. (B) Western blot with anti-HA antibody to show the level of overexpression in the rescue experiment from Figure 3F. (C) Western blot with anti-HA antibody to show the level of overexpression in the rescue experiment from Figure 3—figure supplement 3A. Tubulin was used as a loading control.
Figure 3—figure supplement 4
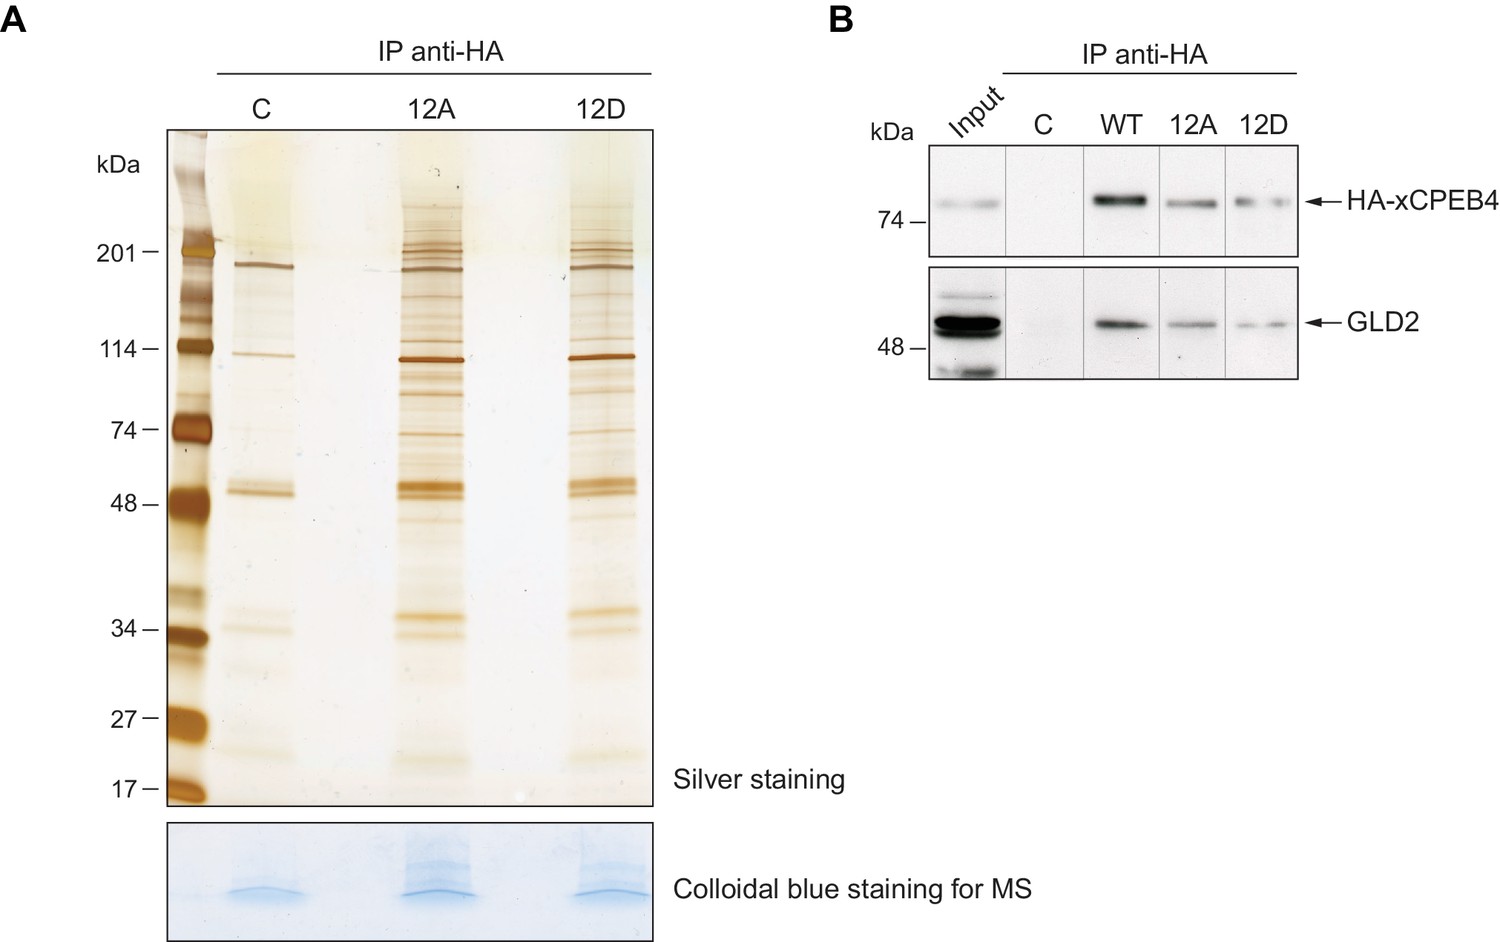
xCPEB4 does not differentially interact with cofactors depending on its phosphorylation status.
(A) Immunoprecipitation of HA-xCPEB4 12A (with the 12 phosphosites mutated to alanine) or HA-xCPEB4 12D (with the 12 phosphosites mutated to aspartic acid) in metaphase II with an anti-HA antibody. Non-injected oocytes were used as a control, C. In the upper panel, half of the immunoprecipitation was resolved in a 4–20% gradient SDS-PAGE and stained with silver staining. In the lower panel, the other half of the samples was loaded in SDS-PAGE but not resolved. The gel was excised and analysed by mass spectrometry. See also Supplementary file 1. (B) Immunoprecipitation of HA-xCPEB4, either WT or a phosphosite mutant of 12A or 12D (with the 12 phosphorylation sites mutated to alanine or aspartic acid, respectively) with an anti-HA antibody. Metaphase II oocytes were used. The co-immunoprecipitation of GLD2 was assessed by western blot. Non-injected oocytes were used as a control, C. Input corresponds to WT in MII. A representative experiment from three independent biological replicates is shown.
Figure 4 with 2 supplements
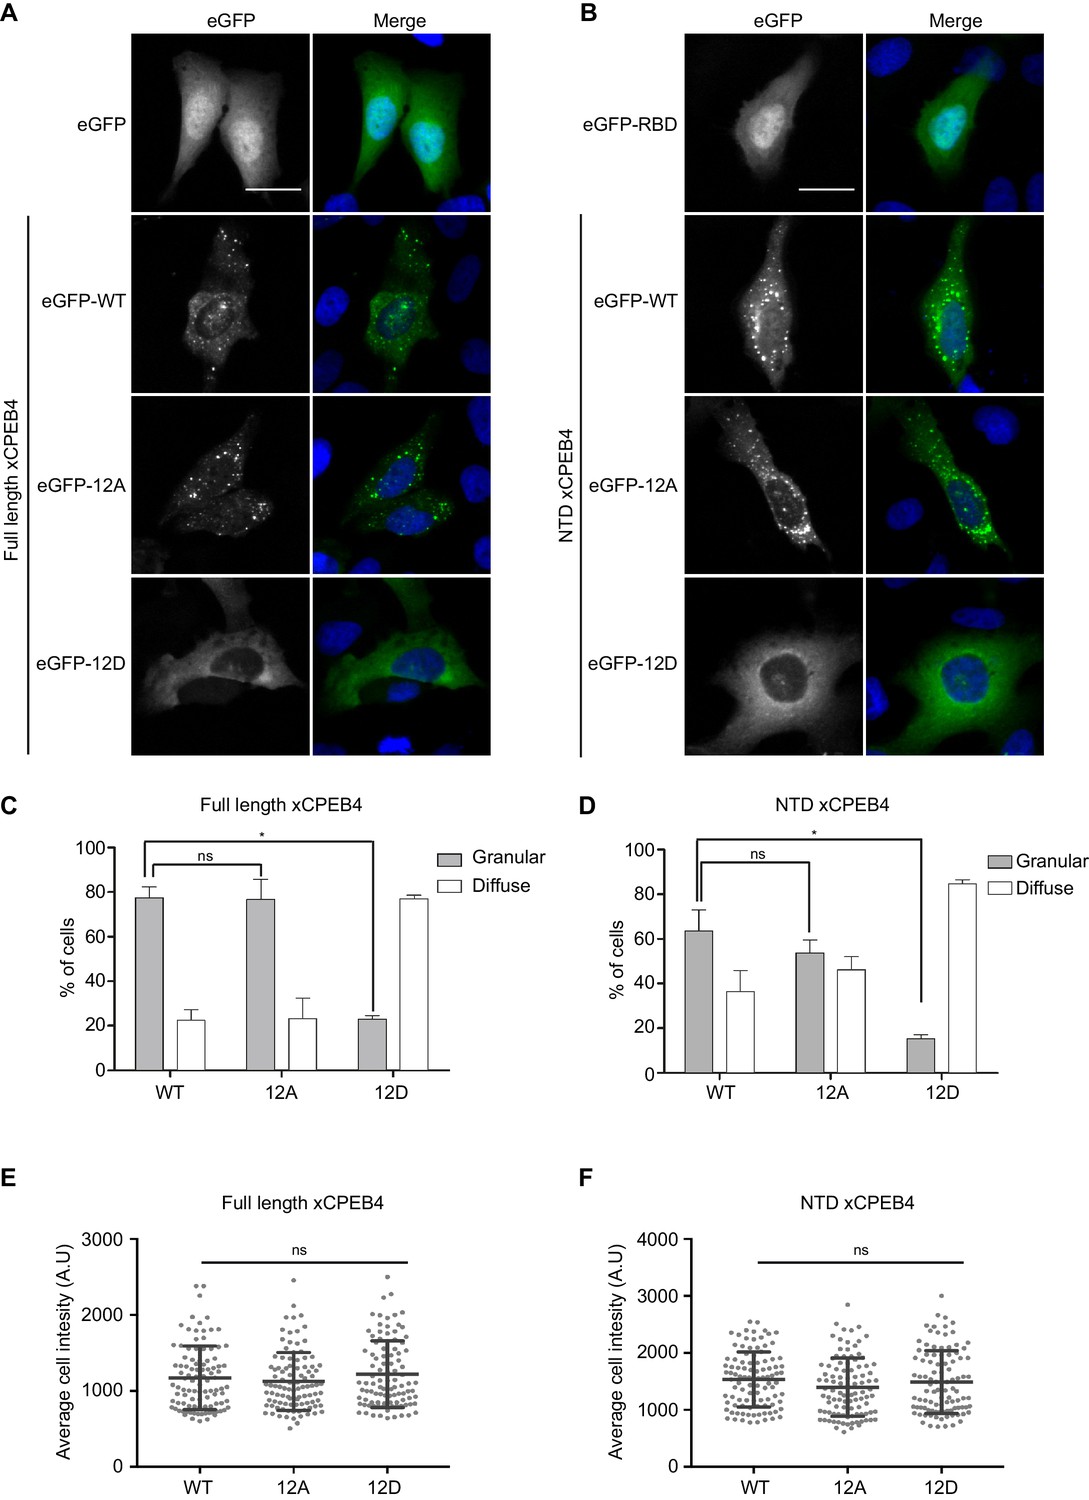
Non-phosphorylated NTD promotes xCPEB4 distribution in cytoplasmic granules.
(A, B) Representative image of (A) full-length eGFP-xCPEB4 or (B) the N-terminal domain, using the wild-type (WT) or phosphorylation mutants 12A or 12D (with the 12 phosphorylation sites mutated to alanine or aspartic acid, respectively), transfected in U2OS cells. As controls, eGFP and eGFP-RBD (RNA-binding domain) were used. Merge images show eGFP in green and DAPI in blue. Scale bar, 25 µm. (C, D) Quantification of the different expression patterns observed in Figure 4A (C) and Figure 4B (D). 100 cells were analysed and classified as having a granular (grey bars) or diffuse (white bars) expression pattern. The percentage of cells with each phenotype was calculated from three independent biological replicates. Results are shown as means and SEM. Significance was addressed with a Sidak’s multiple comparisons test. *p<0.05; ns, non-significant. (E, F) Average cell intensity (n = 100 cells) of the cells analysed in Figure 4C (E) and Figure 4D (F). Results are shown as means (SD). Significance was determined by the Student’s t-test. *p<0.05; ns, non-significant. See also Figure 4—figure supplement 1–2.
Figure 4—figure supplement 1
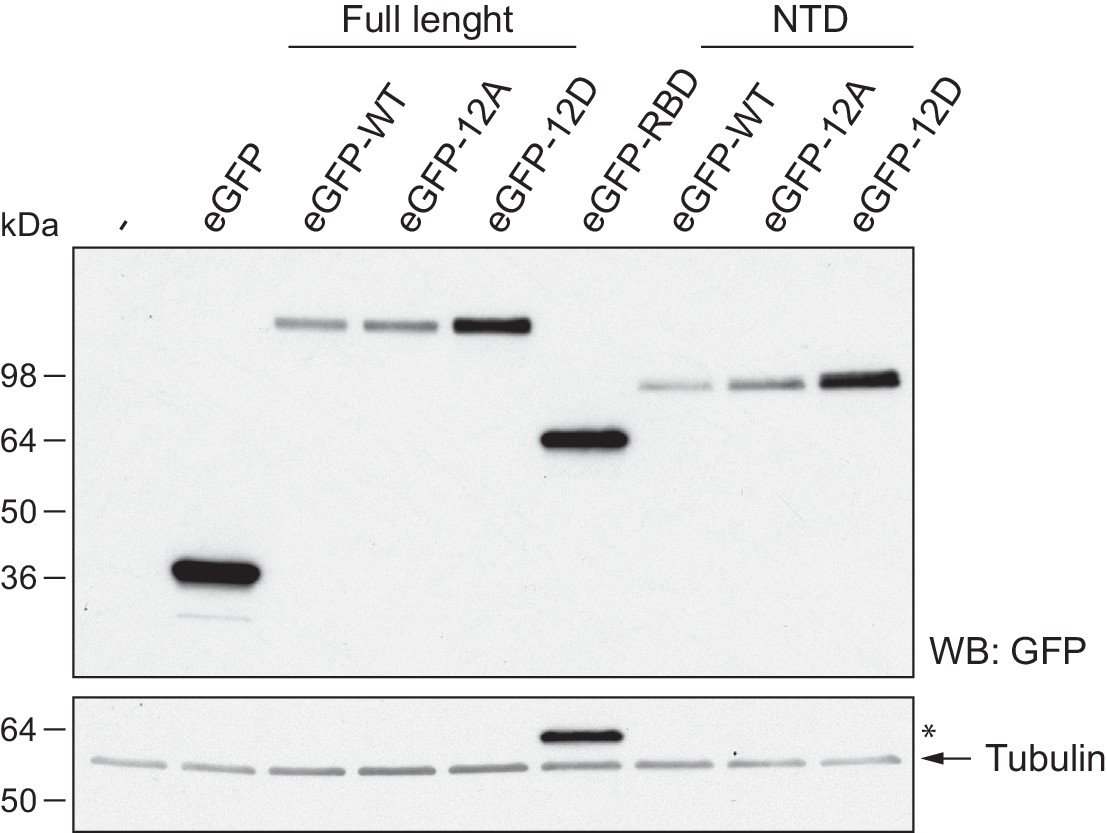
Expression of eGFP-xCPEB4 variants.
Western blot with anti-GFP antibody of U2OS cells transfected with eGFP-xCPEB4 (full-length, the N-terminal domain (NTD) or the RNA-binding domain (RBD)). The wild-type (WT) and the phosphorylation mutants 12A or 12D were analysed. Tubulin was used as a loading control. Asterisks (*) indicate unspecific bands.
Figure 4—figure supplement 2
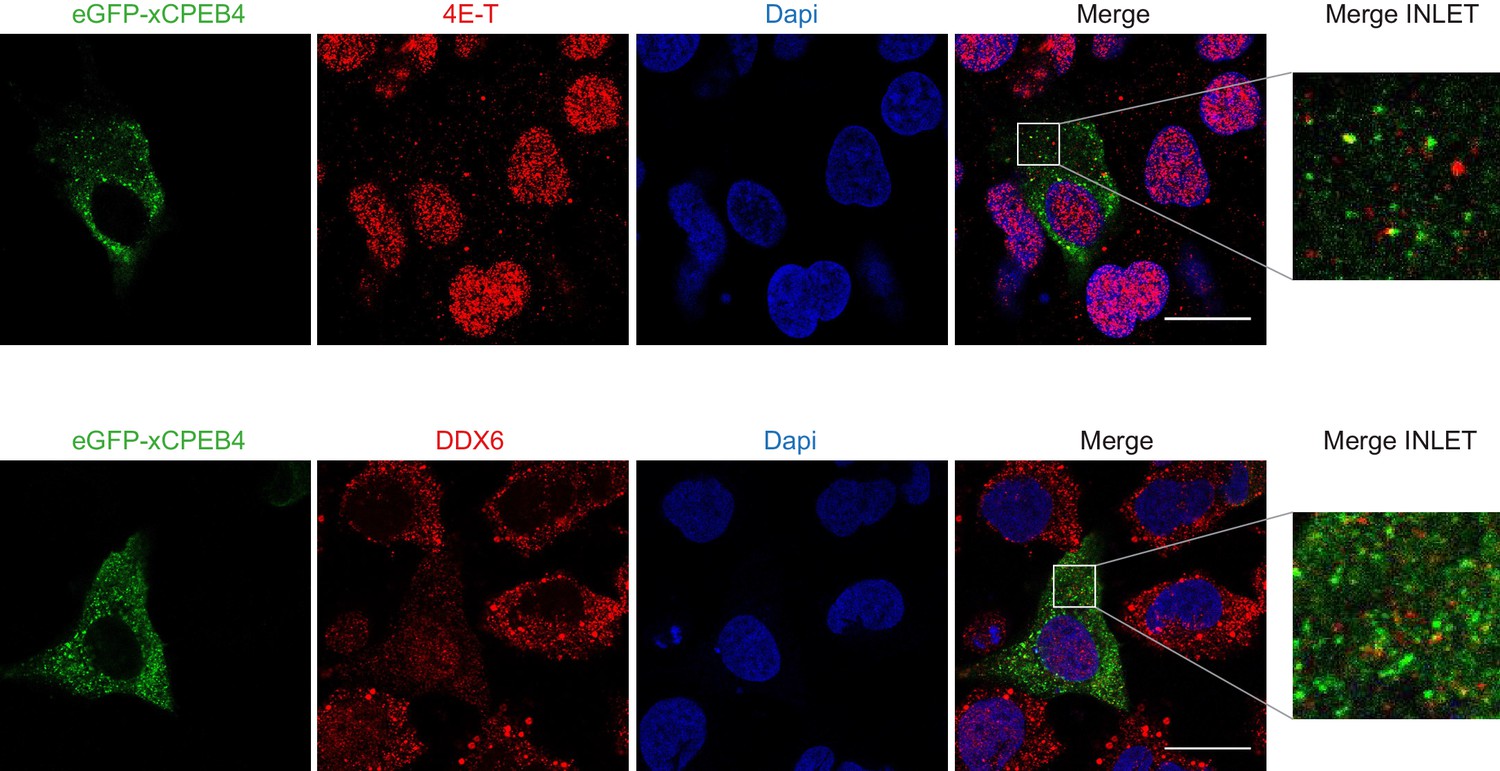
xCPEB4 cytoplasmic granules are distinct from P-bodies or stress granules.
Immunofluorescence of 4E-T and DDX6 in U2OS cells overexpressing full-length eGFP-xCPEB4. eGFP is shown in green; 4E-T and DDX6, in red; and DAPI, in blue. Scale bar, 20 µm.
Figure 5 with 1 supplement
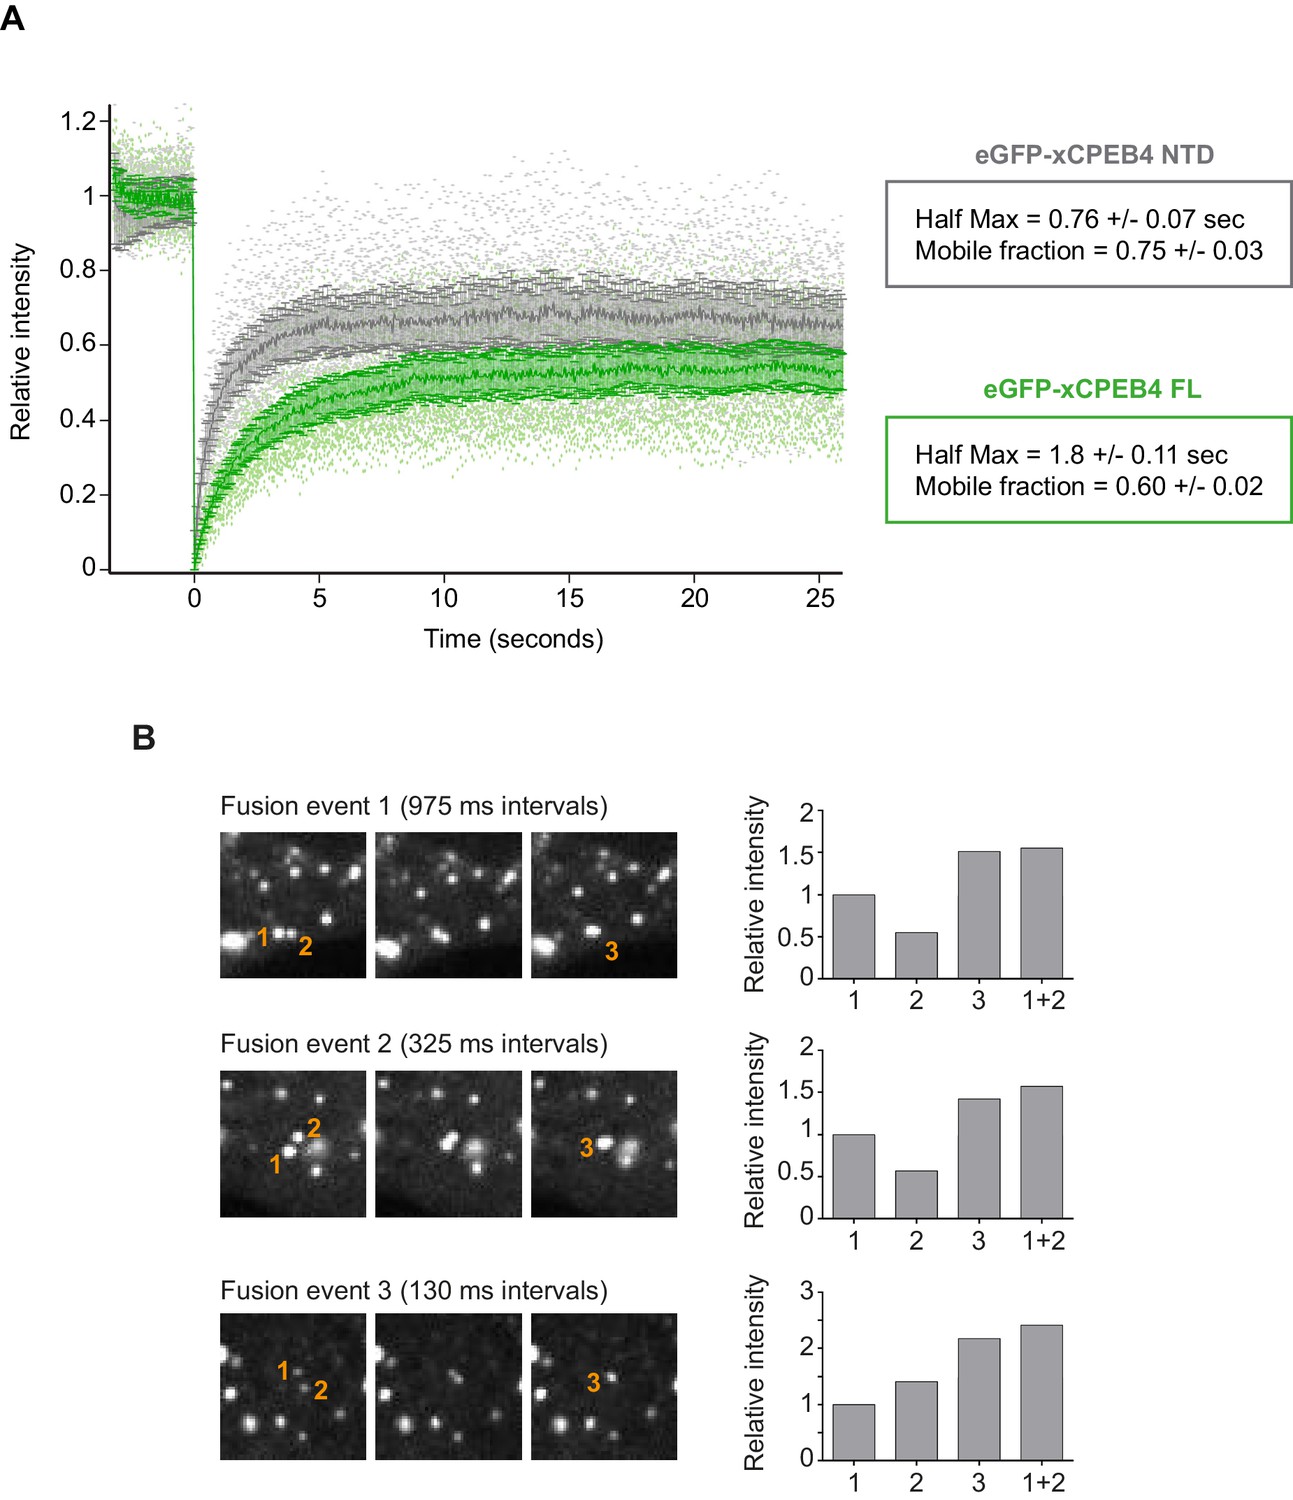
xCPEB4 cellular assemblies show liquid-like behaviours.
(A) Fluorescence recovery after photobleaching (FRAP) of eGFP-xCPEB4 full-length (green) or the N-terminal domain (NTD, grey) transfected in U2OS cells. Raw data (dots) and average recovery curves (line) are shown. Error bars show 95% confidence interval. The half-time of maximum recovery (Half Max) and the mobile fraction are specified as means and SEM (n = 20). See also Figure 5—figure supplement 1. (B) Sequential images showing fusion events of xCPEB4 granules (left). The relative intensities of the fusing granules (1 and 2) and the resulting granule (3) are shown, as well as the expected intensity from the fusion of granules 1 and 2 (1 + 2) (right). See also Video 1.
Figure 5—figure supplement 1
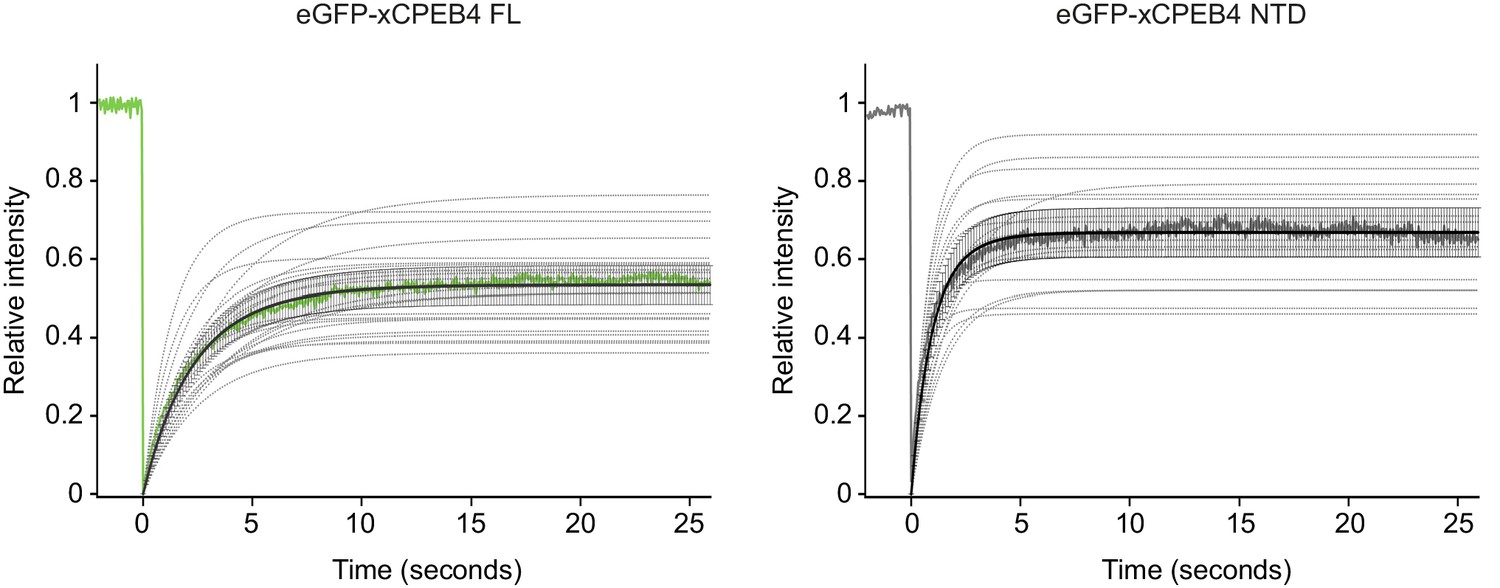
Fitting FRAP curves.
Fitting FRAP curves (a single exponential model was used to fit the data). Single fitting curves are shown in dotted lines. The average fitting curve is shown in black. The average recovery curve is also shown (eGFP-xCPEB4 FL, green; eGFP-xCPEB4 NTD, grey).
Figure 6 with 2 supplements
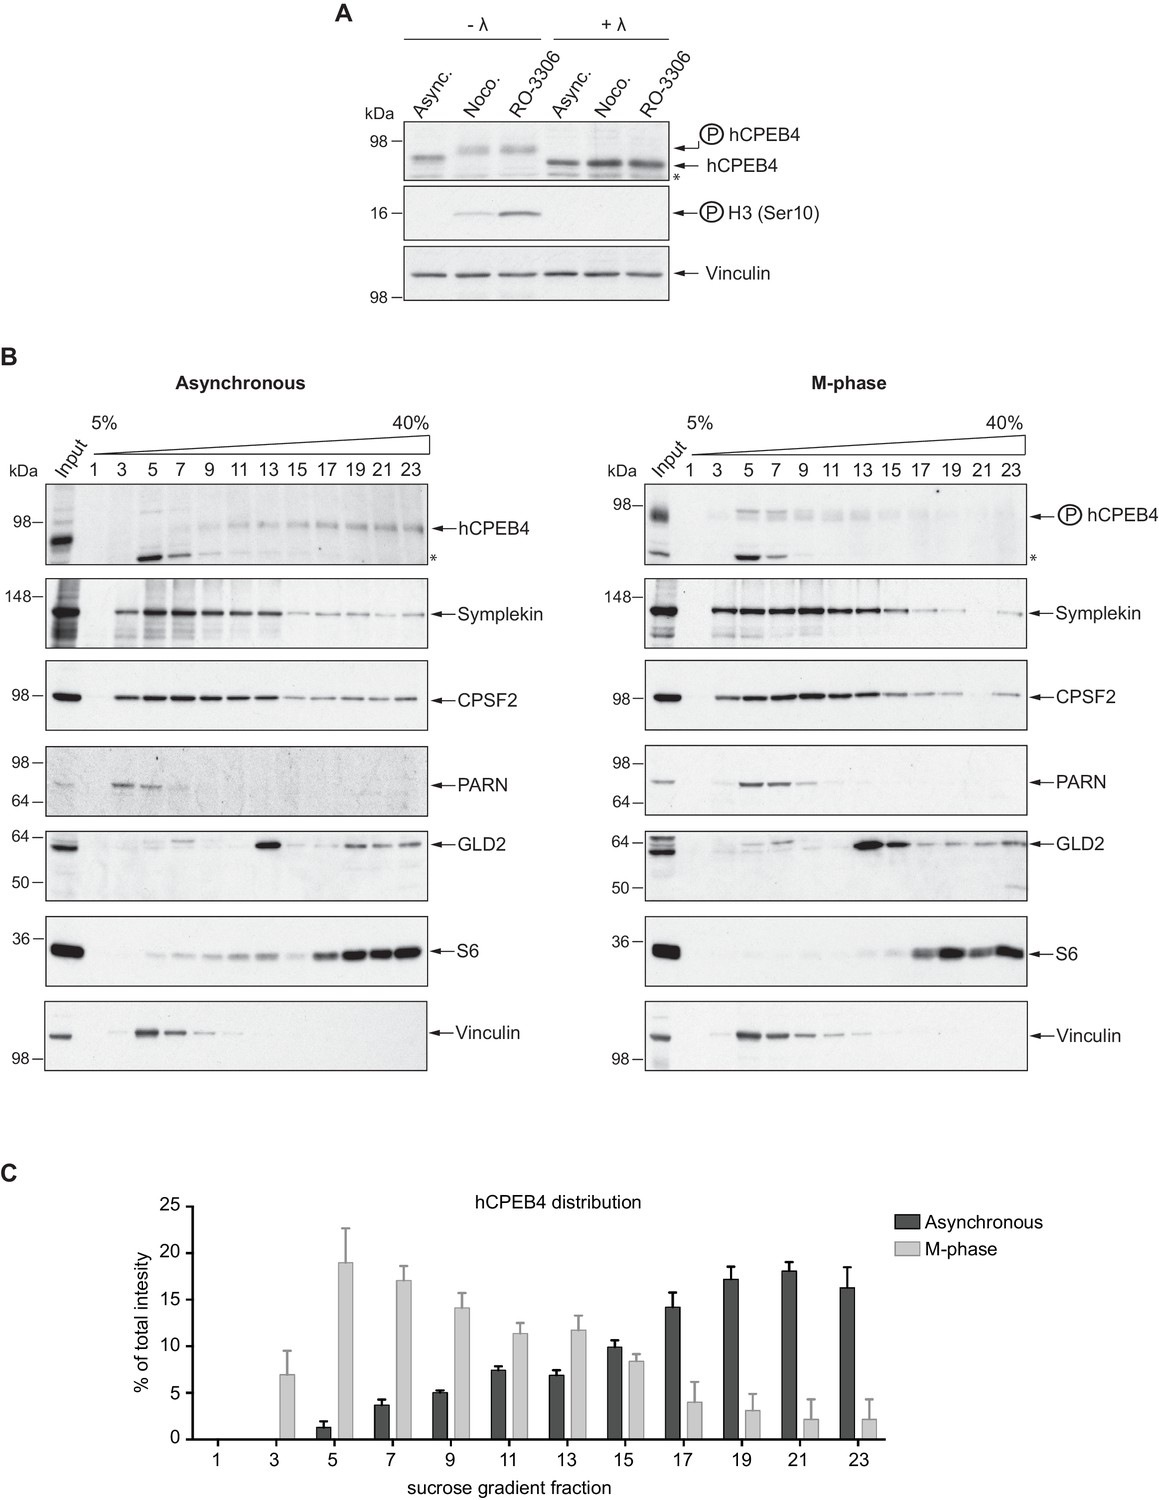
Endogenous hCPEB4 is phosphorylated and monomeric in M-phase.
(A) Lambda-phosphatase assay (λ) of cell extracts from asynchronous (Async.) or M-phase U2OS cells synchronized with either nocodazole (Noco.) or RO-3306. Western blots against hCPEB4, the mitotic marker phospho-histone H3 and Vinculin (as a loading control) are shown. See also Figure 6—figure supplement 1. (B) Cell extracts from asynchronous or M-phase U2OS cells (synchronized with nocodazole) were resolved in 5–40% sucrose gradients. Distribution of hCPEB4, Symplekin, CPSF2, PARN, GLD2 and the ribosomal protein S6 along the gradient are shown. Vinculin was used as a reference control. Asterisks indicate unspecific bands. See also Figure 6—figure supplement 2. (C) Quantification of hCPEB4, from asynchronous and M-phase cells, distribution along 5–40% sucrose gradients. Results, from three independent biological replicates, are shown as means and SEM.
Figure 6—figure supplement 1
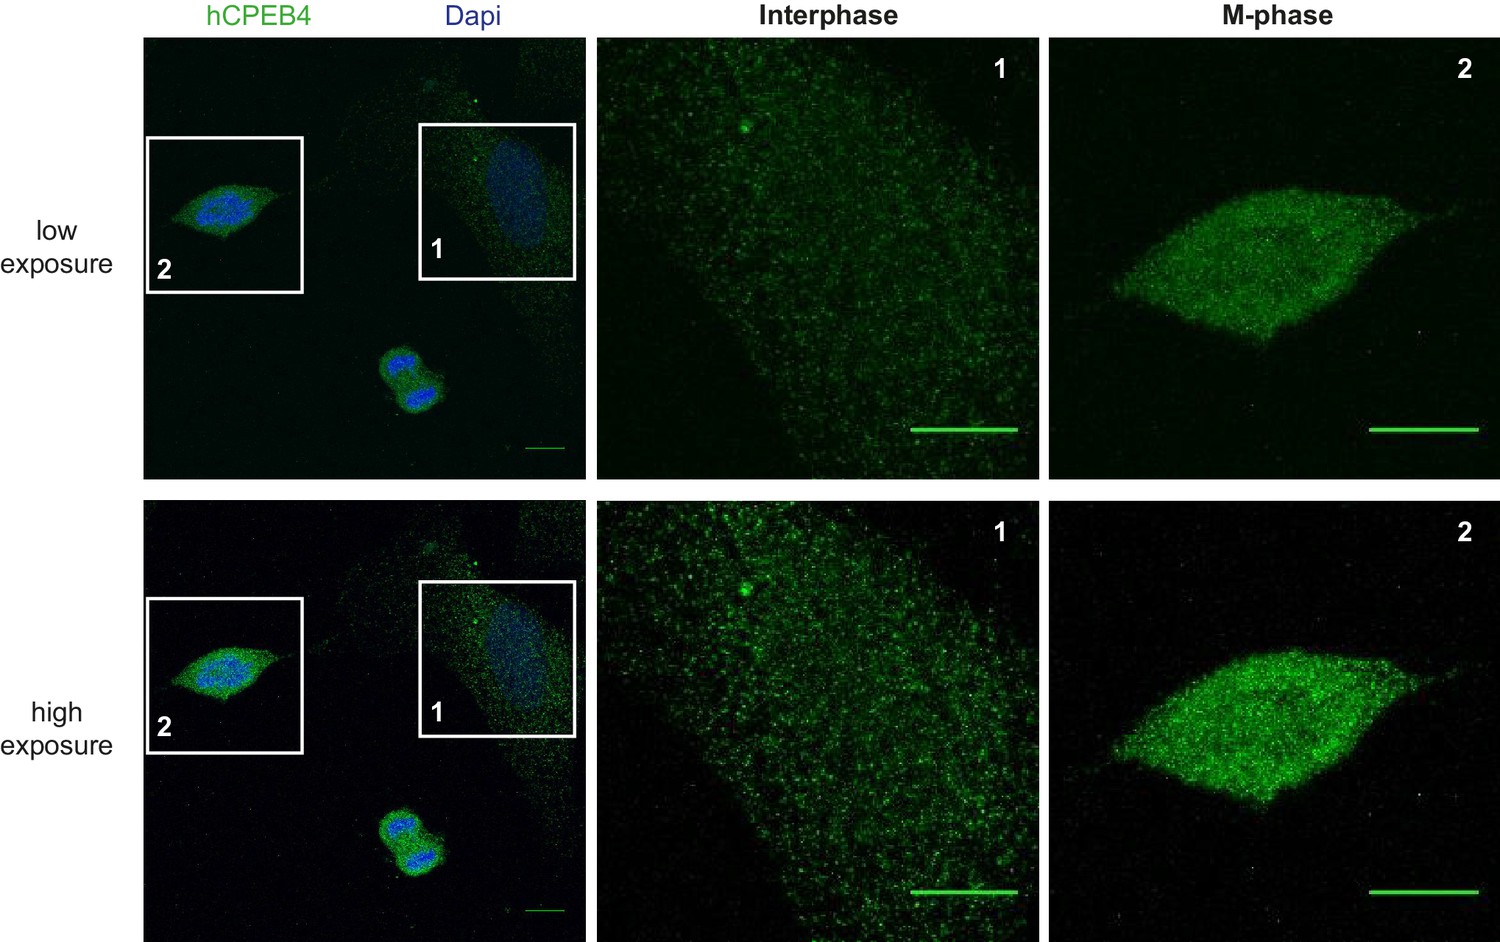
Immunofluorescence of endogenous hCPEB4 in U2OS cells.
Immunofluorescence of hCPEB4 in U2OS cells. Interphase (1) and M-phase (2) cells are indicated. Merge images show hCPEB4 in green and DAPI in blue. Scale bar, 10 µm.
Figure 6—figure supplement 2
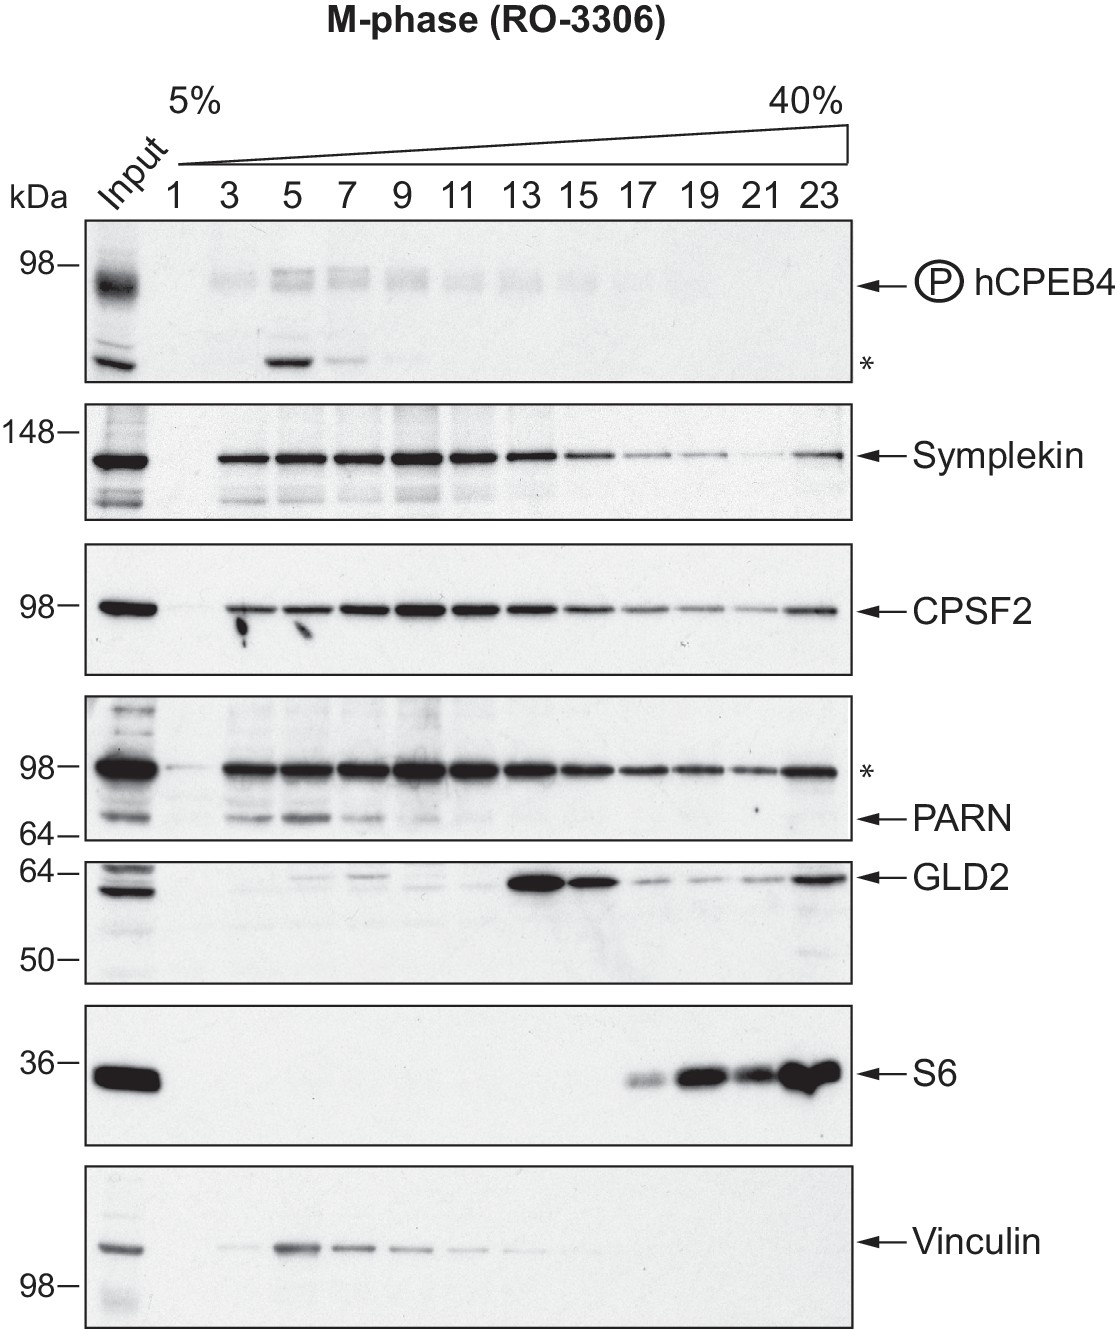
hCPEB4 (from M-phase cells synchronized with RO-3306) distribution along 5–40% sucrose gradients.
Cell extracts from M-phase U2OS cells (synchronized with RO-3306) were resolved in 5–40% sucrose gradients. Distribution of hCPEB4, Symplekin, CPSF2, PARN, GLD2 and the ribosomal protein S6 along the gradient are shown. Vinculin was used as a reference control. Asterisks indicate unspecific bands.
Figure 7

Phosphorylated/monomeric and non-phosphorylated/phase-separated hCPEB4 equally interact with cofactors and bind target mRNAs.
(A) Immunoprecipitation of hCPEB4 from asynchronous (‘Asy’) and M-phase (‘M’, synchronized with nocodazole) U2OS cells. IgG was used as negative control. The Co-IPs of Symplekin, CPSF2 and the ribosomal protein S6 were analysed. Asterisks indicate unspecific bands. (B) RNA-immunoprecipitation (RIP) of hCPEB4 from 5–40% sucrose gradients dense (17–21) and light (5–9) fractions. The upper panel shows hCPEB4 from asynchronous cells, while the lower panel shows hCPEB4 from M-phase cells (synchronized with nocodazole). The binding of hCPEB4 to Cdc20, Spop and Mnt target mRNAs was assessed by RT-qPCR. Results are shown as % of mRNA bound by hCPEB4 in each fraction (results were normalized by the negative control Gapdh). Two independent biological replicates, each one with three technical replicates, are shown as means and SEM.
Figure 8
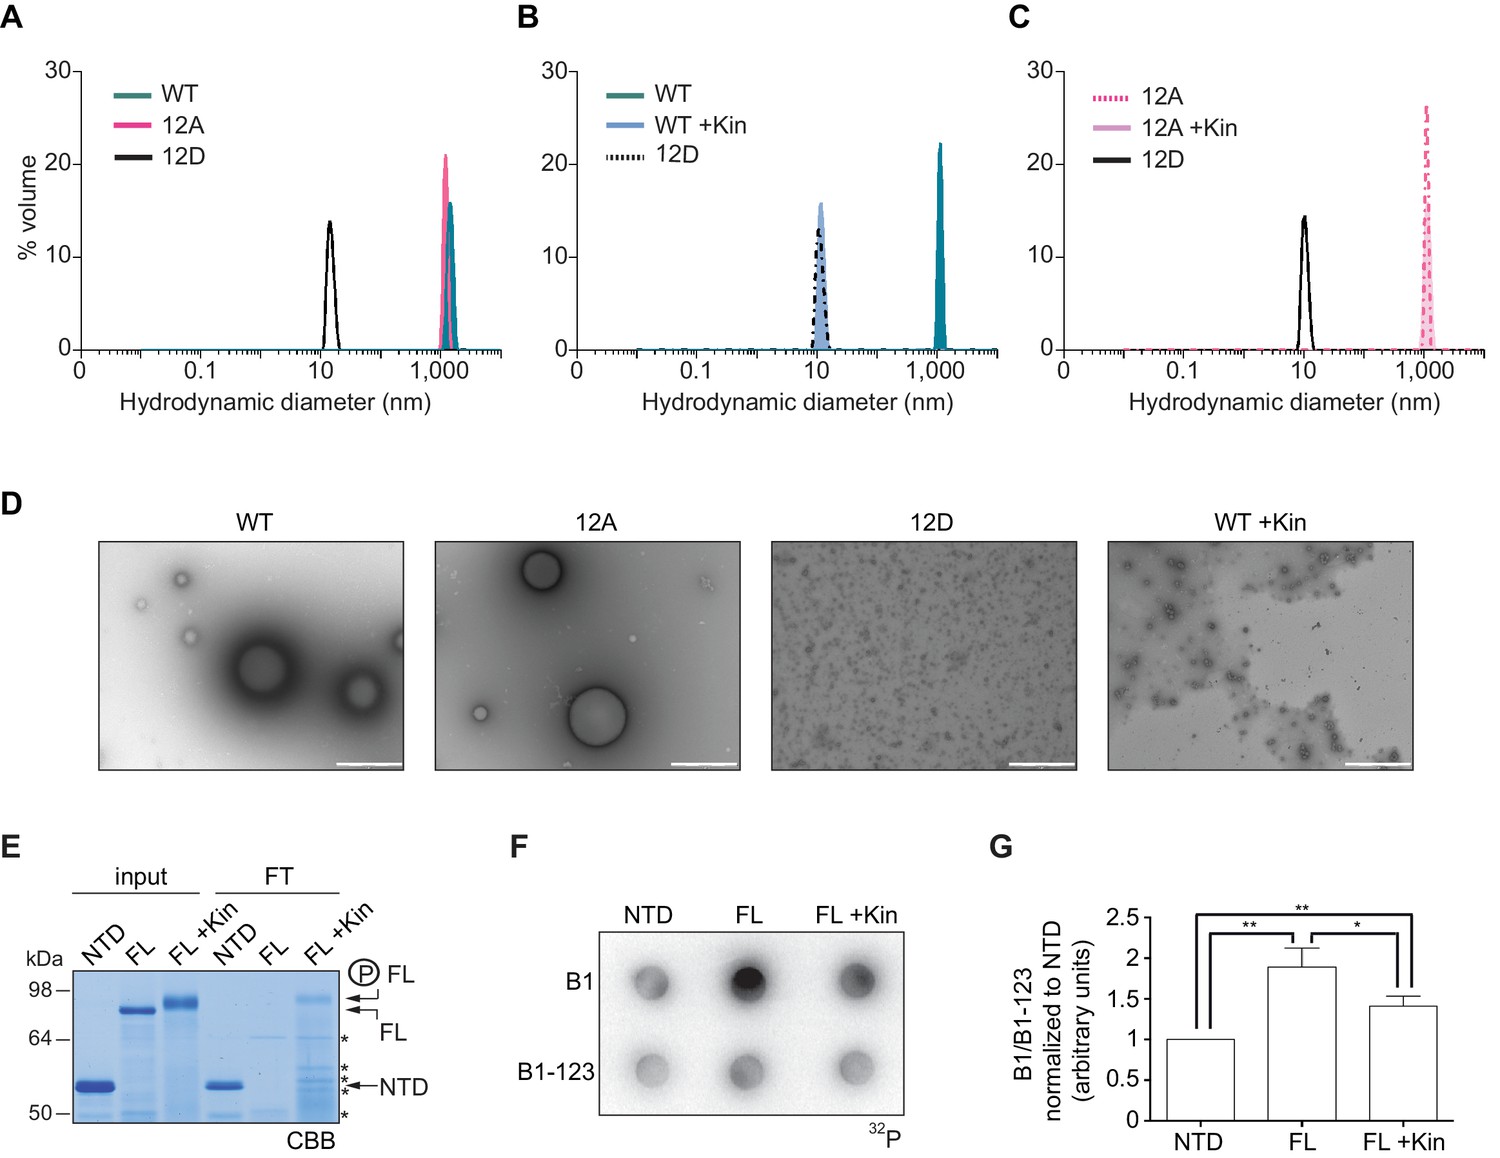
Purified xCPEB4 forms liquid-like droplets that are regulated by hyperphosphorylation and that specifically recruit CPE-containing mRNAs.
(A) Dynamic light scattering of the xCPEB4 N-terminal domain (NTD), either as wild-type (WT) or the 12A or 12D phosphorylation mutant (with the 12 phosphorylation sites mutated to alanine or aspartic acid, respectively). (B, C) Dynamic light scattering of the xCPEB4 NTD, either as WT (B) or the phospho-null 12A mutant (C), upon phosphorylation (+Kin) with ERK2 and Cdk1/cyclin B. The size distribution by volume is plotted. A representative experiment from three independent replicates is shown. (D) Transmission electron microscopy of the xCPEB4 NTD, either as WT or the 12A or 12D phosphorylation mutant. WT phosphorylated with ERK2 and Cdk1/cyclin B is shown at the right (WT +Kin). Scale bar, 1 µm. (E) Coomassie-stained gel of the input (4%) and the flow-through (FT, 20%) after passing through 0.22-µm-pore-size cellulose acetate filters. NTD, xCPEB4 N-terminal domain; FL, full-length xCPEB4; FL +Kin, FL phosphorylated with ERK2 and Cdk1/cyclin B. Asterisks show degradation products. (F) Cyclin B1–3′-UTR or B1-123–3′-UTR radioactive probe retention on 0.22 µm cellulose acetate filters after incubation with the indicated proteins: NTD, xCPEB4 N-terminal domain; FL, full-length xCPEB4; FL +Kin, FL phosphorylated with ERK2 and Cdk1/cyclin B. (G) Quantification of the cyclin B1–3′-UTR and B1-123–3′-UTR radioactive probe retention from three independent experiments. Results are shown as means and SEM. Significance was determined by the Student’s t-test; *p<0.05, **p<0.005.
Figure 9

Model to illustrate the sequential and coordinated functions of CPEB1 and CPEB4 in the meiotic cell cycle.
The different meiotic phases, as well as the activity profiles of ERK2 (light grey) and Cdk1/cyclin B (dark grey) along meiosis, are shown at the top. The sequential expression and function of xCPEB1 (yellow) and xCPEB4 (blue) are shown below. Orange ovals represent CPEB repression complexes. Orange arrows and orange phosphorylation events (*) indicate inhibitory effects. Green ovals represent CPEB activation complexes. Green arrows and green phosphorylation events (*) indicate activating effects. mRNAs activated in the different waves of cytoplasmic polyadenylation are shown in grey boxes. The phase-separation and inactivation that unphosphorylated CPEB4 experiences in non-mitotic cells is represented in the dashed box.
Videos
Video 1
Live imaging of U2OS cells transfected with GFP-xCPEB4 NTD.
The fusion of two liquid-like droplets is shown inside the green box.
Additional files
-
Supplementary file 1
xCPEB4 12A- or 12D-interacting proteins.
HA-xCPEB4 12A or 12D were immunoprecipitated, and the interacting proteins were analysed by mass spectrometry (relative to Figure 3—figure supplement 4). Only proteins with a fold enrichment > 1.5 with respect to the control IP are shown. Two independent experiments were performed.
- https://doi.org/10.7554/eLife.19298.026
Download links
A two-part list of links to download the article, or parts of the article, in various formats.
Downloads (link to download the article as PDF)
Open citations (links to open the citations from this article in various online reference manager services)
Cite this article (links to download the citations from this article in formats compatible with various reference manager tools)
CPEB4 is regulated during cell cycle by ERK2/Cdk1-mediated phosphorylation and its assembly into liquid-like droplets
eLife 5:e19298.
https://doi.org/10.7554/eLife.19298


