CREB overexpression in dorsal CA1 ameliorates long-term memory deficits in aged rats
- Northwestern University,Feinberg School of Medicine, United States
- York College of Pennsylvania, United States
- University of Wisconsin-Madison, United States
Figures
Figure 1 with 1 supplement

CREB expression levels are increased in CA1 neurons of both young and aged rats following stereotaxic injection of AAV-CREB vector into dorsal CA1 region.
(a) The AAV-CREB vector contained a GFP reporter. Example of a stitched 40x confocal image of GFP staining in CA1 area. SO – stratum oriens; SP – stratum pyramidale; SR – stratum radiatum. Scale bar = 100 μm. (b) The percentage of infected CA1 neurons in young and aged animals (n = 5, 4) was quantified by dividing the number of GFP positive cells by the total number of NeuN positive cells for each animal. (c) Example of CREB immunofluorescence in infected (green) and uninfected (not green, outlined) cells. Note the higher intensity in GFP positive cells. Scale bar = 20 μm. (d) AAV-CREB infected cells (i.e., GFP positive cells) had higher CREB expression than uninfected cells. Relative CREB expression level of infected cells was quantified as a percentage of CREB intensity of uninfected cells (normalized to be 100%, dashed line) in young and aged animals (n = 5, 4).
Figure 1—figure supplement 1
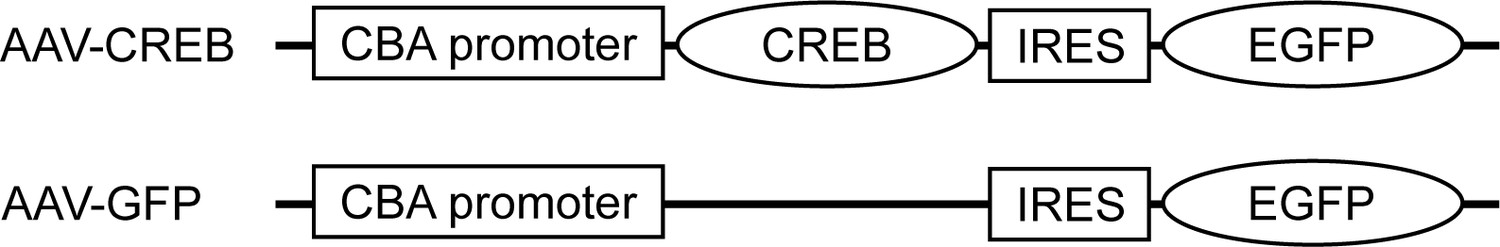
Schematic for viral constructs.
AAV-CREB encoded the sequence for wild-type rat CREB, expressed from a chicken β-actin promoter with a CMV enhancer. The GFP reporter was downstream from an internal ribosomal entry site (IRES). The control AAV-GFP virus lacked the rat CREB sequence.
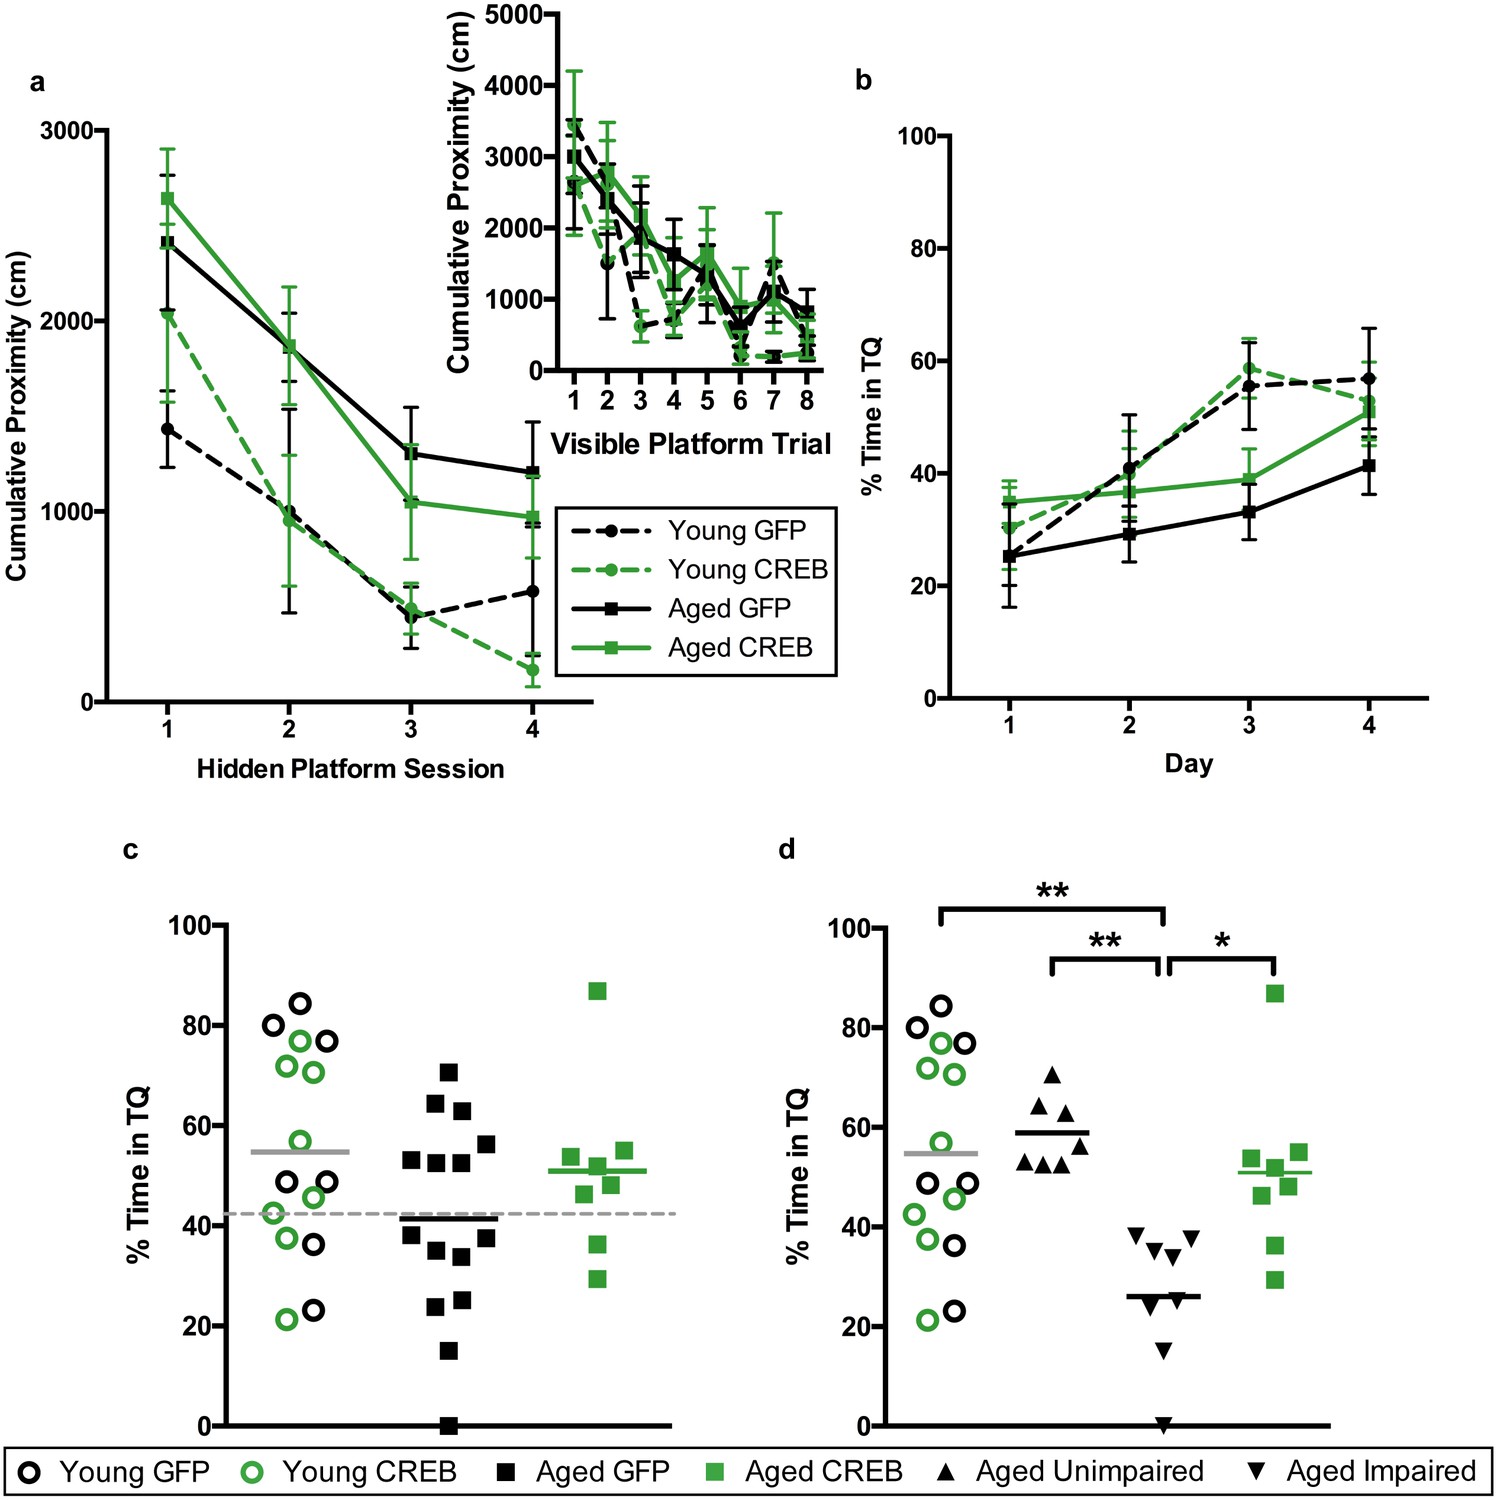
Figure 2
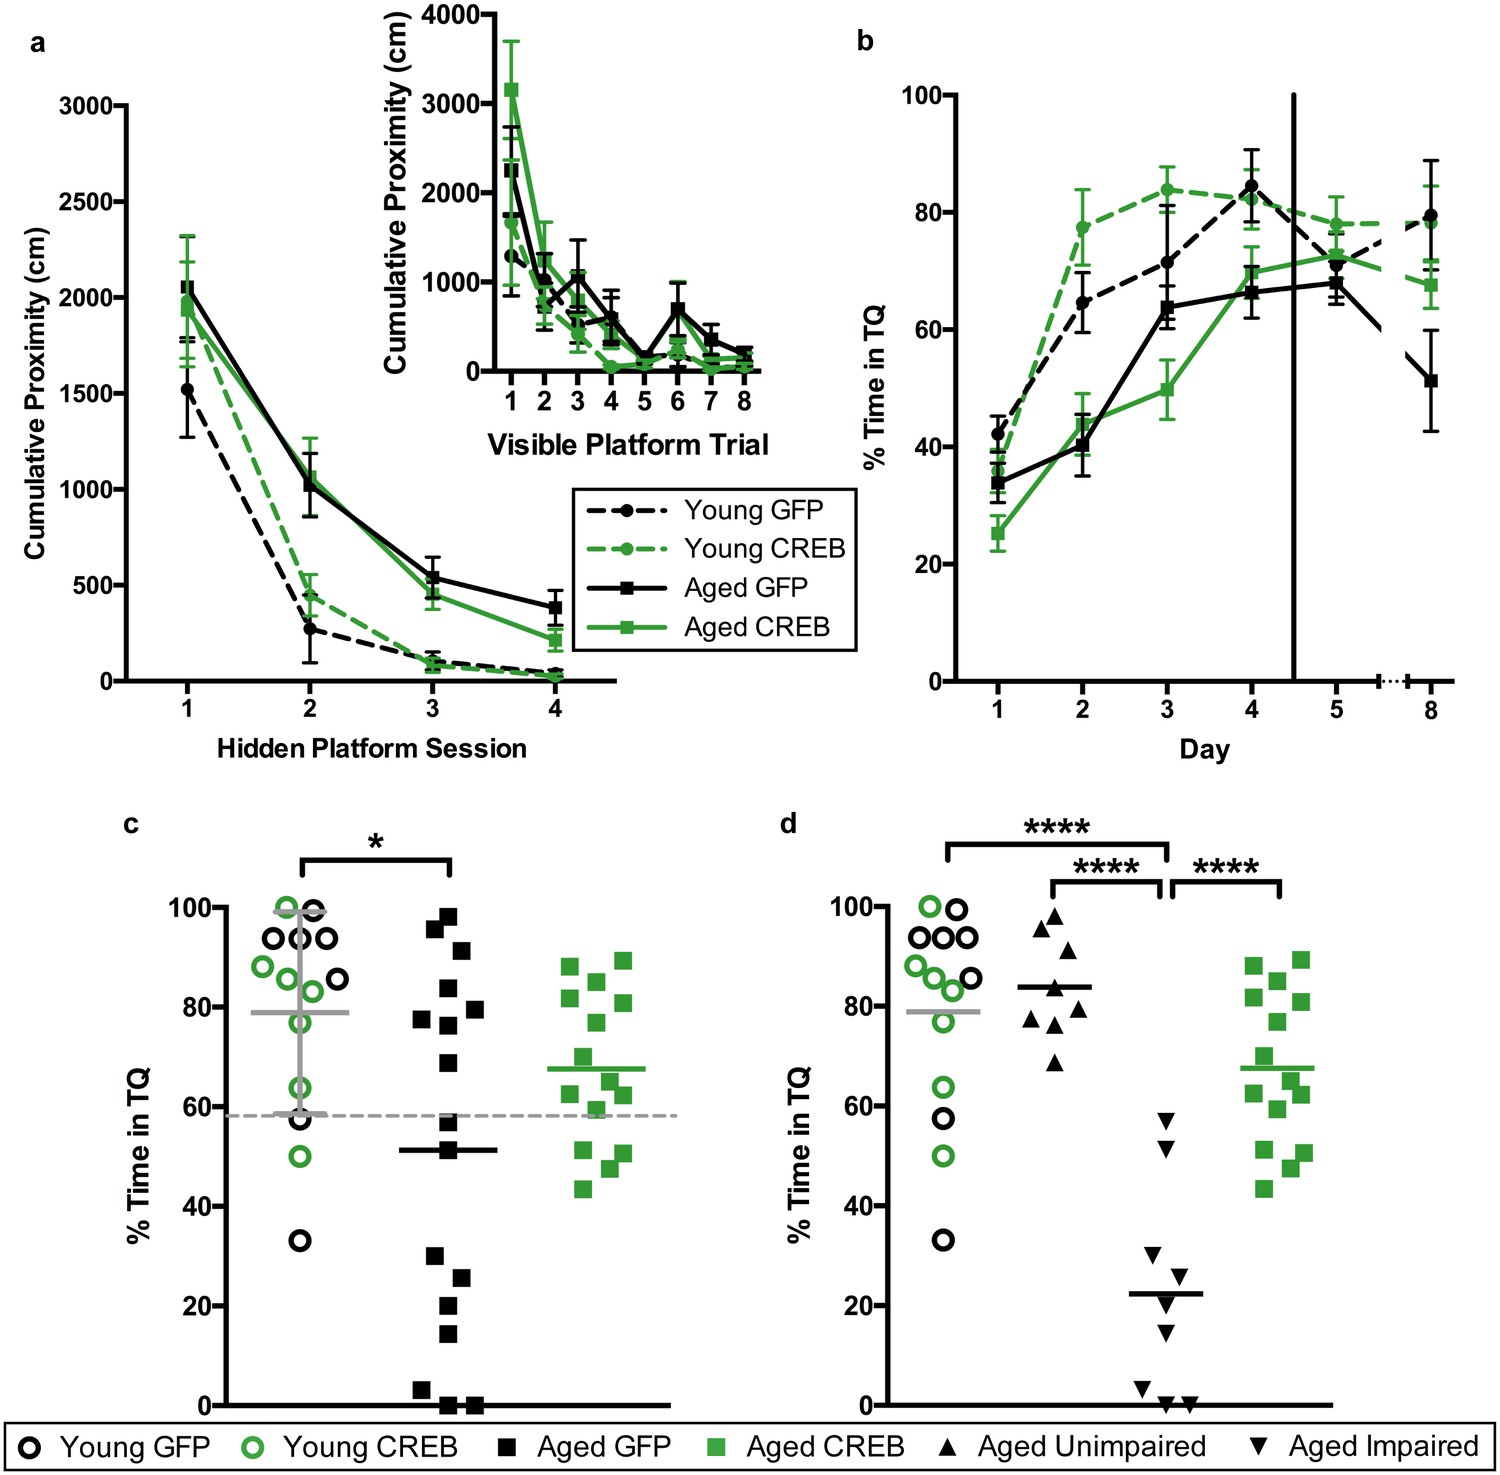
AAV-CREB ameliorates spatial memory deficits in aged animals.
(a) Performance on visible platform over eight trials (inset), and hidden platform over 4 sessions of training (five trials each session; one session per day) for young animals and aged animals that received control AAV-GFP, or AAV-CREB virus (n = 7, 7, 17, 15). All animals were capable of learning the visible and hidden platform task. While young animals performed better than aged on hidden platform training, no virus-based differences were observed. (b) Performance of young and aged animals that received AAV-GFP or AAV-CREB on probe trials run 1 hr after each session of hidden platform training, as well as 1 day and 4 days after the end of training (n = 7, 7, 17, 15). A difference was found between young and aged animals, but no effect of virus was observed. (c) Aged rats given control AAV-GFP vector were significantly impaired on memory for the platform, as measured by a probe test conducted 4 days after the end of hidden platform training. Dashed line indicates the average performance of young rats minus 1 SD. (d) Aged rats classified as aged impaired (AI: n = 9) performed significantly worse on the probe test conducted 4 days after the end of the hidden platform training as compared to young adult (n = 14), aged unimpaired (AU: n = 8) and aged rats given AAV-CREB (n = 15). No significant differences were observed between young adult, AU and aged CREB rats. Results in a and b represent mean ± SEM, horizontal bars in c and d represent mean, c represents mean ± SD or mean only.
Figure 3 with 3 supplements
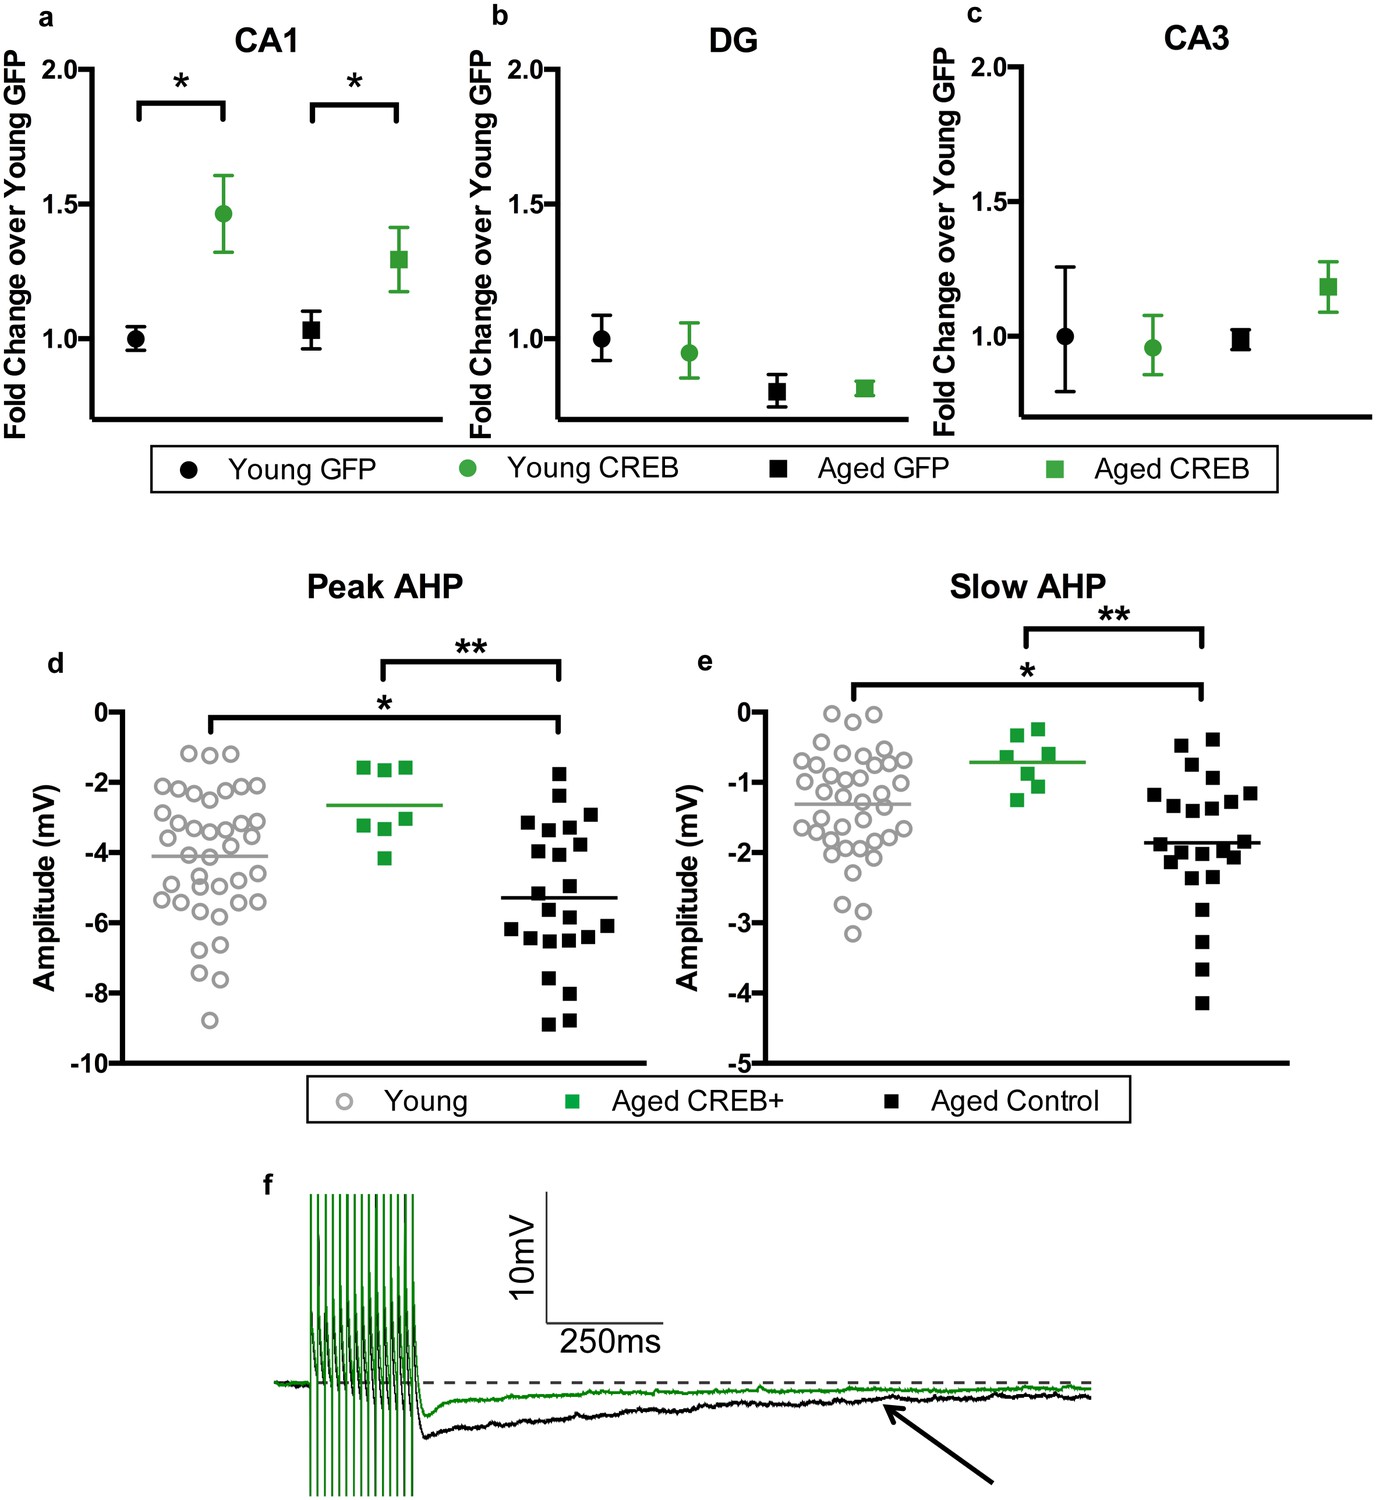
AAV-CREB results in higher CREB mRNA levels in CA1, and reduces AHP in infected aged animals.
CREB mRNA levels relative to young GFP group in a) CA1, (b) DG, and c) CA3. In both young and aged animals, AAV-CREB injected animals had more CREB mRNA in CA1 (n = 7, 7, 17, 15). This viral difference was not observed in DG (n = 4, 6, 4, 6) or CA3 (n = 4, 6, 4, 6). (d) Peak postburst AHP is significantly reduced in CA1 pyramidal neurons (n = 7) from aged AAV-CREB animals as compared to control cells (n = 23) from aged animals. No significant differences were observed in peak postburst AHP between CA1 neurons from young adult (n = 39) and aged AAV-CREB animals. (e) Similarly, the slow postburst AHP from CA1 neurons of young adult and aged AAV-CREB animals were significantly reduced as compared to control cells from aged animals. (f) Example postburst AHP traces from aged CREB+ (green) and aged control (black) CA1 pyramidal neurons. Arrow indicates 1 s time point where slow postburst AHP was measured. Results in a, b, c represent mean ± SEM.
Figure 3—figure supplement 1

Aged unimpaired and impaired animals had the same amount of CREB mRNA.
Upon separating the aged GFP group into AU and AI, CREB mRNA levels were not different between AU and AI animals. Horizontal bars represent mean.
Figure 3—figure supplement 2

CREB protein levels are positively correlated with probe trial performance in aged GFP animals.
Levels of CREB protein in CA1 of aged GFP animals are correlated with % time spent in target quadrant on a probe trial run 1 hr after the last training session. Aged rats with more basal levels of CREB protein performed better on the probe trial.
Figure 3—figure supplement 3
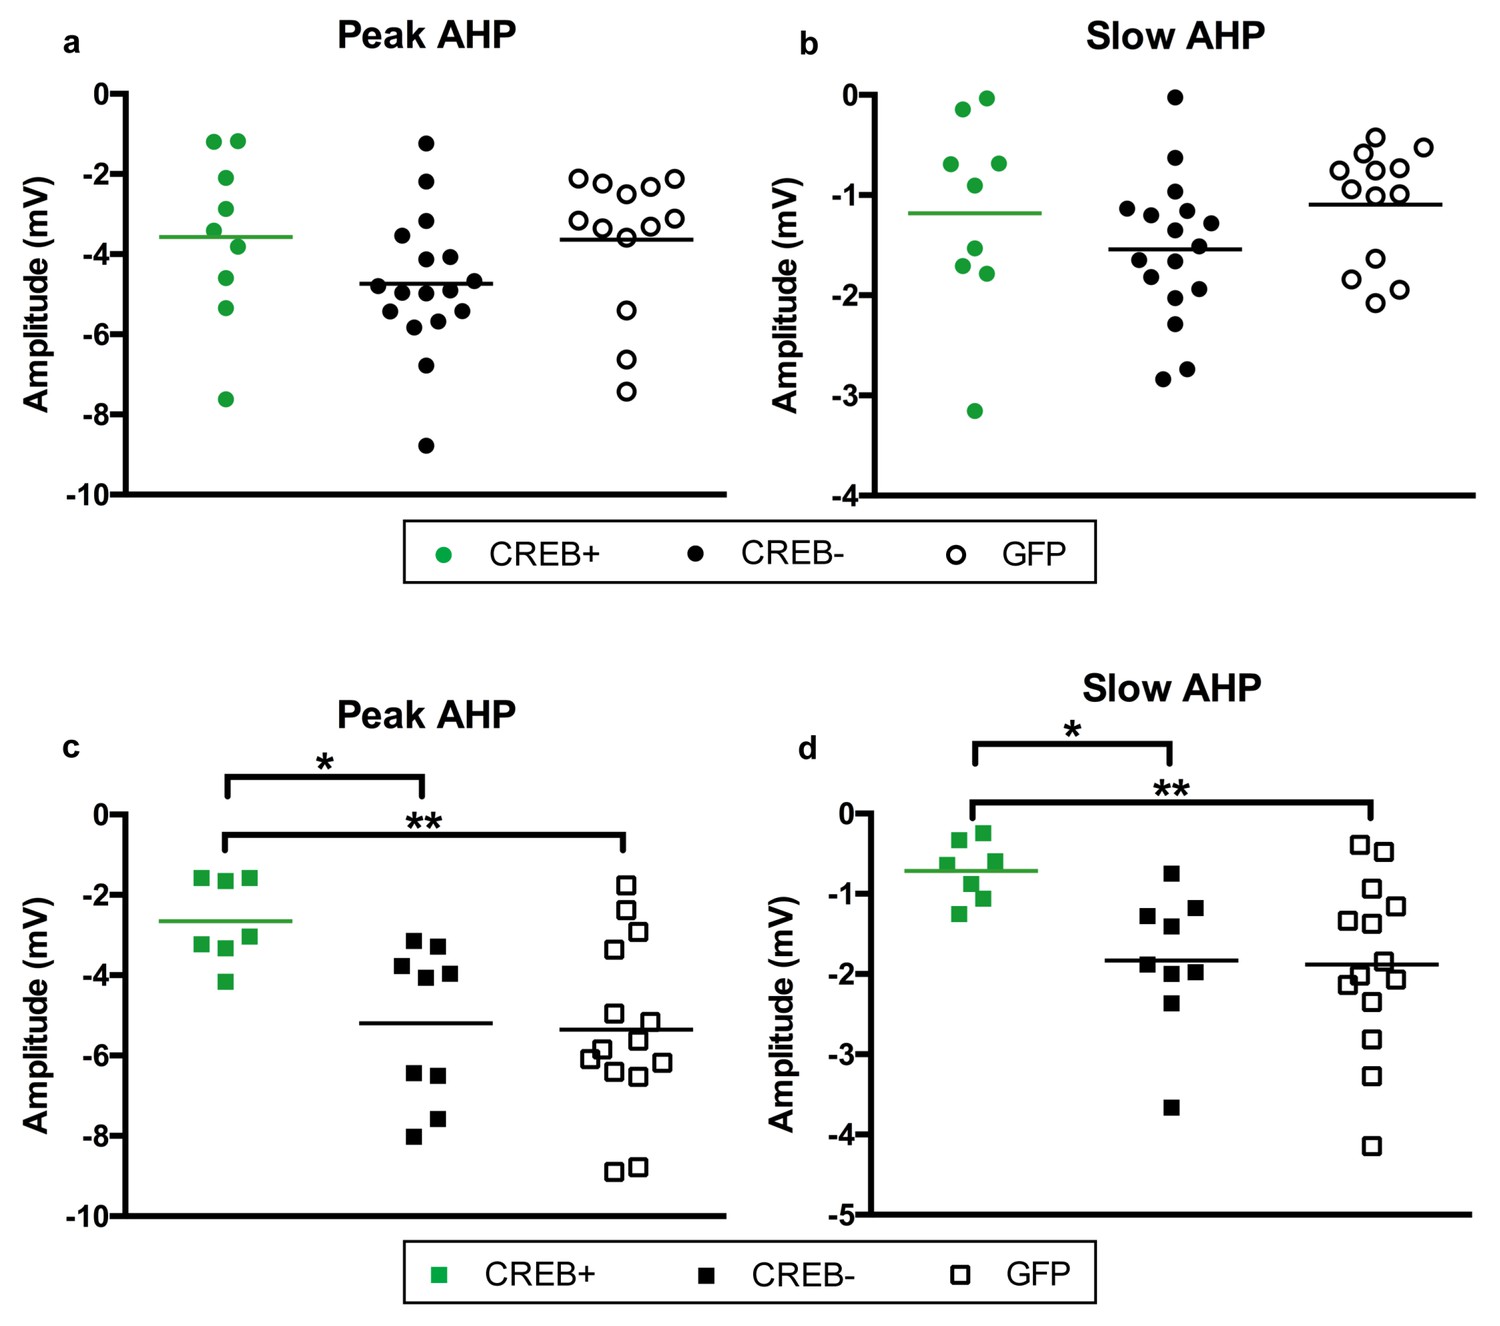
Viral infection state had no effect on postburst AHP size in young CA1 pyramidal neurons, but did affect aged neurons.
(a) Peak and b) slow AHP were measured in AAV-CREB infected cells (CREB+), AAV-CREB uninfected cells (CREB−), and cells from AAV-GFP injected young animals (n = 9, 17, 13). For both measurements, no differences were observed between the three groups. (c) Peak and d) slow AHP were measured in AAV-CREB infected cells (CREB+), AAV-CREB uninfected cells (CREB-), and cells from AAV-GFP injected aged animals (n = 7, 9, 14). For both measurements, while CREB+ cells had significantly smaller amplitudes when comparing to both CREB- and GFP cells, the CREB- and GFP cells were not different from each other. Horizontal bars represent mean.
Figure 4
AAV-CREB ameliorates age-related spatial memory deficits on a more difficult water maze task.
(a) Performance on visible platform over eight trials (inset), and hidden platform over 4 sessions of training (three trials each session; one session per day) for young animals and aged animals that received control AAV-GFP, or AAV-CREB virus (n = 7, 8, 15, 8). All animals were capable of learning the visible and hidden platform task. While young animals performed better than aged on hidden platform training, no virus-based differences were observed. (b) Performance of young and aged animals that received AAV-GFP or AAV-CREB on probe trials run 1 hr after each session of hidden platform training (n = 7, 8, 15, 8). A difference was found between young and aged animals, but no effect of virus was observed. (c) Aged rats given control AAV-GFP vector trended towards worse performance on a probe test conducted 1 hr after the last hidden platform training session. Dashed line indicates the average performance of young rats that successfully learned minus 1 SD. (d) Aged rats classified as aged impaired (AI: n = 8) performed significantly worse on the probe test conducted on day 4 of hidden platform training as compared to young adult (n = 15), aged unimpaired (AU: n = 7) and aged rats given AAV-CREB (n = 8). No significant differences were observed between young adult, AU and aged CREB rats. Results in a and b represent mean ± SEM, horizontal bars in c, d represent mean.
Additional files
-
Supplementary file 1
Young peak and slow post-burst AHP amplitudes do not differ.
(a) Peak post-burst AHP amplitudes (mV) Aged CREB+ cells have smaller peak AHP’s than CREB- and GFP, but young cell types do not differ from each other. Data represent mean ± SEM. *p<0.05, **p<0.01 compared to aged CREB+. (b) Slow post-burst AHP amplitudes (mV) Aged CREB+ cells have smaller slow AHP’s than CREB- and GFP, but young cell types do not differ from each other. Data represent mean ± SEM. *p<0.05, **p<0.01 compared to aged CREB+.
- https://doi.org/10.7554/eLife.19358.010
-
Supplementary file 2
Resting membrane potential and input resistance do not vary across cell types.
(a) Resting Membrane Potential (mV) Resting membrane potential does not vary across different groups of cells. A two-way ANOVA revealed no significant effect of age (F1, 63 = 0.6078, n.s.) or of cell type (F2, 63 = 0.6122, n.s.). Data represent mean ± SEM. (b) Input Resistance (MΩ) Input resistance does not vary across different groups of cells. A two-way ANOVA revealed no significant effect of age (F1, 63 = 0.8259, n.s.) or of cell type (F2, 63 = 1.608, n.s.). Data represent mean ± SEM.
- https://doi.org/10.7554/eLife.19358.011
Download links
A two-part list of links to download the article, or parts of the article, in various formats.
Downloads (link to download the article as PDF)
Open citations (links to open the citations from this article in various online reference manager services)
Cite this article (links to download the citations from this article in formats compatible with various reference manager tools)
CREB overexpression in dorsal CA1 ameliorates long-term memory deficits in aged rats
eLife 6:e19358.
https://doi.org/10.7554/eLife.19358


