Regulation of mTORC1 by lysosomal calcium and calmodulin
- Johns Hopkins University School of Medicine, United States
- Eli Lilly and Company, United States
- The University of Georgia, United States
Figures
Figure 1 with 1 supplement
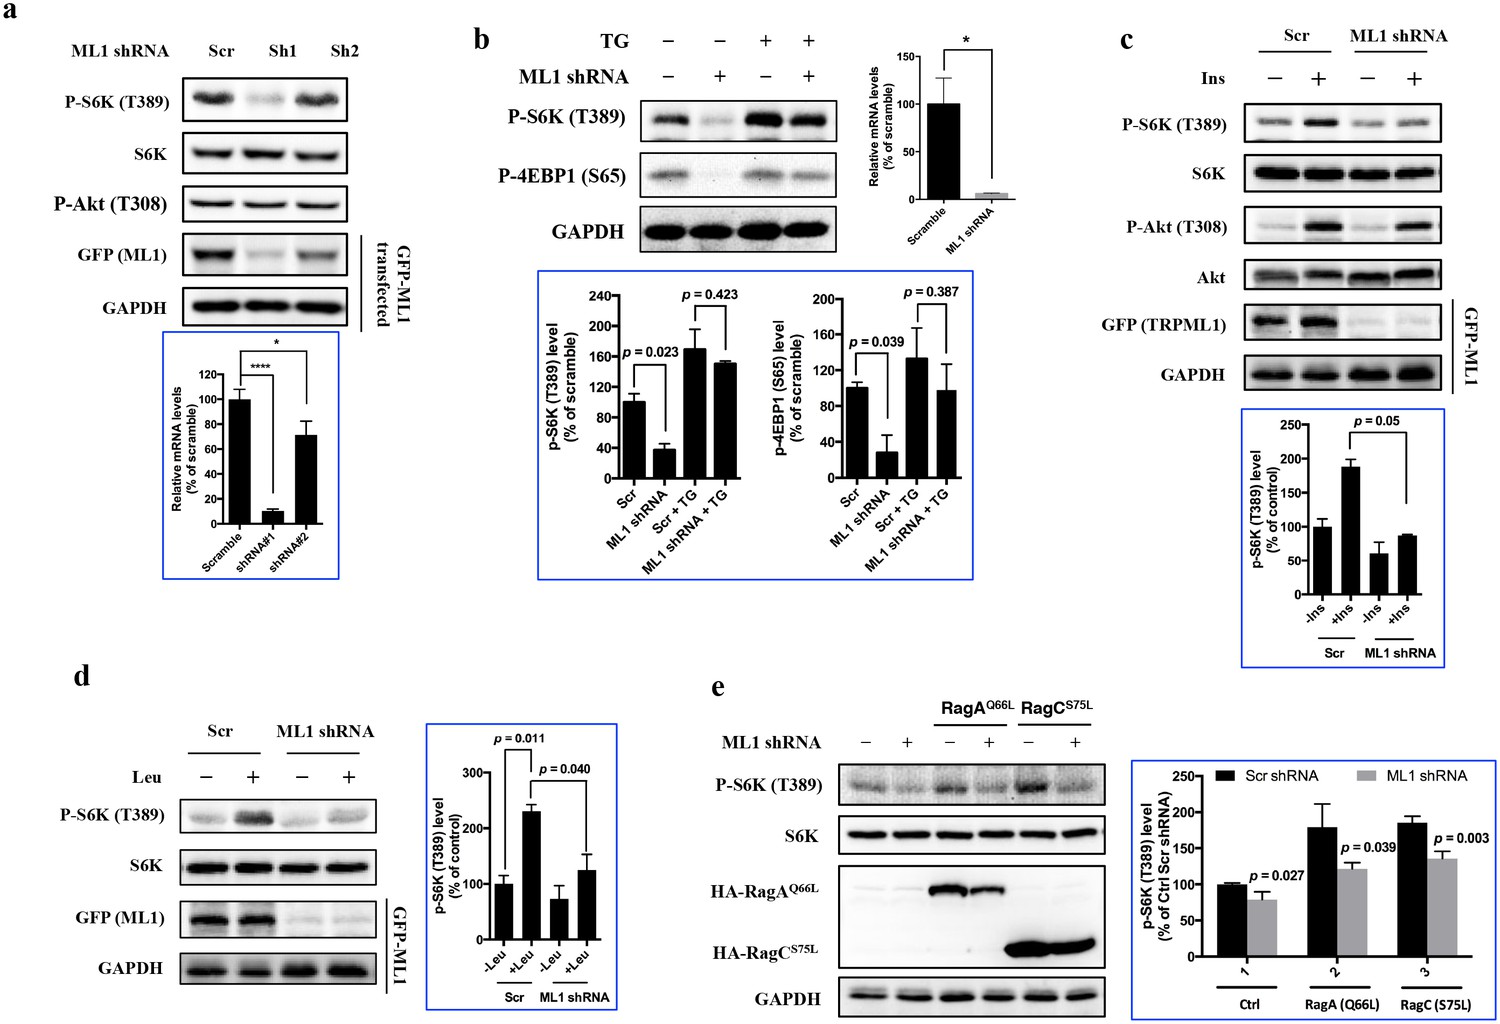
TRPML1 is required for the full activation of mTORC1.
(a) HEK293T cells were transduced with lentiviral scrambled shRNA (Scr) and shRNA targeting human TRPML1 (Sh1 and Sh2), respectively. To assess the knockdown efficiency, a fraction of transduced cells were transfected with EGFP-TRPML1. After 24 hr, transfected or untransfected cells were lysed and subjected to immunoblotting. Untransfected cells were used to detect p-S6K, S6K and p-Akt, and transfected cells were used to detect GFP and GAPDH. RT-qPCR was also performed to evaluate the knockdown efficiency (bottom panel) (mean ± s.d., n = 2 independent experiments). (b) Scrambled shRNA or TRPML1 shRNA-transduced HUVEC were treated with vehicle control or thapsigargin (5 μM) for an additional 2 hr. Cells were lysed and subjected to immunoblotting. Knockdown efficiency was assessed by RT-qPCR (right panel). The bottom panel of plots shows the percentage of p-S6K and p-4EBP1 levels compared with scramble shRNA transduced vehicle control treated HUVEC normalized by GAPDH loading control (mean ± s.d., n = 2 independent experiments). (c and d) Scrambled shRNA or TRPML1 shRNA transduced HEK293T cells were deprived for 24 hr of serum (c) or 3 hr of leucine (d) and, where indicated, were stimulated with 600 nM insulin or 52 μg/ml leucine for 10 min. Simultaneously, another fraction of scrambled shRNA or TRPML1 shRNA-transduced cells were transfected with EGFP-TRPML1 for 24 hr. Cells were lysed and subjected to immunoblotting. The plots show the percentage of p-S6K levels compared with scramble shRNA transduced serum (c) or leucine (d) starved HEK293T cells normalized by total S6K control (mean ± s.d., n = 2 independent experiments, respectively). (e) Scrambled shRNA or TRPML1 shRNA-transduced HEK293T cells were transfected with Rag AQ66A or Rag CS75L for 24 hr. Cells were lysed and subjected to immunoblotting. The plot shows the percentage of p-S6K level compared with scramble shRNA transduced empty vector transfected HEK293T cells normalized by total S6K control. (mean ± s.d. for n = 3 independent experiments).
Figure 1—figure supplement 1
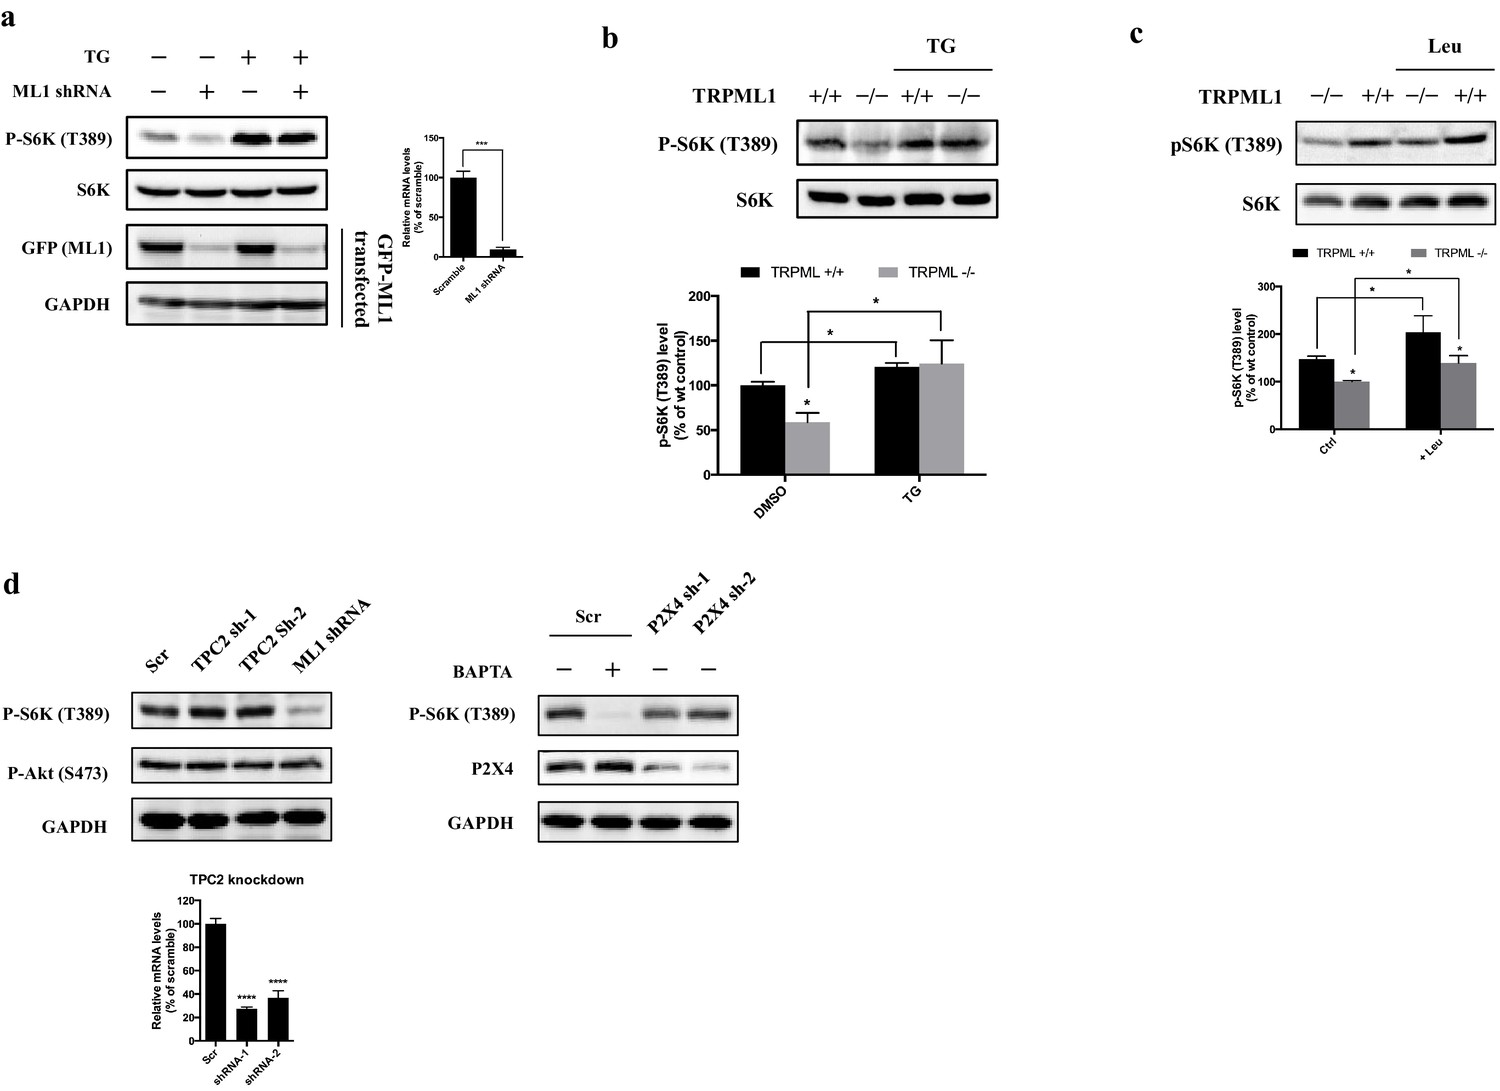
Effects of TRPML1 on mTORC1 activation.
(a) Scrambled shRNA or TRPML1 shRNA-transduced HEK293T cells were treated with vehicle control or thapsigargin (5 μM) for 2 hr, respectively. Cells were lysed and subjected to immunoblotting. RT-qPCR (right panel) and EGFP-TRPML1 transfected cells were used to evaluate the knockdown efficiency. (b) Healthy human fibroblast or mucolipidosis IV patient’s fibroblasts (TRPML-/-) were treated with vehicle control or thapsigargin (5 μM) for 2 hr, respectively. Cells were lysed and subjected to immunoblotting. The plot shows the percentage of p-S6K level compared with vehicle control treated wild type human fibroblasts normalized by total S6K control. (mean ± s.d. for n = 3 independent experiments). (c) WT and mucolipidosis IV patient’s fibroblasts (TRPML-/-) were treated with vehicle control or leucine for 10 min. Cells were lysed and subjected to immunoblotting. The plot shows the percentage of p-S6K level compared with vehicle control treated TRPML-/- human fibroblasts normalized by total S6K control. (mean ± s.d. for n = 2 independent experiments). (d) Lentivirus carrying scrambled shRNA, TRPML1 shRNA, TPC2 shRNA or P2X4 shRNA transduced HEK293T cells were lysed and subjected to immunoblotting. RT-qPCR (bottom panel) was used to evaluate the knockdown efficiency of TPC2.
Figure 2 with 2 supplements

Overexpression or pharmacological stimulation of TRPML1 activates mTORC1 signaling pathway.
(a) HEK293T cells (80% confluency) were transfected with EGFP vector, EGFP-TRPML1 or its non-conducting pore mutant (D471K/D472K) EGFP-TRPML1 (KK) for 20 hr. Cells were lysed and subjected to immunoblotting. The plot shows the percentage of p-S6K levels compared with vector transfected cells normalized by total S6K control (mean ± s.d., n = 3 independent experiments). (b) HEK293T cells were treated with different concentrations of ML-SA1 for 3 hr. Cells were lysed and subjected to immunoblotting. The plot shows the dose-response curve of ML-SA1 normalized by total S6K. (c) Scrambled shRNA or TRPML1 shRNA transduced HEK293T cells were treated with varying concentrations of MLSA1 for 3 hr. Cells were lysed and subjected to immunoblotting. The plot shows the percentage of p-S6K levels compared with scramble shRNA transduced vehicle control treated 293T cells normalized by GAPDH loading control (mean ± s.d., n = 3 independent experiments). (d) HEK293T cells were pretreated with bafilomycin A1 (1 μM) or GPN (200 μM) for 1 hr, followed by treatment with or without MLSA1 for an additional 1.5 hr. Cells were lysed and subjected to immunoblotting. The plot shows the percentage of p-S6K levels compared with vehicle control normalized by GAPDH loading control (mean ± s.d., n = 3 independent experiments). *p<0.05, **p<0.01, n.s. no significant difference.
Figure 2—figure supplement 1
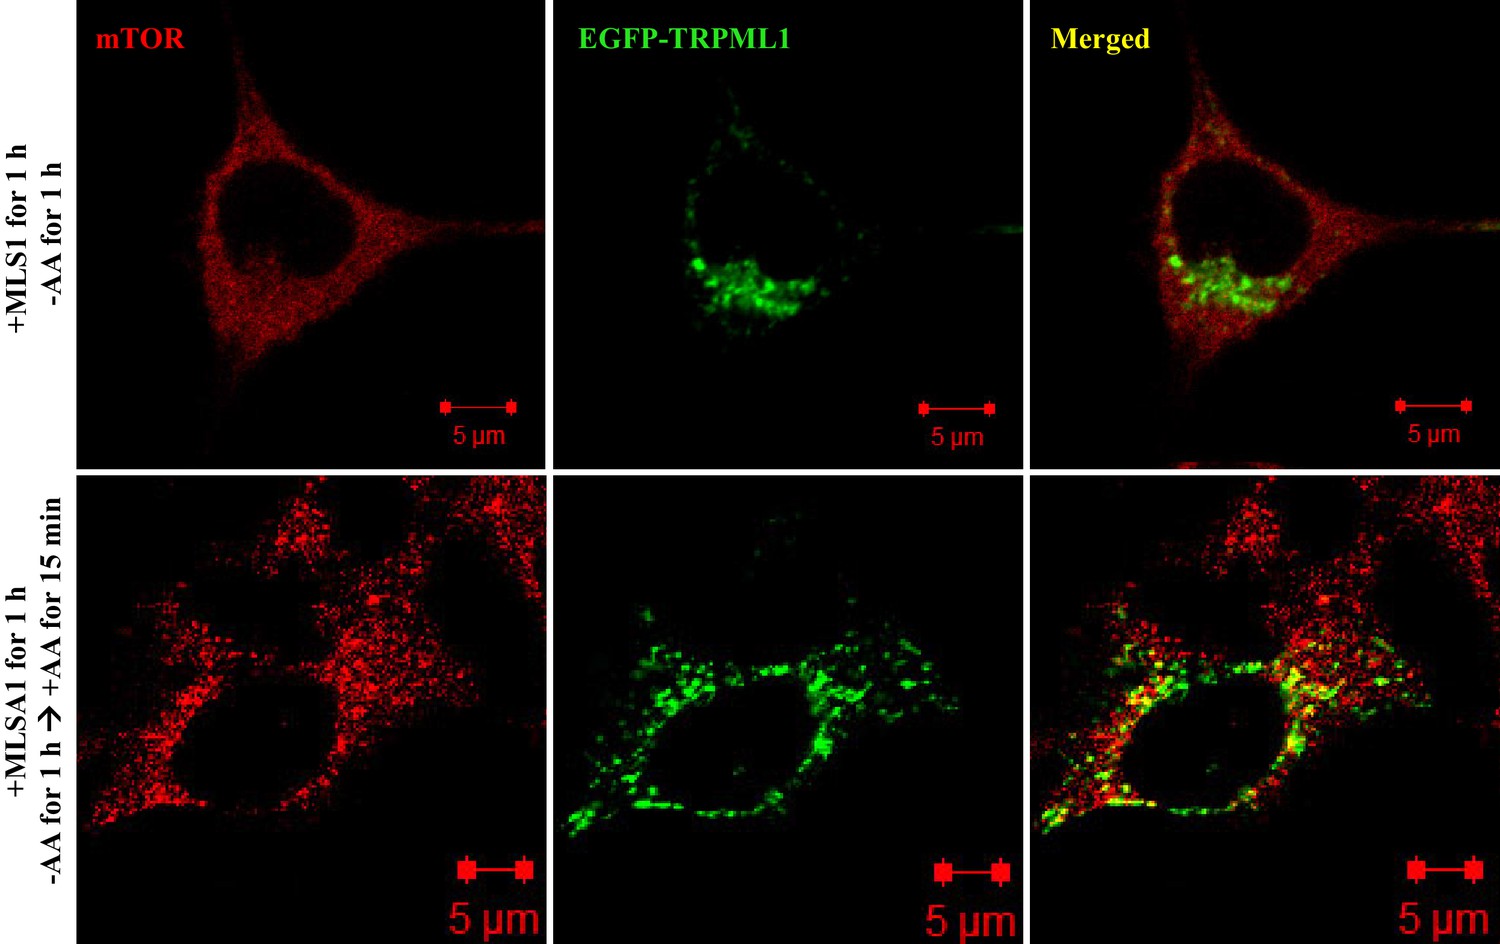
Colocalization of EGFP-TRPML1 and mTOR.
HEK293T cells were transfected with EGFP-TRPML1 expression plasmid. After 18 hr, cells were treated with MLSA1 (15 μM) for 1 hr, and starved with amino acids for 1 hr, or starved with amino acids for 1 hr and restimulated with amino acids for 15 min. Cells were fixed, stained with anti-mTOR antibody and images were captured using a Zeiss LSM 700 confocal microscope.
Figure 2—figure supplement 2
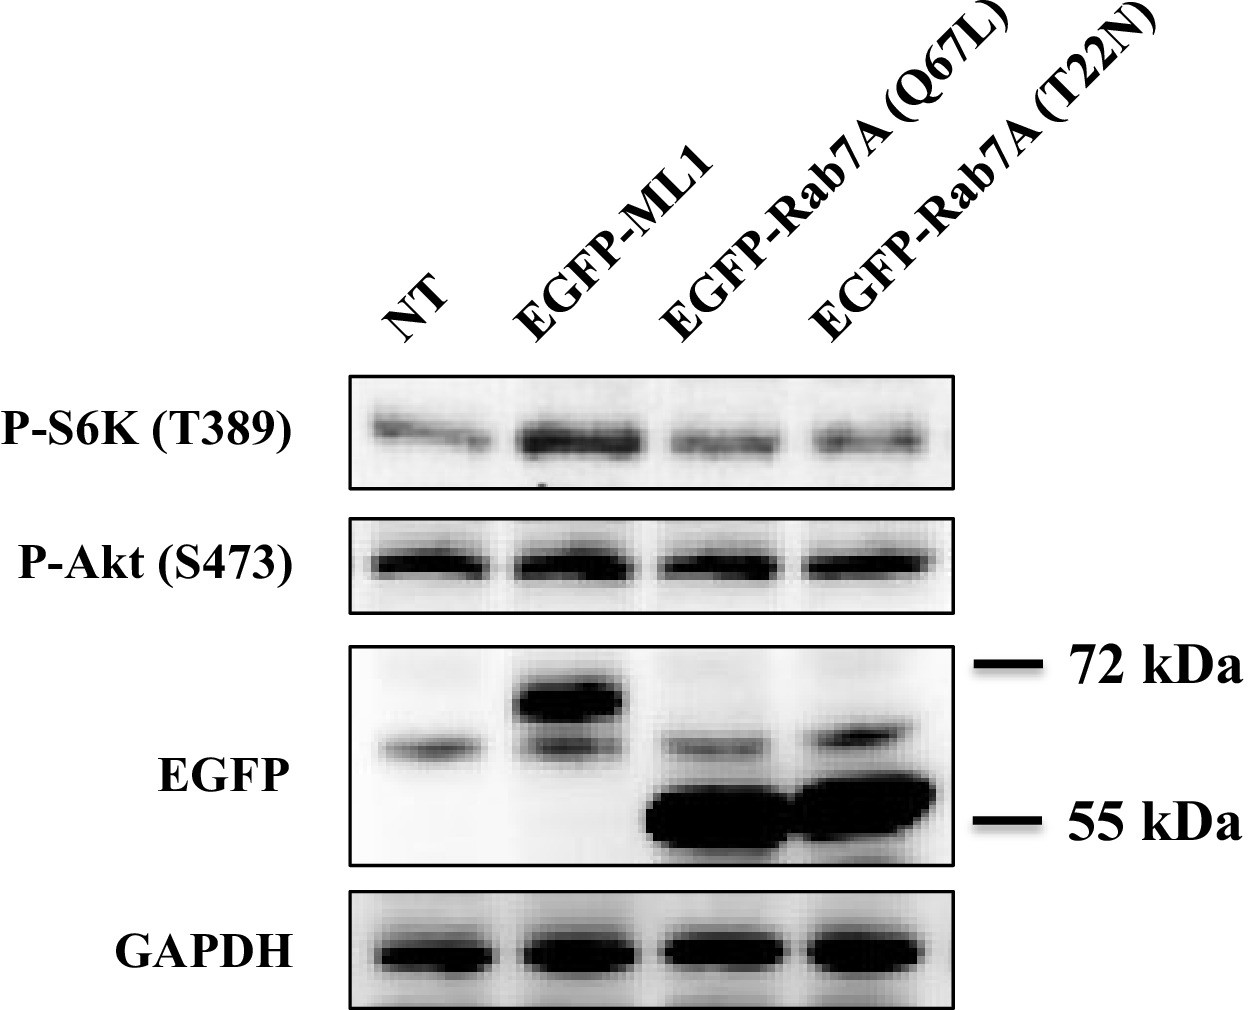
Effects of constitutively active or dominant negative Rab 7A.
HEK293T cells were transfected with EGFP-ML1, EGFP-Rab7A (Q67L) or EGFP-Rab7A (T22N). After 19 hr, the cells transfected with EGFP-ML1 were treated with MLSA1 (20 μM) for 1 hr. Cells were lysed and subjected to immunoblotting.
Figure 3 with 2 supplements
Regulation of mTORC1 by cytosolic calcium and CaM occurs proximal to mTORC1 itself.
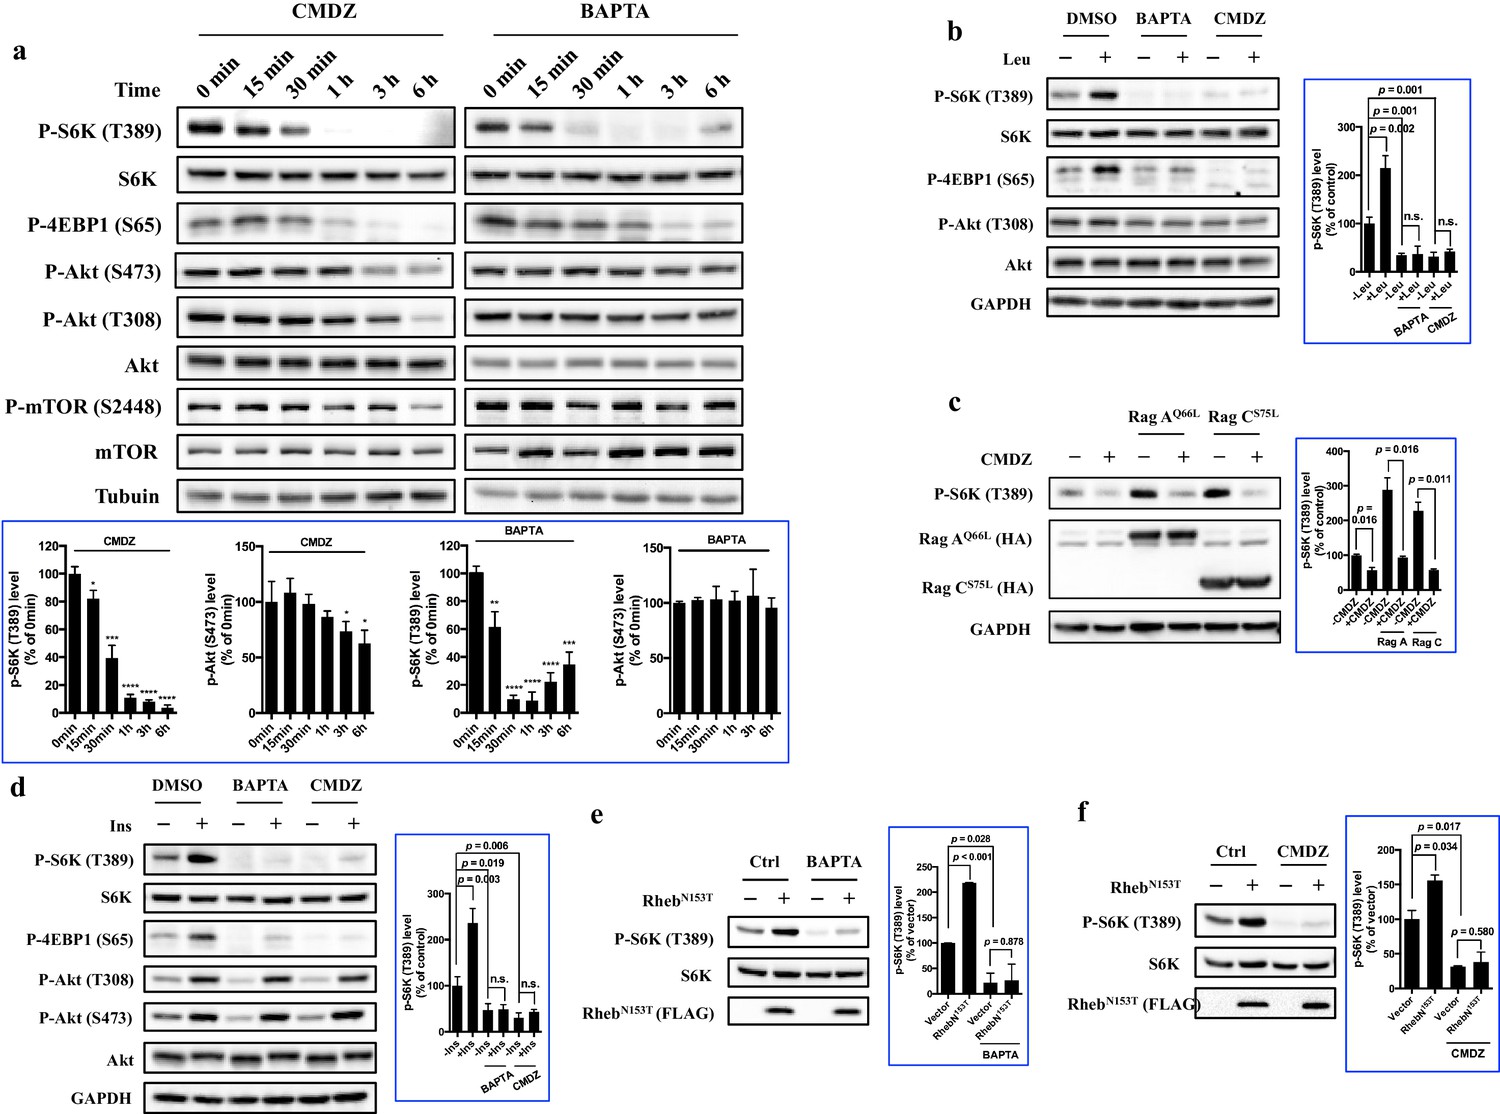
(a) Effects of 10 μM CaM antagonist calmidazolium (CMDZ) or 25 μM cytosolic Ca2+ chelator BAPTA-AM (BAPTA) on the phosphorylation of different proteins of the mTOR signaling pathway at different time points. The bottom panel of plots shows the percentage of p-S6K and p-Akt (S473) levels compared with 0 min treated 293T cells normalized by total S6K and total Akt control, respectively (mean ± s.d., n = 3 independent experiments). (b and d) Effects of CMDZ (10 μM) or BAPTA-AM (25 μM) on the phosphorylation of indicated proteins in response to deprivation and stimulation with leucine (b) and insulin (d). Cell lysates were prepared from HEK293T cells deprived for 3 hr of leucine (b) or 24 hr of serum (d) and, where indicated, stimulated with 52 μg/ml leucine or 600 nM insulin for 10 min. CMDZ (10 μM) or BAPTA-AM (25 μM) was added 1 hr prior to cell harvesting. The plots show the percentage of p-S6K levels compared with vehicle control treated leucine (b) or serum (d) starved HEK293T cells normalized by total S6K control (mean ± s.d., n = 3 independent experiments, respectively). (c) Effects of CMDZ (10 μM) on the phosphorylation of S6K in HEK293T cells transfected with constitutively active RagA or RagC in expression vectors. Cell lysates were prepared and subjected to immunoblotting. The plot shows the percentage of p-S6K levels compared with vector transfected vehicle control treated 293T cells normalized by GAPDH loading control (mean ± s.d., n = 3 independent experiments). (e and f) Effects of 25 μM BAPTA-AM (e) and 10 μM CMDZ (f) on the phosphorylation state of S6K in HEK293T cells stably expressing constitutively active Rheb as indicated. HEK293T cells were transduced with lentiviral FLAG-tagged RhebN153T, and treated with indicated compounds for 1 hr. Cell lysates were prepared and used for immunoblotting. The plots show the percentage of p-S6K levels compared with vehicle control treated empty lentiviral vector transduced 293T cells normalized by total S6K control (mean ± s.d., n = 2 independent experiments). *p<0.05, **p<0.01, ***p<0.001, ****p<0.0001, n.s. no significant difference.
Figure 3—figure supplement 1
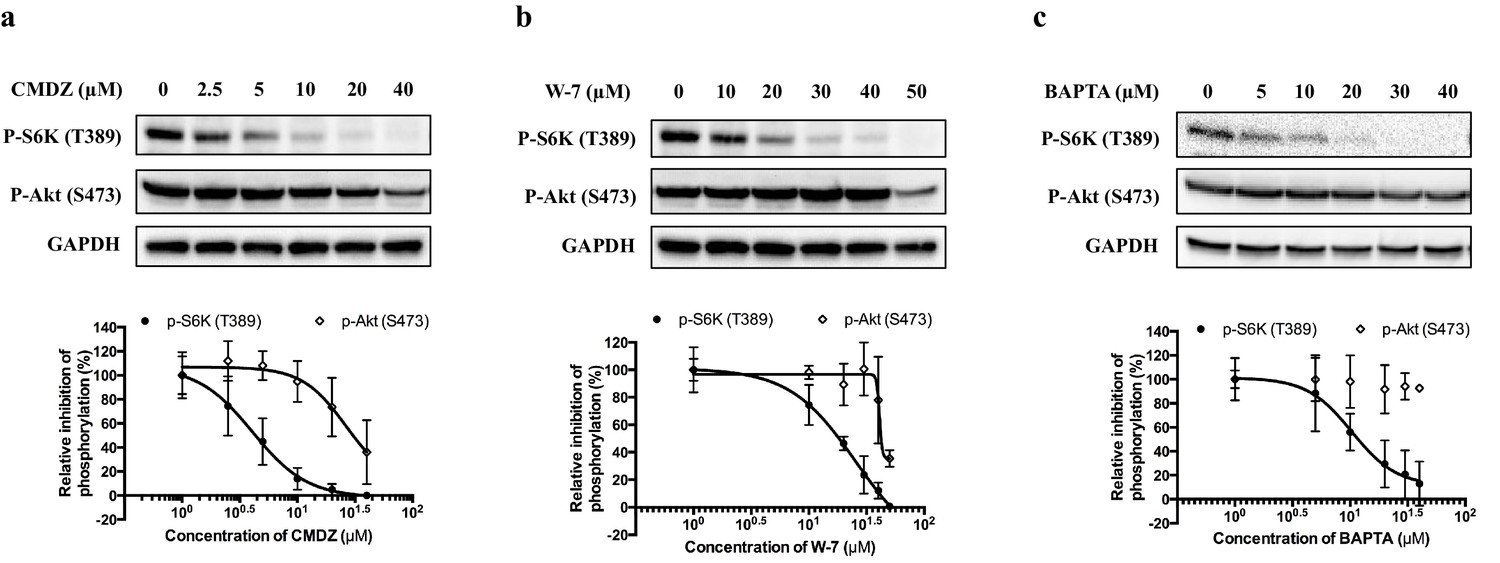
Effects of calmodulin antagonist (a) calmidazolium (CMDZ), (b) W-7 and (c) cytosolic Ca2+ chelator BAPTA-AM on phosphorylation state of S6K (T389) and Akt (S473).
HEK293T cells were treated with different concentrations of indicated compound for 1 hr. The phosphorylation state of S6K and Akt was analyzed by immunoblotting. The plots show the dose-response curve of CMDZ, W-7 and BAPTA normalized by total S6K, respectively.
Figure 3—figure supplement 2

Effects of calmodulin antagonist calmidazolium (CMDZ) and cytosolic Ca2+ chelator BAPTA-AM on mTOR signaling pathway in HUVEC and A549 cells.
HUVEC (a) and A549 (b) cells were treated with different concentrations of BAPTA or CMDZ for 1 hr. The phosphorylation state of S6K and 4EBP1 was analyzed by immunoblotting. HUVEC (c) and A549 (d) cells were transduced with lentivirus carrying constitutively active RhebN153T. The transduced cells were treated with BAPTA or CMDZ for 1 hr. The phosphorylation state of S6K was analyzed by immunoblotting.
Figure 4 with 4 supplements
CaM interacts with mTORC1 and regulates mTORC1 kinase activity in vitro.
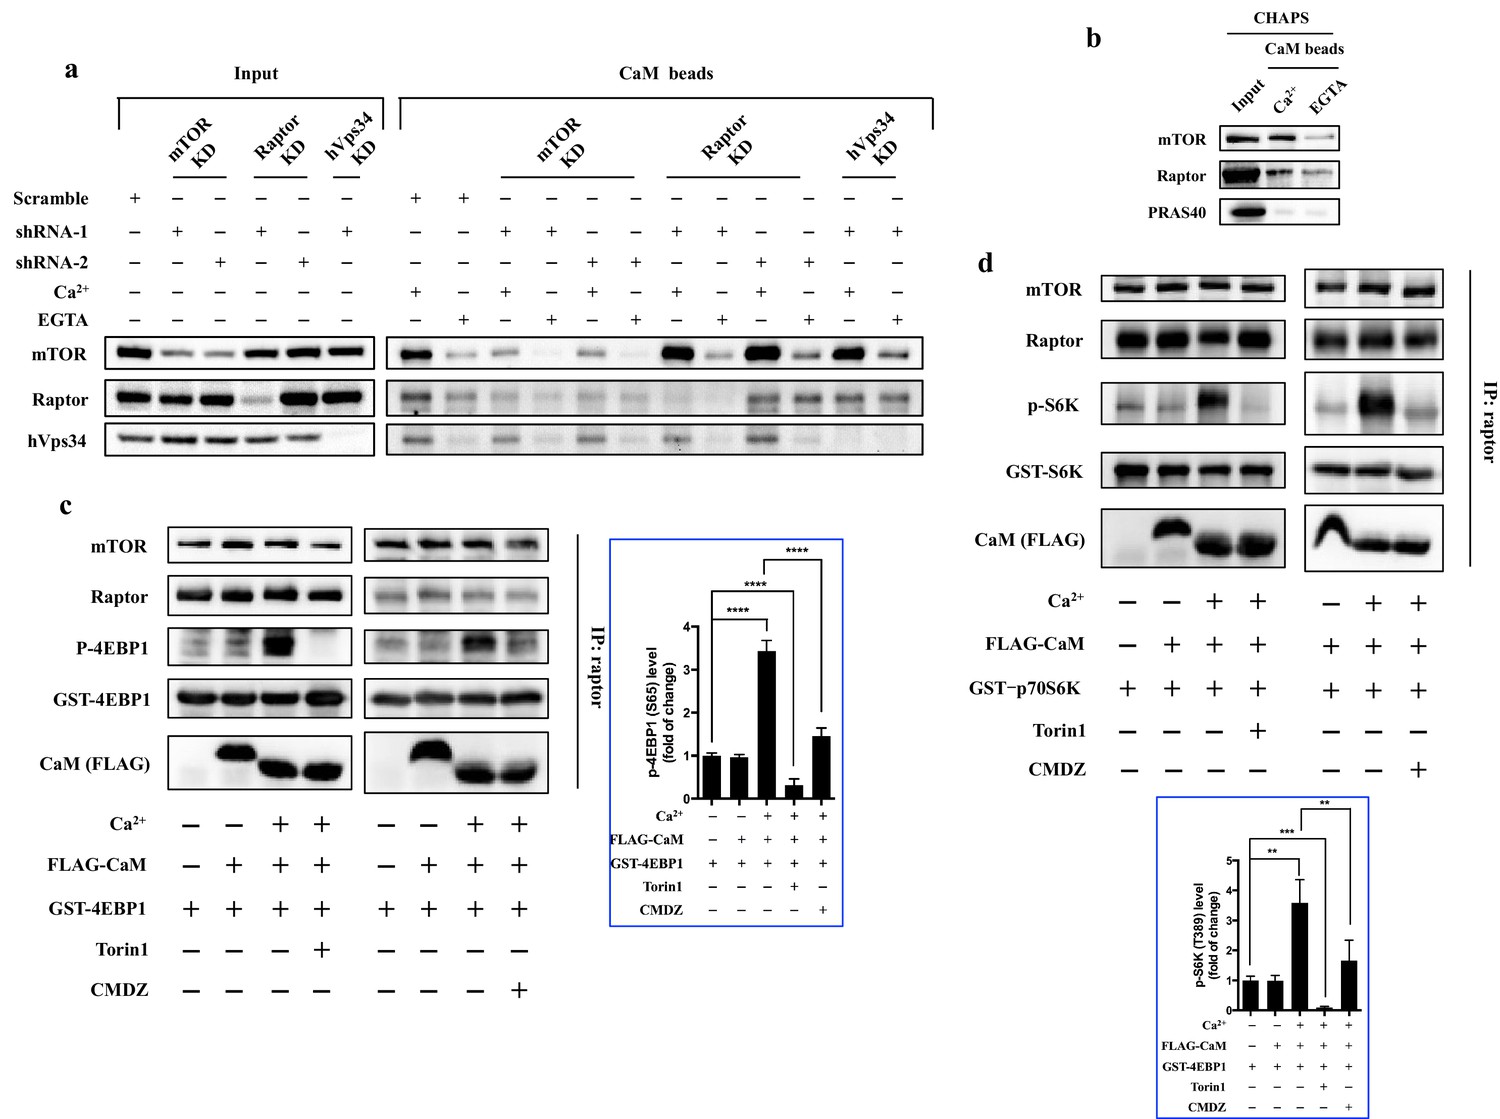
(a) CaM interacts with mTOR independent of hVps34 or raptor. Cell lysates were prepared from HEK293T cells transduced with lentiviral shRNAs targeting human mTOR, raptor, hVps34 or scrambled shRNA, followed by CaM sepharose precipitation in the presence of CaCl2 (1 mM) or EGTA (5 mM). The cell lysates and precipitates were analyzed by immunoblotting to detect the indicated proteins. (b) Endogenous mTORC1 was pulled down by CaM sepharose in a Ca2+-dependent manner. HEK293T cells were lysed in CHAPS buffer, and the lysates were incubated with CaM sepharose in the presence of CaCl2 (1 mM) or EGTA (5 mM). The precipitates were analyzed by immunoblotting. (c and d) Cell lysates were prepared from HEK293T cells in CHAPS buffer, and endogenous mTORC1 was immunoprecipitated by a raptor antibody. ATP (250 μM), Torin1 (100 nM), CMDZ (8 μM), CaM (2 μM) or/and CaCl2 (1 mM) were added into the kinase reaction as indicated. Phosphorylation of 4EBP1 (c) and S6K (d) were detected by immunoblotting. The plots show the fold of change of phosphorylation of 4EBP1 (c) or S6K (d) compared with control group (first lane) normalized by total GST-tagged protein control. (mean ± s.d., n = 6 and 5 independent experiments, respectively).
Figure 4—figure supplement 1

Effects of calmidazolium (CMDZ) on hVps34 depleted cells.
(a) HEK 293T cells were transduced with lentivirus carrying scramble shRNA or shRNA targeting hVps34. 96 hr after puromycin selection, cells were treated with vehicle control or CMDZ (10 μM) for 1 hr. (b) The same cells in (a) were starved with amino acids for 1 hr, and re-stimulated with amino acids for 10 min. Cells were lysed and subjected to immunoblotting.
Figure 4—figure supplement 2

CaM interacts with mTORC1 independently of raptor or hVps34.
(a) The interaction between CaM and mTORC1 is sensitive to detergents. Cell lysates were prepared from HEK293T cells in lysis buffer containing 1% Triton X-100 or 1% NP-40. Endogenous mTORC1 was precipitated by CaM sepharose in the presence of Ca2+ or EGTA. (b) The interaction between CaM and mTOR is inhibited by the CaM antagonist W-7. Cell lysates were prepared from HEK293T cells in CHAPS buffer, and endogenous mTOR was precipitated by CaM sepharose in the presence of W-7 or vehicle control.
Figure 4—figure supplement 3
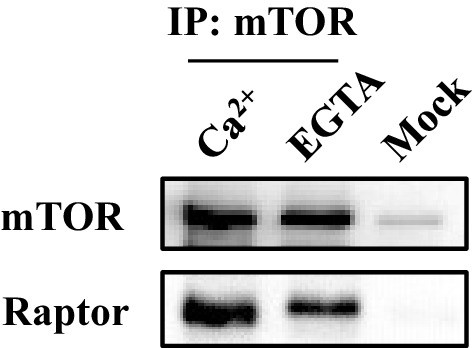
The presence or absence of Ca2+ does not affect the association of mTORC1.
Cell lysates were prepared from HEK293T in CHAPS buffer, and endogenous mTORC1 was immunoprecipitated by mTOR antibody. Rabbit IgG was used as mock immunoprecipitation.
Figure 4—figure supplement 4
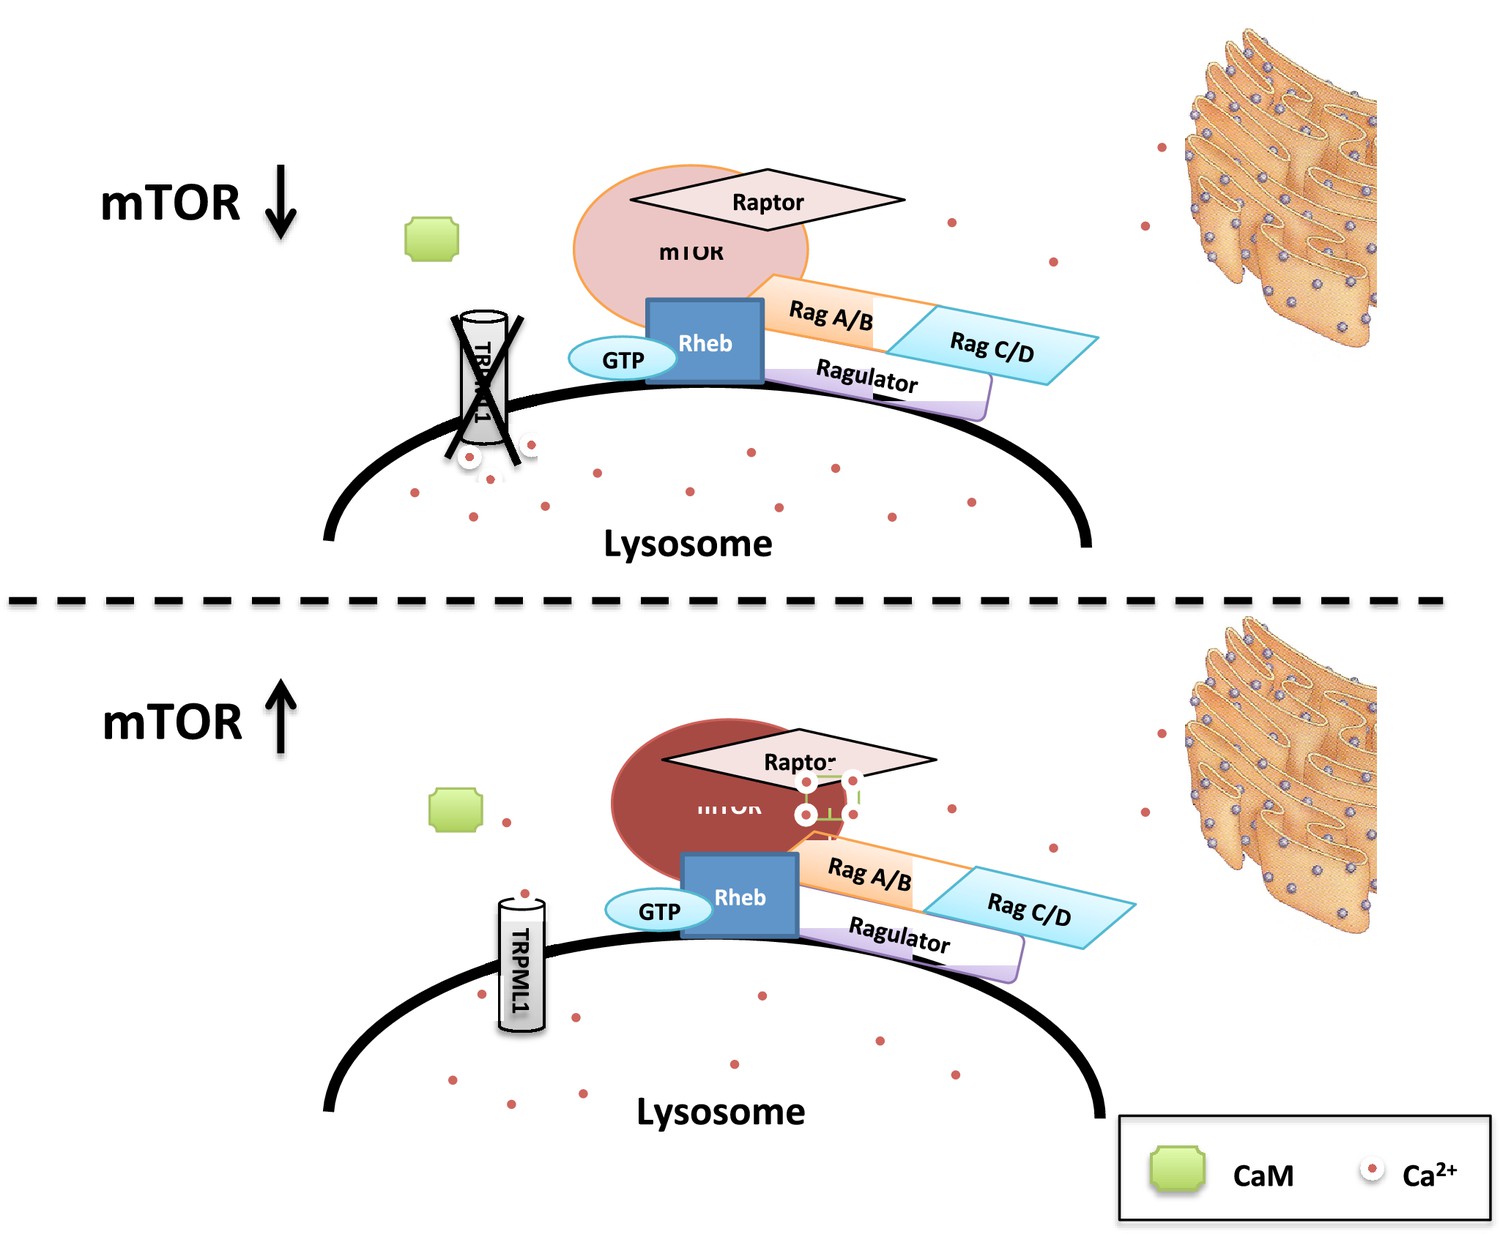
Proposed model of regulation of mTORC1 by TRPML1, lysosomal calcium and CaM.
Upon the translocation of mTORC1 onto the lysosome through binding to GTP-Rheb, lysosomal Ca2+ released through TRPML1 enriches the local Ca2+ concentration, prompting the binding to and activation of CaM, which in turn interacts with mTORC1 and leading to a fully activation of the kinase activity.
Author response image 1
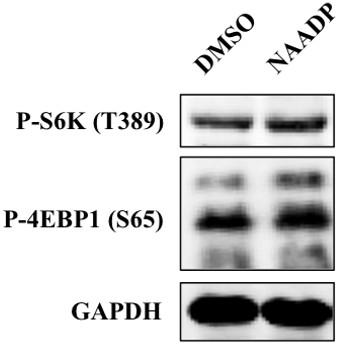
HEK293T cells were treated with NAADP (5 μM) for 1 hr, and were lysed and subjected to immunoblotting.
https://doi.org/10.7554/eLife.19360.015Download links
A two-part list of links to download the article, or parts of the article, in various formats.
Downloads (link to download the article as PDF)
Open citations (links to open the citations from this article in various online reference manager services)
Cite this article (links to download the citations from this article in formats compatible with various reference manager tools)
Regulation of mTORC1 by lysosomal calcium and calmodulin
eLife 5:e19360.
https://doi.org/10.7554/eLife.19360


