Regulation of neuronal axon specification by glia-neuron gap junctions in C. elegans
- Duke University Medical Center, United States
- Duke Medical Center, United States
- Howard Hughes Medical Institute, University of California, United States
- School of Medicine, University of California, United States
Figures
Figure 1 with 2 supplements
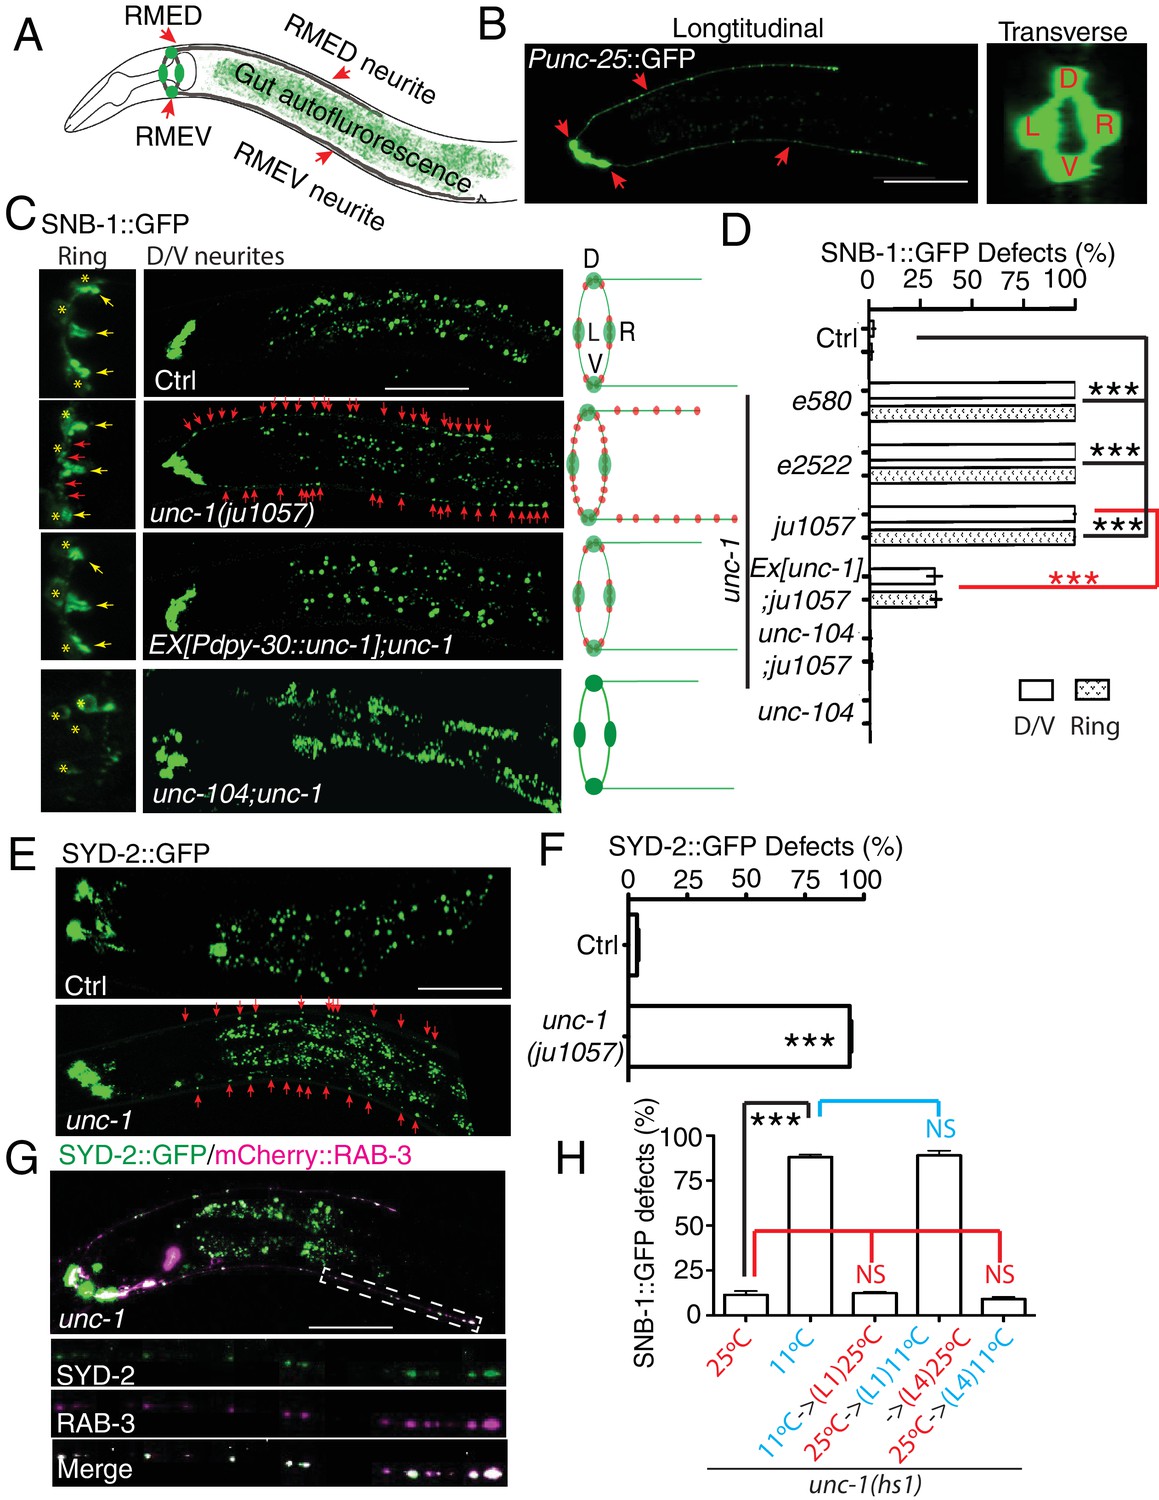
unc-1 is required for RME axon specification.
(A) A cartoon picture and (B) GFP images show the morphology of RME neurons. Cell bodies of four RME neurons, labeled as D (RME dorsal), V (RME ventral), L (RME left) and R (RME right), form a four-fold symmetry in the head region. RMED and RMEV each sends out a posterior neurite along the dorsal/ventral cords, respectively. Red arrows highlight RMED/V cell bodies and neurites. Gut auto-fluorescence from the intestine is commonly observed between RMED/V neurites. (C) Confocal images and schematic diagrams show the distribution of SNB-1::GFP puncta in control and mutant animals. Yellow stars mark the cell bodies of RME neurons, and yellow arrowheads point to axonal boutons. Red arrowheads mark the mis-accumulated SNB-1::GFP puncta. Red dots in diagrams represent SNB-1::GFP puncta. (D) Quantification of the percentage of animals with SNB-1::GFP puncta in RME D/V neurites and along the axonal processes. (E) Confocal images and schematic diagrams of control and unc-1(lf) animals expressing SYD-2::GFP in RME neurons. (F) Quantification of percentage of animals with SYD-2::GFP puncta in RMED/V neurites. (G) SYD-2::GFP is co-localized with mCherry:: RAB-3 in RMED/V neurites of unc-1(lf) animals. (H) unc-1 regulates the establishment of RME axon specification during development. (See details of the temperature-shift experiments in the method section). Each experiment was performed with N > 200 animals at least three times. For transgenic animals, the results shown here are generated from at least three independent lines. Data are shown as mean ± SD. Student t-test, ***p<0.001, NS: no significant difference. Scale bar: 20 μm. Details of strain and plasmid information in all Figures are listed in the Supplementary file 1.
Figure 1—figure supplement 1
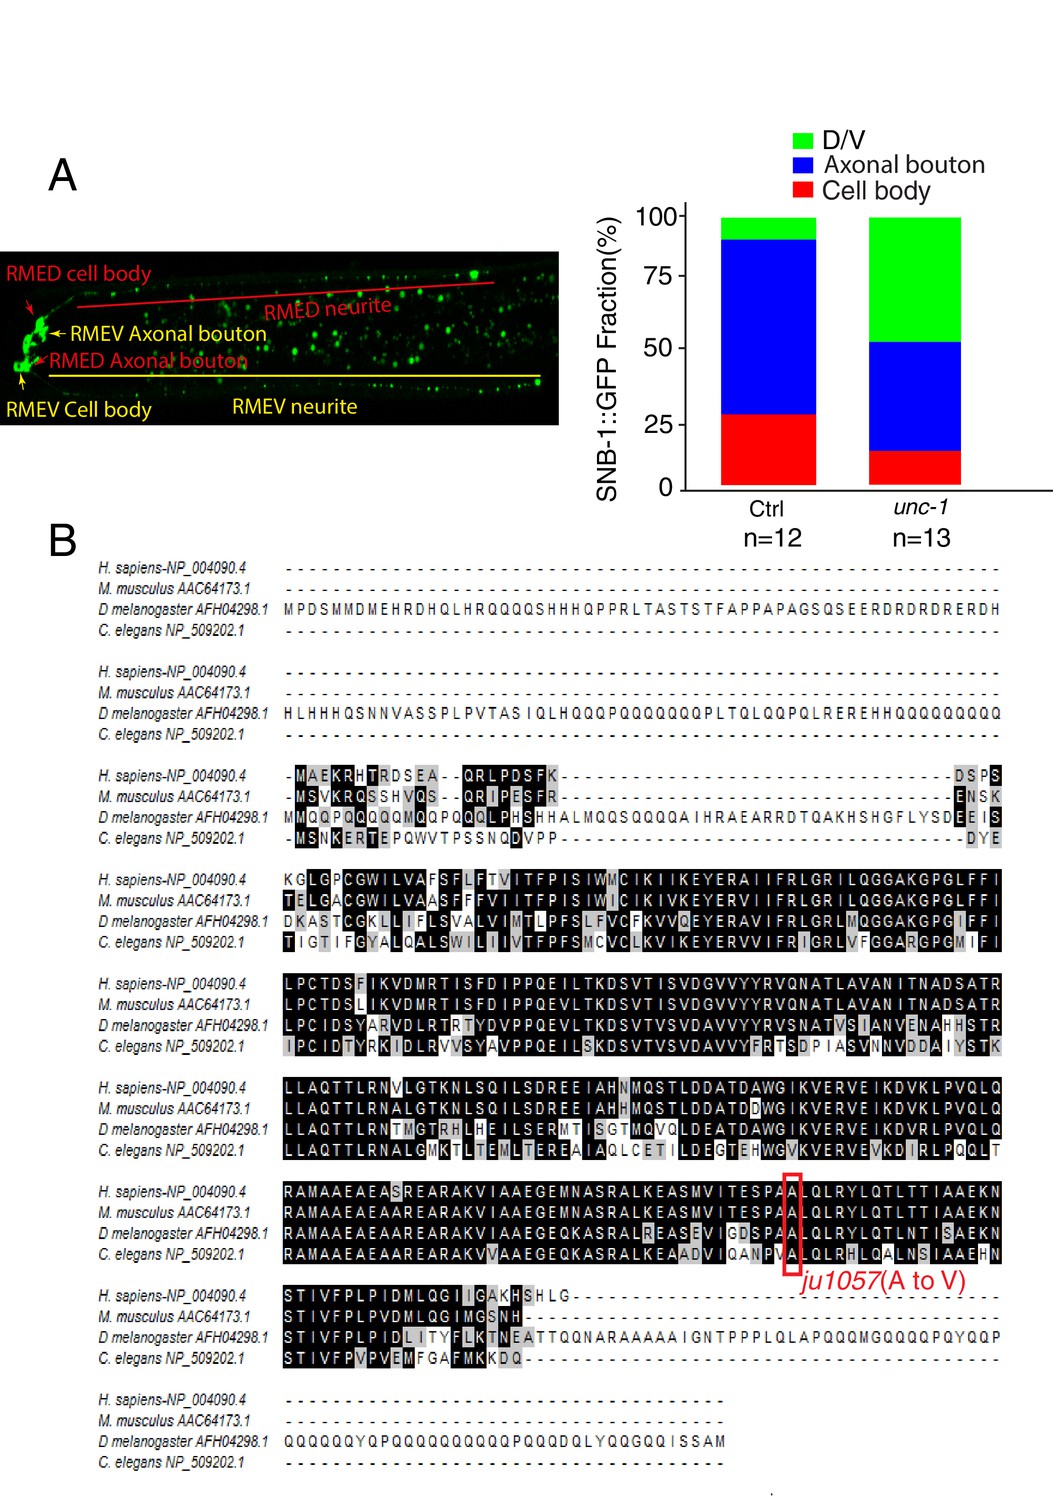
ju1057 is a loss-of-function allele of unc-1.
(A) Quantification of the fractions of SNB-1::GFP signals in RME D/V neurites (green), axonal boutons (blue) and cell bodies (red) in control and unc-1(lf) animals. The total intensity of SNB-1::GFP in axonal boutons, D/V neurites and cell bodies were measured and then subtracted by the background for the exact same area. The fractions of GFP signals were calculated by dividing each part with the sum of all GFP signals in RME neurons. (B) The alignment of C. elegans UNC-1 with its homologs in Drosophila, mouse, and human. The Red rectangle highlights the mutation in the ju1057 allele.
Figure 1—figure supplement 2
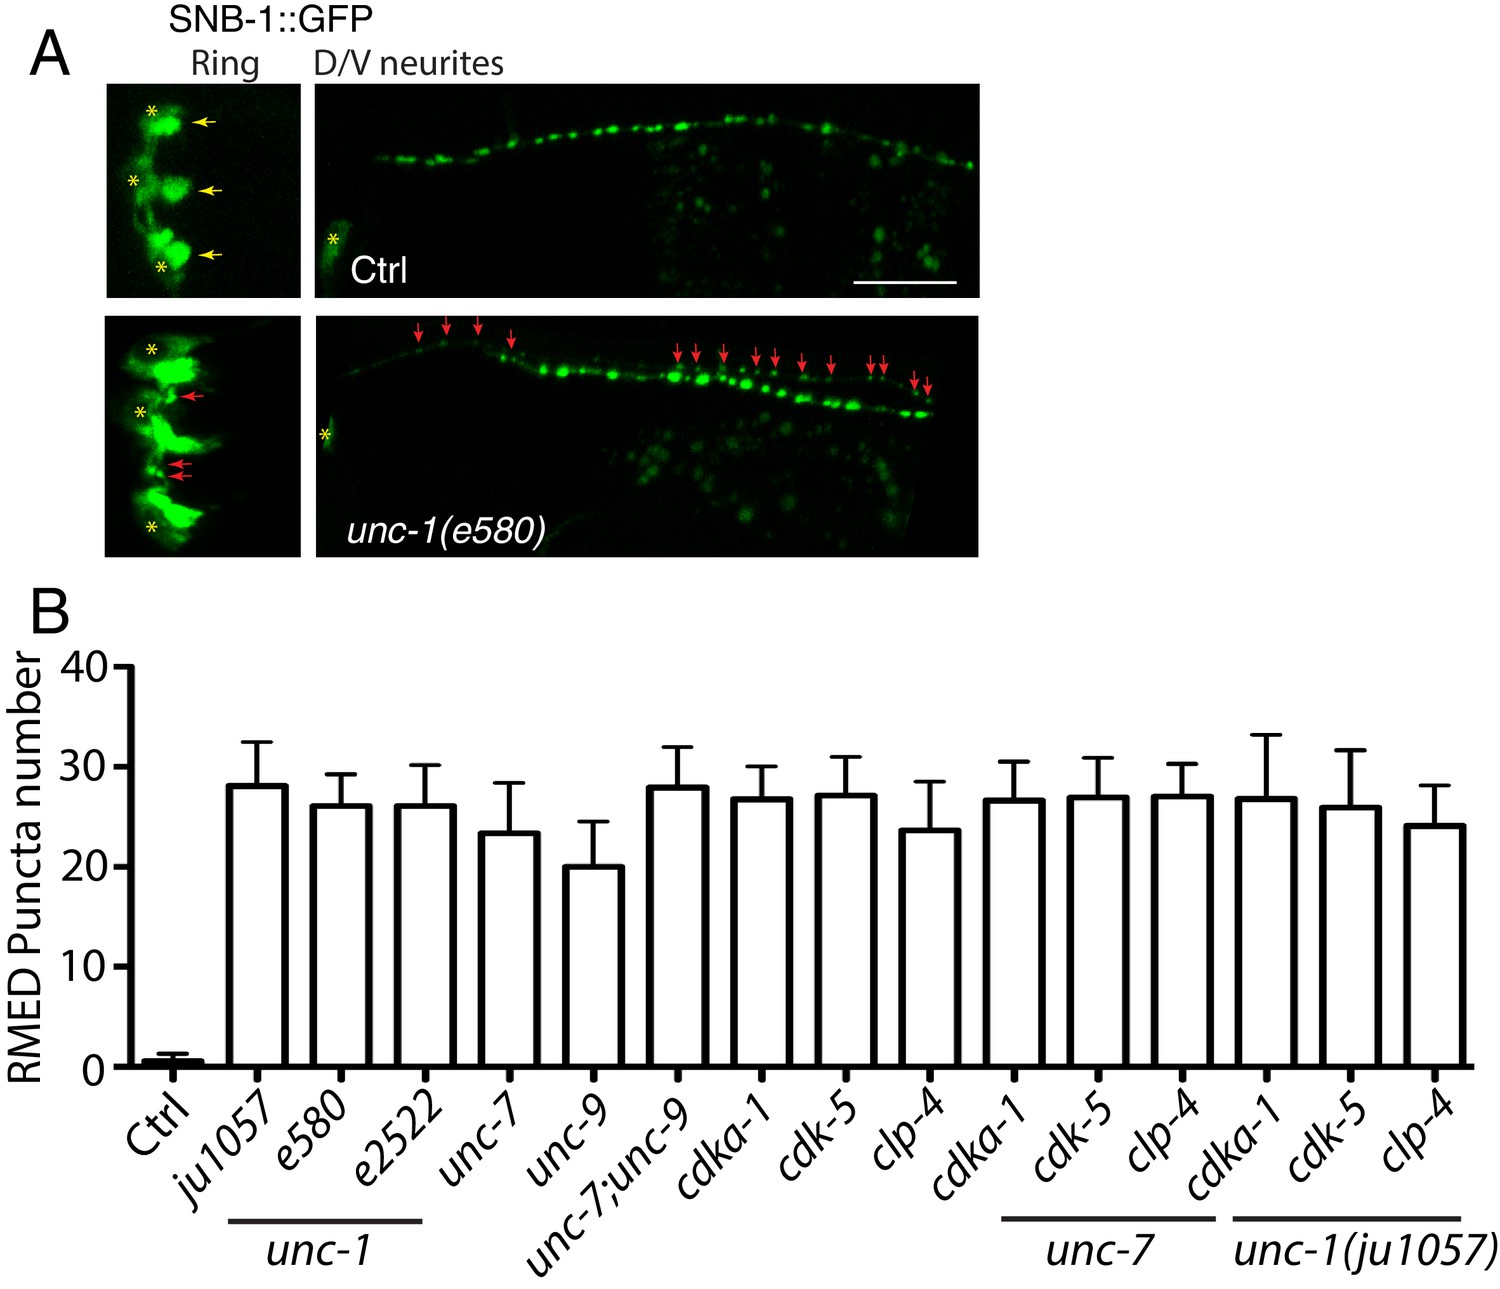
unc-1(lf) affects RME axon specification.
(A) Images showed that loss-of-function in unc-1(e580) (without unc-30(ju32) background) caused the misaccumulation of SNB-1::GFP puncta in both RME nerve ring processes and RME D neurites, Scar bar: 20 μm. (B) Quantification of the number of SNB-1::GFP puncta in RME D neurites. N >= 10 for each genotypes. No significant difference (p > 0.05, one-way ANOVA) among all genotypes.
Figure 2 with 1 supplement
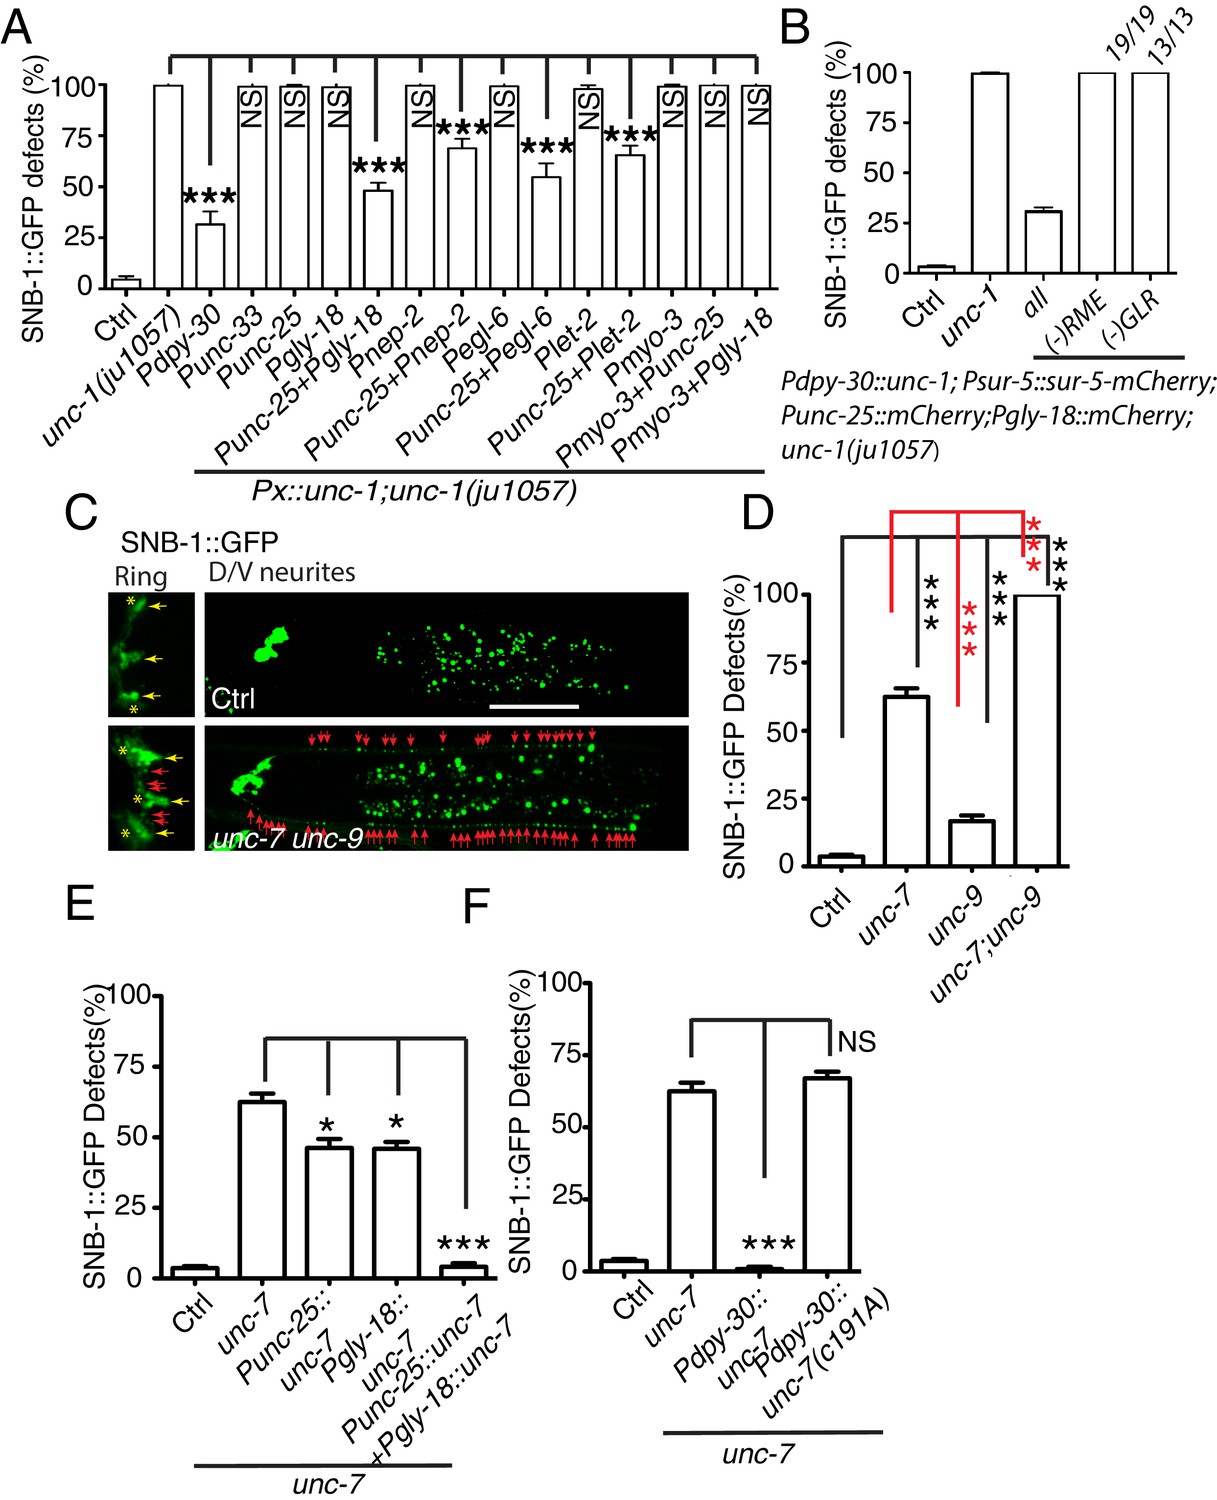
Gap junctions between GLR cells and RME neurons are required for RME axon specification.
(A) Quantification of SNB-1::GFP puncta distribution defects in unc-1(lf) mutants and rescue transgenic strains. Promoters used to drive expression of unc-1 cDNA are: Pdpy-30 in all tissues; Punc-33 and Punc-25 in all neurons and RME neurons, respectively; Pgly-18, Pnep-2, Pegl-6, and Plet-2 promoters in GLR cells (note: Pgly-18, Pegl-6, and Plet-2 are also active in a few other cells that are not overlapping in identity) and Pmyo-3 in muscle. (B) Results from mosaic analyses show that unc-1 is required in both GLR cells and RME neurons. (C) Representative images of SNB-1::GFP puncta distribution in control and unc-7 unc-9 double mutant animals. (D) Quantification of SNB-1::GFP distribution defects in unc-7, unc-9 single and unc-7 unc-9 double mutant animals. (E) Quantification of SNB-1::GFP distribution defects in unc-7 and rescued transgenic strains. (F) Quantification of SNB-1::GFP distribution defects in transgenic animals expressing wild type or C191A form of unc-7. Each experiment was performed with N > 200 animals at least three times. For transgenic animals, the results shown here are generated from at least three independent lines. Data are shown as mean ± SD. Student t-test, ***p<0.001, *p<0.05, NS: no significant difference. Scale bar: 20 μm.
Figure 2—figure supplement 1
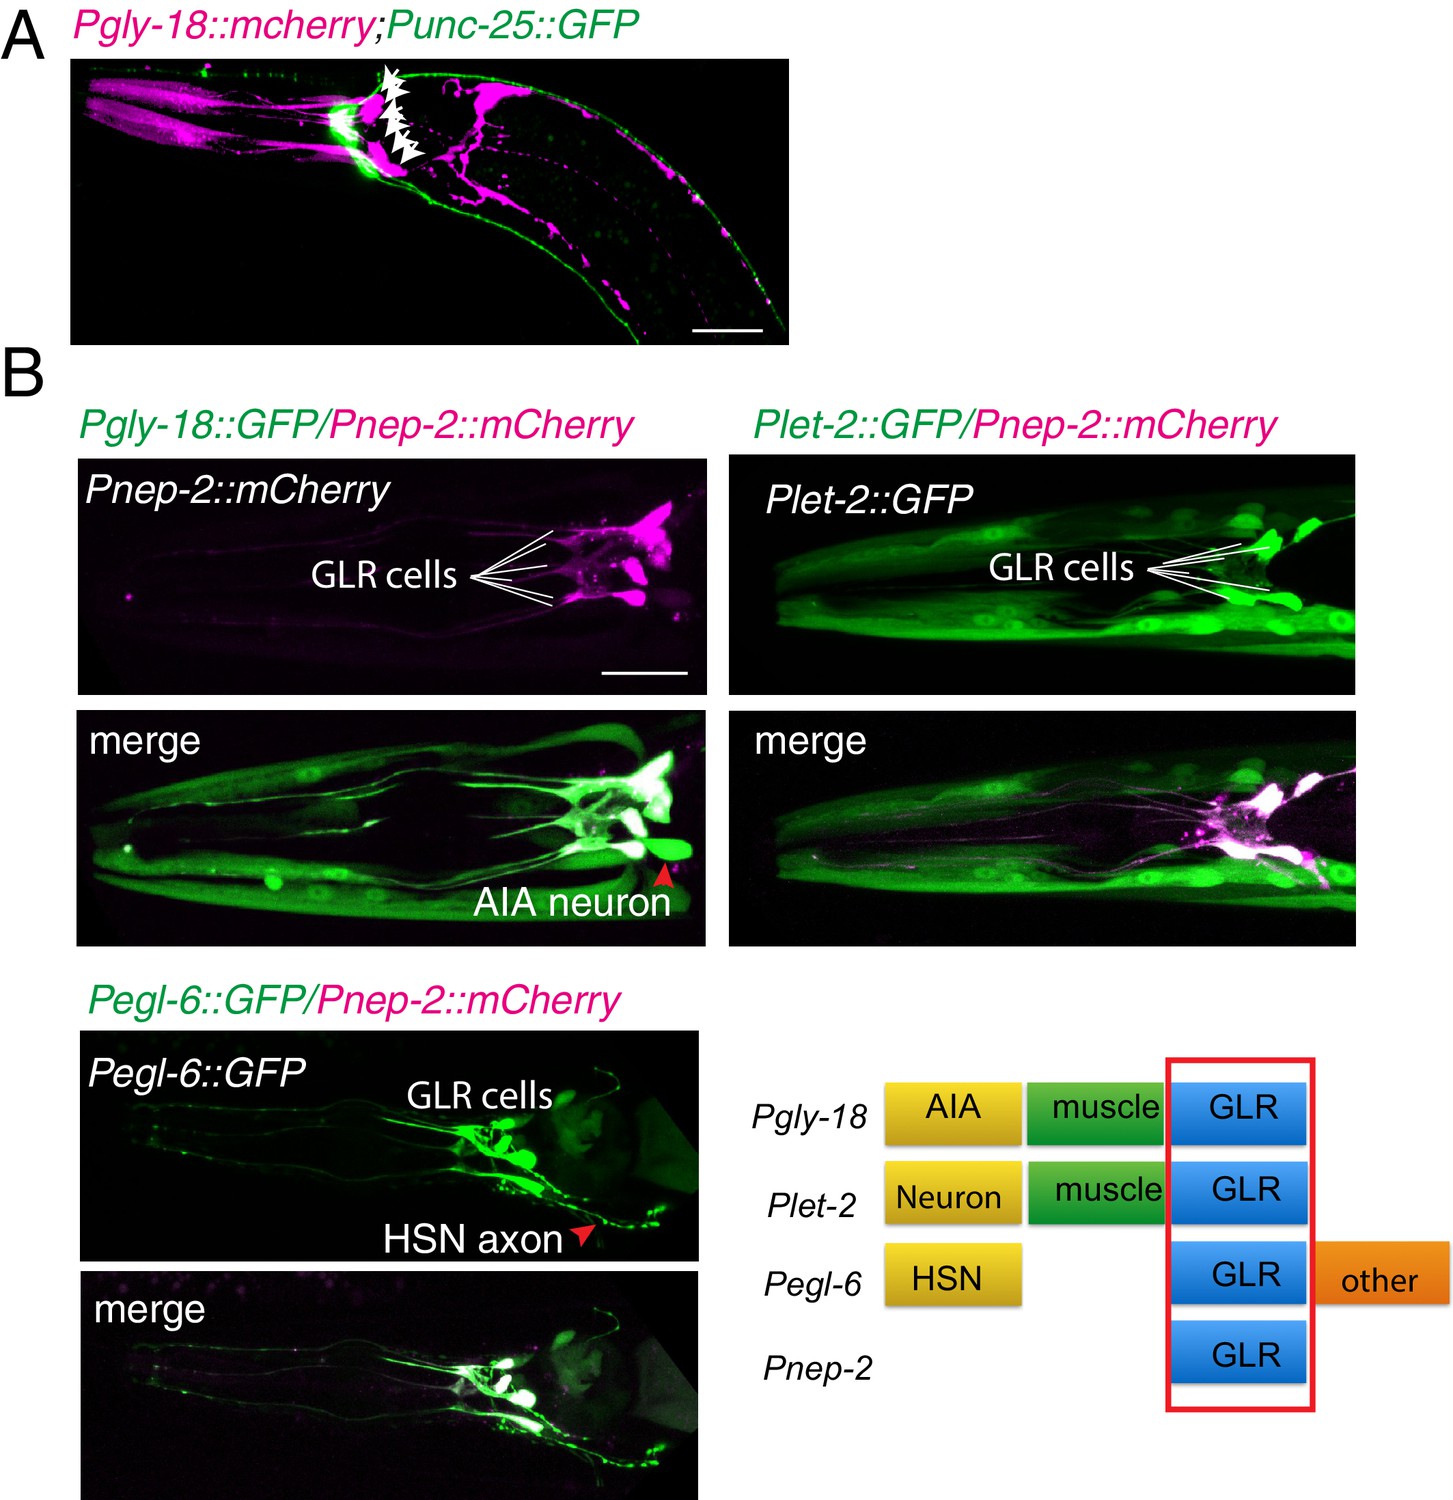
GLR cells and RME neurons
(A) A confocal image shows the relative positions of GLR cells (Pink) and RME neurons (Green). GLR cells were labeled by expression of Pgly-18::mCherry, and RME neurons were labeled by expression of Punc-25::GFP. White arrows highlight GLR cell bodies. (B) Four promoters, Pgly-18, Pnep-2, Plet-2, and Pegl-6, drive expression in GLR cells. Scale bar: 20 μm.
Figure 3 with 1 supplement
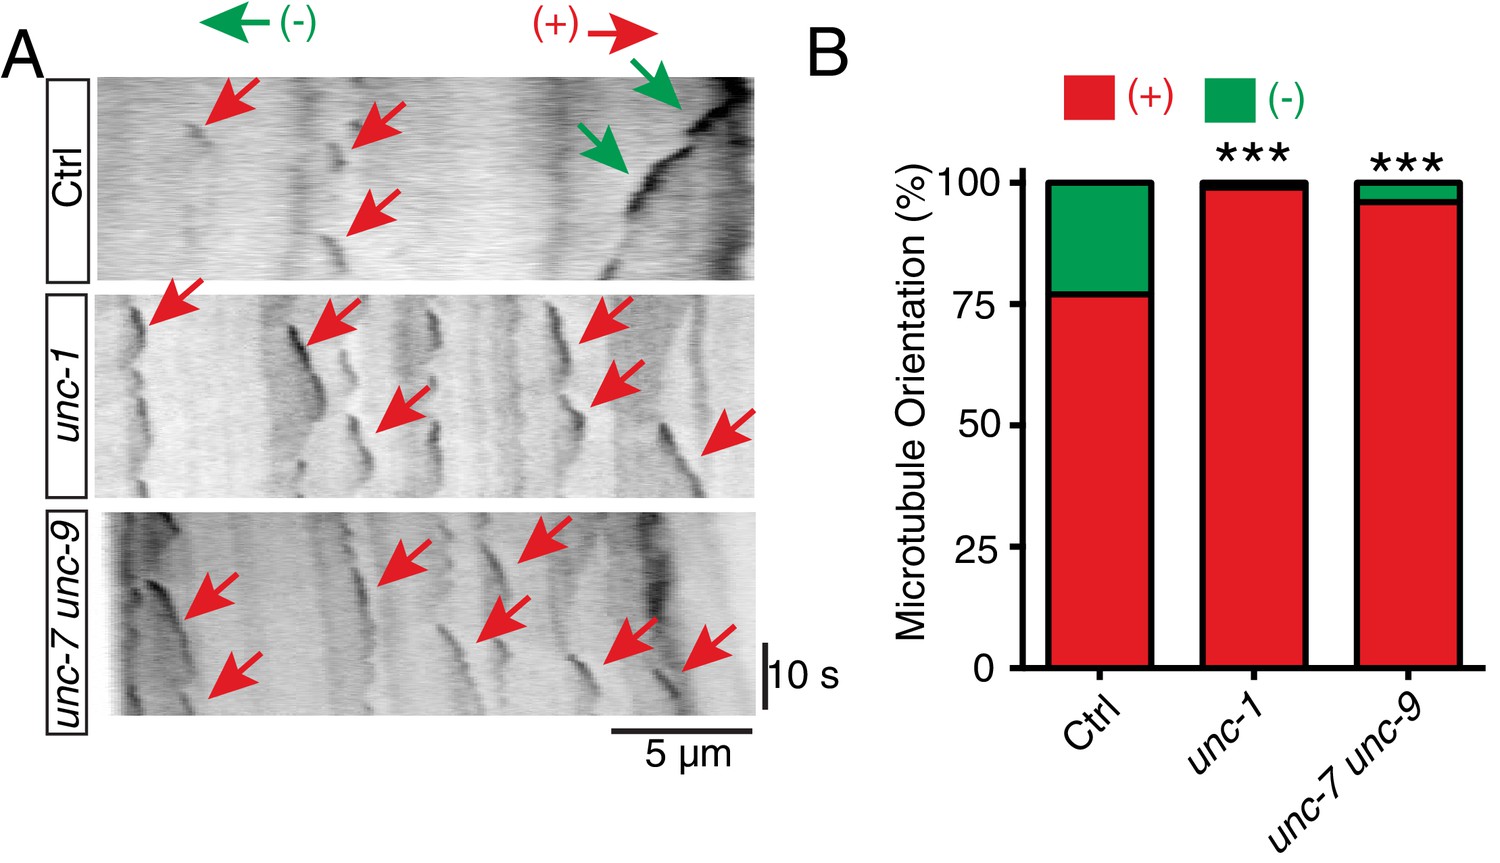
unc-1 regulates microtubule polarity in RME D/V dendrites.
(A) Time kymographs generated from a 40-s movie of EBP-2::GFP dynamics in control, unc-1(e580) and unc-7 unc-9 animals. (B) Quantification of percentage of orientation in RME D/V neurites in control (n = 123), unc-1(e580)(n = 115) and unc-7unc-9 animals (n = 110) based on the analysis of EBP-2::GFP movement. Values that differ significantly from wild type (Fisher’s exact test) are denoted on the graphs (*p<0.05).
Figure 3—figure supplement 1
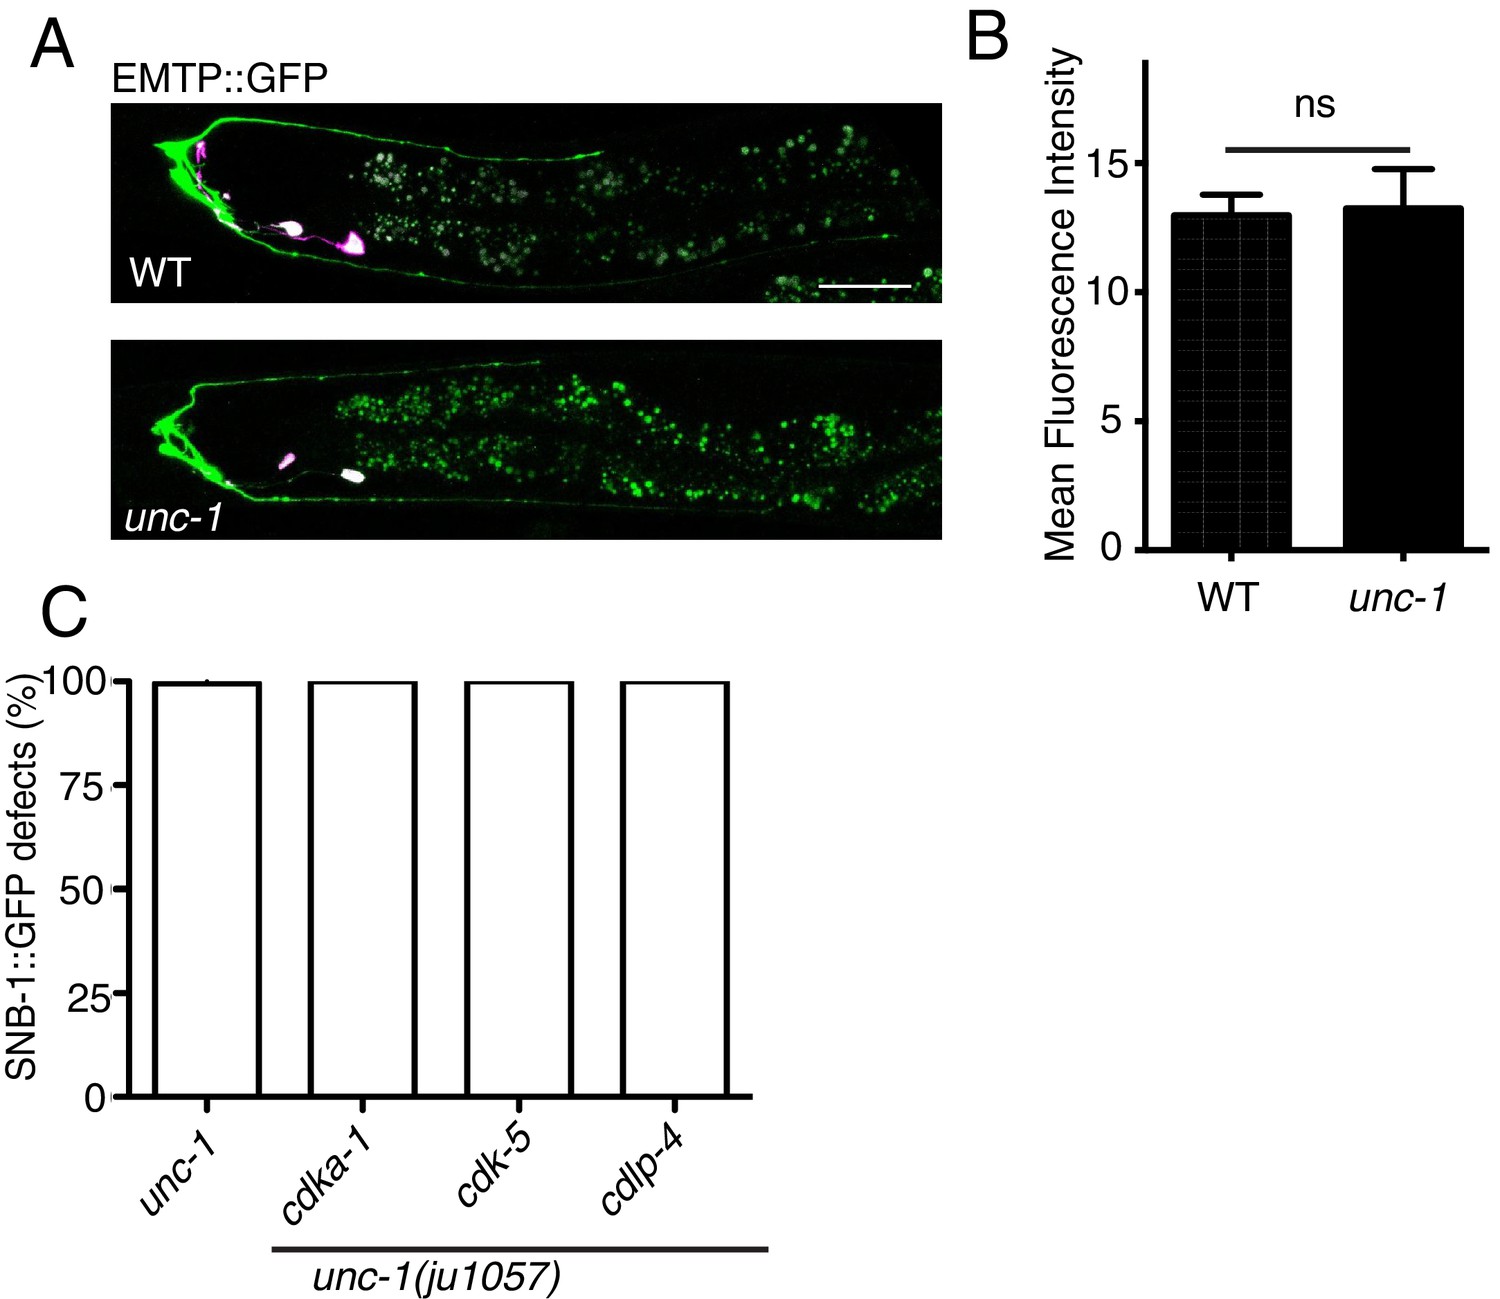
unc-1(lf) does not change the amount of polymerized microtubules in RME D/V dendrites.
Confocal images (A) and quantification (B) of EMTB::GFP signals in RME D/V neurites. n = 15. Data are shown as mean ± SD. Student test, NS: no significant difference. Pink-colored neurons are AIY neurons, which express the co-injection marker Pttx-3::rfp. Scale bar: 20 μm. (C) Quantification of percentage of animals with RME D/V defects. Each experiment was performed with N > 200 animals at least three times. No significant difference (p>0.05, t-test) was detected between unc-1(lf) and double mutants. Scale bar: 20 μm.
Figure 4
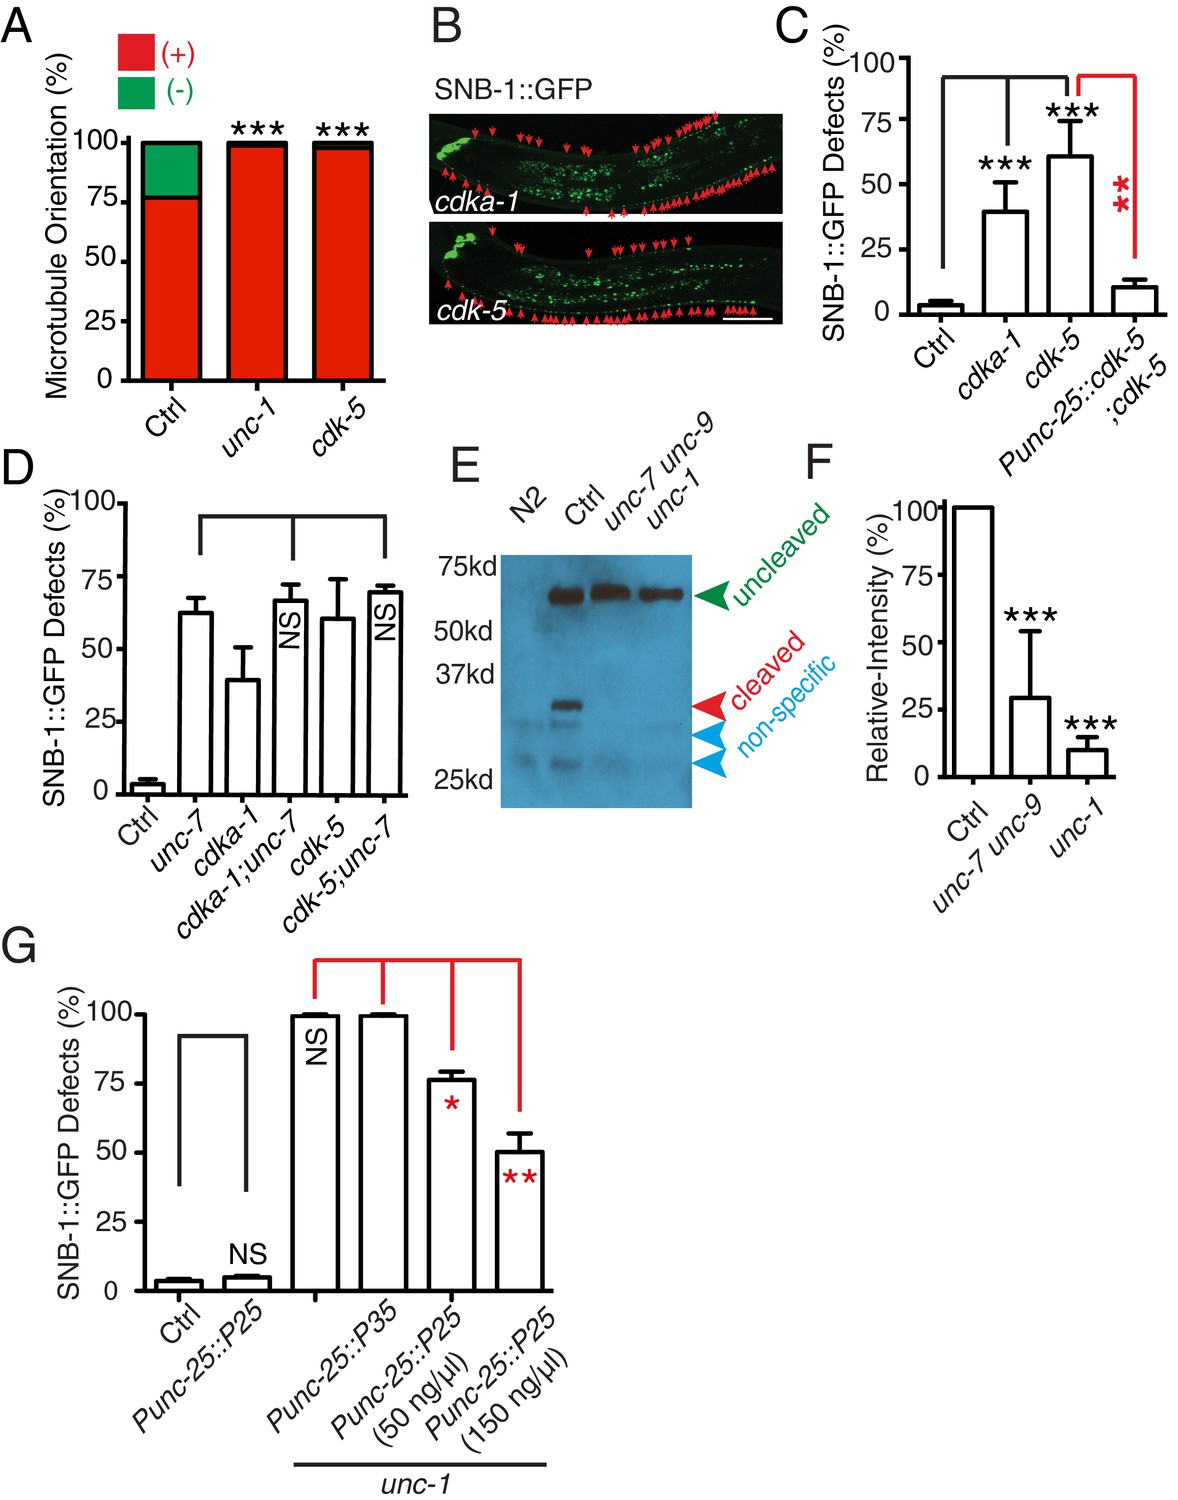
The CDK-5 pathway is regulated by GLR-RME gap junctions in RME axon specification
(A) Loss-of-function of cdk-5 induces microtubule polarity defects in RME D/V neurites to a similar degree as those in unc-1(lf) animals. cdk-5: n = 81. Values that differ significantly from wild type (Fisher’s exact test) are denoted on the graphs (*p<0.05). (B) Representative images and (C) quantification of SNB-1::GFP distribution defects in cdka-1(lf), cdk-5(lf), and cdk-5(lf) transgenic rescued strains. (D) Quantification of SNB-1::GFP distribution defects in unc-7;cdka-1 and unc-7;cdk-5 double mutants. (E) Western blot results of FLAG::CDKA-1 (yadIs13: Punc-25::FLAG::cdka-1(cDNA)) expression in non-transgene N2, transgene control, unc-7 unc-9 and unc-1(e580) animals. Red arrowhead points to the cleaved band. Green arrowhead marks to the uncleaved band. Blue arrowheads highlight nonspecific bands recognized by the anti-FLAG antibody. (F) Quantification of effect of unc-7unc-9 and unc-1(e580) on CDKA-1 cleavage. Three independent experiments were performed. Band intensity was measured using imageJ, and the relative intensity was calculated by (Icleaved /Iuncleaved)mutant /(Icleaved /Iuncleaved)controlX100%. Icleaved or Iuncleaved = intensity of cleaved CDKA-1/ intensity of un-cleaved CDKA-1 in mutant or control animals. (G) Quantification of SNB-1::GFP distribution defects in transgenes expressing p25 or p35 in unc-1(ju1057) background. In C, D and G, experiments were performed with N > 200 animals at least three times. For transgenic animals, the results shown here are generated from at least three independent lines. Data are shown as mean ± SD. Student t-test, *p<0.05, **p<0.01, ***p<0.001. Scale bar: 20 μm.
Figure 5

GLR-RME gap junctions regulate the CDK-5 pathway through calcium and calpain.
(A) Gel images and (B) quantification results show that calcium antagonist BAPTA-AM and Calpain inhibitor PD150606 suppress the cleavage of CDKA-1/p35. Three independent experiments were performed, and the relative intensity was calculated as described in Figure 4 (C) Quantification of SNB-1::GFP distribution defects in BAPTA-AM and Calpain inhibitor PD150606-treated animals. (D) Quantification of SNB-1::GFP distribution defects in animals expressing calbindin D28K (CALB) in RME neurons (Punc-25), GLR cells (Pgly-18 and Pegl-6), and muscle (Pmyo-3). For this experiment and all other experiments using calbindin D28K transgenes, only animals with normal GLR cell and RME neuron morphology were chosen for quantification. (E) Expression of calbindin D28K (CALB) in GLR cells (Pgly-18) induces microtubule polarity defects in RME D/V neurites. n = 100. Values that differ significantly from wild type (Fisher’s exact test) are denoted on the graphs ***p<0.001. (F) Quantification of SNB-1::GFP distribution defects in animals expressing calbindin D28K (CALB) in GLR cells (Pgly-18) in wild-type background, in cdk-5(lf) background, or in a transgene backgound overexpressing p25 in RME neurons (Punc-25). (G) Quantification of SNB-1::GFP distribution defects in clp-4 mutants and rescue transgenes . (H) Quantification of SNB-1::GFP distribution defects in clp-4, unc-7, and clp-4;unc-7 double mutants. In C, D, and E, data are shown as mean ± SD. Student test, *p<0.05, **p<0.01, ***p<0.001. NS: no significant difference.
Figure 6
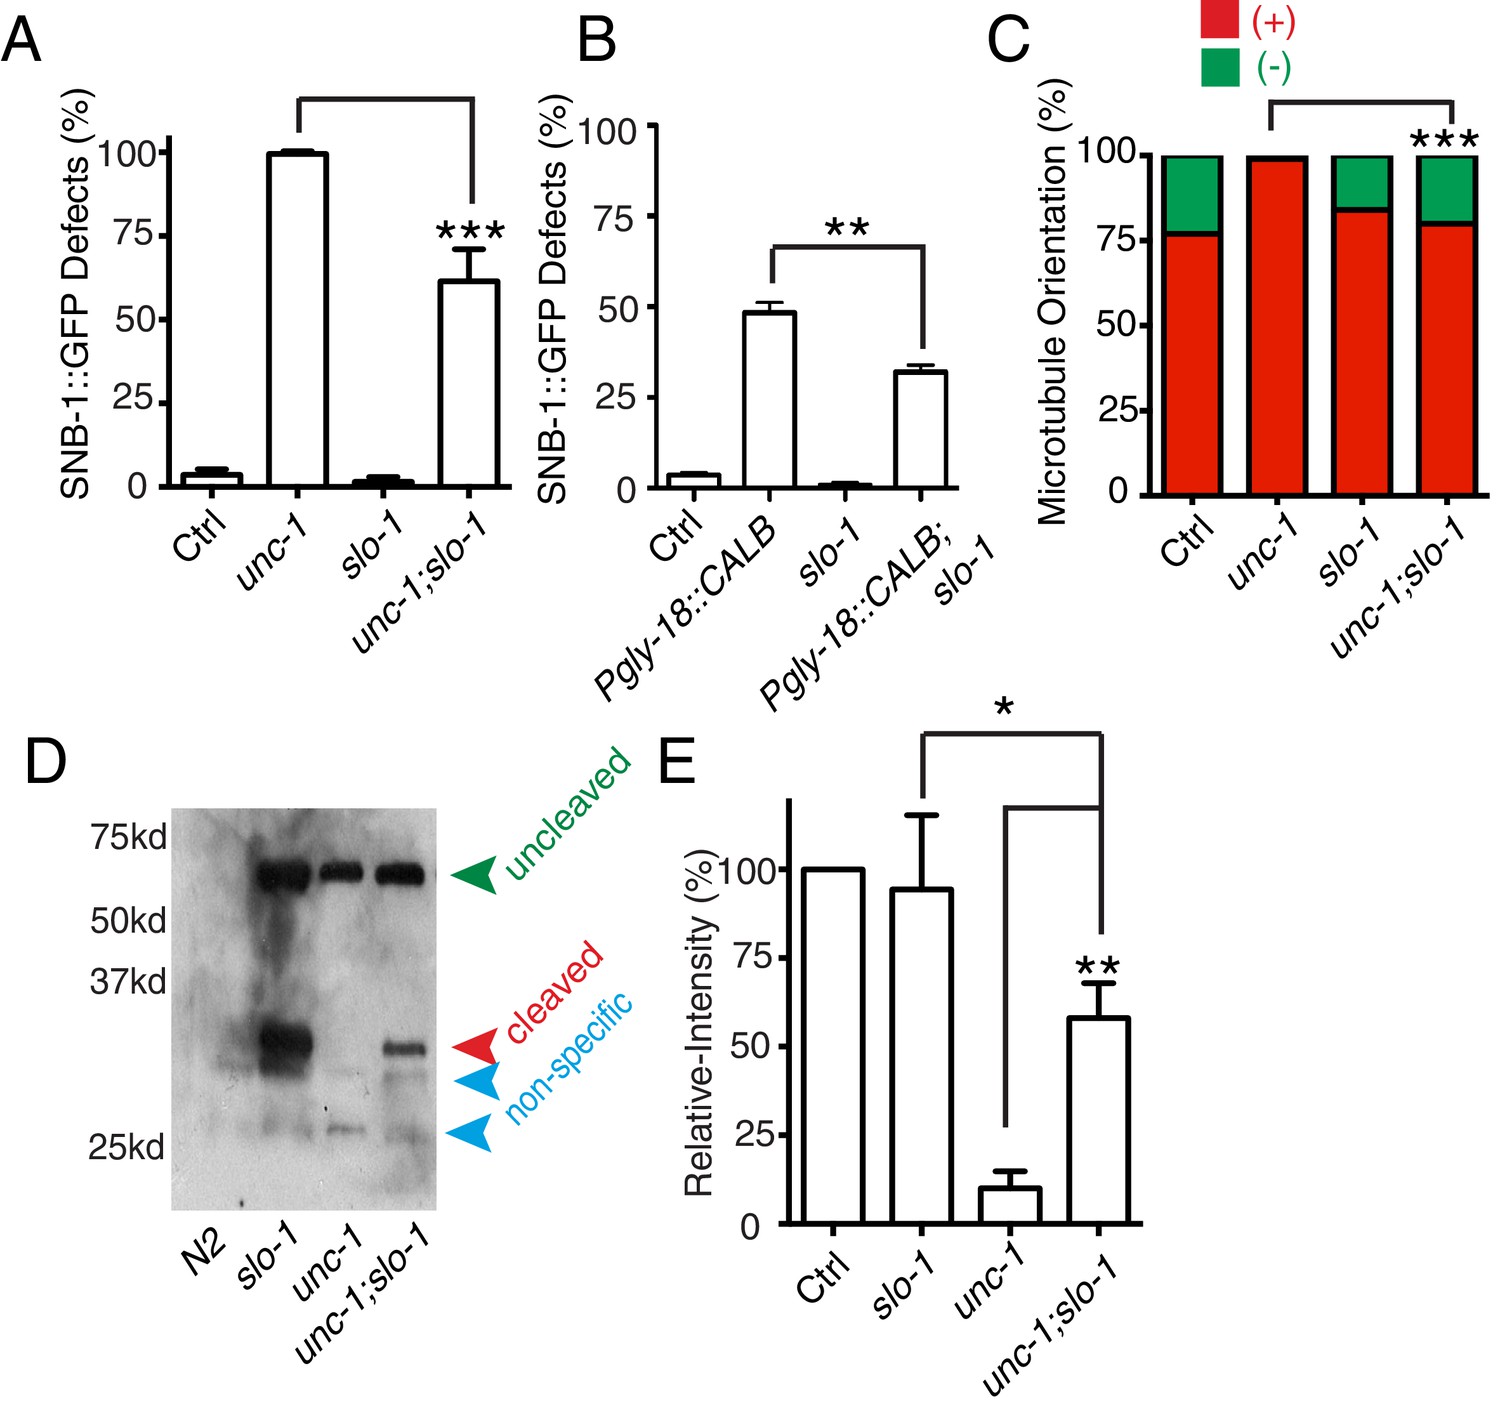
slo-1(lf) suppresses unc-1(lf) phenotypes through the CDK-5 pathway.
(A) Quantification of SNB-1::GFP distribution defects in unc-1(ju1057), slo-1 and unc-1(ju1057);slo-1. (B) Quantification of SNB-1::GFP distribution defects in animals expressing calbindin D28K (CALB) in GLR cells (Pgly-18) in a control or slo-1(lf) background. (C) Quantification of EBP-2 dynamics show that loss-of-function of slo-1 suppresses microtubule polarity defects in RME D/V neurites in unc-1(e580) animals. Values that differ significantly from wild type (Fisher’s exact test) are denoted on the graphs (*p<0.05). (D) Western blot results of FLAG::CDKA-1 (yadIs13) expression in non-transgene N2, slo-1, unc-1, and unc-1;slo-1 animals. Red arrowhead points to the cleaved band. Green arrowhead marks the uncleaved band. Blue arrowheads highlight nonspecific bands recognized by the anti-FLAG antibody. (E) Quantification of western results shows that loss-of-function of slo-1 suppresses the unc-1 effects on CDKA-1 cleavage. Three independent experiments were performed, and quantification uses the same method as in Figure 4 In A and B, experiments were performed with N > 200 animals at least three times. For transgenic animals, the results shown here are generated from at least three independent lines. Data are shown as mean ± SD. Student t-test, *p<0.05, **p<0.01, ***p<0.001.
Figure 7
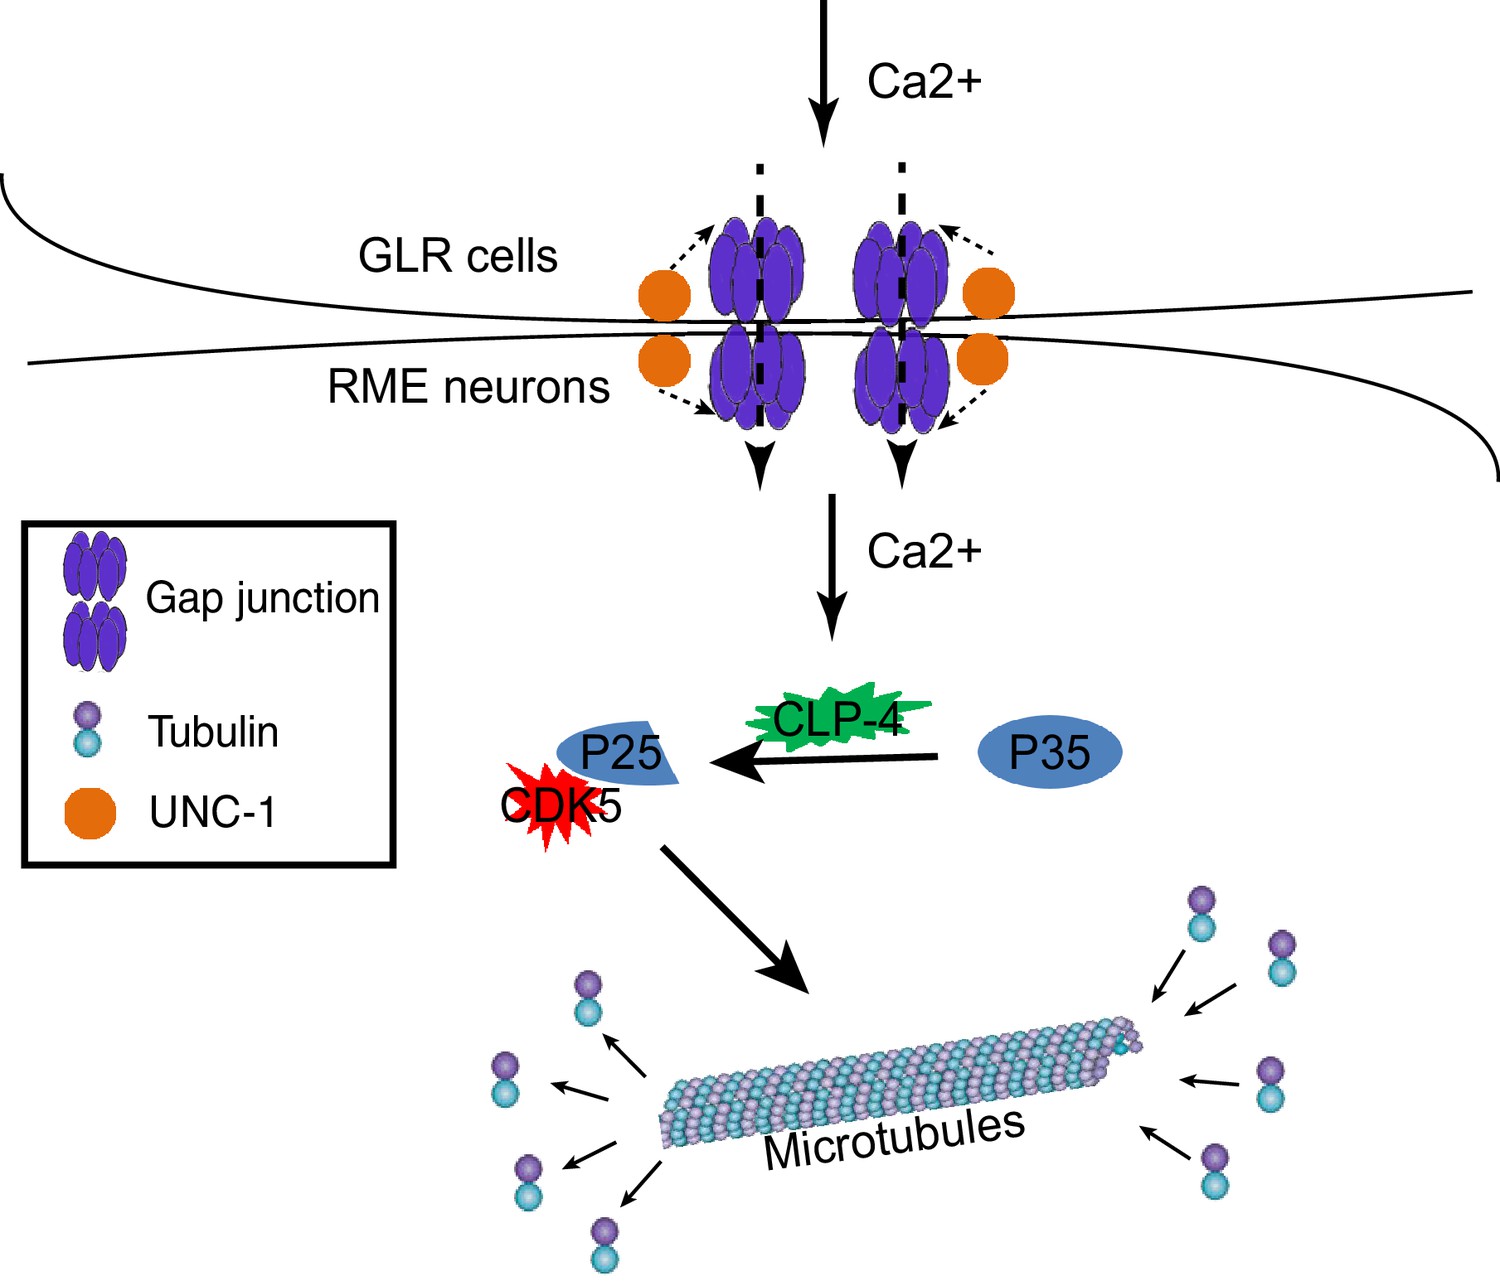
A model for GLR-RME gap junction regulated RME axon specification.
At the early developmental stage, calcium influxes from GLR cells to RME neurons through gap junctions to induce activation of the CDK-5 pathway, which guides microtubule assembly and axon specification.
Additional files
-
Supplementay file 1
Supplemental Table 1, Strain list.
- https://doi.org/10.7554/eLife.19510.013
-
Supplementay file 2
Supplemental Table 2, Plasmid list.
- https://doi.org/10.7554/eLife.19510.014
Download links
A two-part list of links to download the article, or parts of the article, in various formats.
Downloads (link to download the article as PDF)
Open citations (links to open the citations from this article in various online reference manager services)
Cite this article (links to download the citations from this article in formats compatible with various reference manager tools)
Regulation of neuronal axon specification by glia-neuron gap junctions in C. elegans
eLife 5:e19510.
https://doi.org/10.7554/eLife.19510


