New footprints from Laetoli (Tanzania) provide evidence for marked body size variation in early hominins
- University of Dar es Salaam, Tanzania
- Università di Perugia, Italy
- Sapienza Università di Roma, Italy
- Università di Pisa, Italy
- Studio Associato Grassi, Italy
- Università di Firenze, Italy
Figures
Figure 1
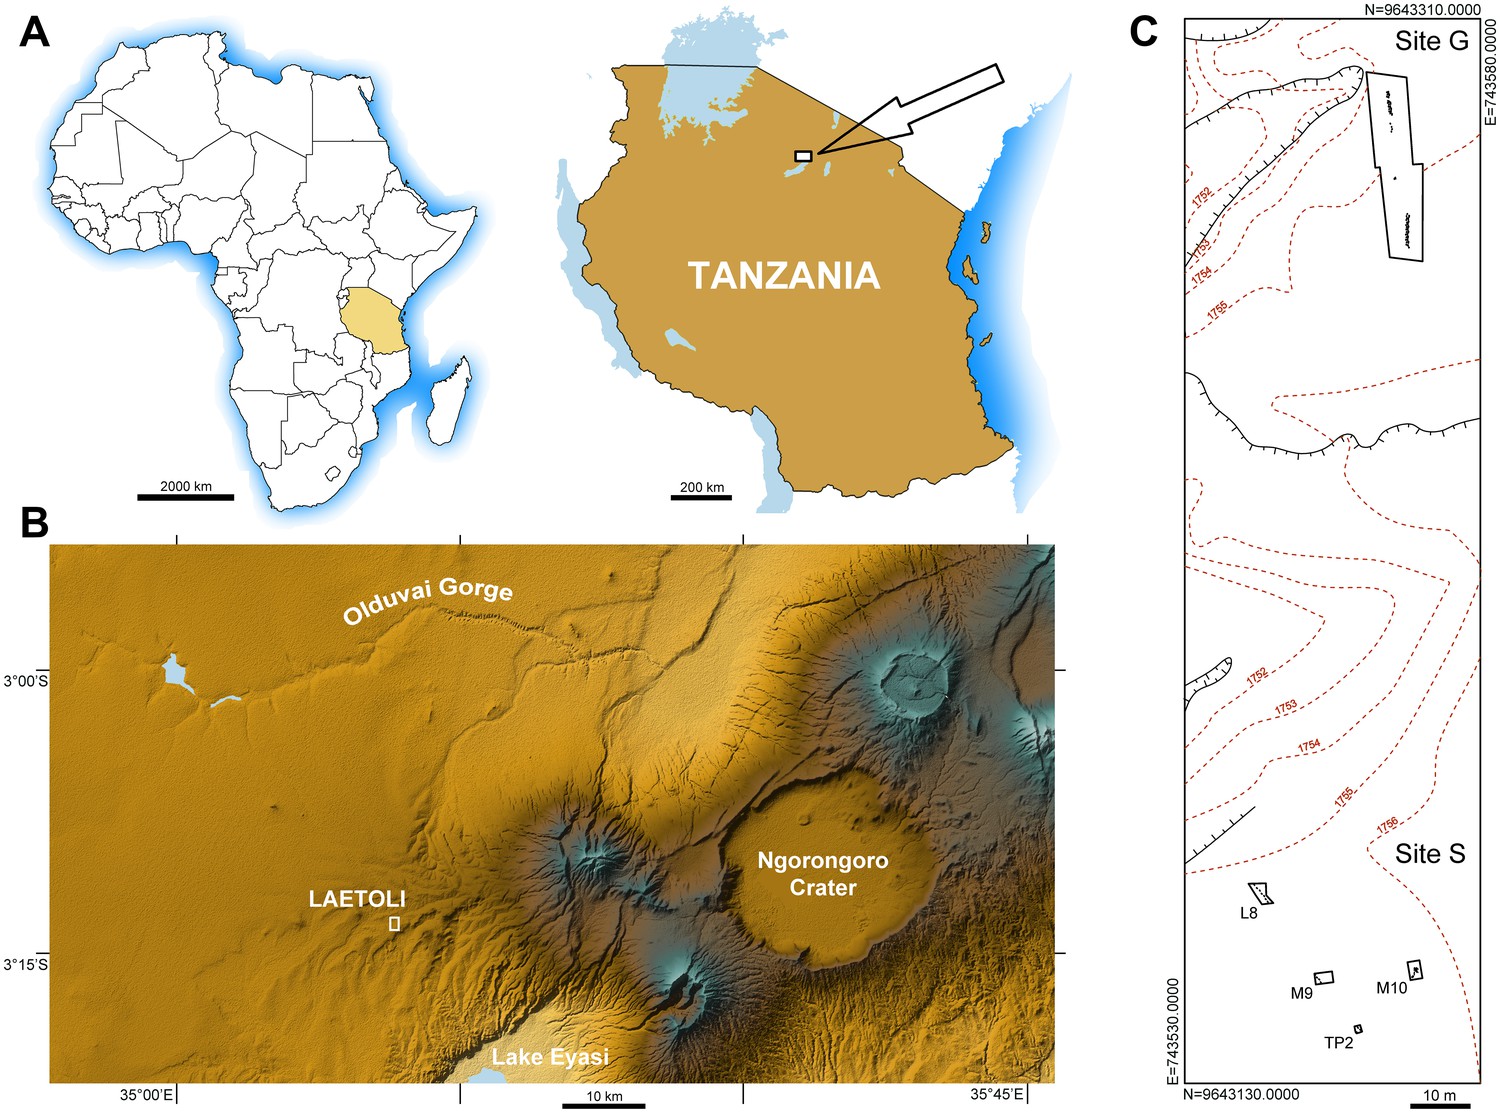
Geographical location and site map.
(A) Location of the study area in northern Tanzania. (B) Location of Laetoli within the Ngorongoro Conservation Area, about 50 km south of Olduvai Gorge. (C) Plan view of the area of Laetoli Locality 8 (Sites G and S).
Figure 2 with 3 supplements
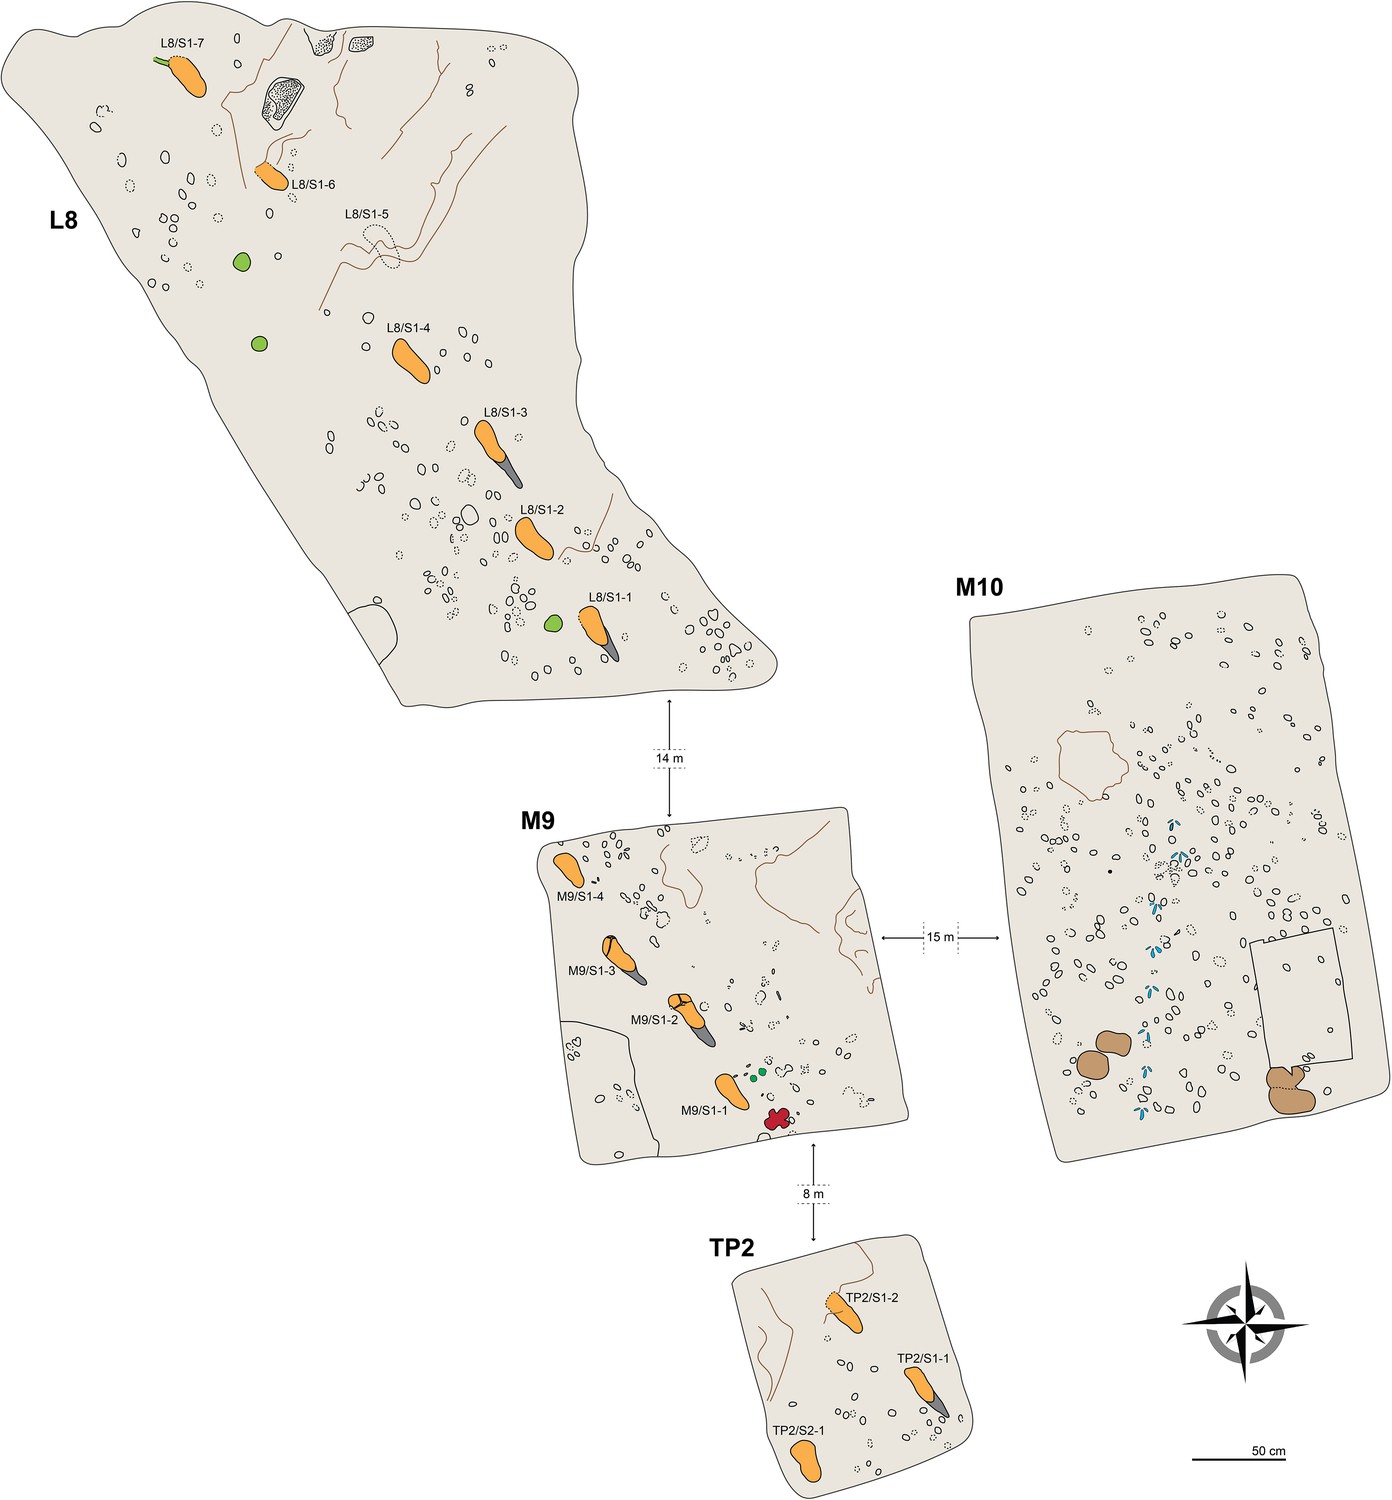
Plan view of the four test-pits excavated at Laetoli Site S.
Dashed lines indicate uncertain contours. Some of the most interesting tracks are coloured: hominins in orange (heel drags in dark grey), equid in dark green (M9), rhinoceros in red (M9), giraffe in light brown (M10), and guineafowl in blue (M10). Large roots and the bases of trees are in light green (L8). The main faults/fractures are indicated by brown lines. Raindrop impressions occur in the northern part of L8 (dotted areas).
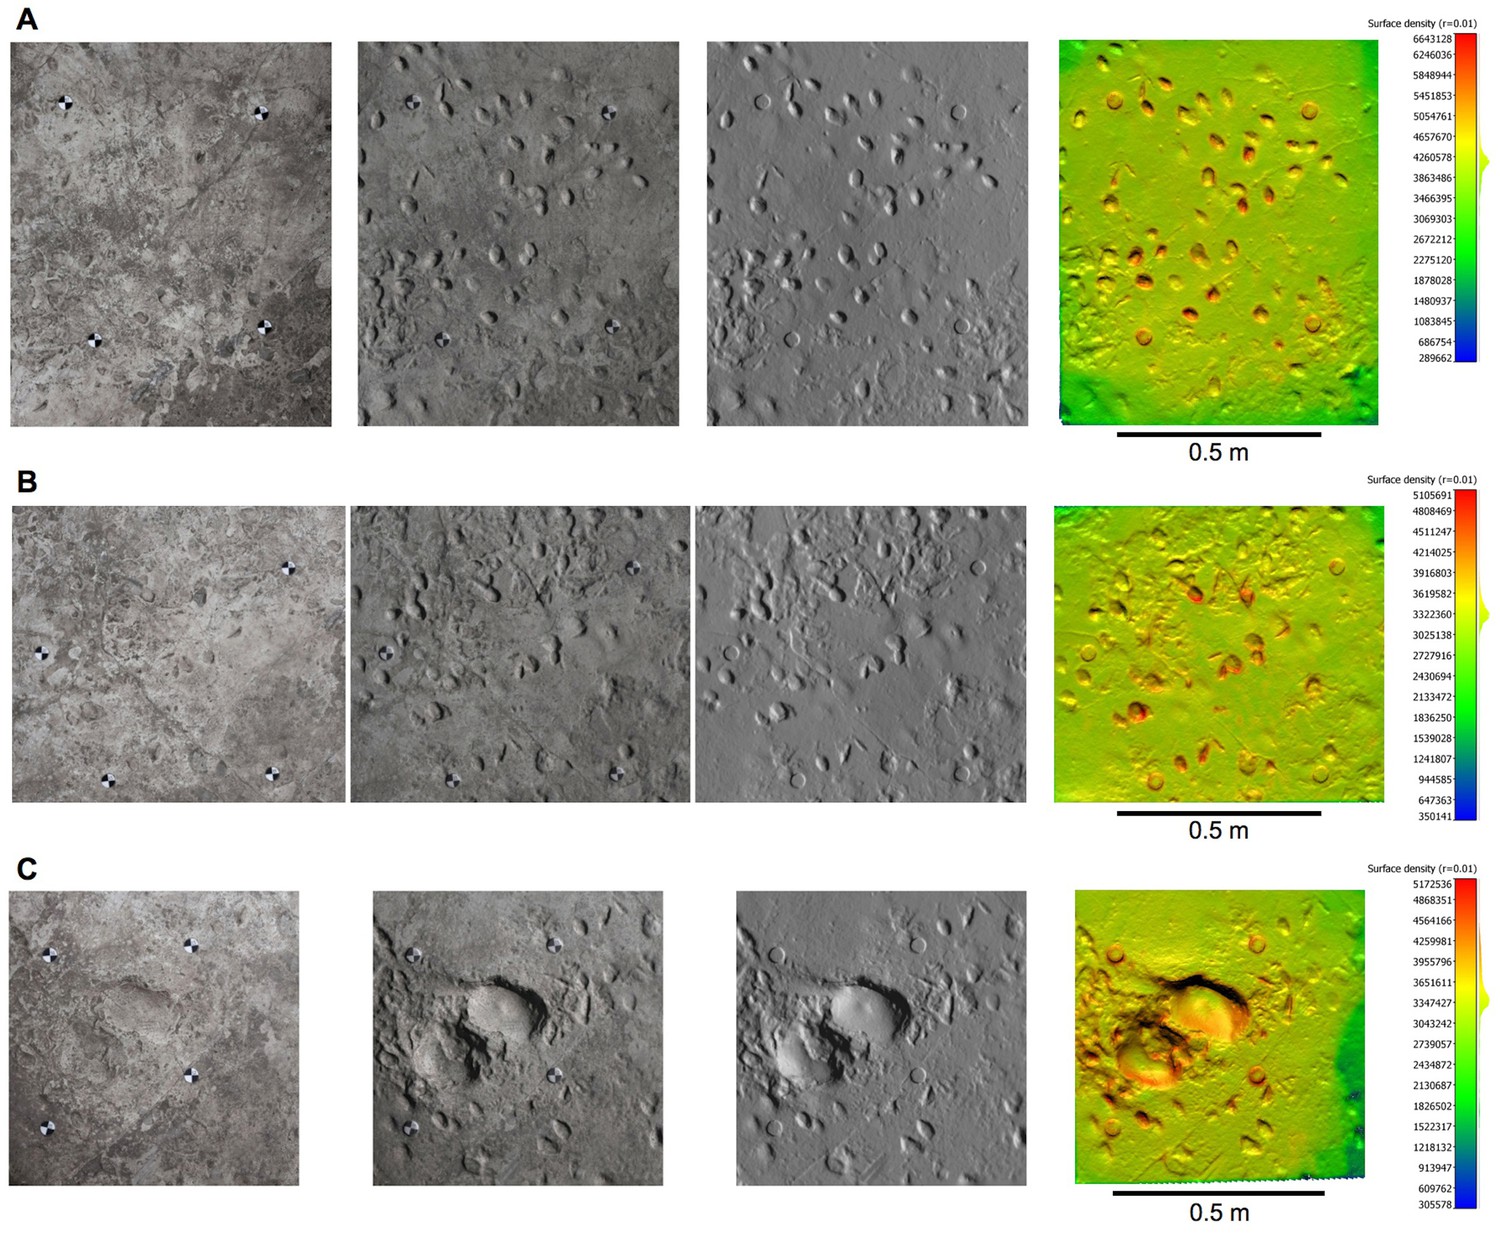
Figure 2—figure supplement 1
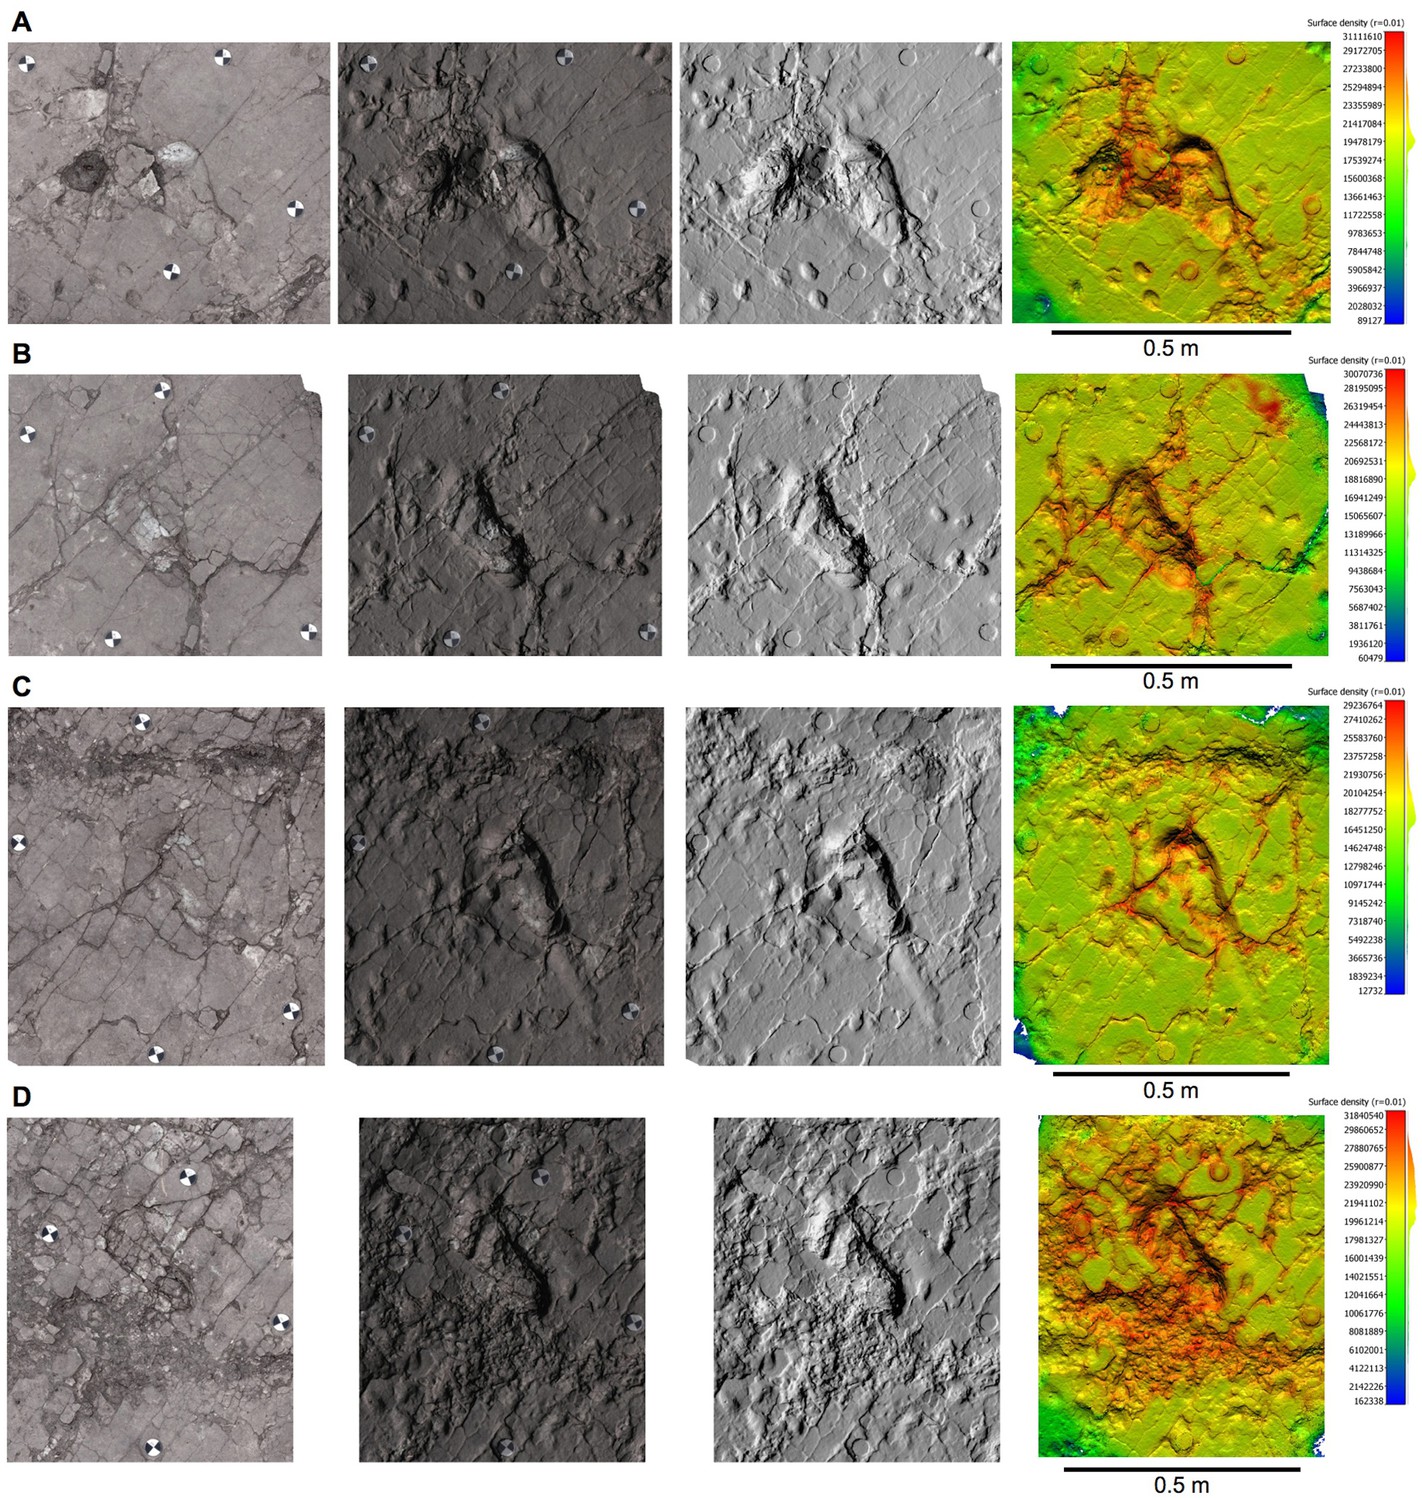
Orthophotos of selected hominin tracks from test-pit L8 at Site S.
(A) L8/S1-1. (B) L8/S1-2. (C) L8/S1-3. (D) L8/S1-4. From left to right: textured models, textured and shaded models, shaded models, and shaded coloured models. Colours represent the density of the point clouds obtained by determining the distance to the nearest neighbour. The surface density is the number of neighbours divided by the neighbourhood surface = N/(πR2).
Figure 2—figure supplement 2
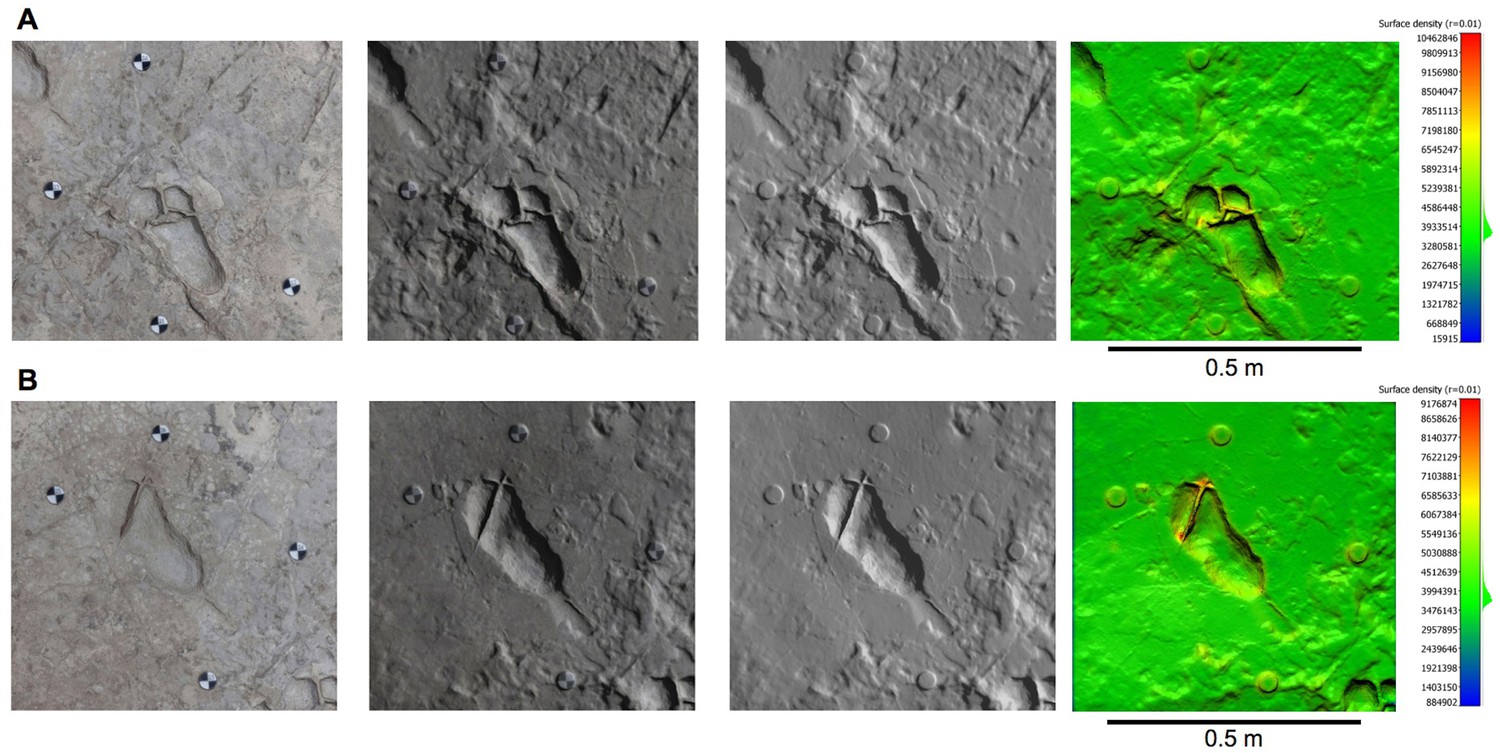
Orthophotos of selected hominin tracks from test-pit M9 at Site S.
(A) M9/S1-2. (B) M9/S1-3. Details as in Figure 2—figure supplement 1.
Figure 2—figure supplement 3
Orthophotos of selected tracks from test-pit M10 at Site S.
(A,B) Small bovid (?Madoqua) and bird (?Numida) tracks. (C) Two giraffe tracks surrounded by small bovid and bird tracks. Details as in Figure 2—figure supplement 1.
Figure 3

Shaded 3D photogrammetric elevation model of the L8 trackway.
Colour renders heights as in the colour bar. The empty circles indicate the position of the targets of the 3D-imaging control point system (see Materials and methods for details).
Figure 4

Shaded 3D photogrammetric elevation model of test-pit L8 and close-up of the best-preserved tracks with contour lines.
Colour renders heights as in the colour bar; distance between elevation contour lines is 2 mm. The empty circles indicate the position of the targets.
Figure 5
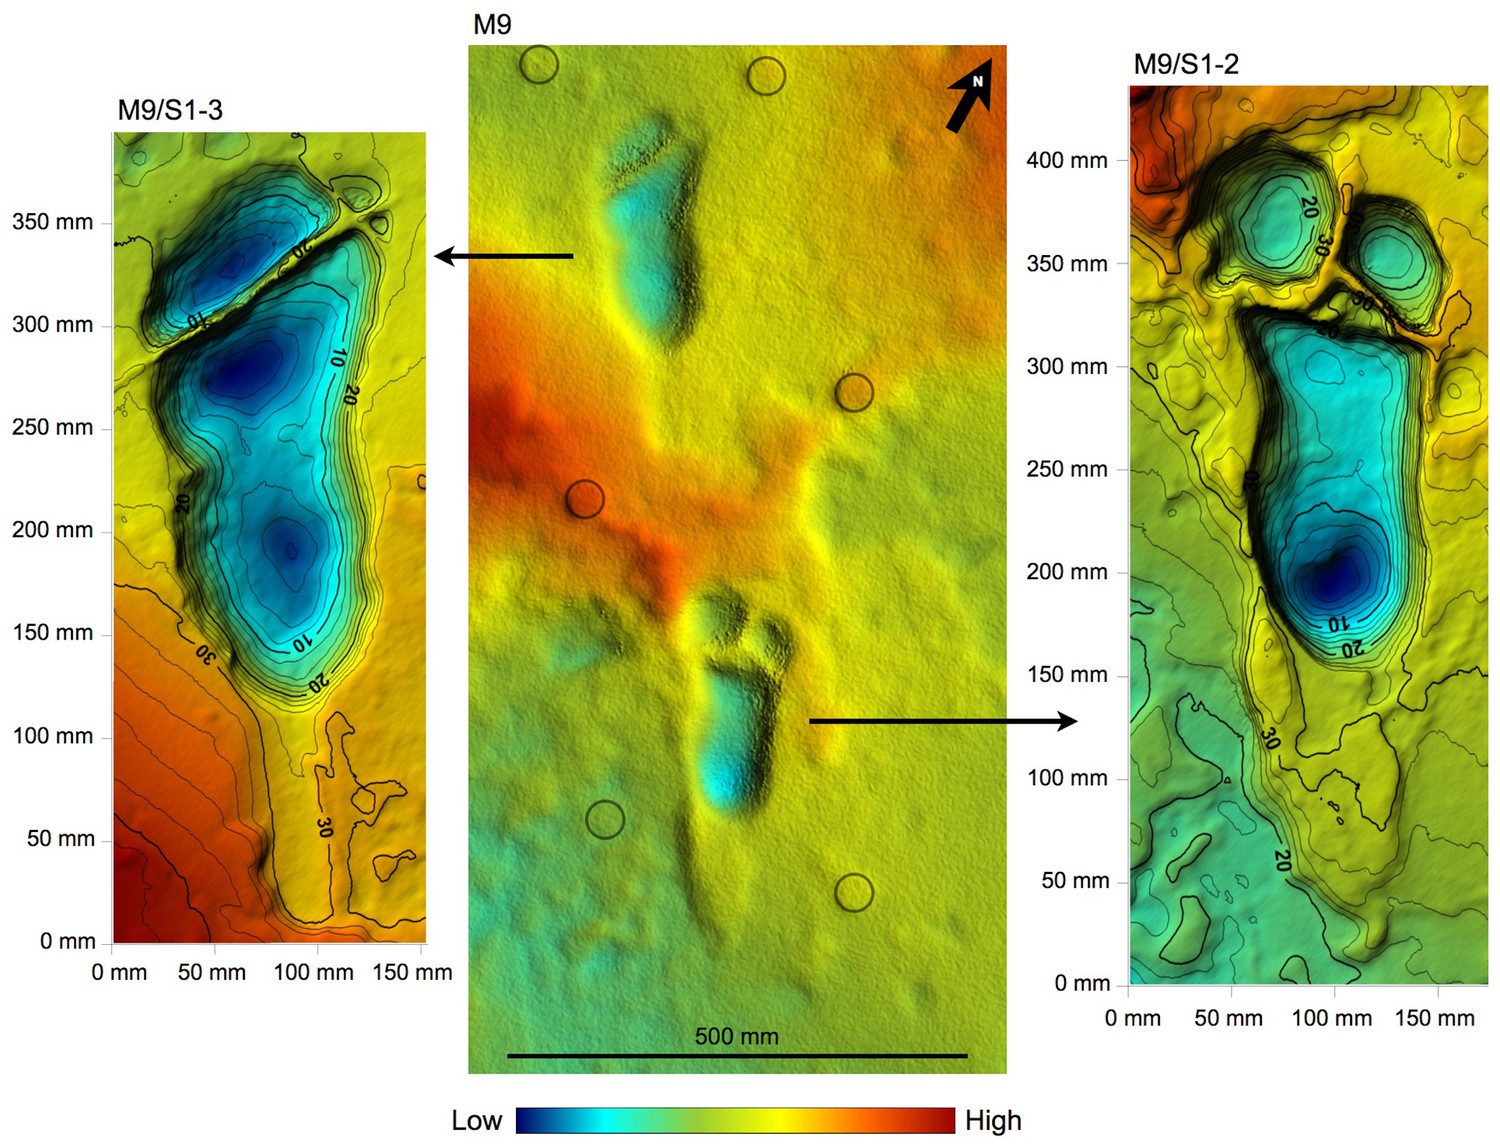
Shaded 3D photogrammetric elevation model of the central portion of test-pit M9 and close-up of the best-preserved tracks with contour lines.
Colour renders heights as in the colour bar; distance between elevation contour lines is 2 mm. The empty circles indicate the position of the targets
Figure 6
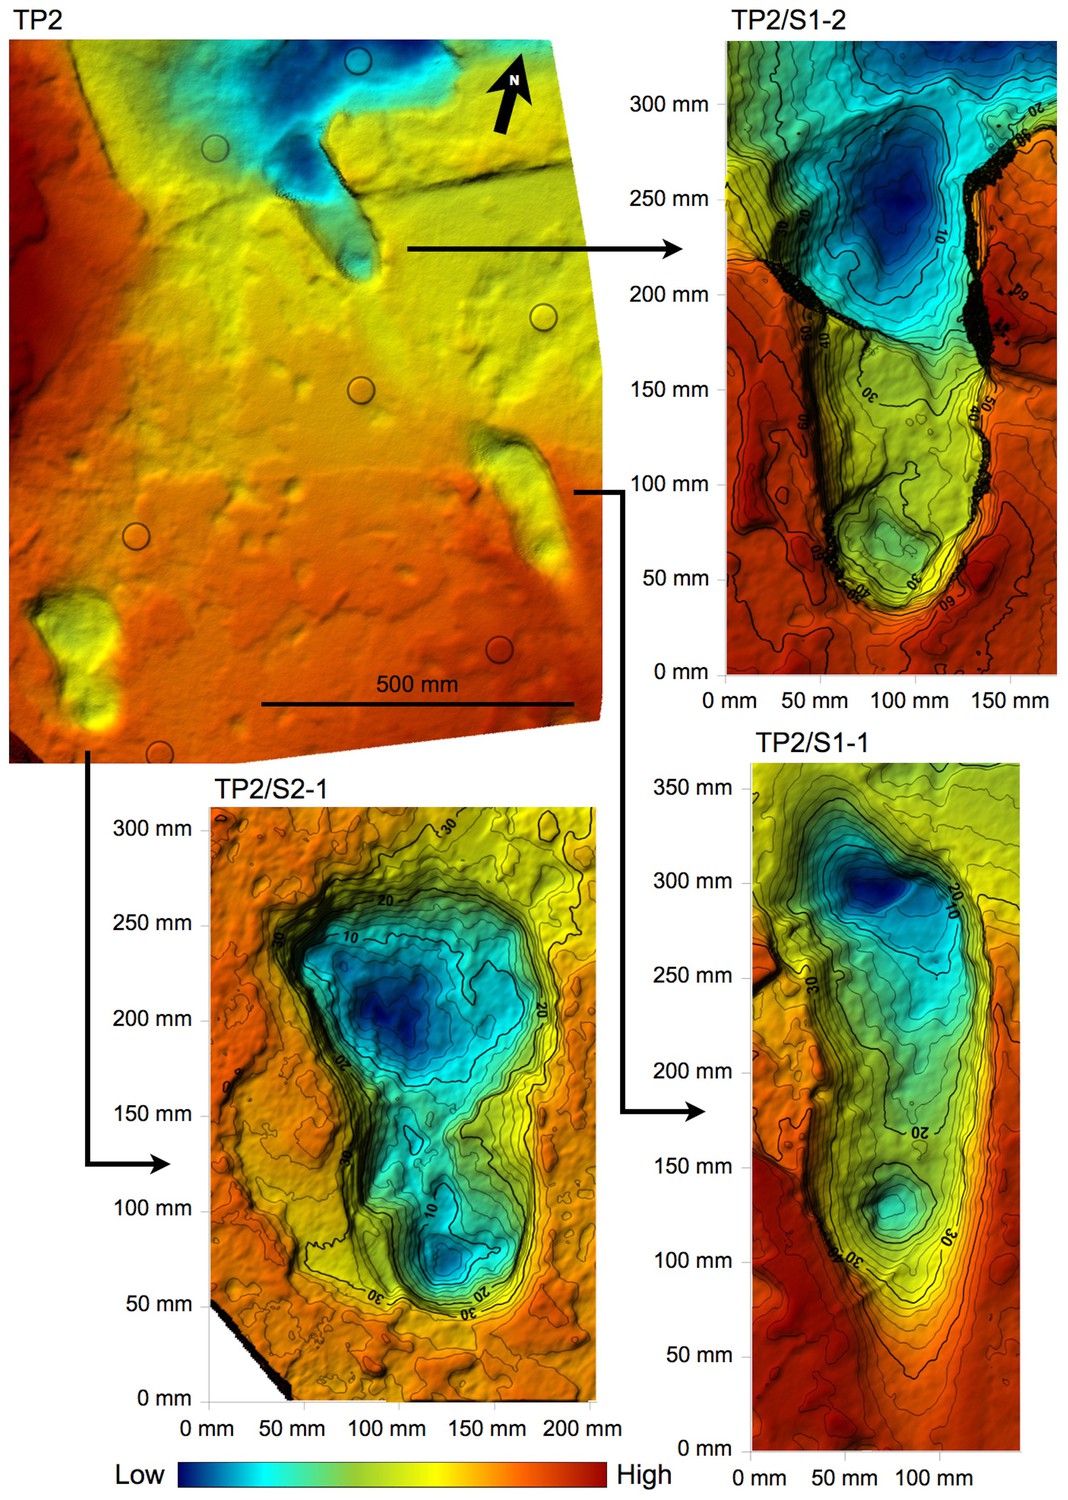
Shaded 3D photogrammetric elevation model of test-pit TP2 and close-up of the three hominin tracks with contour lines.
Colour renders heights as in the colour bar; distance between elevation contour lines is 2 mm. The empty circles indicate the position of the targets.
Figure 7
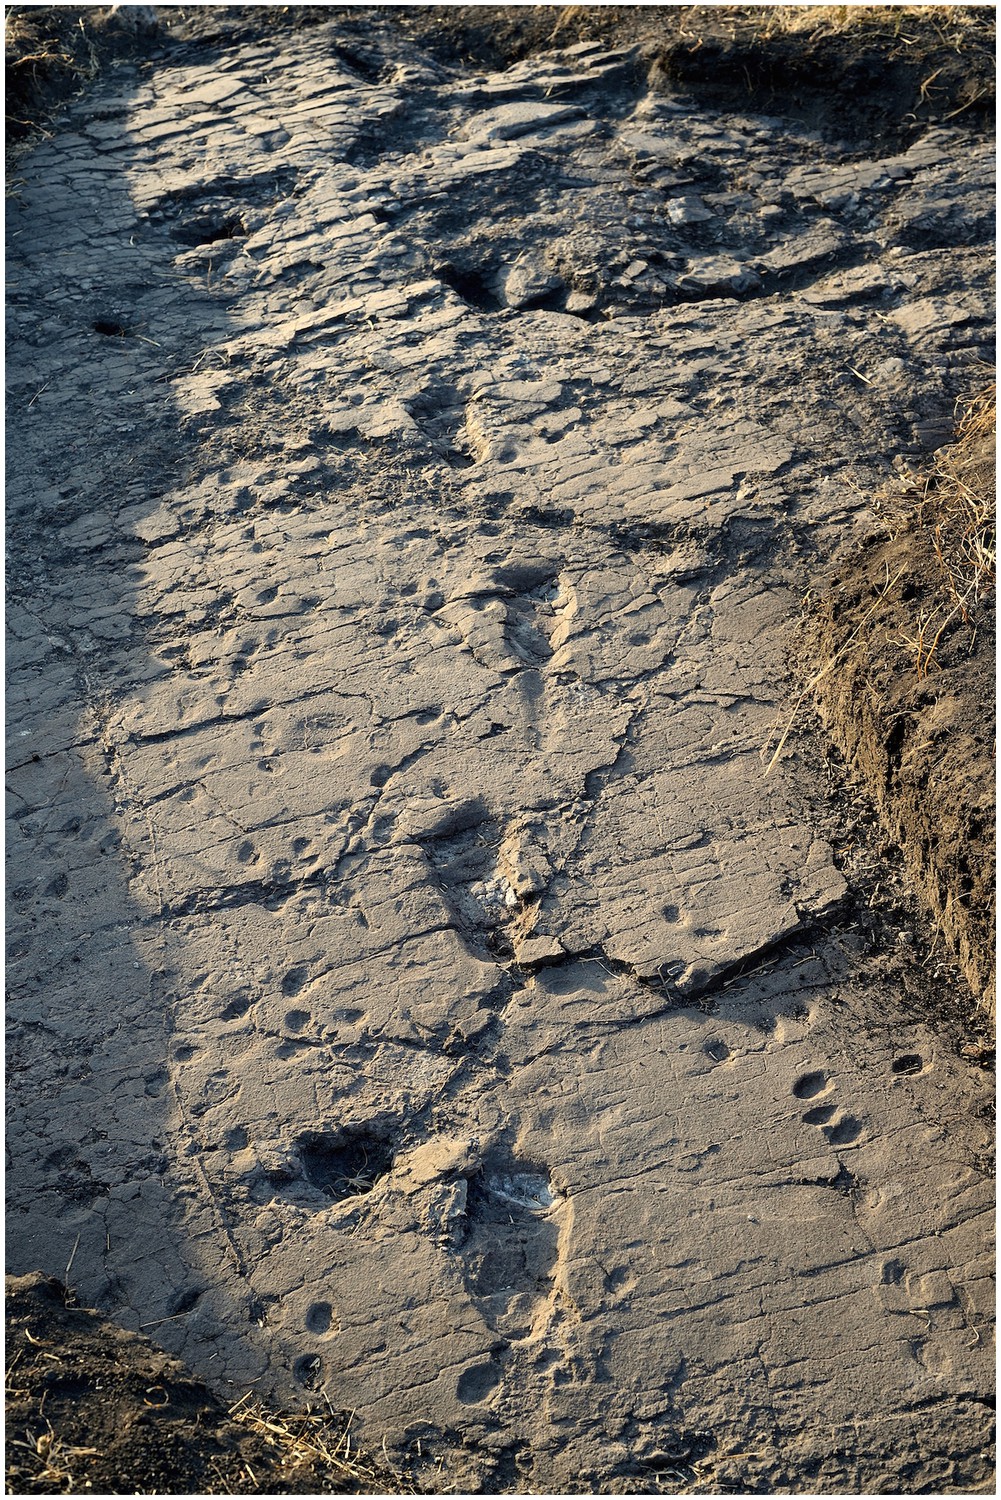
Southern part of the hominin trackway in test-pit L8.
Footprints L8/S1-1, L8/S1-2, L8/S1-3 and L8/S1-4 are visible from left to right. The heel drag mark is well visible posteriorly to L8/S1-3.
Figure 8
Test-pit L8 at Laetoli Site S.
In the northern part of the test-pit (at the top), the Footprint Tuff is particularly altered, damaged by plant roots and dislodged along natural fractures.
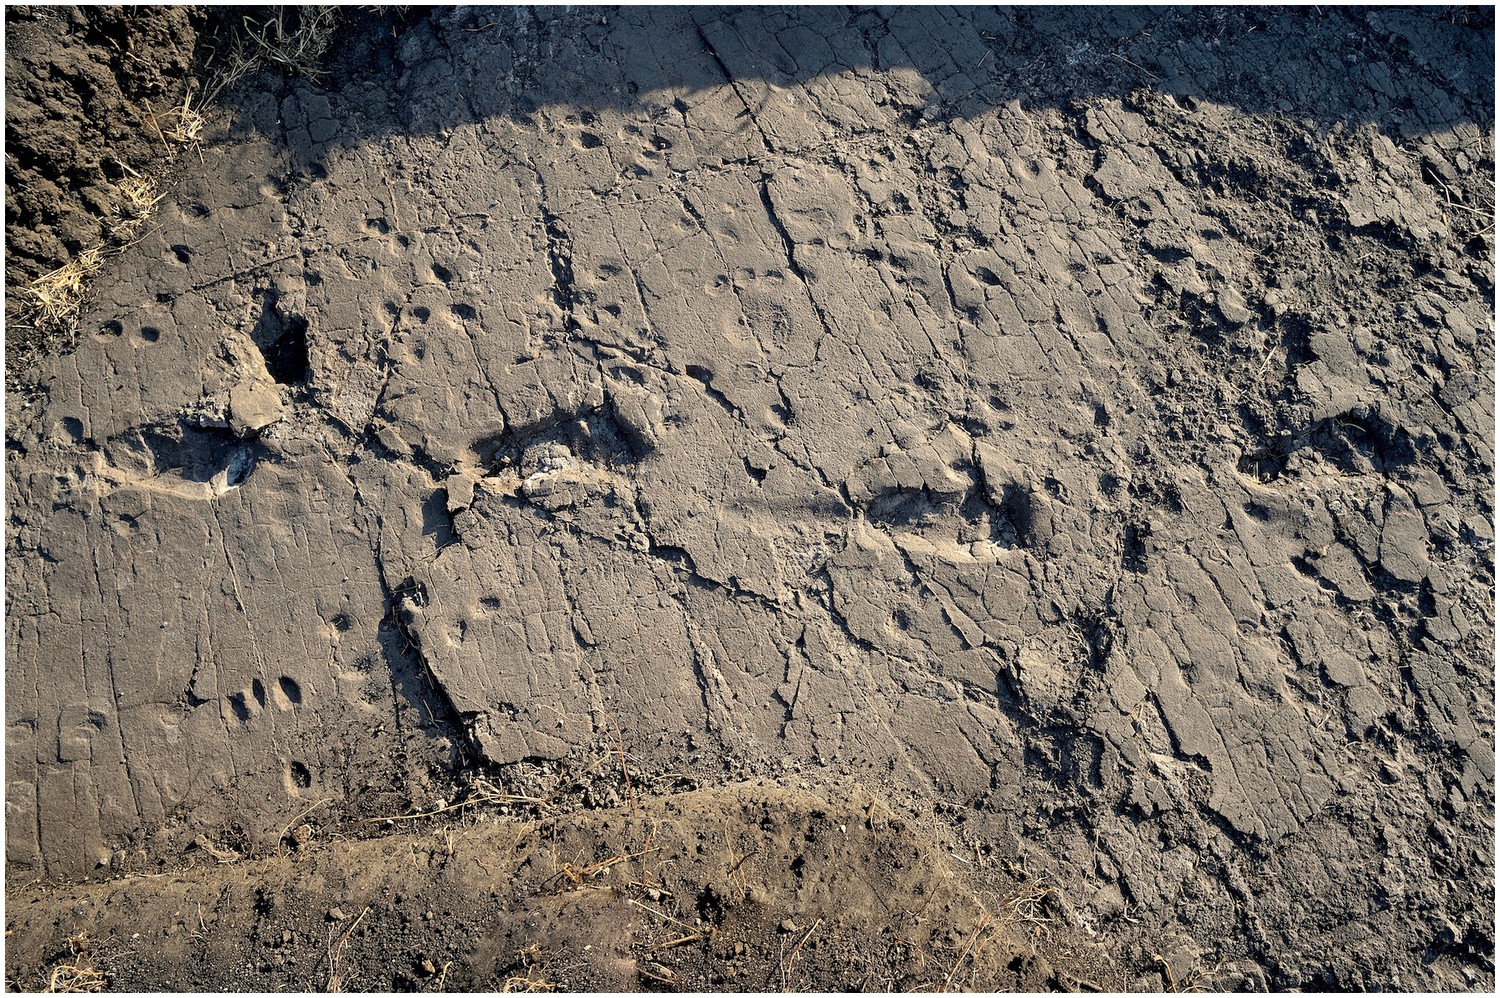
Figure 9
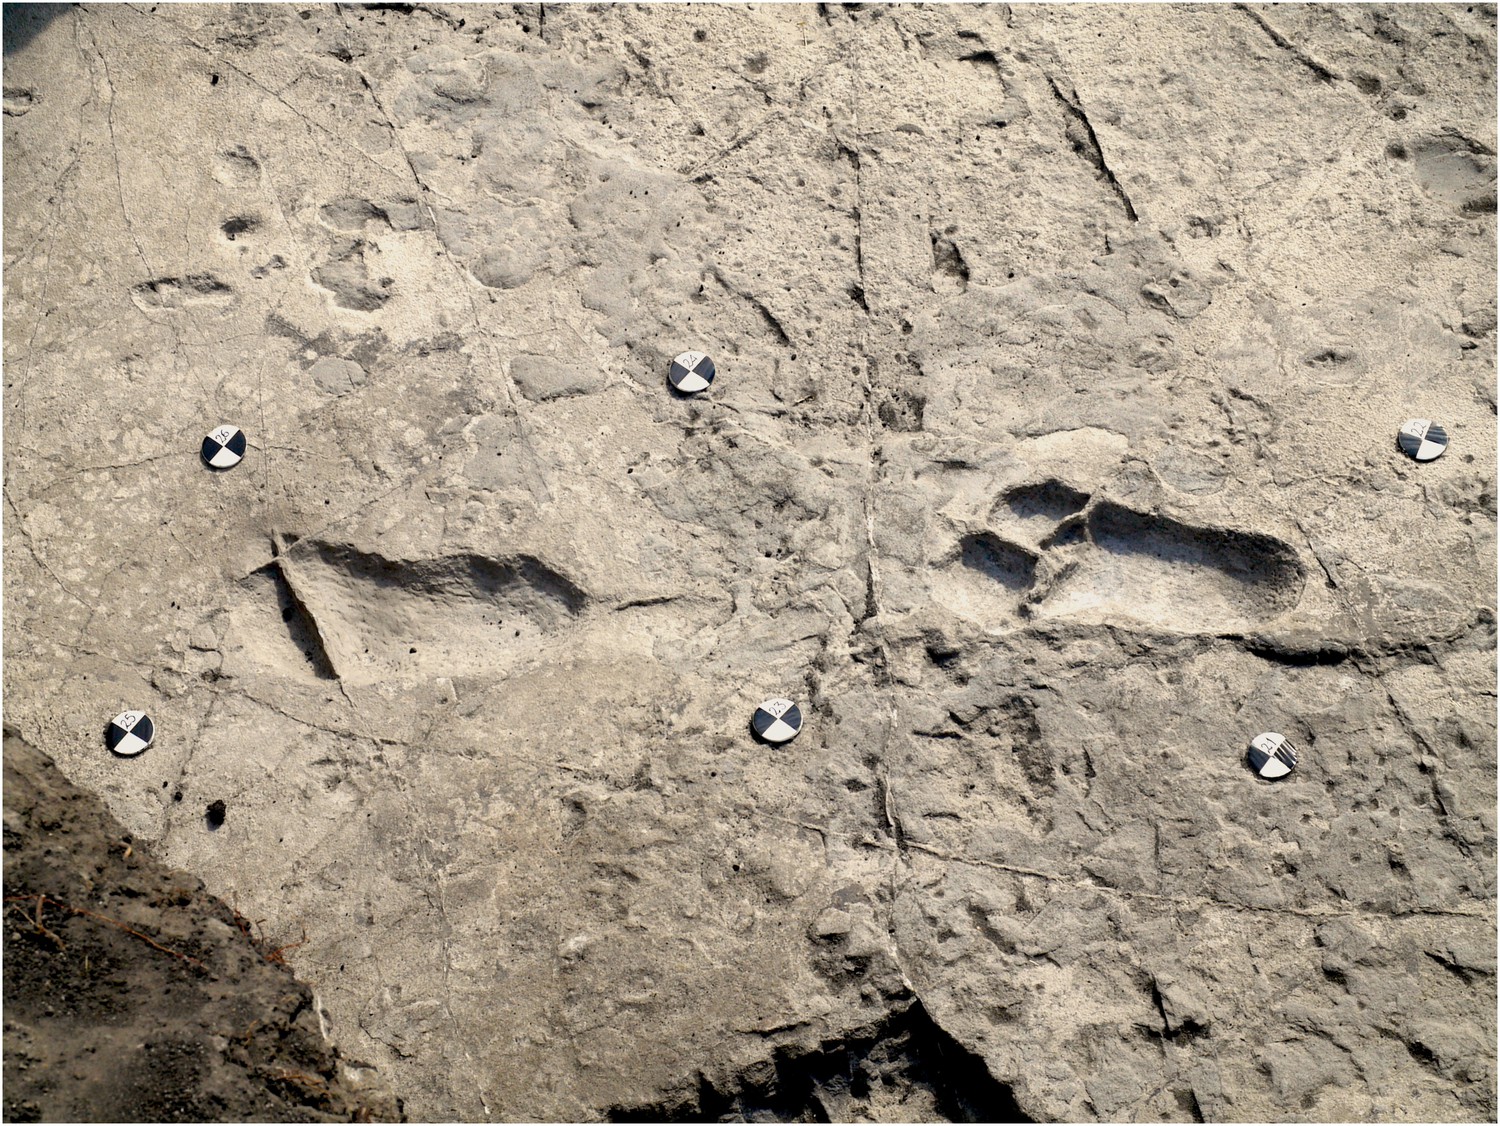
Central part of the hominin trackway in test-pit M9.
Tracks M9/S1-3 and M9/S1-2 are visible from left to right. The two tracks are crossed by some fractures filled by hard calcite veins, which were not removed. In M9, the Footprint Tuff is in almost pristine condition, and most of the tracks are still filled by compact sediment.
Figure 10
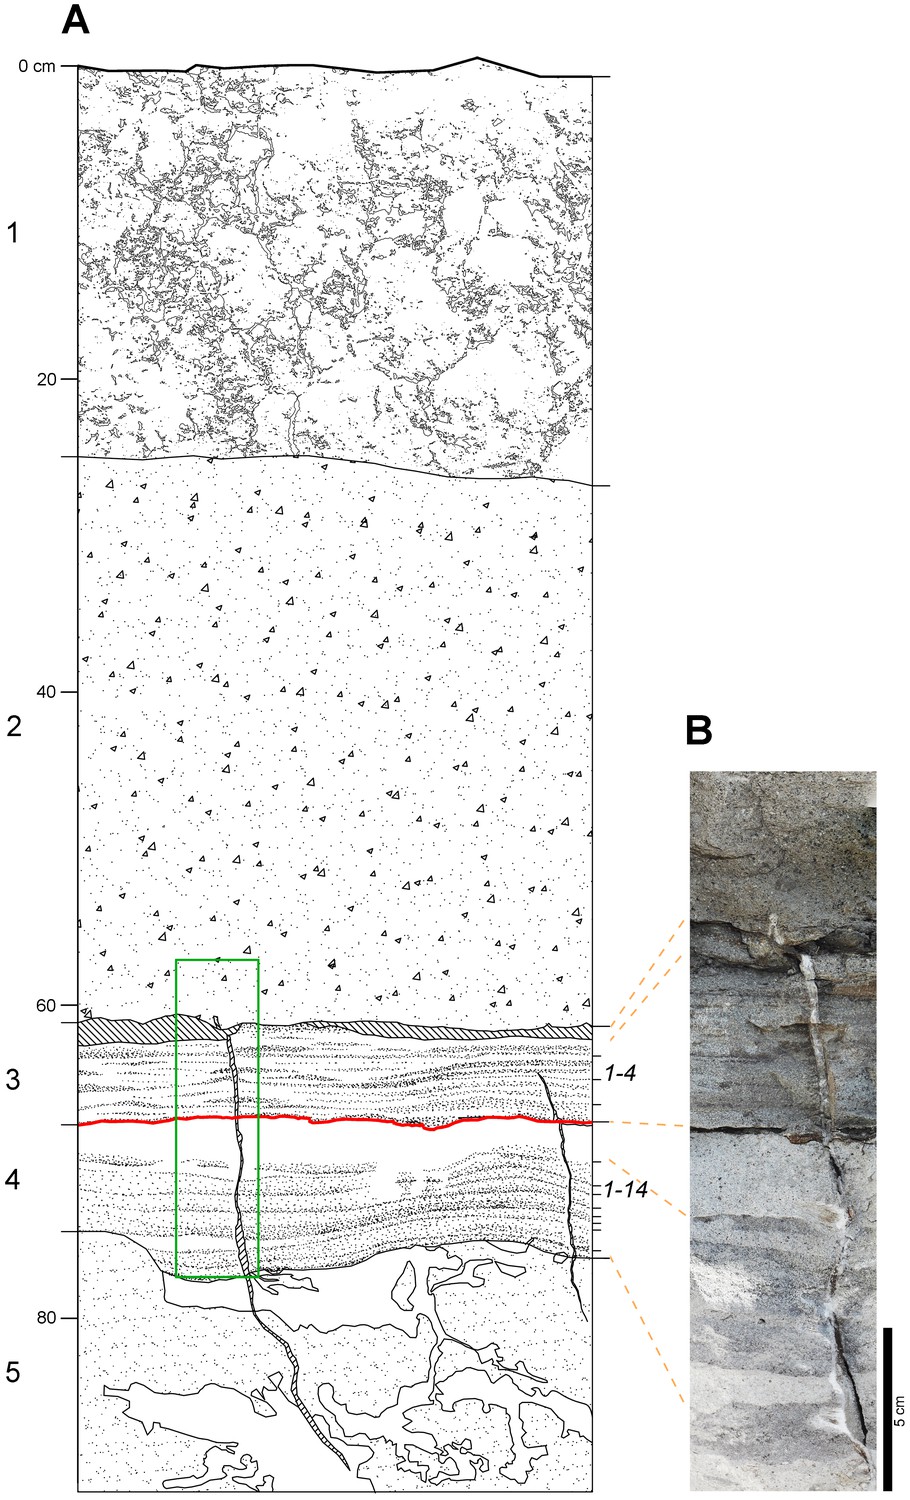
Laetoli Site S geology.
(A) Stratigraphic sketch of the sequence, as in test-pit M9. Numbers on the left (1–5) correspond to the lithologic units observed in the field: 1 — modern soil; 2 — grey augite-rich tuff; 3 — laminated grey tuff; 4 — finely layered grey and white tuff; 5 — light brown tuff. Unit two corresponds to the Augite Biotite Tuff (Hay, 1987); units 3 and 4 correspond respectively to the upper and lower horizons of the Footprint Tuff (Hay, 1987). Numbers on the right indicate the four and fourteen sublevels included, respectively, in the upper and lower part (Hay, 1987). Hominin tracks occur on the topmost sublevel of unit 4 (red line); a similar thick whitish footprint-bearing level can be observed in the same stratigraphic position at Localities 6 and 7. Oblique hatch: open cracks. White patches in unit 5 are burrower tunnels and disturbances. Green rectangle: location of panel B image. (B) Photomosaic showing the Footprint Tuff and part of the overlying unit.
Figure 11 with 1 supplement

Shaded 3D photogrammetric elevation model of a cast of the southern portion of the Site G trackway with close-ups of selected hominin tracks with contour lines.
Colour renders heights as in the colour bar; distance between elevation contour lines is 2 mm. The empty circles and squares indicate the position of the targets.
Figure 11—figure supplement 1

Orthophotos of selected hominin footprints from a cast of the southern portion of the Site G trackway.
(A) G2/3–29. (B) G1-34, G1-35, G2/3–25, G2/3–26. (C) G2/3–18. From left to right: textured models, textured and shaded models, shaded models, and shaded coloured models. Colours represent the density of the point clouds obtained by determining the distance to the nearest neighbour. The surface density is the calculation of number of neighbours divided by the neighbourhood surface = N/(πR2).
Figure 12
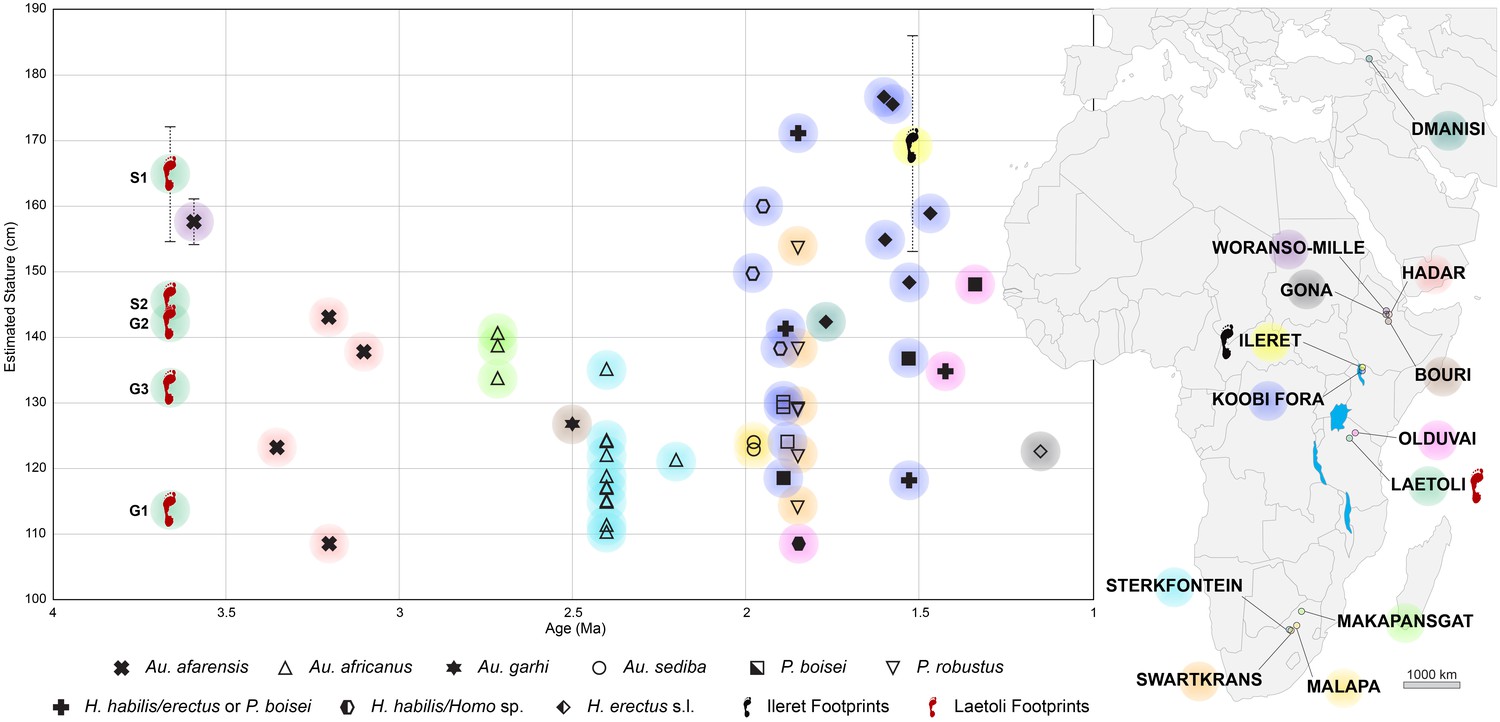
Estimates of predicted stature of fossil hominin individuals by species over time for the interval 4–1 Ma.
Solid symbols (or crosses in bold) refer to stature estimates based on actual femur length; open symbols refer to stature estimates based on estimated femur length, in turn based on femur head diameter. For Laetoli and Ileret, stature estimates are based on footprint length (see Materials and methods). For Laetoli, Ileret and Woranso-Mille, the average value and range of predicted stature are shown. Colours are associated to the geographical location of each fossil/footprint site on the map. See Supplementary file 5 for details.
Tables
Table 1
Number of individual tracks (excluding hominins) at Laetoli Site S.
Taxon | L8 | M9 | TP2 | M10 | Total |
|---|---|---|---|---|---|
Numididae (?Numida) | - | 4 | - | 9 | 13 |
Bovidae, small size (?Madoqua) | 107 | 39 | 16 | 211 | 373 |
Bovidae, medium size (?Gazella) | 39 | 9 | - | 21 | 79 |
Equidae (?Hipparion) | 1 | 2 | - | - | 3 |
Giraffidae | - | - | - | 4 | 4 |
Lagomorpha (?Lepus) | 8 | - | - | 4 | 12 |
Rhinocerotidae | - | 1 | - | - | 1 |
Unidentified micromammals | - | 27 | - | 17 | 44 |
Total | 155 | 82 | 26 | 266 | 529 |
Table 2
Dimensional parameters measured and derived from the Laetoli Site S tracks and stature and body mass estimates for S1 and S2.
Footprint | Side | Length (mm) | Max width (mm) | Foot index (%) | Heel width (mm) | Angle of gait (degrees) | Estimated stature (cm) | Estimated body mass (kg) | |||
|---|---|---|---|---|---|---|---|---|---|---|---|
H. sapiens§ | H. sapiens° | Au. afarensis‡ | H. sapiens° | Au. afarensis‡ | |||||||
TP2/S1-1 | right | 271 | 101 | 37.2 | 83 | 6 | 194–170 | 175.4 | 167–175 | 53.8 | 42.9–50.0 |
TP2/S1-2 | left | 271 | 99 | 36.6 | 81 | 4 | 193–169 | 175.1 | 167–175 | 53.1 | 42.8–49.8 |
M9/S1-1 | left | 250 | 102 | 40.6 | 73 | 2 | 179–156 | 167.5 | 154–161 | 51.6 | 39.6–46.0 |
M9/S1-2 | right | 264 | 105 | 39.7 | 80 | 3 | 189–165 | 172.8 | 163–171 | 54.2 | 41.8–48.7 |
M9/S1-3 | left | 268 | 111 | 41.2 | 91 | 4 | 192–168 | 174.3 | 166–173 | 56.3 | 42.5–49.4 |
M9/S1-4 | right | 245 | 101 | 41.2 | 71 | 4 | 175–153 | 165.6 | 151–158 | 50.9 | 38.8–45.1 |
L8/S1-1 | right | 245 | 104 | 42.4 | 78 | 8 | 175–153 | 165.6 | 151–158 | 51.7 | 38.8–45.1 |
L8/S1-2 | left | 265 | 106 | 40.0 | 82 | 11 | 189–166 | 173.1 | 164–171 | 54.5 | 41.9–48.8 |
L8/S1-3 | right | 260 | 103 | 39.6 | 77 | 3 | 186–163 | 171.3 | 161–168 | 53.1 | 41.2–47.9 |
L8/S1-4 | left | 274 | 106 | 38.6 | 81 | 10 | 196–171 | 176.5 | 169–177 | 55.6 | 43.4–50.5 |
L8/S1-5 | right | - | - | - | - | - | - | - | - | - | - |
L8/S1-6 | left | - | - | - | 86 | 3 | - | - | - | - | - |
L8/S1-7 | right | 258 | 110 | 42.7 | 90 | 8 | 184–161 | 170.3 | 159–166 | 54.8 | 40.7–47.4 |
Average S1 | - | 261 | 104 | 40.0 | 81 | 6 | 184–163 | 171.6 | 161–168 | 53.6 | 41.3–48.1 |
TP2/S2-1 | right | 231 | 120* | 51.9* | 86 | - | 165–144 | 160 | 142–149 | 46.7 | 36.5–42.4 |
Step length | Stride length | ||||
|---|---|---|---|---|---|
Footprints | Side | Step length (mm) | Footprints | Side | Stride length (mm) |
TP2/S1-1 → 2 | right → left | 553 | M9/S1-1 → 3 | left | 1044 |
M9/S1-1 → 2 | left → right | 548 | M9/S1-2 → 4 | right | 1069 |
M9/S1-2 → 3 | right → left | 505 | L8/S1-1 → 3 | right | 1140 |
M9/S1-3 → 4 | left → right | 571 | L8/S1-2 → 4 | left | 1159 |
L8/S1-1 → 2 | right → left | 552 | L8/S1-4 → 6 | left | 1284 |
L8/S1-2 → 3 | left → right | 587 | Average right | 1105 | |
L8/S1-3 → 4 | right → left | 573 | Average left | 1162 | |
L8/S1-6 → 7 | left → right | 660 | Average | 1139 | |
Average right → left | 545 | ||||
Average left → right | 591 | ||||
Average | 568 | ||||
-
*Values overestimated because of the enlarged morphology of the only preserved track of S2. §Estimation based on the relationship between foot length and stature in Homo sapiens (Tuttle, 1987). °Estimation based on the relationship between footprint length and stature/body mass in H. sapiens (Dingwall et al., 2013). ‡Estimation based on the relationship between foot length and stature/body mass in Au. afarensis (Dingwall et al., 2013). See Materials and methods for details.
Table 3
Data and estimates for the five Laetoli track-makers from Sites S and G. Limited to S1, mean values, standard deviation and range are provided.
Trackway | S1 | S2 | G1 | G2 | G3 | |
|---|---|---|---|---|---|---|
Number of measurable footprints | 11 | 1 | 9 | 2 | 8 | |
Average footprint length (mm) | 261 ± 10.5 (245–273) | 231 | 180 | 225 | 209 | |
Average footprint max width (mm) | 104 ± 3.7 (99–111) | 120* | 79 | 117 | 85 | |
Average foot index (%) | 40.0 ± 1.9 (36.6–42.7) | 51.9* | 43.8 | 48.0 | 41.5 | |
Average step length (mm) | 568 ± 44.3 (505–660) | - | 416 | 453 | 433 | |
Average stride length (mm) | 1139 ± 94.0 (1044–1284) | - | 829 | 880 | 876 | |
Estimated stature (cm) | H. sapiens§ | 163–186 | 144–165 | 113–129 | 141–161 | 130–149 |
H. sapiens° | 171.6 ± 5.4 | 160 ± 5.4 | 141.4 ± 5.4 | 158.2 ± 5.4 | 152.2 ± 5.4 | |
Au. afarensis‡ | 161–168 | 142–149 | 111–116 | 139–145 | 129–135 | |
Estimated body mass (kg) | H. sapiens° | 53.6 ± 3.7 | 46.7 ± 3.8 | 39.3 ± 3.7 | 52.6 ± 3.7 | 43.2 ± 3.7 |
Au. afarensis‡ | 41.3–48.1 | 36.5–42.4 | 28.5–33.1 | 35.6–41.4 | 33.1–38.5 | |
Walking speed (m/s) | 0.47–0.55 (0.93) | – | 0.43–0.50 (1.00) | 0.36–0.42 (0.79) | 0.39–0.46 (0.88) | |
Relative speed (s−1) | 0.25–0.34 (0.54) | – | 0.33–0.44 (0.71) | 0.23–0.30 (0.50) | 0.26–0.35 (0.58) | |
-
*Values overestimated because of the enlarged morphology of the only preserved track of S2. §As in Table 2. °As in Table 2. ‡ As in Table 2. For walking speed and relative speed, values outside the brackets are based on the method of Alexander (1976), those inside the brackets are based on the method of Dingwall et al. (2013). See Materials and methods for details.
Additional files
-
Supplementary file 1
Footprint imaging, measurement report 1.
- https://doi.org/10.7554/eLife.19568.022
-
Supplementary file 2
Footprint imaging, measurement report 2.
- https://doi.org/10.7554/eLife.19568.023
-
Supplementary file 3
Footprint imaging, measurement report 3.
- https://doi.org/10.7554/eLife.19568.024
-
Supplementary file 4
Footprint imaging, measurement report 4.
- https://doi.org/10.7554/eLife.19568.025
-
Supplementary file 5
Individual fossil ages, localities and estimated statures used to build Figure 12.
- https://doi.org/10.7554/eLife.19568.026
Download links
A two-part list of links to download the article, or parts of the article, in various formats.
Downloads (link to download the article as PDF)
Open citations (links to open the citations from this article in various online reference manager services)
Cite this article (links to download the citations from this article in formats compatible with various reference manager tools)
New footprints from Laetoli (Tanzania) provide evidence for marked body size variation in early hominins
eLife 5:e19568.
https://doi.org/10.7554/eLife.19568


