Actin is an evolutionarily-conserved damage-associated molecular pattern that signals tissue injury in Drosophila melanogaster
- The Francis Crick Institute, United Kingdom
- University Walk, University of Bristol, United Kingdom
- University of Texas Southwestern Medical Center, United States
- Instituto Gulbenkian de Ciência, Portugal
- Imperial College London, United Kingdom
- University of Bristol, United Kingdom
Figures
Figure 1
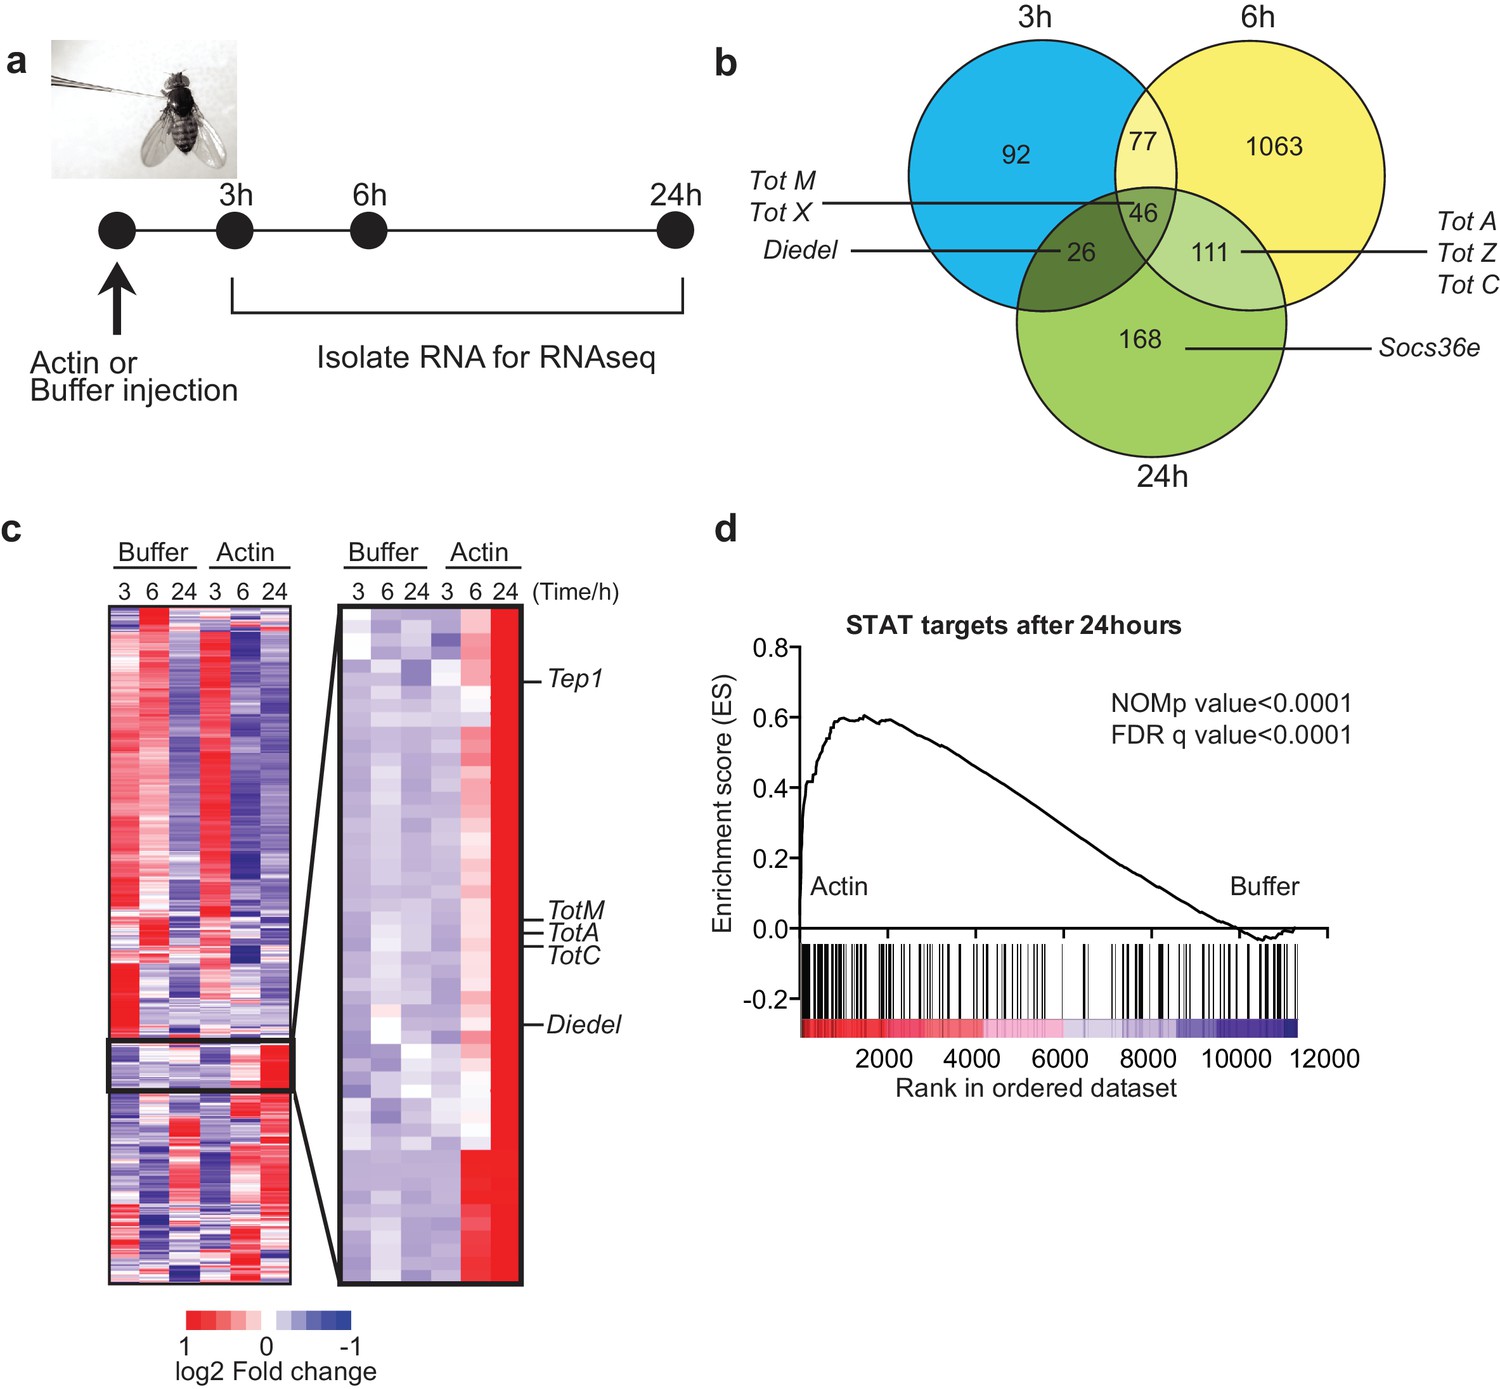
Global gene expression profiling reveals strong enrichment for JAK/STAT regulated genes upon actin injection.
(a) Groups of control (w1118) flies were injected with either buffer or actin before euthanasia at 3, 6 or 24 hr post injection. Flies within each group were pooled, RNA was isolated and processed for RNAseq analysis as described in the Methods. (b) Genes differentially expressed between buffer and actin-injected flies, including both up and down regulated transcripts, are represented for each time point in a Venn diagram. Only genes differentially expressed with a false discovery rate (FDR) < 0.05 were included in the analysis. The numbers within each set represent the numbers of genes differentially expressed. Select STAT target genes are indicated. (c) Differentially expressed genes between actin- and buffer-injected flies at 3, 6 and 24 hr were used to draw a hierarchical heat map. Genes were clustered using a Euclidean distance matrix and average linkage clustering. Samples were ordered based on time and treatment. The heat map shows the average expression values from triplicate samples. Red indicates higher expression and blue indicates lower expression relative to the mean expression of probes across all samples. The black box highlights genes for which there was the biggest fold change increase in actin- relative to buffer-injected flies. (d) Enrichment plot from GSEA showing that targets of STAT92E are enriched within the upregulated gene set in actin-injected files relative to buffer injected flies after 24 hr.
Figure 2 with 2 supplements
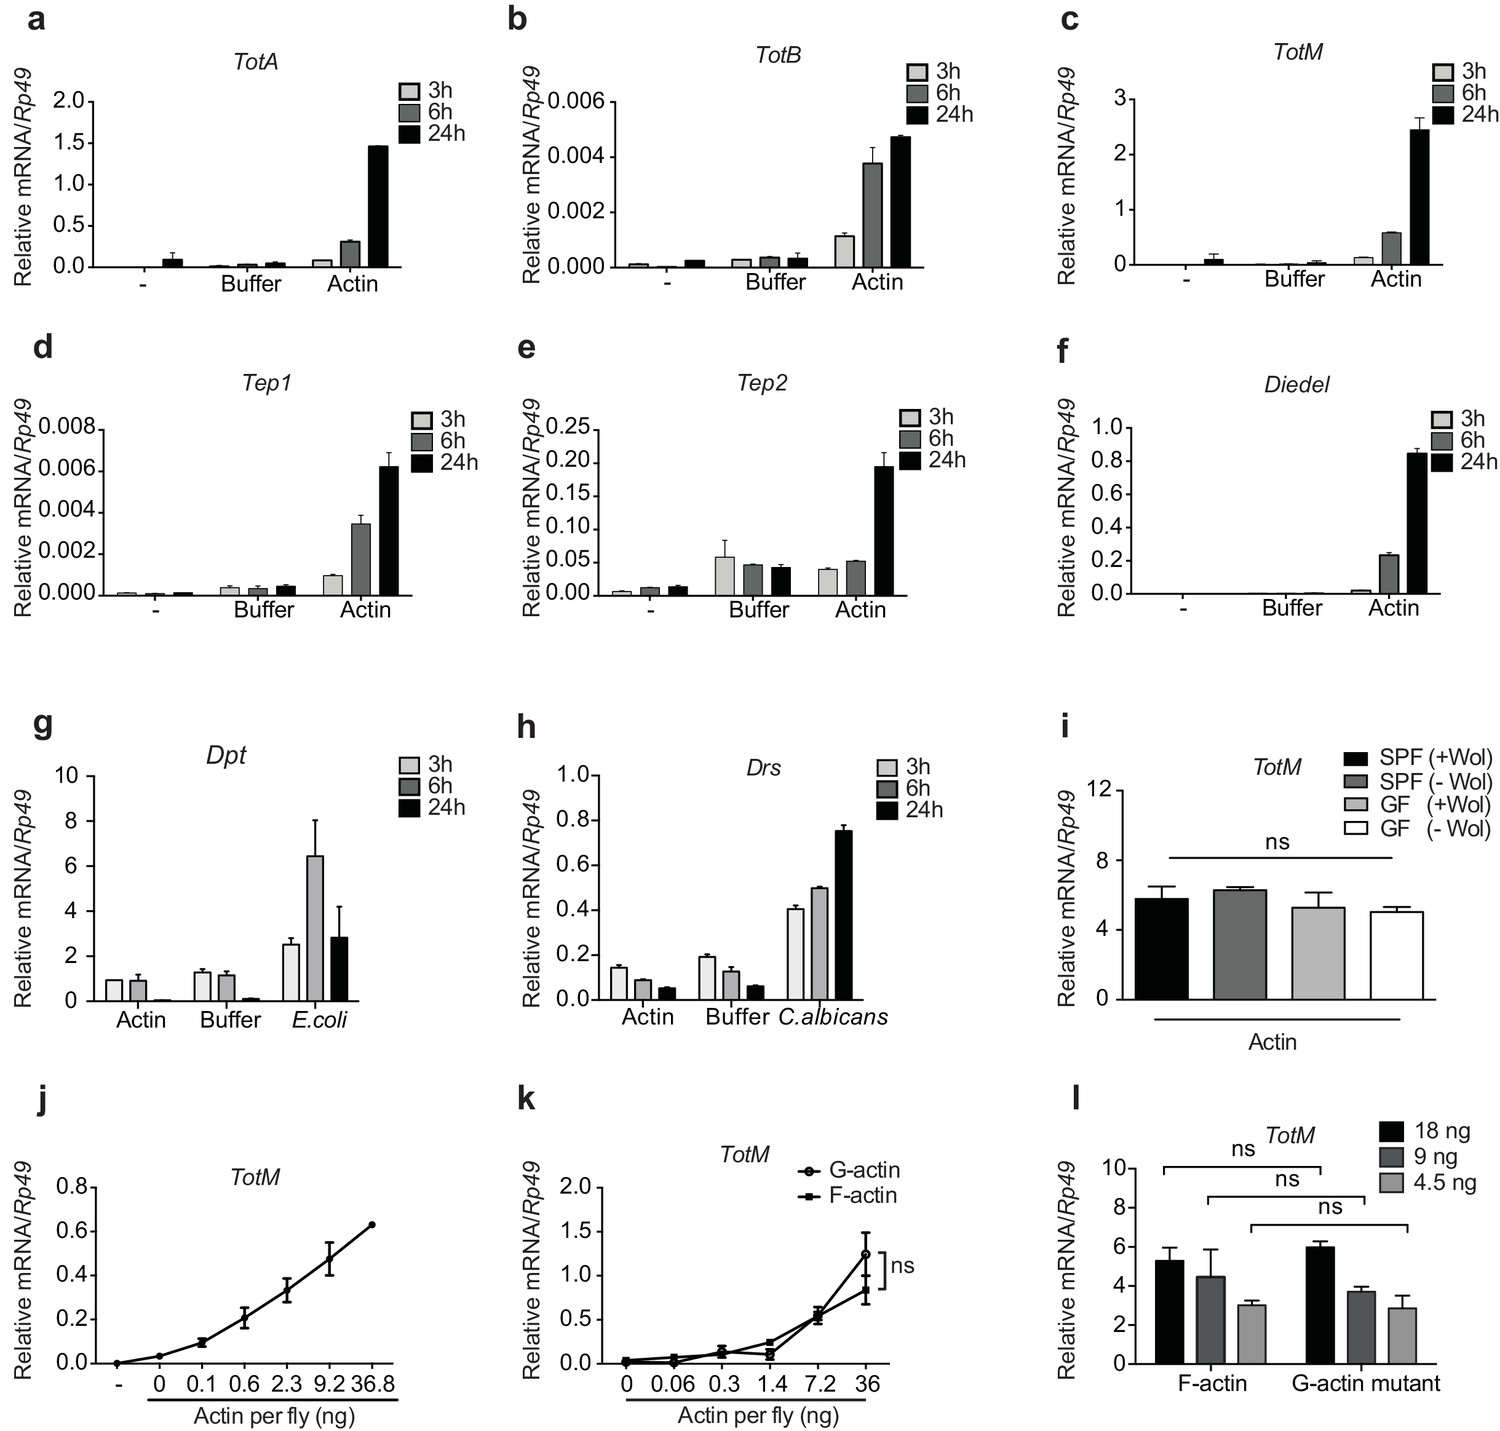
G- and F-actin induce a unique sterile inflammatory response upon injection into Drosophila.
Control (w1118) flies were mock treated (-) or injected with actin buffer, actin, E. coli or C. albicans, as indicated. Flies were euthanised at 3, 6 and 24 hr post injection, RNA was isolated and relative gene expression determined by quantitative RT-PCR. Depicted are expression levels of (a–c) Turandot (Tot) A, TotB and TotM, (d–e) Thioester-containing protein (Tep) 1 and Tep2, (f) Diedel, (g–h) Diptericin (Dpt) and Drosomycin (Drs). (i) Flies colonised with or free of Wolbachia (Wol) were reared under standard (SPF) or germ-free (GF) conditions. Relative TotM expression was assessed 24 hr post actin injection. (j) Dose-dependent TotM response to injected actin at 24 hr post injection. (k) Dose-response curve for latrunculin B-stabilised G-actin vs phalloidin-stabilised F-actin diluted in G-actin or F-actin buffer, respectively. Relative expression levels of TotM 24 hr post injection are shown. (l) A non-polymerisable G-actin mutant and F-actin were serially diluted in F-buffer at the indicated concentrations before injection into flies. Relative expression levels of TotM 24 hr after injection are depicted. Relative gene expression levels were calculated using the housekeeping gene Rp49 as a reference gene. Data are representative of at least two independent experiments with 10 flies/sample with duplicate samples. Bars represent mean ± SEM. Statistical analysis was performed using two-way ANOVA with Sidak’s multiple comparison test as post-test for pairwise comparisons. Results of Sidak’s multiple comparison test are shown (ns, not significant; *p<0.05; **p<0.01; ***p<0.001; ****p<0.0001). If not otherwise indicated, flies were injected with 36.8 ng of actin per fly. All data points are plotted even where no bars are visible.
Figure 2—figure supplement 1
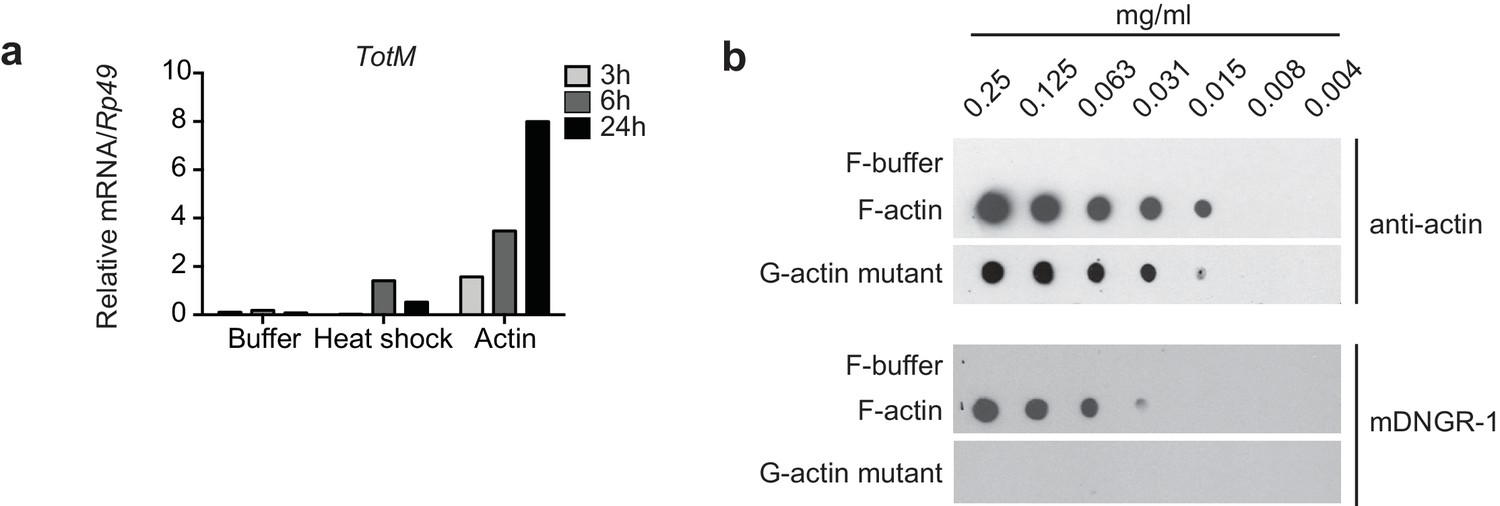
G-actin and F-actin induced TotM peaks after 24 hr.
(a) Relative expression of TotM after injection with actin, buffer or after heat shock, 24 hr post treatment. Data are representative of three independent experiments with 10 flies/sample. TotM relative levels were calculated using the housekeeping gene Rp49 as a reference gene. Bars represent mean ± SEM. All data points are plotted even where no bars are visible. (b) G-actin mutant or human platelet F-actin was serially diluted in F-buffer as indicated and spotted onto nitrocellulose membranes, which were then probed with mDNGR-1 extracellular domain (which specifically recognizes F-actin but not G-actin) or mouse-anti-β-actin. Data are representative of two independent experiments.
Figure 2—figure supplement 2
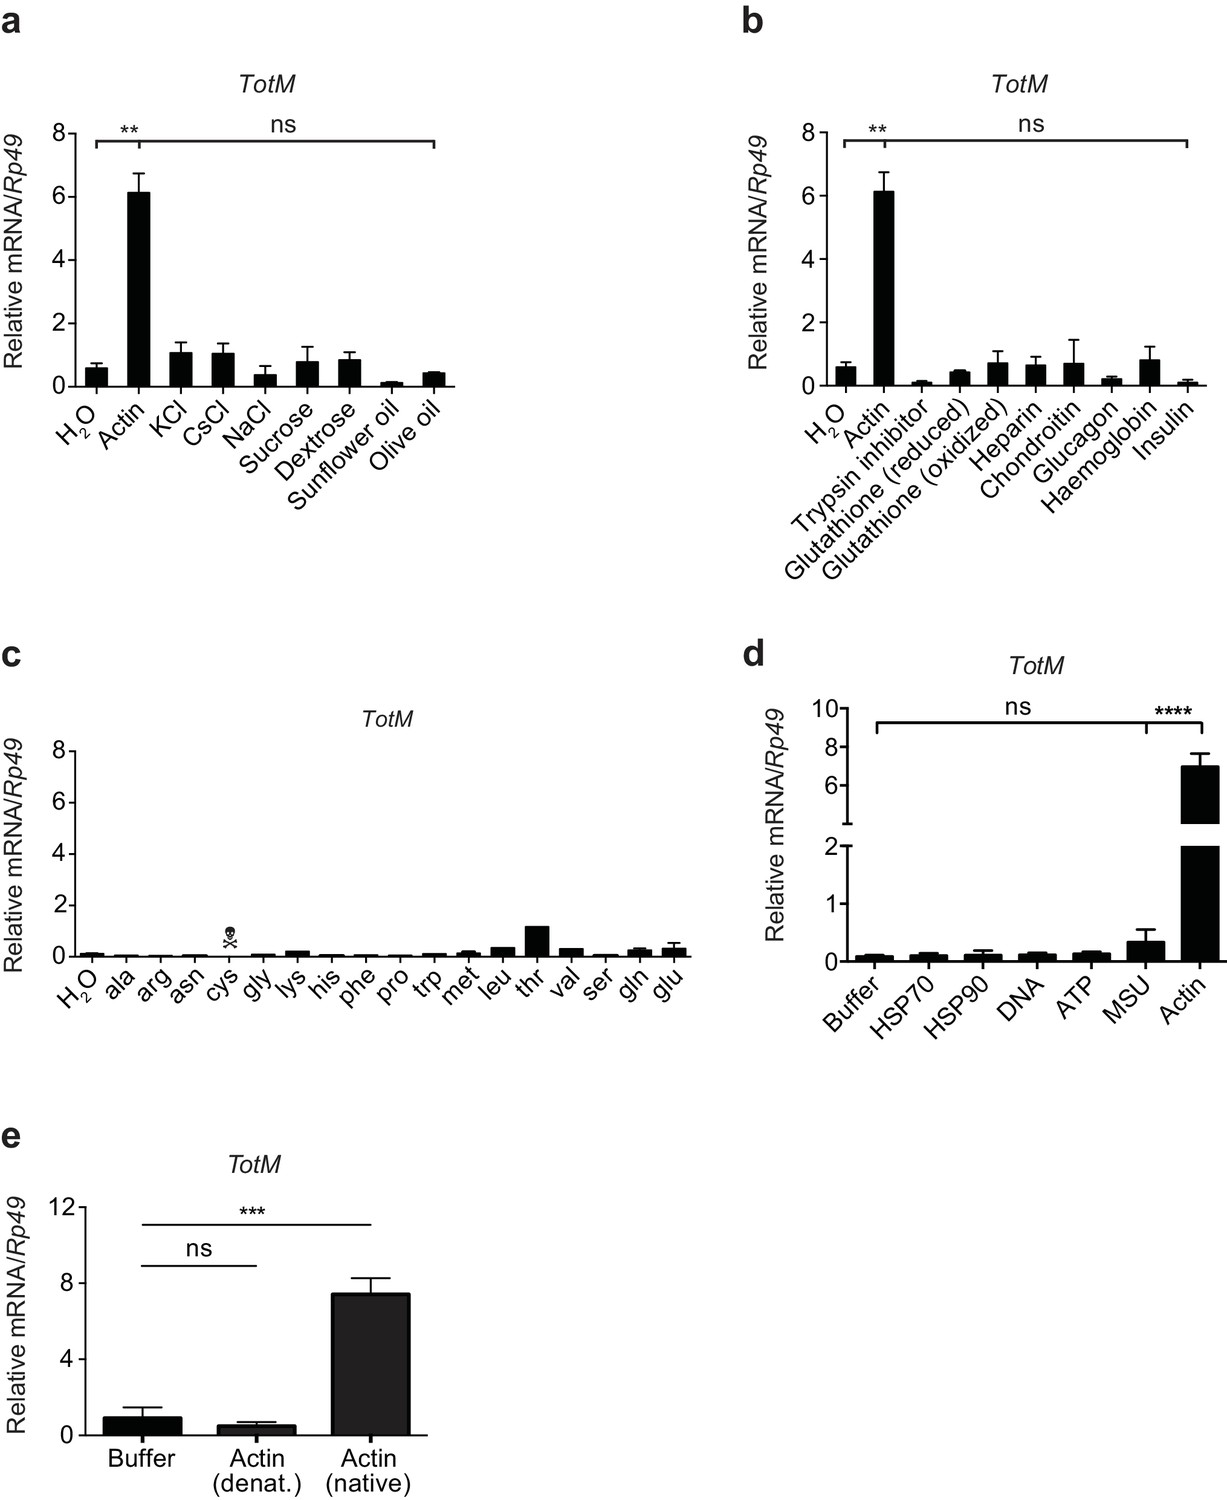
TotM is selectively induced by injected actin.
(a) Control (w1118) flies were injected with either water or a selection of salts, sugars or lipids. Relative TotM levels 24 hr post injection are depicted. (b) Control (w1118) flies were injected with either water or different peptides or polysaccharides. Relative TotM levels 24 hr post injection are depicted. (c) Control (w1118) flies were injected with either water or amino acids. Flies injected with cysteine died in less than 24 hr. Relative TotM levels 24 hr post injection are depicted. The apparent modest increase in TotM expression after injection of threonine was not reproducible (data not shown). (d) Control (w1118) flies were injected with either buffer or a selection of vertebrate DAMPs. TotM relative levels were calculated 24 hr post injection. (e) Control (w1118) flies were injected with buffer or denatured or native actin. Relative TotM levels were measured 24 hr post injection. TotM relative levels were calculated using the housekeeping gene Rp49 as a reference gene. Data are representative of at least two independent experiments with duplicate samples. Bars represent mean ± SEM. Statistical analysis was performed using one-way ANOVA with Sidak’s multiple comparison test as post-test for pairwise comparisons. Results of Sidak’s multiple comparison test are shown (ns, not significant; *p<0.05; **p<0.01; ***p<0.001; ****p<0.0001). All data points are plotted even where no bars are visible.
Figure 3
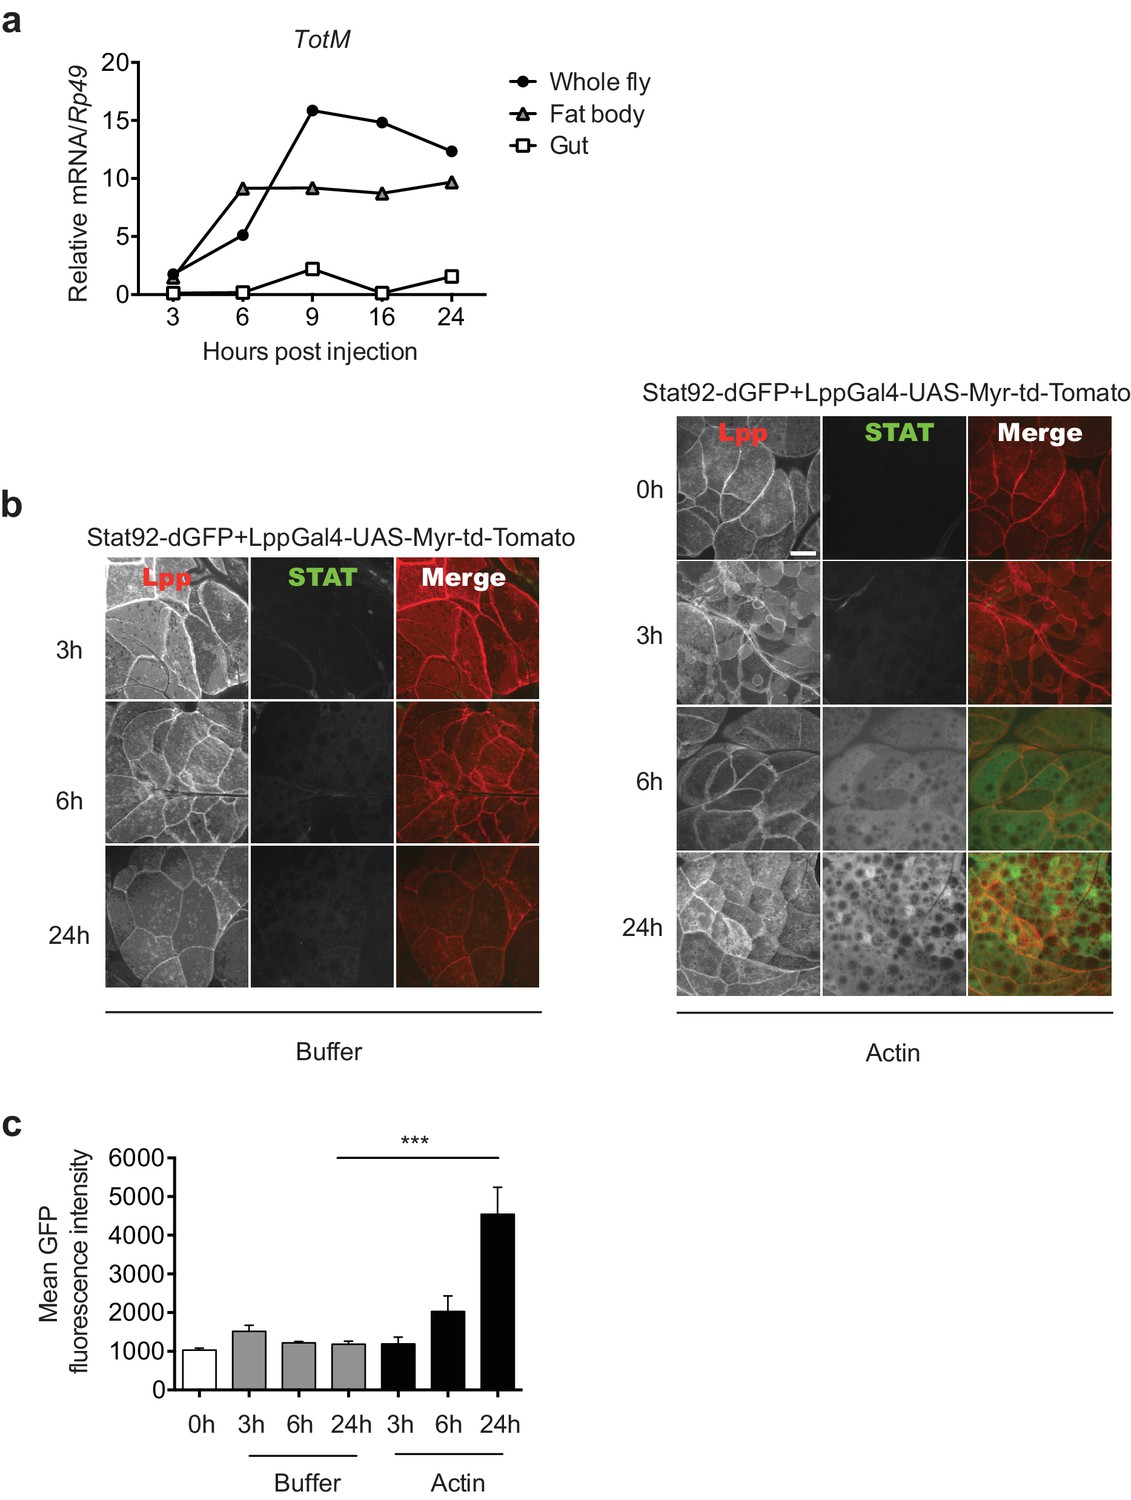
Actin injection induces JAK/STAT activation in the fat body.
(a) Control (w1118) flies were injected with actin and euthanised at the indicated times, after which the fat bodies and intestines were dissected and RNA extracted. Relative TotM expression in the two organs compared to whole flies is depicted. At each time point, samples represent five whole flies, 15 intestines or 15 fat bodies. TotM relative levels were calculated using the housekeeping gene Rp49 as a reference gene. (b) STAT92E reporter activity in the fat bodies of Stat92-dGFP+Lpp-Gal4 > UAS-Myr-td-Tomato flies at 3, 6 and 24 hr after injection with actin (right panel) of buffer (left panel). Scale bar represents 20 μm. (c) Quantification of mean STAT fluorescence within the fat body (n = 3–11 flies). Bars represent mean ± SEM. Statistical analysis was performed using one-way ANOVA with Sidak’s multiple comparison test as post-test for pairwise comparisons. Results of Sidak’s multiple comparison test are shown (ns, not significant; *p<0.05; **p<0.01; ***p<0.001; ****p<0.0001). All data points are plotted even where no bars are visible.
Figure 4 with 1 supplement
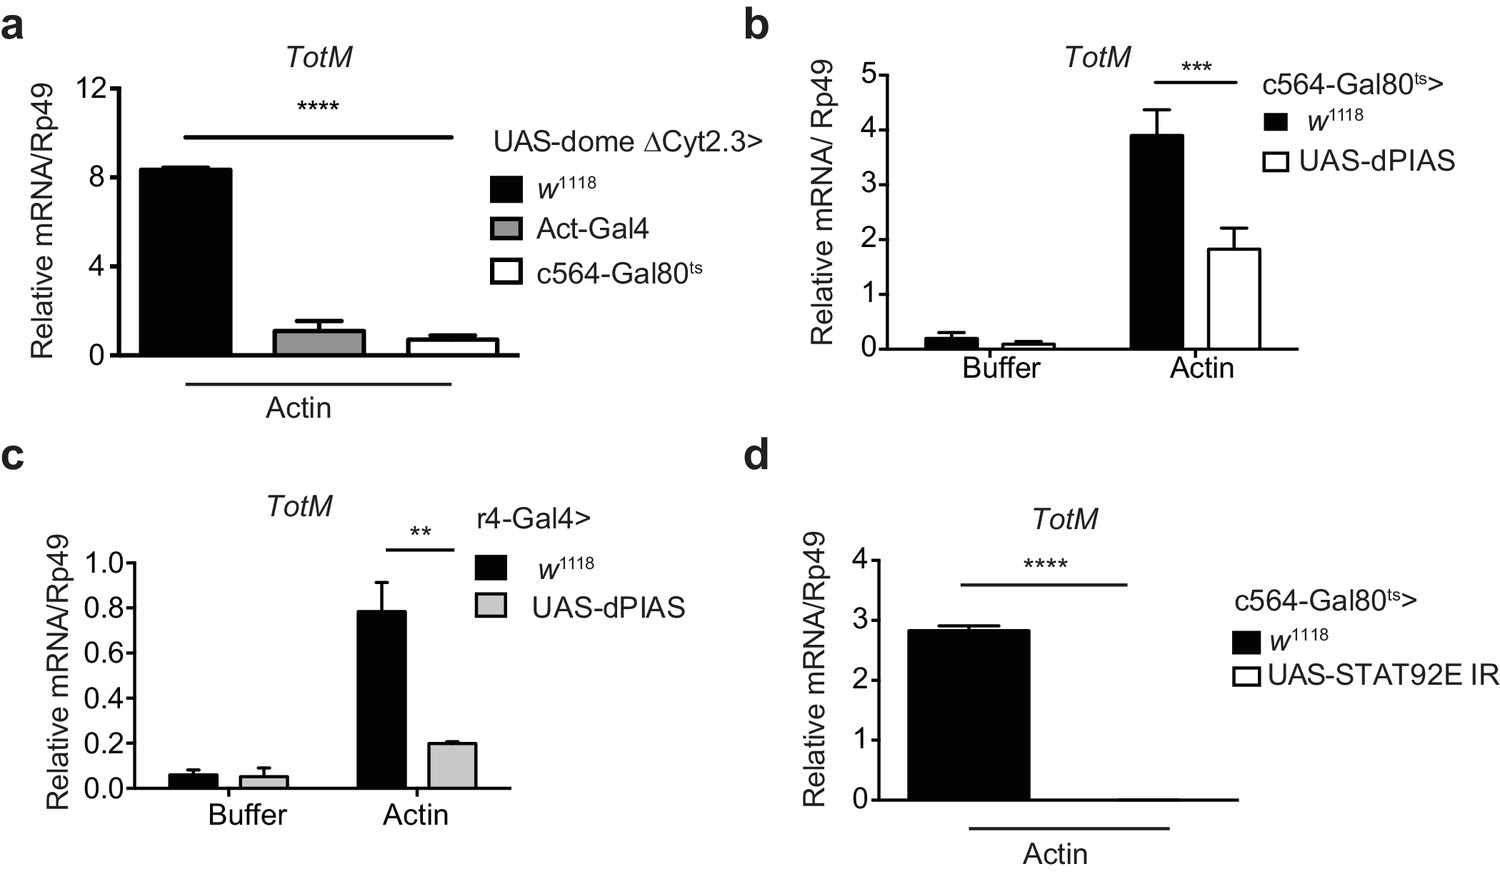
Extracellular actin-driven TotM expression depends on canonical Domeless signalling in the fat body.
(a) Relative TotM expression in flies overexpressing domeless ΔCyt2.3 dominant-negative isoform or no transgene (w1118 control) under the control of a ubiquitous driver, Act-Gal4, or a fat body-inducible driver c564-Gal4; Tubulin-Gal80ts (c564-Gal80ts), 24 hr after injection with actin. (b) Relative TotM expression in flies overexpressing dPIAS under the control of the fat body inducible driver c564-Gal4; Tubulin-Gal80ts (c564-Gal80ts), 24 hr after injection with either buffer or actin. Data are pooled from two independent experiments with 5–10 flies/sample and duplicate samples. (c) Relative TotM expression in flies overexpressing dPIAS under the control of the fat body constitutive driver r4-Gal4, 24 hr after injection with either buffer or actin. Data are representative of three independent experiments with 5–10 flies/sample with duplicate samples. (d) Relative TotM expression in flies overexpressing UAS-STAT92E IR under the control of the fat body inducible driver c564-Gal4; Tubulin-Gal80ts (c564-Gal80ts), 24 hr after injection with actin. Data are pooled from two independent experiments with triplicate samples and 5–10 flies/sample. TotM relative levels were calculated using the housekeeping gene Rp49 as a reference gene. Bars represent mean ± SEM. Statistical analysis was performed using two-way ANOVA with Sidak’s multiple comparison test as post-test for pairwise comparisons (a, b, c) or unpaired t-test (d). Significant differences with Sidak’s multiple comparison test or unpaired t-test are shown (ns, not significant; *p<0.05; **p<0.01; ***p<0.001; ****p<0.0001). All data points are plotted even where no bars are visible.
Figure 4—figure supplement 1
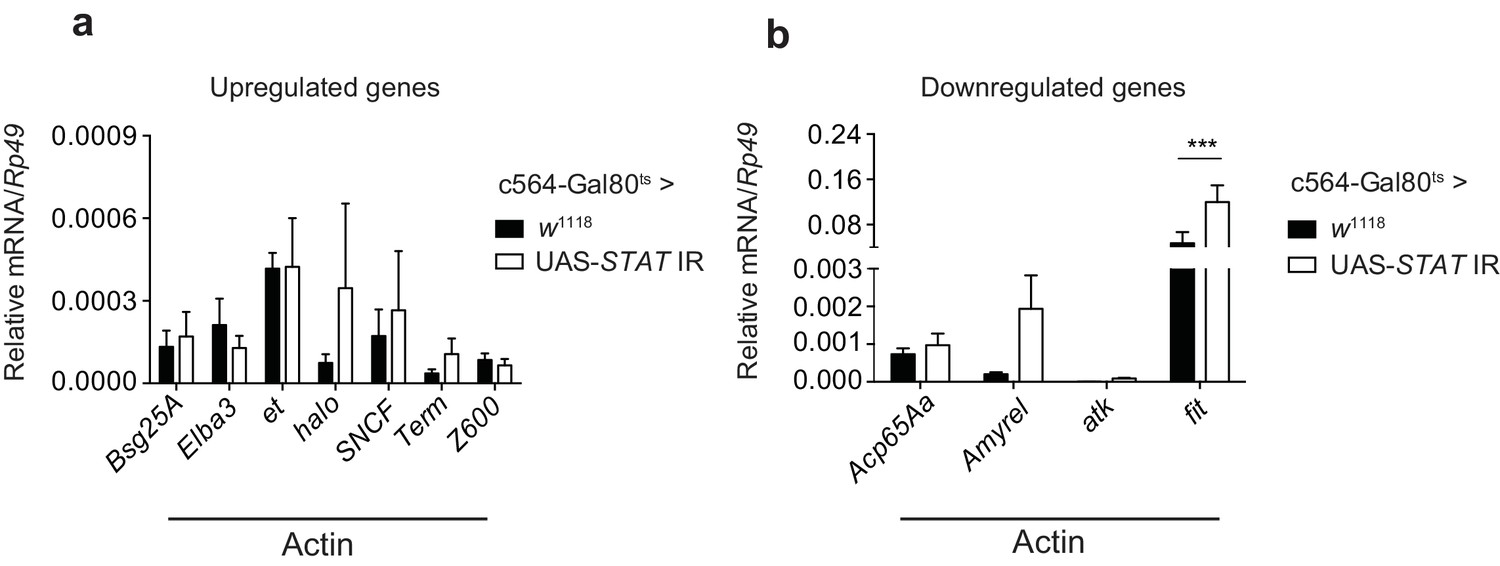
STAT-dependence of selected actin-induced or -repressed genes.
(a) Quantitation of select transcripts upregulated upon actin injection, as indicated by RNAseq analysis, in control flies (c564-Gal80ts > w1118) or flies lacking fat body STAT expression (c564-Gal80ts > UAS-STAT92E IR), 24 hr after injection with actin. (b) As in (a), but for genes downregulated upon actin injection. TotM relative levels were calculated using the housekeeping gene Rp49 as a reference gene. Bars represent mean ± SEM. Statistical analysis was performed using two-way ANOVA with Sidak’s multiple comparison test as post-test for pairwise comparisons. Significant differences with Sidak’s multiple comparison test are shown (ns, not significant; *p<0.05; **p<0.01; ***p<0.001; ****p<0.0001). All data points are plotted even where no bars are visible.
Figure 5
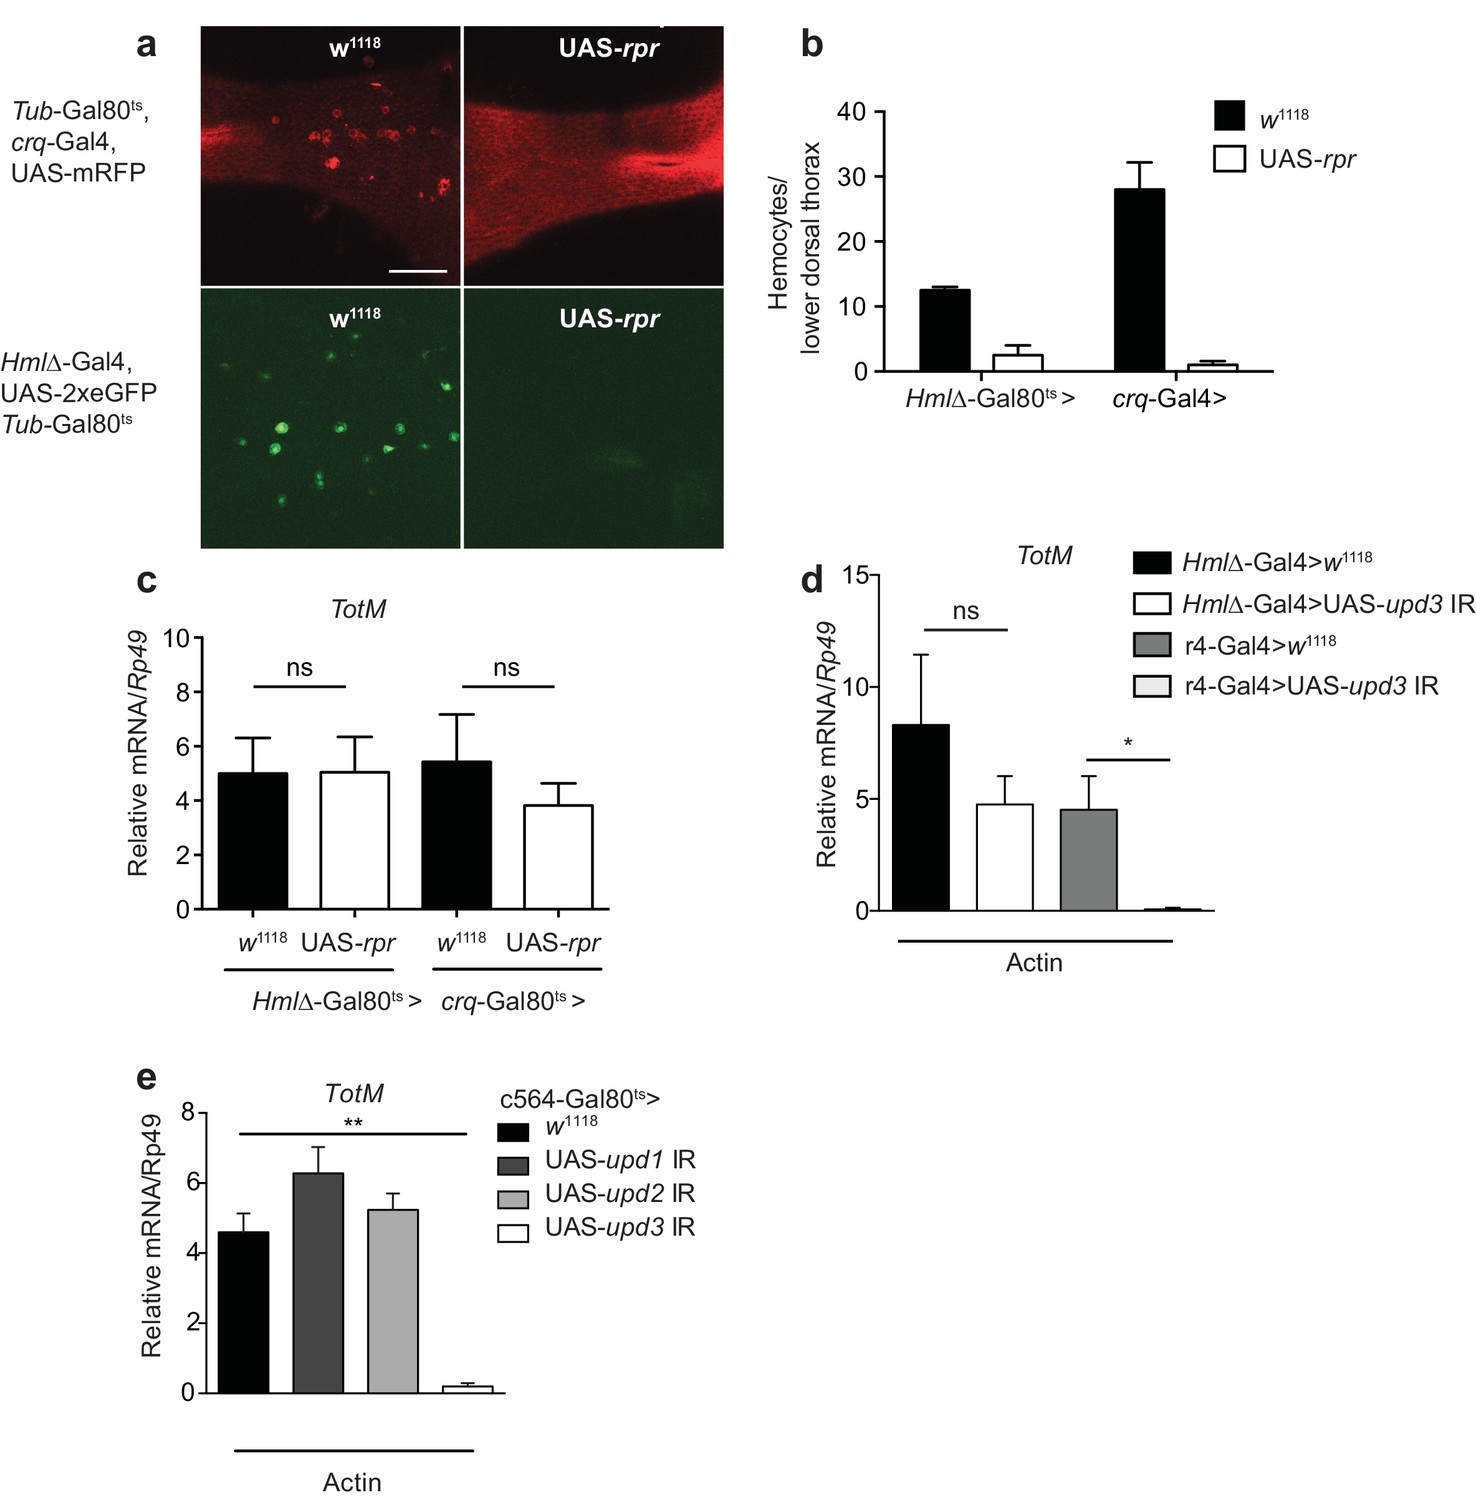
Extracellular actin-driven TotM expression requires fat body-derived Upd3 but not haemocytes.
(a) Intravital confocal microscopy of the dorsum of Tub-Gal80ts, crq-Gal4, UAS-mRFP or Hml△-Gal4, UAS 2xeGFP; Tub-Gal80ts lines crossed to UAS-rpr or control (w1118) flies after shifting to 29°C. (b) Quantification of the images shown in (a). Haemocyte numbers in the lower dorsal thorax counted from two images (Hml△-Gal4) or four images (crq-Gal4). Differences in overall haemocyte numbers between the two driver lines may be due to differing specificities of the crq and Hml markers. (c) Relative TotM expression in haemocyte-deficient (Hml△-Gal4 > UAS-rpr or crq-Gal4 > UAS-rpr) vs control flies (Hml△Gal4 > w1118 or crq-Gal4 > w1118), 24 hr after injection with actin. In order to increase statistical power, data were pooled from two independent experiments with 5–10 flies/sample and triplicate samples. (d) TotM expression levels in the constitutive fat body driver (r4-Gal4) or constitutive haemocyte driver lines (Hml△-Gal4) crossed to either control (w1118) or UAS-upd3 IR lines, 24 hr after injection with actin. Data are representative of two independent experiments with 5–10 flies/sample and triplicate samples. (e) TotM expression levels in fat body driver line c564-Gal4; Tubulin-Gal80ts (c564-Gal80ts) crossed to control (w1118), UAS-upd1 IR, UAS-upd2 IR or UAS-upd3 IR lines shifted to the restrictive temperature, 24 hr after injection with actin. Data are representative of three independent experiments with 5–10 flies/sample and triplicate samples. TotM relative levels were calculated using the housekeeping gene Rp49 as a reference gene. Bars represent mean ± SEM. Statistical analysis was performed using one-way ANOVA with Sidak’s multiple comparison test as post-test for pairwise comparisons. Results of Sidak’s multiple comparison test are shown (ns, not significant; *p<0.05; **p<0.01; ***p<0.001; ****p<0.0001). All data points are plotted even where no bars are visible.
Figure 6 with 1 supplement

Extracellular actin-induced TotM expression requires Shark and Src42A in the fat body.
(a)TotM expression levels in flies that lack Shark ubiquitously (Tub-Gal80ts; Tub-Gal4 > UAS-Shark IR R2/Fr) or in control flies lacking a driver (w1118 > UAS-Shark IR R2/Fr), 24 hr after injection with either buffer or actin. Data are representative of three independent experiments with 5–10 flies/sample with duplicate samples. (b) Flies lacking Shark selectively in the fat body (c564-Gal80ts > UAS-Shark IR R2/Fr) or control flies lacking a driver (w1118 > UAS-Shark IR R2/Fr) were injected with either buffer or actin. Relative TotM levels 24 hr post injection are depicted. Data are representative of two independent experiments with 5–10 flies/sample and triplicate samples. (c) The relative TotM expression in a constitutive fat body driver line (r4-Gal4) crossed to control (w1118) or UAS-Shark IR (R2/R3), 24 hr after injection with actin. Data are representative of three independent experiments with 5–10 flies/sample and duplicate samples. (d) Relative TotM levels in flies lacking Src42A either ubiquitously (Tub-Gal80ts > UAS-Src42A IR) or selectively in the fat body (c564-Gal80ts > UAS-Src42A IR) compared to control flies lacking a driver (w1118 > UAS-Src42A IR), 24 hr after injection with either buffer or actin. Data are representative of three independent experiments with 5–10 flies/sample with duplicate samples. (e) Relative TotM levels in flies expressing a dominant negative version of Src42A ubiquitously (Tub-Gal80ts > UAS-Src42ADN), within the fat body (c564-Gal80ts > UAS-Src42ADN) or in the absence of a driver (w1118 > UAS-Src42ADN), 24 hr after injection with either buffer or actin. No driver control refers to Tub-Gal80ts; UAS-Src42ADN/TM6C.Sb1. No UAS control refers to c564-Gal4; Tub-Gal80ts/TM6C.Sb1. Data are representative of two independent experiments with 5–10 flies/sample with triplicate samples. (f) Relative TotM levels between untreated (-) fat body driver line crossed to constitutively active Src42A (c564-Gal80ts > UAS-Src42ACA); untreated control flies (c564-Gal80ts > w1118) and actin-injected control flies (c564-Gal80ts > w1118). Data are representative of three independent experiments with 5–10 flies/sample with triplicate samples. TotM relative levels were calculated using the housekeeping gene Rp49 as a reference gene. Bars represent mean ± SEM. Statistical analysis was performed using one-way (c, f) or two-way (a, b, d, e) ANOVA with Sidak’s multiple comparison test as post-test for pairwise comparisons. Results of Sidak’s multiple comparison test are shown (ns, not significant; *p<0.05; **p<0.01; ***p<0.001; ****p<0.0001). All data points are plotted even where no bars are visible.
Figure 6—figure supplement 1
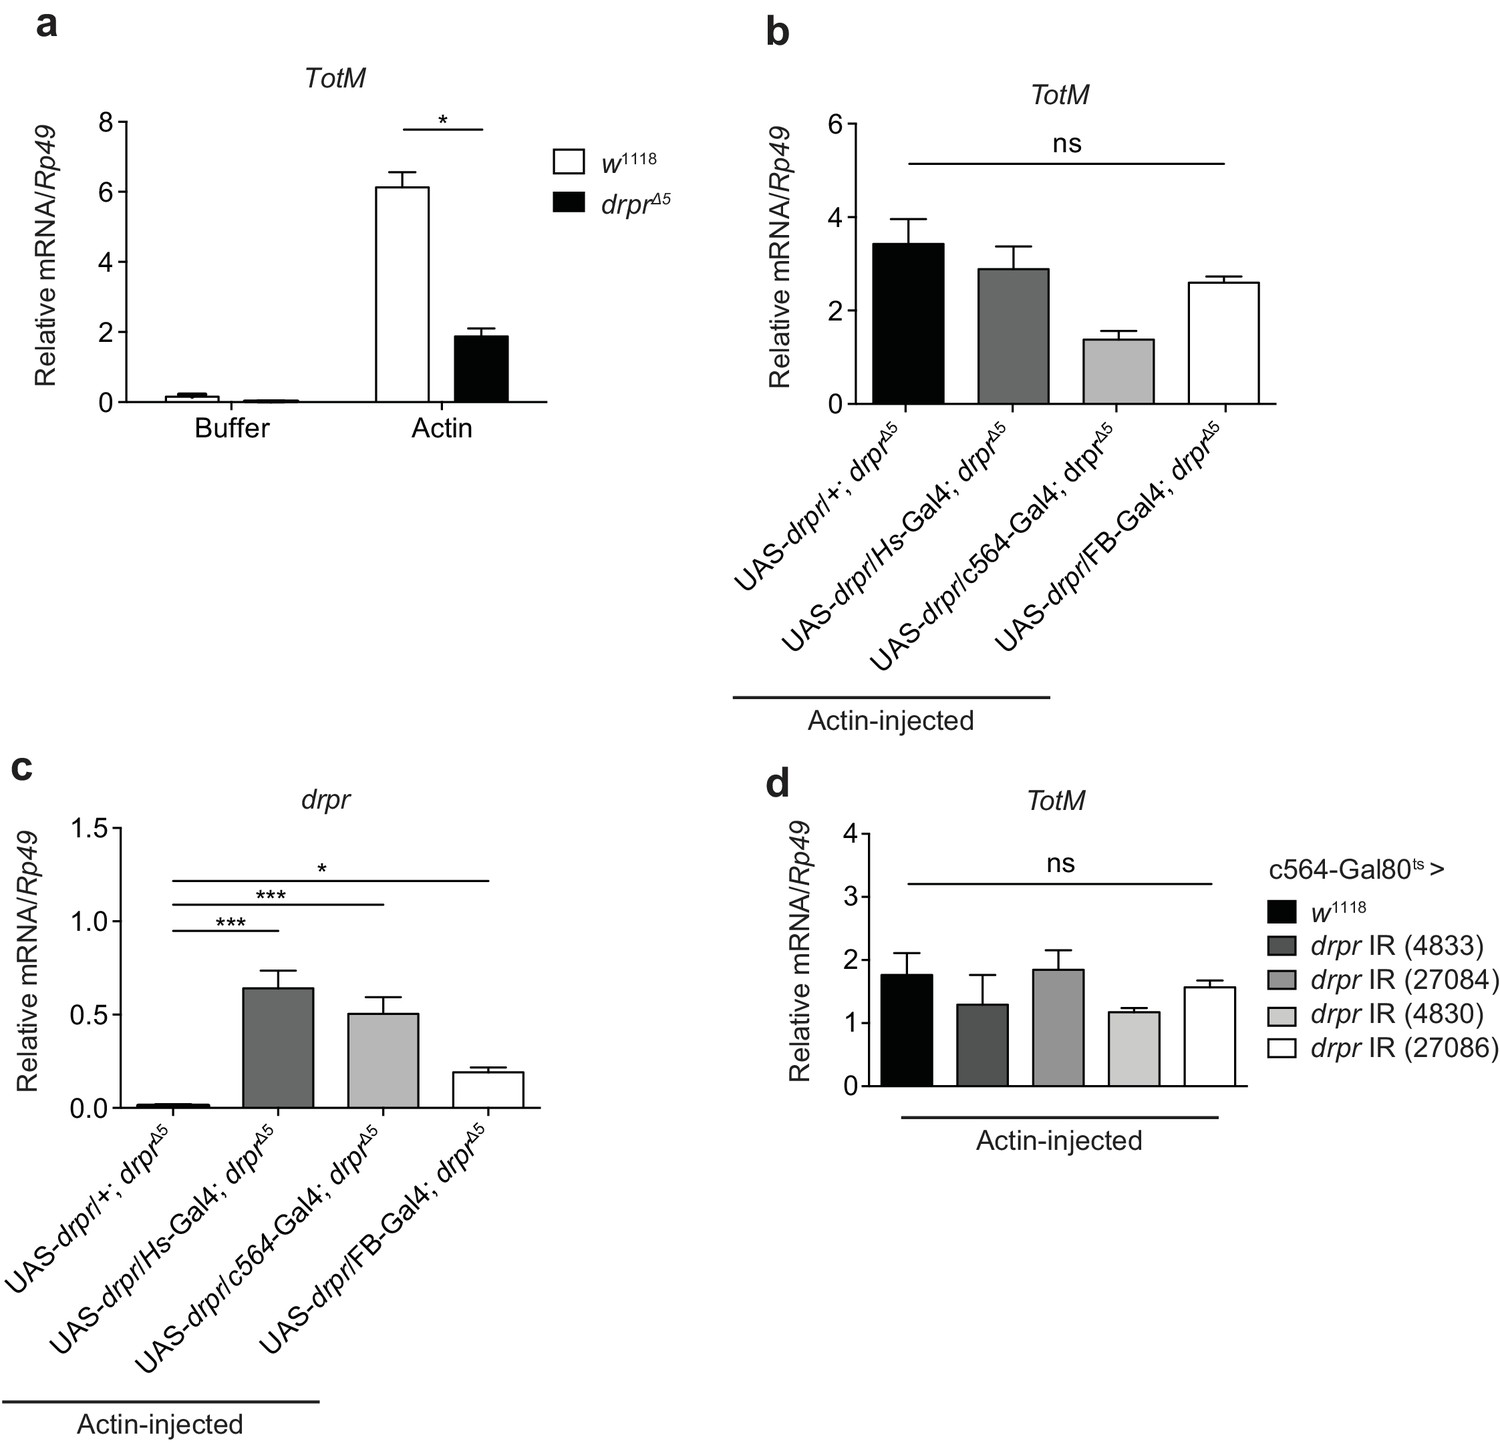
Extracellular actin-induced TotM expression is independent of Draper.
(a) Control (w1118) fruit flies or Draper null mutants (drprΔ5) were injected with buffer or actin. The relative expression of TotM was measured 24 hr post injection. The data are representative of two independent experiments with 5–10 flies/sample and duplicate samples. (b, c) Draper was ectopically expressed in a deficient background, either by use of a heat shock driver (w; UAS-drpr/Hs-Gal4; drprΔ5) or two different fat body drivers (w; UAS-drpr/c564-Gal4; drprΔ5or w; UAS-drpr/FB-Gal4; drprΔ5). Relative TotM (b) or drpr (c) expression levels were measured 24 hr post actin injection and compared to a control line that lacked a driver (w; UAS-drpr/+; drprΔ5). The data are representative of three independent experiments with 5–10 flies/sample and duplicate samples. (d) The relative expression of TotM in flies in which draper was knocked down in the fat body (Tub-Gal80ts; c564-Gal4 > UAS-drpr IR), measured 24 hr post actin injection and compared to control flies (Tub-Gal80ts; c564-Gal4 > w1118). Data are representative of two independent experiments with 5–10 flies/sample and triplicate samples. TotM relative levels were calculated using the housekeeping gene Rp49 as a reference gene. Bars represent mean ± SEM. Statistical analysis was performed using one-way (b, c, d) or two-way (a) ANOVA with Sidak’s multiple comparison test as post-test for pairwise comparisons. Results of Sidak’s multiple comparison test are shown (ns, not significant; *p<0.05; **p<0.01; ***p<0.001; ****p<0.0001). All data points are plotted even where no bars are visible.
Figure 7
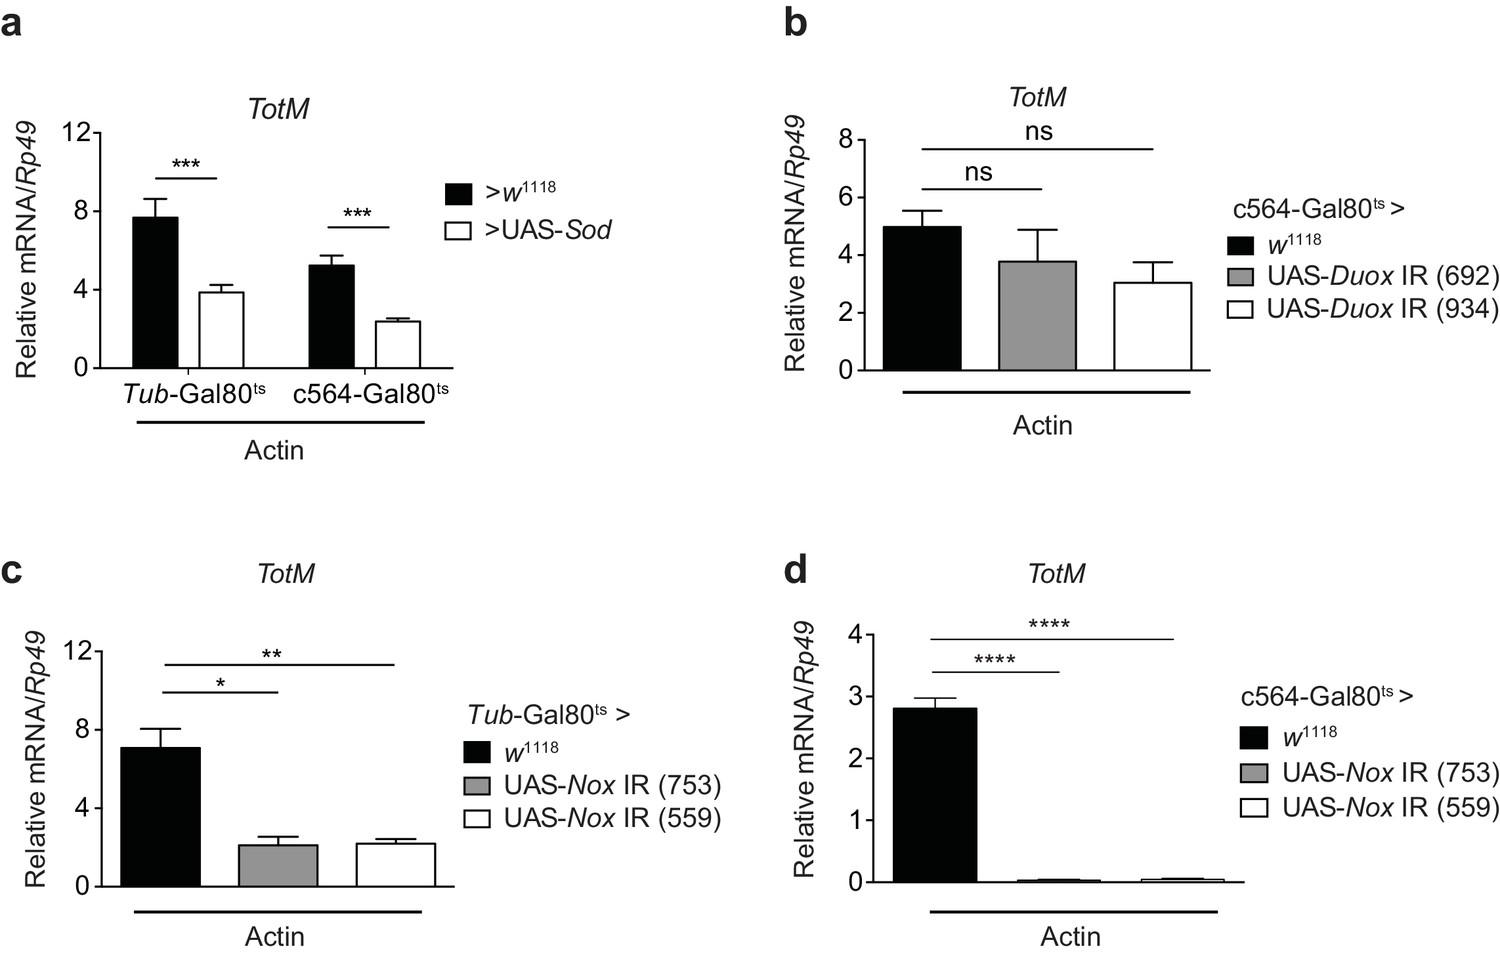
Extracellular actin-induced TotM expression is dependent on the NADPH oxidase Nox.
(a) Flies overexpressing superoxide dismutase (Sod) either ubiquitously (Tub-Gal80ts; Tub-Gal4 > UAS-Sod) or in the fat body (Tub-Gal80ts; c564-Gal4 > UAS-Sod) or control flies without transgene (Tub-Gal80ts; c564-Gal4 > w1118 or Tub-Gal80ts; Tub-Gal4 > w1118) were injected with actin. TotM expression 24 hr post injection is shown. In order to increase statistical power, data were pooled from two independent experiments with 5–10 flies/sample and quadruplicate samples. (b) TotM expression levels 24 hr post actin injection in flies in which Duox was knocked down in the fat body (Tub-Gal80ts; c564-Gal4 > UAS-Duox IR). Data are representative of two independent experiments with 5–10 flies/sample and triplicate samples. (c–d) TotM expression levels in flies in which Nox was knocked down either ubiquitously (c) (Tub-Gal80ts; Tub-Gal4 > UAS-Nox IR) or in the fat-body (d) (Tub-Gal80ts; c564-Gal4 > UAS-Nox IR) compared to control flies lacking RNAi (Tub-Gal80ts; Tub-Gal4 > w1118 or Tub-Gal80ts; c564-Gal4 > w1118), 24 hr after injection with actin. Data are representative of two independent experiments with 5–10 flies/sample and triplicate samples. TotM relative levels were calculated using the housekeeping gene Rp49 as a reference gene. Bars represent mean ± SEM. Statistical analysis was performed using one-way ANOVA with Sidak’s multiple comparison test as post-test for pairwise comparisons. Results of Sidak’s multiple comparison test are shown (ns, not significant; *p<0.05; **p<0.01; ***p<0.001; ****p<0.0001). All data points are plotted even where no bars are visible.
Figure 8 with 1 supplement

Septic injury causes actin accumulation in hemolymph and TotM induction dependent on fat body expression of Nox and Src42A.
(a) Immunoblotting for actin in the haemolymph (Top) and Ponceau stain (bottom) of mock (uninfected), Escherichia coli or Micrococcus luteus infected flies at 3 or 6 hr post infection. Data are representative of two independent experiments with 10 flies per sample. (b–d) Expression levels of TotM (b), Dpt (c) or Drs (d) in flies, in which Nox or Src42A was knocked down in the fat-body (Tub-Gal80ts; c564-Gal4 > UAS-Nox IR or Tub-Gal80ts; c564-Gal4 >UAS-Src42A IR) compared to control flies (Tub-Gal80ts; c564-Gal4 > w1118), 24 hr after septic injury with a mixture of Escherichia coli and Micrococcus luteus. In order to increase statistical power, data from two independent experiments with 5–10 flies/sample and duplicate samples were pooled.
Figure 8—figure supplement 1
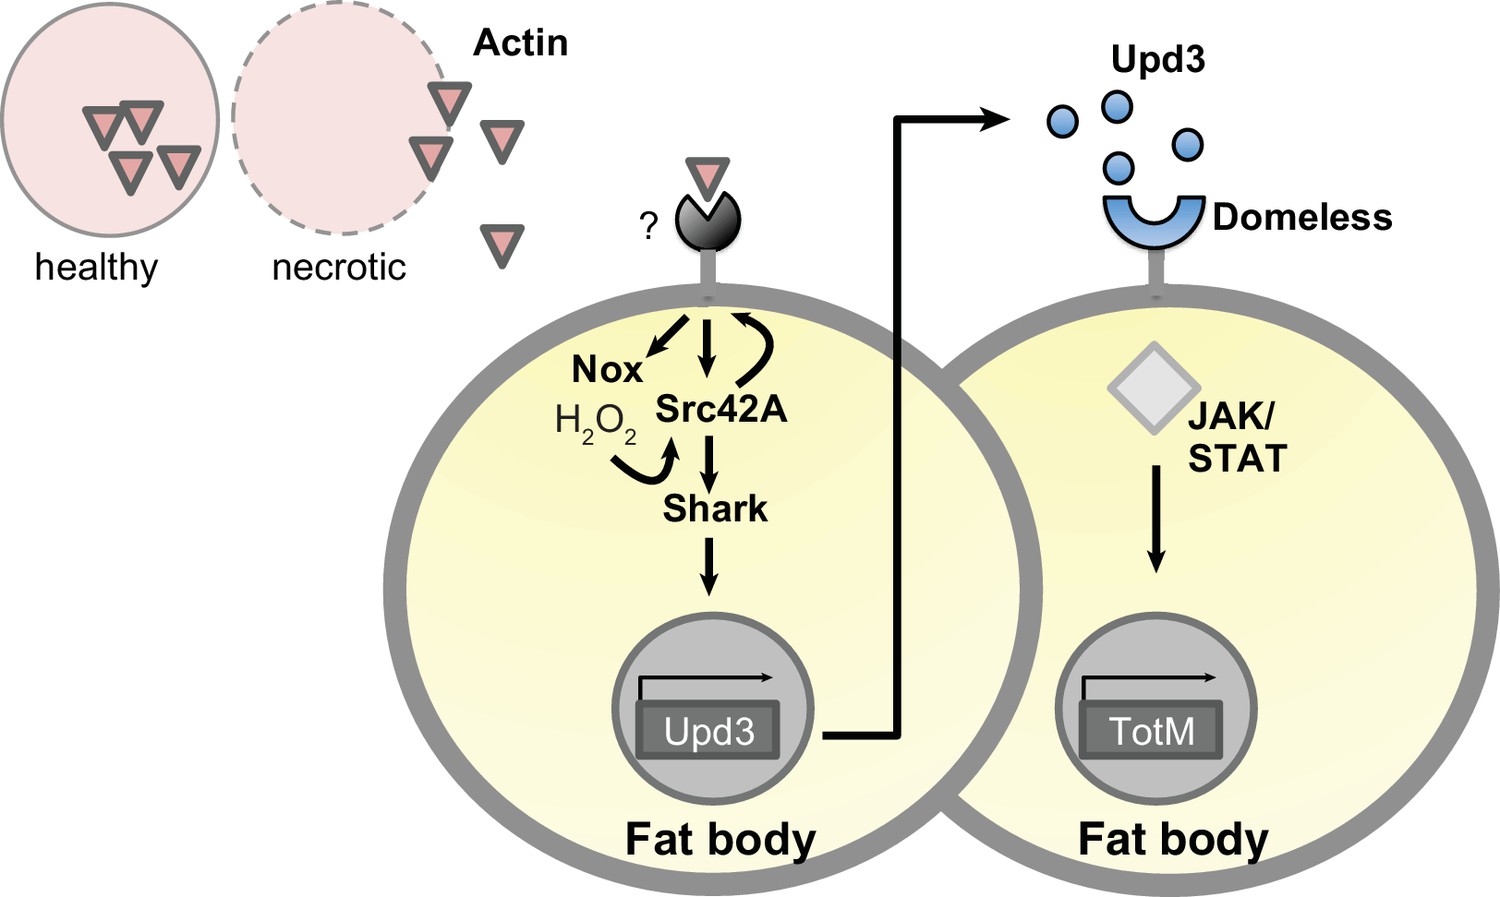
Model for extracellular actin-induced JAK/STAT pathway activation.
Cell death induces release of actin that is detected by an unknown sensor, which then promotes ROS production by Nox in the fat body. Nox-derived ROS activate Src42A and phosphorylate either the sensor or another receptor, allowing Shark-dependent signalling. This leads to the production of Upd 3, which engages Domeless and activates STAT, leading to induction of downstream genes such as TotM. Upd three is depicted as acting in a paracrine manner for ease of visualisation but is expected to also act in an autocrine fashion. Note that this model is speculative and will require further validation, for example to formally show that Src42A is upstream of Dome.
Download links
A two-part list of links to download the article, or parts of the article, in various formats.
Downloads (link to download the article as PDF)
Open citations (links to open the citations from this article in various online reference manager services)
Cite this article (links to download the citations from this article in formats compatible with various reference manager tools)
Actin is an evolutionarily-conserved damage-associated molecular pattern that signals tissue injury in Drosophila melanogaster
eLife 5:e19662.
https://doi.org/10.7554/eLife.19662


