NMNAT1 inhibits axon degeneration via blockade of SARM1-mediated NAD+ depletion
- Washington University School of Medicine, United States
- University of Toyama, Japan
Figures
Figure 1 with 1 supplement
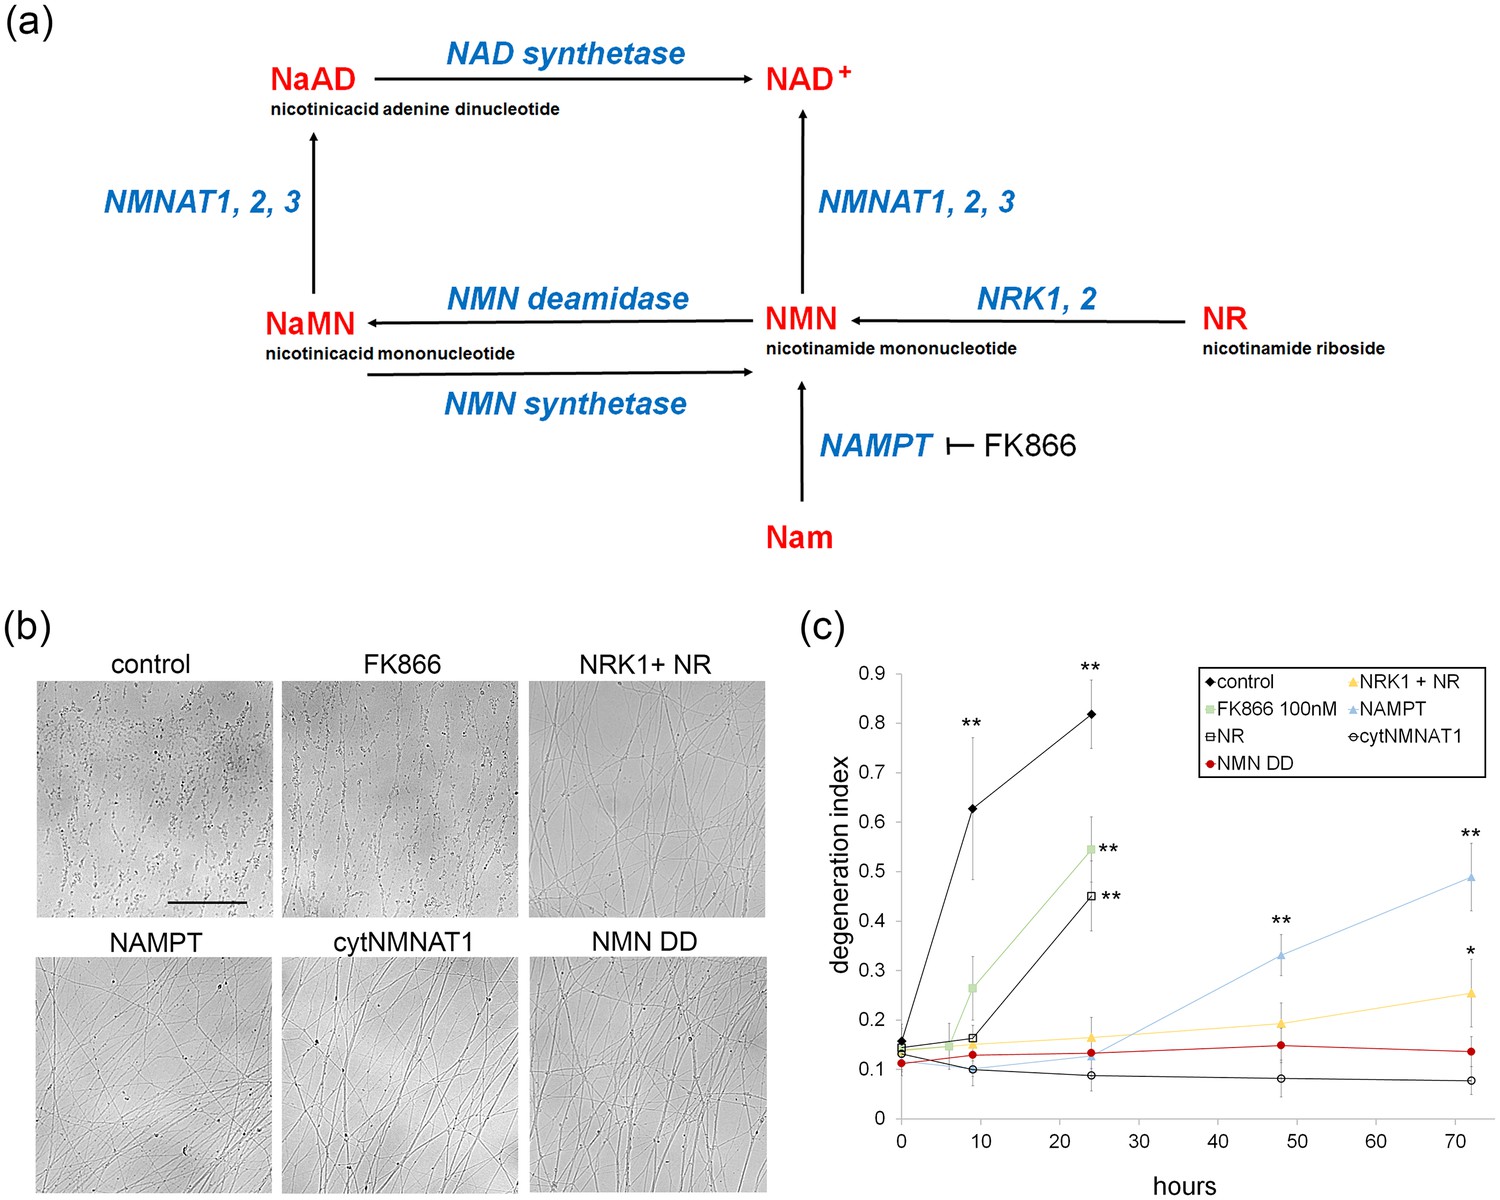
Various modes of axonal protection mediated by the manipulation of NAD+ synthesis pathways.
(a) Diagram of mammalian nicotinamide adenine dinucleotide (NAD+) biosynthesis pathways. Nicotinamide (Nam) is the major NAD+ precursor in mammals. It is converted to nicotinamide mononucleotide (NMN) by the NAMPT (nicotinamide phosphoribosyltransferase) enzyme, and then to NAD+ by the NMNAT (nicotinamide mononucleotide adenylytransferase) enzymes. There are three isoforms of NMNAT in mammalian cells; NMNAT1, 2, and 3. NMN deamidase is a bacterial enzyme that converts NMN to nicotinic acid mononucleotide (NaMN). NMN synthetase is also a bacterial enzyme that performs the reverse reaction and converts NaMN to NMN. NaMN is converted to nicotinic acid adenine dinucleotide (NaAD) by NMNAT1, 2, or 3. NaAD Is converted to NAD+ by NAD synthetase. Nicotinamide riboside (NR) is an alternative NADprecursor that is converted to NMN by NRK1 or NRK2 (nicotinamide riboside kinase enzymes). FK866 is a chemical inhibitor of NAMPT enzymatic activity. (b) Representative images of DRG axons at 24 hr after axotomy. DRG neurons were infected with lentivirus expressing mCherry protein (control), cytNMNAT1, NMN deamidase (NMN DD), NAMPT, or NRK1 at four days prior to axotomy. Nicotinamide riboside (NR, final 100 µM in the culture medium) was added to control or NRK1 expressing neurons at 24 hr prior to axotomy and FK866 (final 100 nM in the culture medium) was added at the time of axotomy. (c) Axon degeneration under various manipulations of NAD+ biosynthesis pathways was quantified using an axon degeneration index. Data show mean ± s.d., one-way ANOVA F(31,256) = 149.5, p<210–16. *p<0.005 and **p<1×10⁻⁷ denote a significant difference from control DI before axotomy with Holm-Bonferroni multiple comparison (Figure 1—source data 1, n = 9 for each time point).
-
Figure 1—source data 1
Axonal degeneration index at 0, 9, 24, 48, and 72 hr post axotomy in the presence of various NAD+ biosynthesis manipulations (Figure 1c).
- https://doi.org/10.7554/eLife.19749.003
Figure 1—figure supplement 1

Lentivirus mediated expression of NAD+ biosynthesis enzymes in axons.
Axonal localization of NAD+ biosynthesis enzymes was confirmed by Western blotting. DRG drop cultures were infected with lentivirus expressing the indicated NAD+ biosynthesis enzymes fused to the 6xHis epitope. Six days after infection, the cell bodies were removed and axonal lysates were prepared. Each enzyme or enzyme combination (NMN DD and NMN SN) was detected in the axon lysates using anti-6xHis antibody (Millipore).
Figure 2 with 2 supplements

High levels of NMN are not sufficient to induce axon degeneration.
(a) Intracellular NMN and NAD+ levels relative to control (0 hr) were quantified at 2, 4, and 6 hr after 100 nM FK866 addition using LC-MS/MS. Data show the first and third quartile (box height) and median (line in the box) ± 1.5 time interquartile (details in the method), one-way ANOVA F(3,8) = 12.9, p=0.00197 for NMN; F(3,8) = 6.541, p=0.0152 for NAD+. *p<0.05 denotes significant difference from metabolite levels at 0 hr with Holm-Bonferroni multiple comparison (Figure 2—source data 1, n=3). (b, c) Intracellular NMN and nicotinic acid mononucleotide (NaMN) levels (b), and NAD+ and nicotinic acid adenine dinucleotide (NaAD) levels (c) relative to control (for NMN, NAD+) or relative to NMN DD-expressing neurons (for NaMN, NaAD) were measured using LC-MS/MS. Data show the first and third quartile (box height) and median (line in the box) ± 1.5 time interquartile (details in the method), one-way ANOVA F(6, 35)=369.8, p<2× 10–16 for NaMN; F(6, 35) = 29.92, p=2.14×10⁻¹² for NMN; F(6, 35) = 537, p<2×10–16 for NaAD; F(6, 35) = 33.69, p=3.83× 10⁻¹³ for NAD. *p<0.05, **p<1×10⁻⁴ denote a significant difference from control metabolite levels with Holm-Bonferroni multiple comparison (Figure 2—source data 1, n = 6). (d, e) Axonal NAD+ (d) and NMN (e) were quantified at 0, 1, 2, 3, and 6 hr post axotomy using LC-MS/MS. Axonal metabolites were collected from transected axons at the indicated time after axotomy. Data show the first and third quartile (box height) and median (line in the box) ± 1.5 time interquartile (details in the method), one-way ANOVA F(4,10) = 193.6, p=2×10⁻⁹ for control NAD+; F(4,10) = 6.682, p=6.694×10⁻³ for control NMN; F(4,10) = 28.87, p=1.87×10⁻⁵ for NRK1 NR, NAD+; F(4,10) = 24.49, p=3.78×10⁻⁵, for NRK1+ NR NMN. There are no significant metabolite changes after axotomy for NAMPT, cytNMNAT1, or NMN DD expressing cells (F(4, 10) = 1.066, p=0.422 for NAMPT NAD+, F(4,10) = 0.893, p=0.503 for NAMPT NMN, F(4,10) = 0.127, p=0.969 for cytNMNAT1 NAD+, F(4,10)=0.366, p=0.828 for cytNMNAT1 NMN, F(4,10)=0.343, p=0.843 for NMN DD NAD+, F(4,10) = 0.004, p=1 for NMN DD NMN). *p<0.05, **p<1×10⁻⁴ denote significant difference from axonal metabolite levels at 0 hr post axotomy with Holm-Bonferroni multiple comparison (Figure 2—source data 1, n = 3). # p<0.05 denotes significant difference of baseline NAD+ or NMN before axotomy compared with control; One-way ANOVA with Holm-Bonferroni multiple comparison, F(4, 10) = 10.8, p=0.0012 for NAD+ and F(4,10) = 41.44, p=3.1×10⁻⁶ for NMN (Figure 2—source data 1, n = 3).
-
Figure 2—source data 1
Steady state cellular NMN, NaMN, NAD+, and NaAD levels in the absence or presence of various NAD+ biosynthesis manipulations (Figure 2a (control or FK866) and Figure 2b,c (control or various NAD+ enzyme expressing neurons)).
- https://doi.org/10.7554/eLife.19749.006
-
Figure 2—source data 2
Steady state NMN, NaMN, NAD+, and NaAD levels in wild-type or SARM1 KO DRG neurons (Figure 2—figure supplement 1).
- https://doi.org/10.7554/eLife.19749.007
-
Figure 2—source data 3
Steady state axonal total adenylate levels (ATP + ADP + AMP) and NMN normalized by total adenylate levels at 0, 1, 2, 3, 6 hr post axotomy (Figure 2—figure supplement 2).
- https://doi.org/10.7554/eLife.19749.008
Figure 2—figure supplement 1
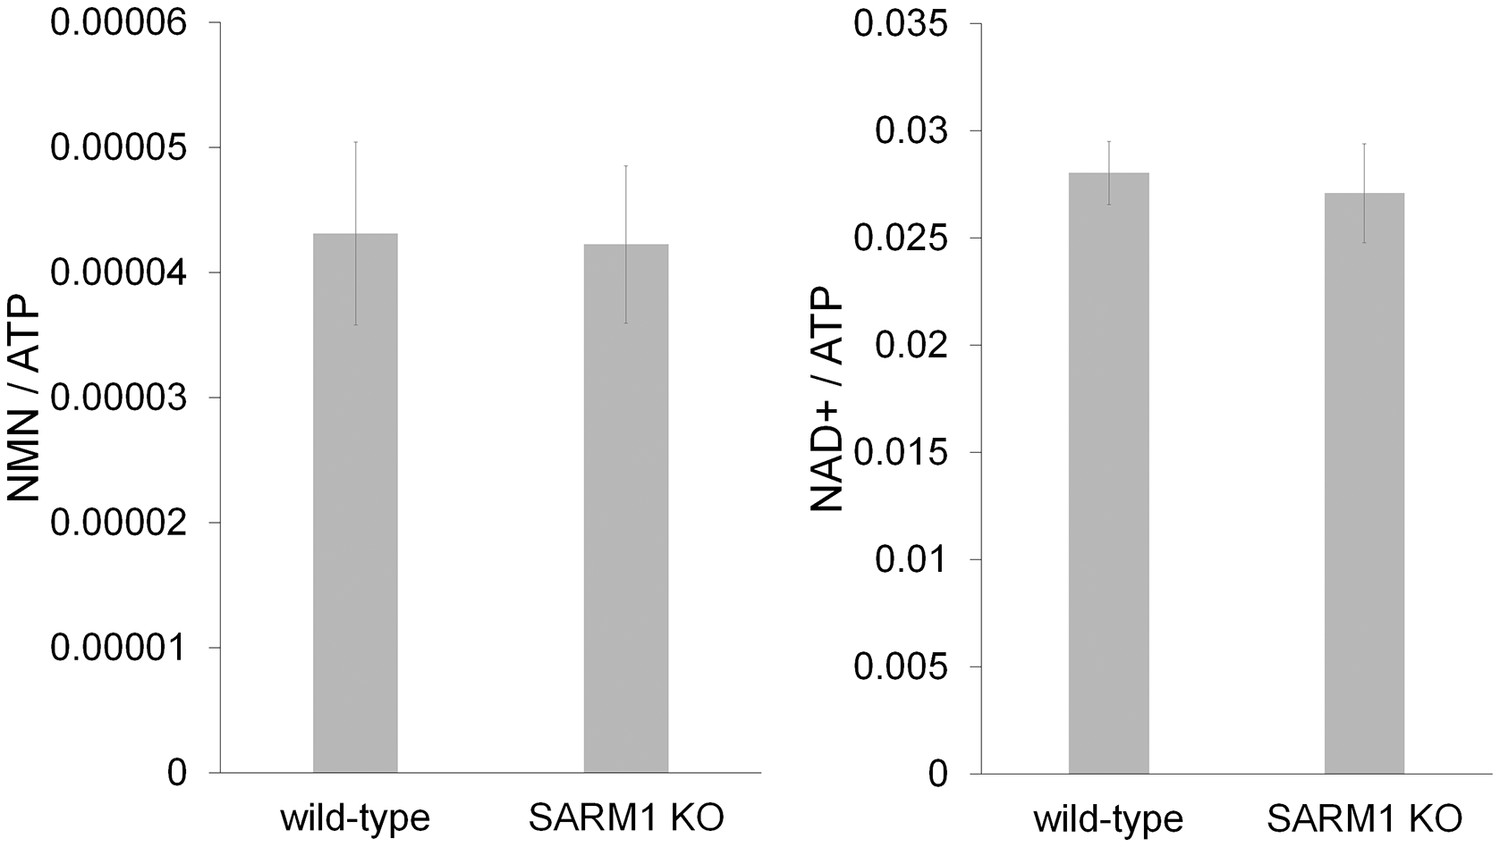
SARM1 KO neurons has normal NAD+ related metabolites.
NAD+ and its precursor metabolite levels in wild-type and SARM1 KO neurons. Metabolites were extracted from DRG neurons cultured for six days and NaMN, NMN, NaAD, NAD+ and ATP were measured using LC-MSMS. NMN and NAD+ levels were normalized using ATP concentration. There were no significant differences in NMN (p=0.11) or NAD+(p=0.21) between wild-type and SARM1 KO neurons (Student t-test). NaMN and NaAD were undetectable in these neurons using this protocol. Data shown is the mean ± s.d. (Figure 2—source data 2, n = 6).
Figure 2—figure supplement 2
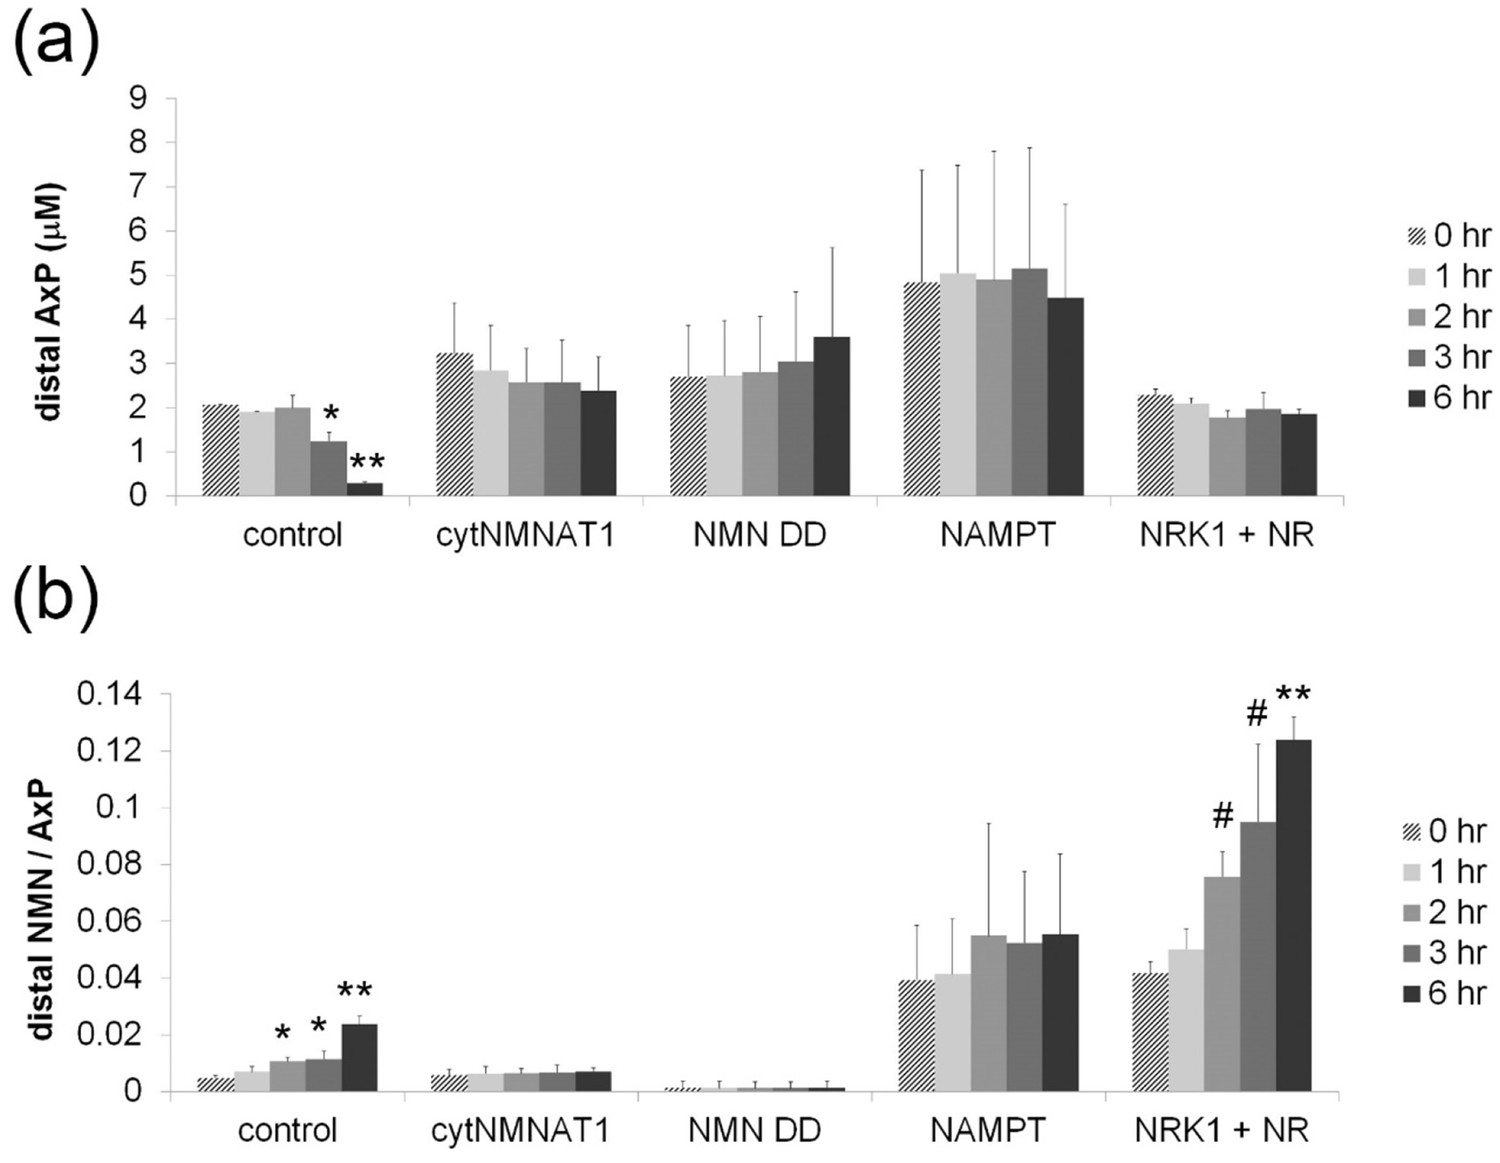
Axonal NMN and adenylate pool after axotomy.
Axonal adenylate pool (ATP + ADP + AMP) (a) and axonal NMN normalized by adenylate pool (b) at 0, 1, 2, 3, and 6 hr post axotomy are shown. DRG neurons were infected with lentivirus expressing mCherry protein (control), cytNMNAT1, NMN deamidase (NMN DD), NAMPT, or NRK1 at 4 days prior to axotomy. NR (100 µM) was added to NRK1-expressing cells at 24 hr prior to axotomy. Axonal metabolites were collected from transected axons at the indicated time after axotomy and measured by LC-MS/MS. Data show mean ± s.d., one-way ANOVA F(4,10) = 63.77, p=4.44×10⁻⁷ for control AxP; F(4,10) = 40.6, p=3.75×10⁻⁶ for control NMN/AxP; F(4,10) = 43.71, p= 2.65×10⁻⁶ for NRK1 + NR, NMN/AxP. * p<0.05, # p<0.005, **p<1×10⁻⁵ denote significant difference from axonal metabolite levels at 0 hr post axotomy (Figure 2—source data 3, n = 3).
Figure 3
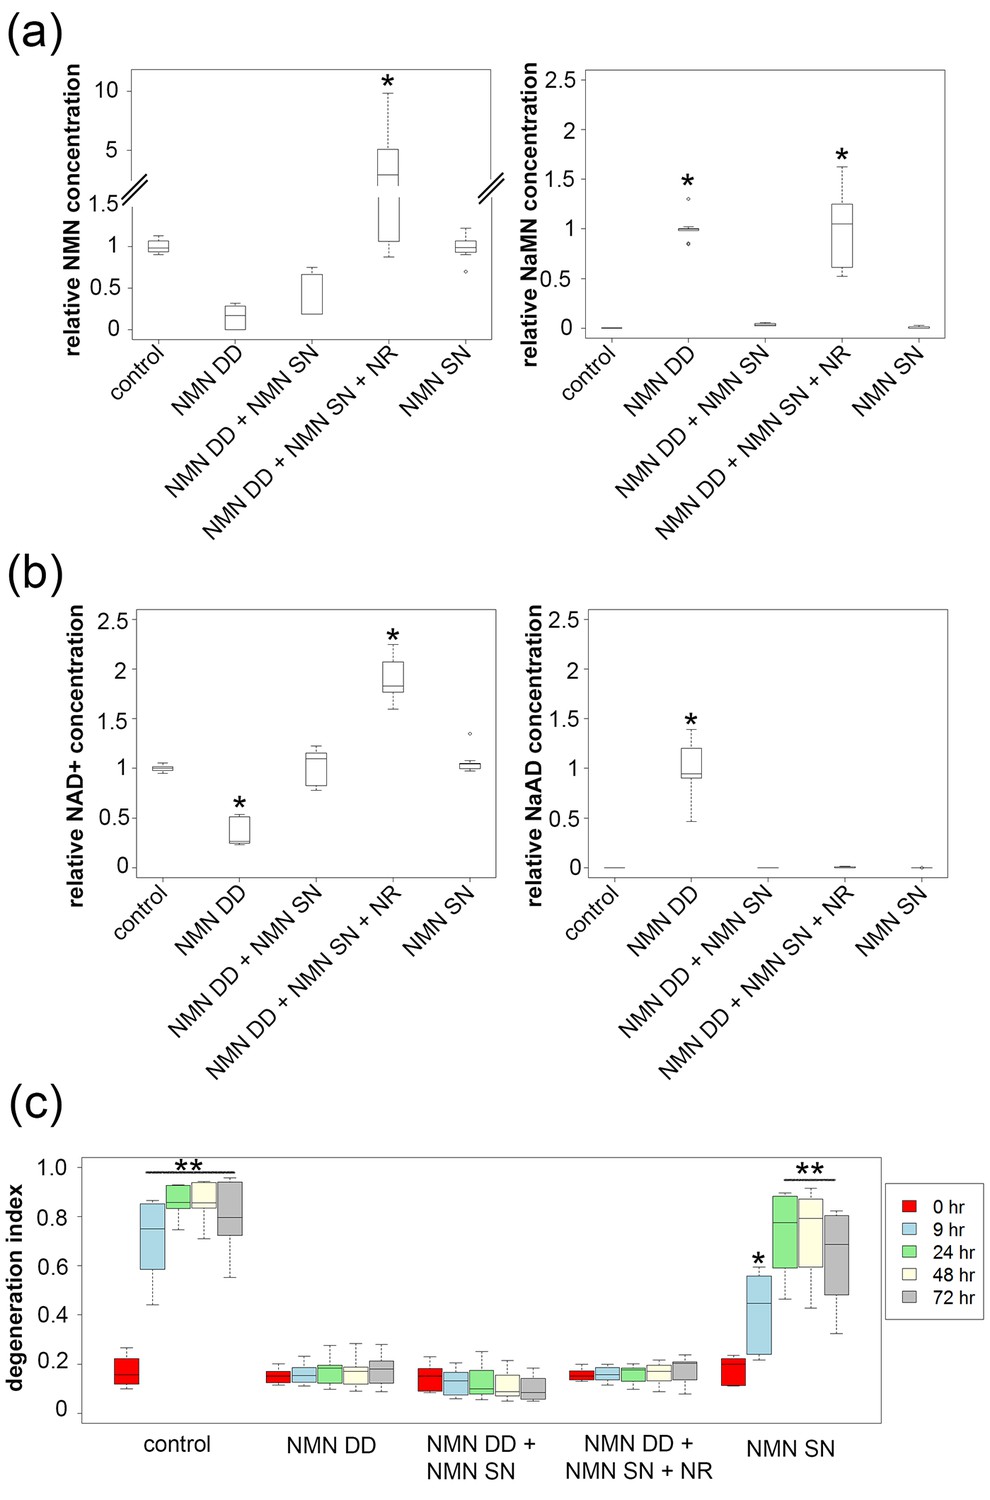
NMN deamidase does not protect axons by reducing NMN levels or by elevating NaMN or NaAD.
(a, b) Metabolites were analyzed from control or NMN deamidase (NMN DD)-expressing neurons. Nicotinic acid mononucleotide (NaMN) and nicotinic acid adenine dinucleotide (NaAD) levels were normalized to those present in NMN DD-expressing neurons. NMN and NAD+ levels were normalized to that of control neurons. Nicotinamide riboside (NR, 5 mM) was added at 24 hr prior to metabolite measurements. Data show the first and third quartile (box height) and median (line in the box) ± 1.5 time interquartile (details in the method), one-way ANOVA (NaMN, F(4, 40) = 71.8, p<2×10–16; NMN, F(4, 40) = 72.69, p=1.64×10⁻⁹; NaAD, F(4,40) = 101.3, p < 2×10–16; NAD+, F (4,40) = 121.4, p < 2 x 10–16). *p <1 × 10⁻¹⁰ denotes significant difference from control (for NMN and NAD+) or NMN DD-expressing (for NaMN or NaAD) metabolite levels with Holm- Bonferroni multiple comparison (Figure 3—source data 1, n = 9). (c) Axon degeneration index (DI) of NMN DD and/or NMN synthetase (NMN SN)-expressing neurons from 0 to 72 hr post axotomy; data show the first and third quartile (box height) and median (line in the box) ± 1.5 time interquartile (details in the method). One-way ANOVA (F(24, 200) = 75.06, p<2 × 10–16. *p<0.002, **p<2 × 10–16denote significant difference from control DI before axotomy (Figure 3—source data 1, n = 9).
-
Figure 3—source data 1
Steady state cellular NMN, NaMN, NAD+, NaAD levels in control and NMN deamidase expressing neurons with or without NMN synthetase or NMN synthetase + NR (Figure 3a,b).
Axonal degeneration index at 0, 9, 24, 48, 72 hr post axotomy of control and NMN deamidase expressing neurons with or without NMN synthetase or NMN synthetase + NR (Figure 3c).
- https://doi.org/10.7554/eLife.19749.012
Figure 4 with 4 supplements
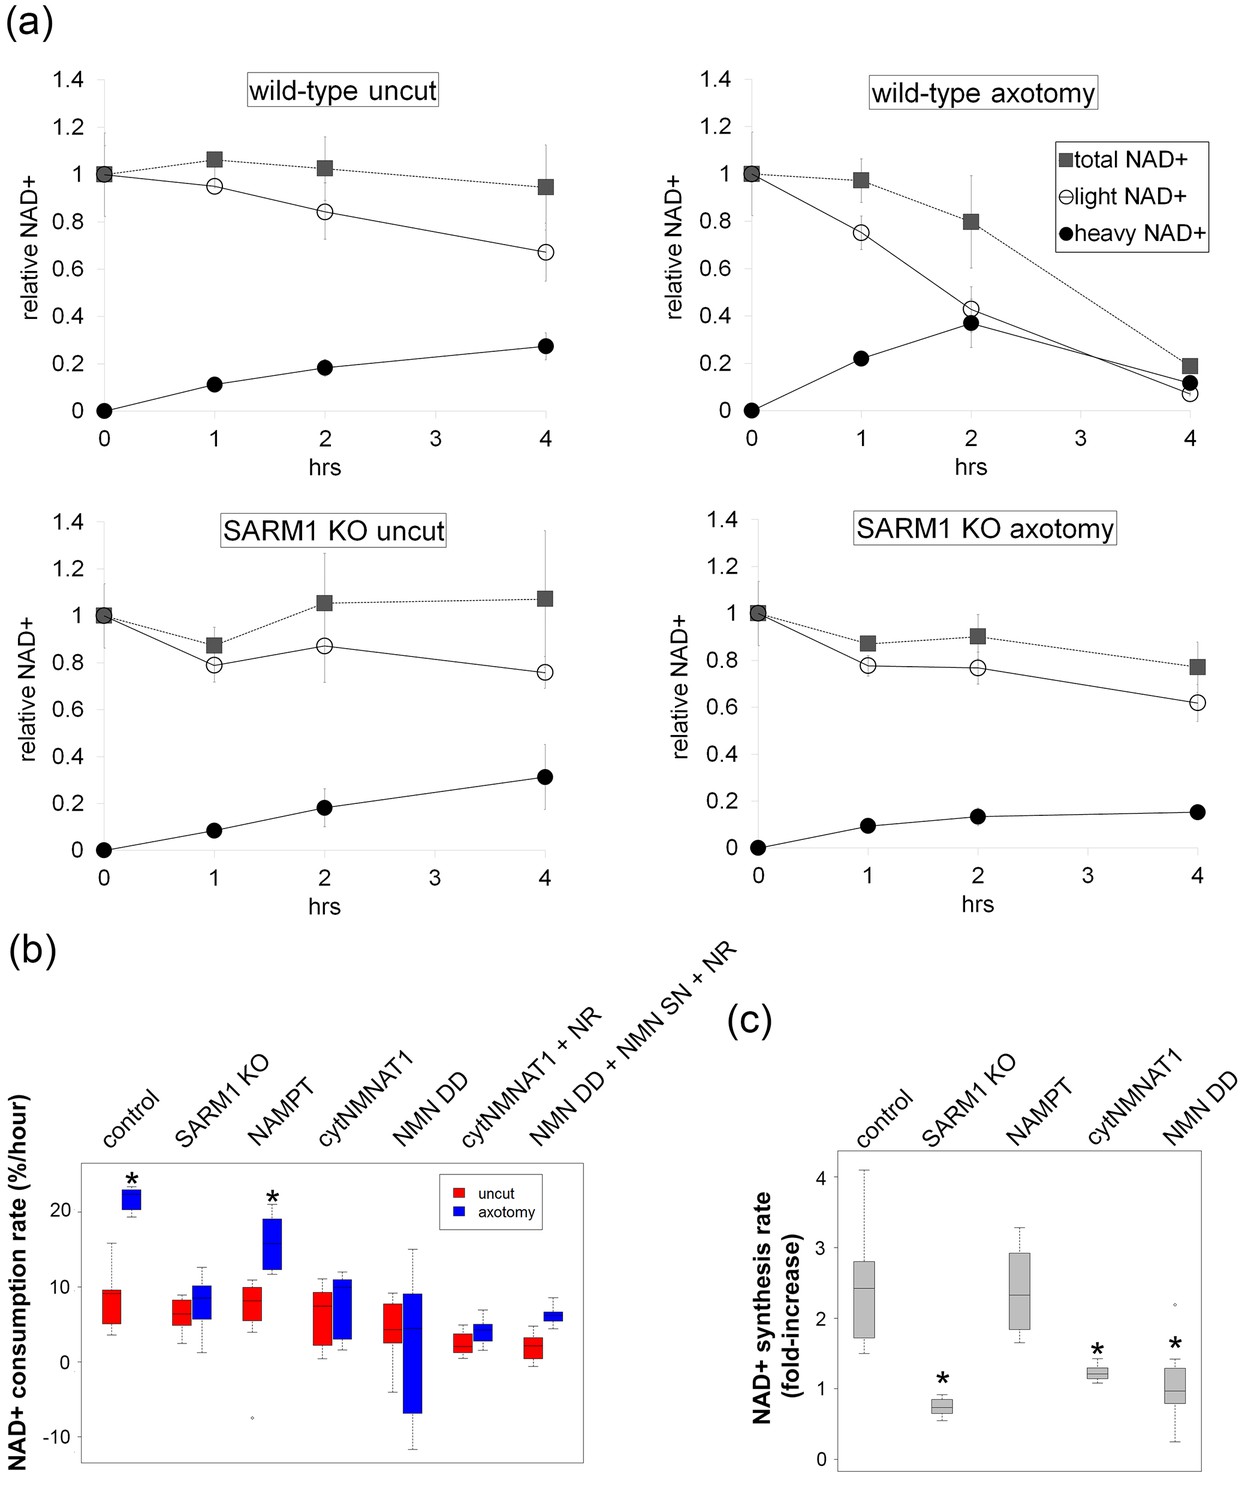
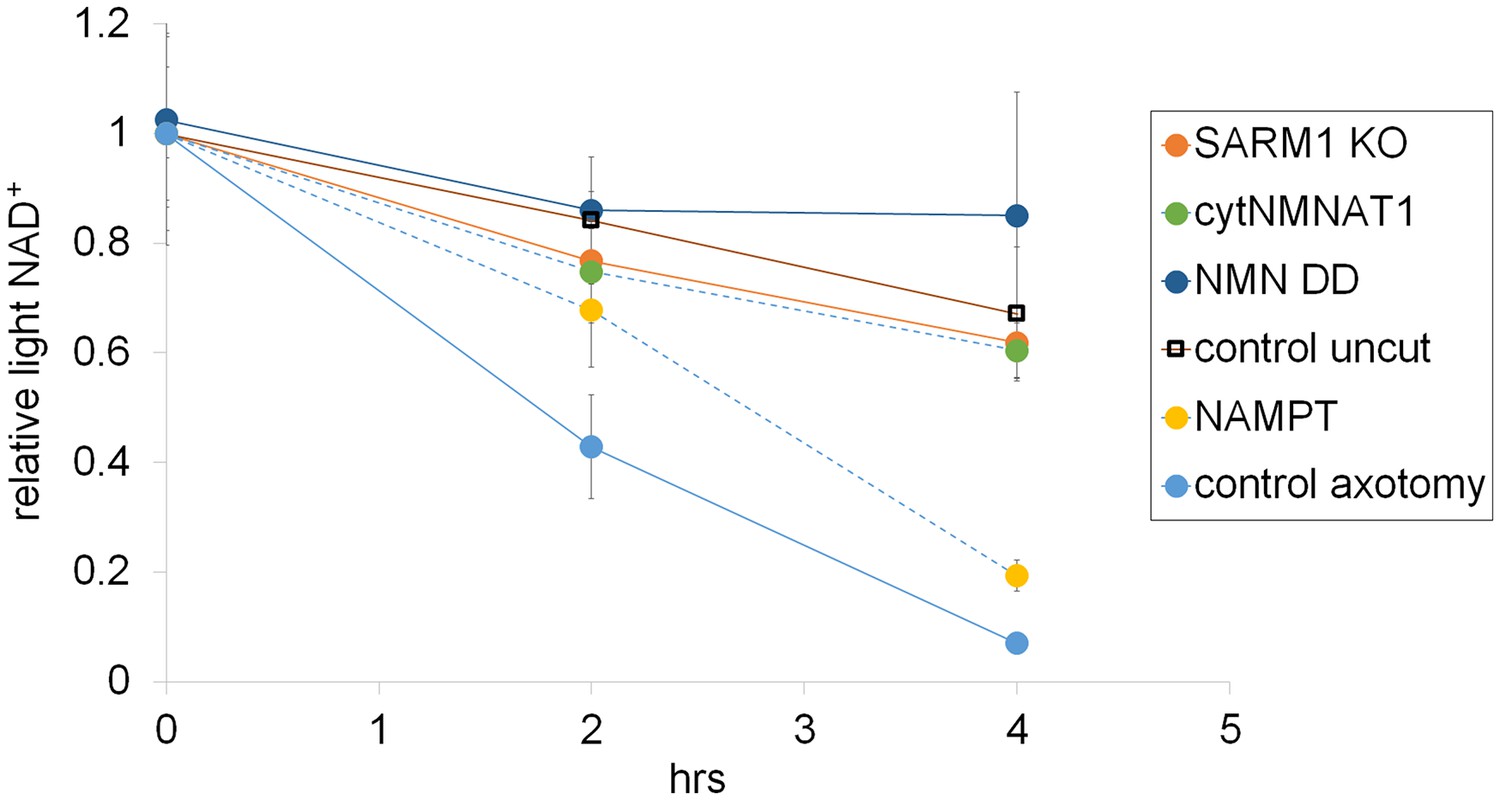
SARM1-dependent injury-induced NAD+ consumption in the axon is the critical determinant of axon degeneration.
(a) Axonal NAD+ consumption and synthesis rates were measured by using stable isotope Nam (D4-Nam; 2,4,5,6-deutrium Nam). Culture medium was supplemented with 300 µM of D4-Nam at time 0 and then deuterium-labeled (heavy) NAD+ (to follow synthesis) and non-labeled (light) NAD+ (to follow consumption) were measured from axonal metabolites using LC-MS/MS. Representative graphs of NAD+ synthesis and consumption before and after axotomy in wt and SARM1 KO are shown (mean ± s.d., n=3 for each data point). (b) Quantification of axonal NAD+ consumption rate under various manipulations of NAD+ biosynthesis pathways before and 4 hr after axotomy (NR concentration was 1 mM for cytNMNAT1 and 5 mM for NMN DD NMN SN expressing cells); data show the first and third quartile (box height) and median (line in the box) ± 1.5 time interquartile (details in the method), one-way ANOVA F(13,118) = 17.19 p<2 × 10–16. *p<0.005 denotes significant difference from the NAD+ consumption rate of control before axotomy with Holm-Bonferroni multiple comparison (Figure 4—source data 1, n=9 except NAMPT where n = 12). (c) Fold increase of axonal NAD+ synthesis at 2 hr after axotomy compared with the uncut control under various manipulations of the NAD+ biosynthesis pathway. The NAD+ synthesis rate was normalized to that of corresponding uncut axons; data show the first and third quartile (box height) and median (line in the box) ± 1.5 time interquartile (details in the method), one-way ANOVA F(4, 43) = 21.41, p=9 × 10⁻¹⁰. *p<4 × 10⁻⁵ denotes a significant difference form fold increase of NAD+ synthesis in control with Holm-Bonferroni multiple comparison (Figure 4—source data 1, n=9 except for control where n = 12).
-
Figure 4—source data 1
Relative axonal NAD+ consumption (Figure 4b) and synthesis (Figure 4c) rates in axons expressing various NAD+ biosynthesis enzymes with or without NR at 0, 4 hr (consumption), or 2 hr (synthesis) after axotomy.
- https://doi.org/10.7554/eLife.19749.014
-
Figure 4—source data 2
Axonal degeneration index at 0, 9 and 24 hr post axotomy in the presence or absence of 1 mM Nicotinamide (Figure 4—figure supplement 1).
- https://doi.org/10.7554/eLife.19749.015
-
Figure 4—source data 3
Absolute Axonal NAD+ consumption rates in axons expressing various NAD+ biosynthesis enzymes (Figure 4—figure supplement 3).
- https://doi.org/10.7554/eLife.19749.016
Figure 4—figure supplement 1
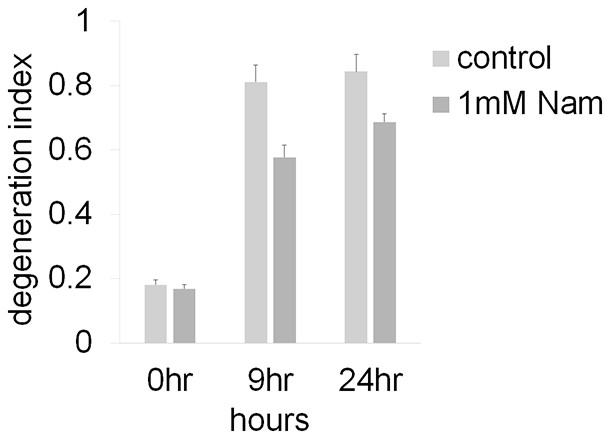
Axonal degeneration profiles after axotomy were not altered by the addition of 1 mM Nam to the culture medium at the time of axotomy (Figure 4—source data 2, n=4).
Both control and 1 mM Nam treated axons degenerate (DI > 0.3) in 9 hr.
Figure 4—figure supplement 2
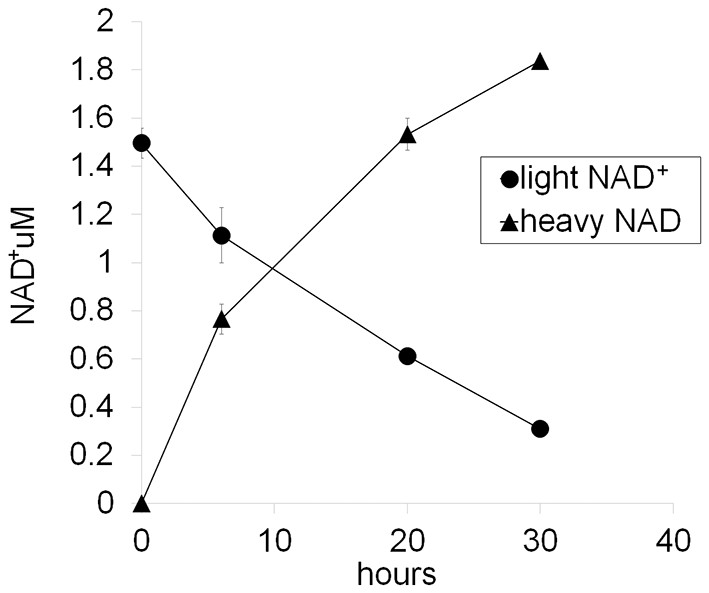
Representative NAD+ consumption and synthesis in DRG neurons.
D4-Nam (300 µM) is added to the DRG culture medium at 0 hr and then whole cell metabolites are extracted at the indicated time and light NAD+ and heavy NAD+ are quantified using LC-MS/MS. Net NAD+ consumption and synthesis are measured as a decrease of light NAD and an increase of heavy NAD+, respectively. Note that total NAD+ is increased about 20% at 30 hr after the addition of D4-Nam (mean ± s.d., n=3 for each data point).
Figure 4—figure supplement 3
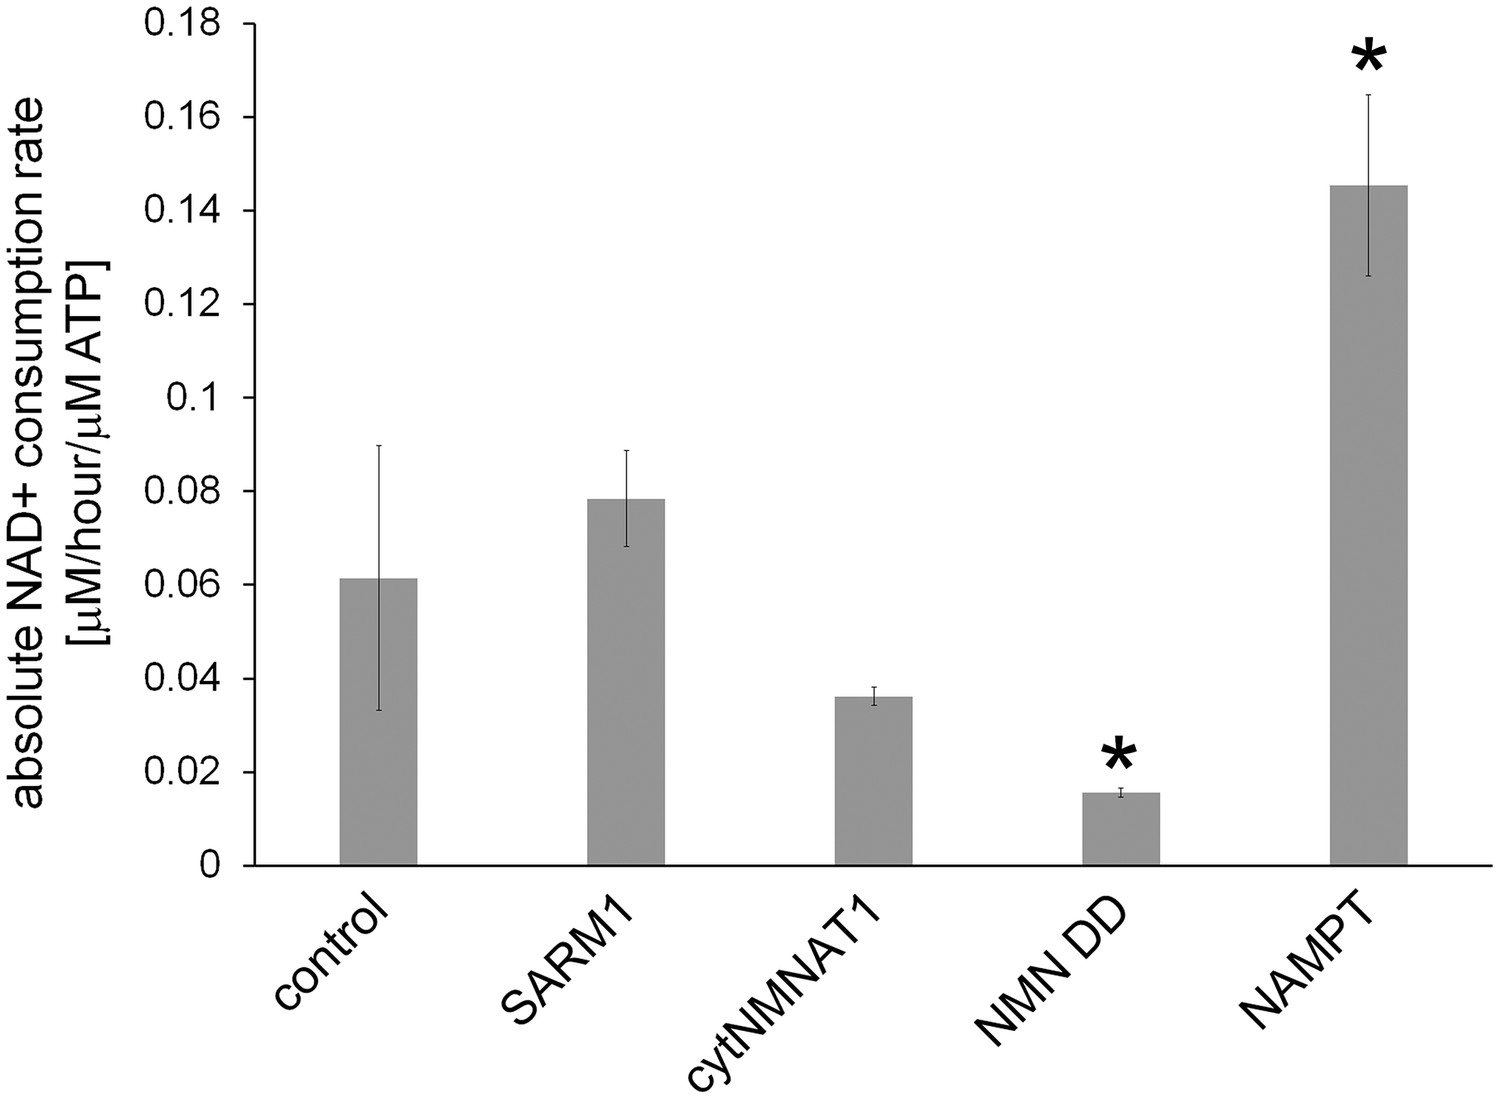
Absolute axonal NAD+ consumption rates in neurons expressing various NAD+ biosynthesis enzymes or in control neurons.
D4-Nam was added for 4 hr and axonal metabolites were extracted. ATP level and light and heavy NAD+ levels were measured using LC-MSMS. NAD+concentrations were normalized to ATP, which is stable in uninjured axons, and NAD+ consumption rates were calculated as described in the methods. Data show the mean ± s.d., one-way ANOVA F(4, 10) = 28.99, p=1.77 10–5. * p < 0.03 denotes significant difference from the control NAD+ consumption rate with Holm-Bonferroni multiple comparison (Figure 4—source data 3, n=3).
Figure 4—figure supplement 4
Representative axonal NAD+ consumption under various manipulations of NAD+ biosynthesis pathways are shown (mean ± s.d., n=3 for each data point).
https://doi.org/10.7554/eLife.19749.020
Figure 5
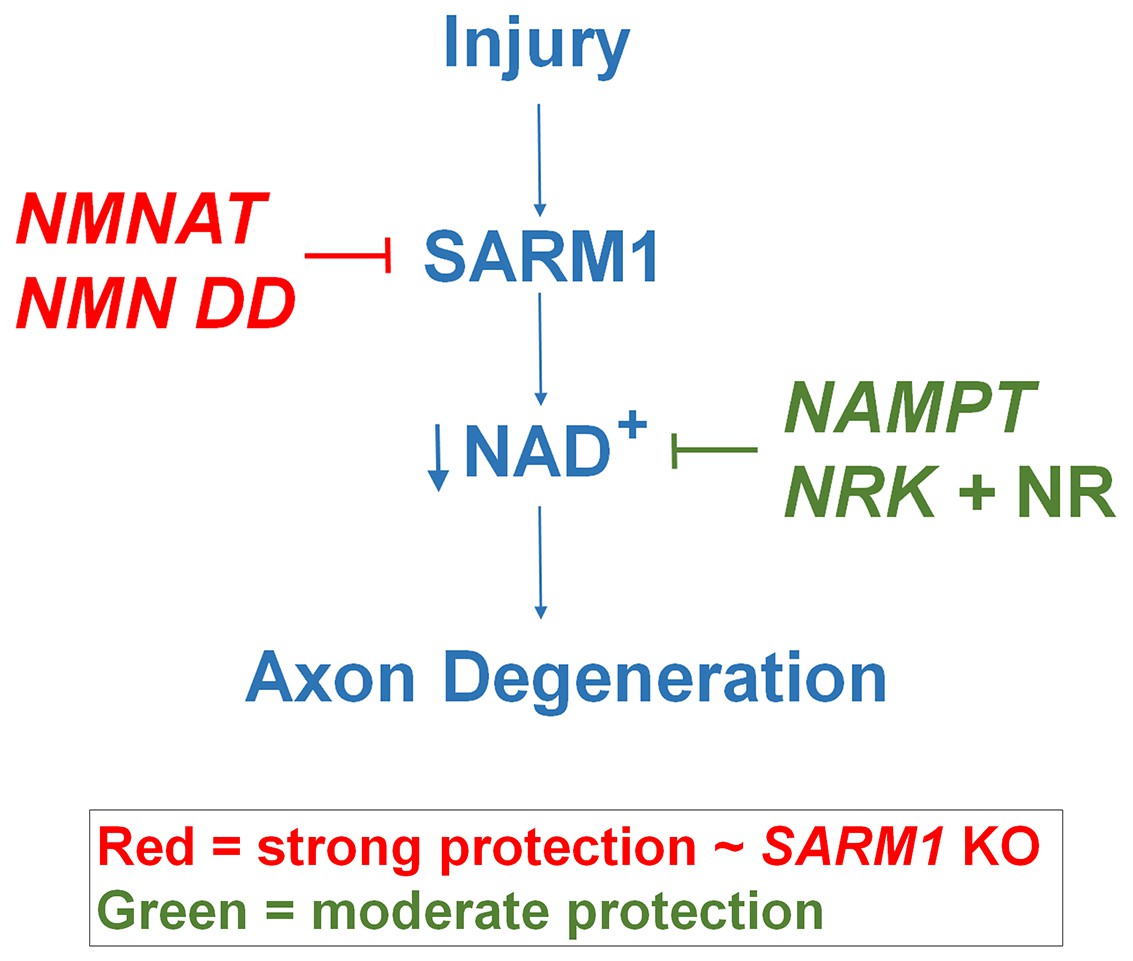
Schematic representation of molecular mechanism of axon degeneration.
Axonal injury activates SARM1 that then results in an increase in NAD+ consumption that is soon followed by axon fragmentation (blue). NMNAT enzymes and NMN deamidase inhibit SARM1 induction of NAD+ consumption and provide strong axonal protection that is indistinguishable from SARM1-deficient axons (red). NAMPT or NRK + NR raise intracellular NAD+ in pre-injured axons thus delaying the point where NAD+ levels reach a critical threshold and axonal degeneration ensues (green). The axonal protection mediated by NAMPT or NRK + NR is not as long-lasting as that mediated by NMNAT enzymes or NMN deamidase.
Tables
Table 1
Mass spectroscopy parameters for metabolites measured.
| Metabolite | MS1/MS2 | Fragmentation (V) | Collision energy (V) | Cell AC (V) |
|---|---|---|---|---|
| NAD+ | 664>428 | 160 | 22 | 7 |
| D4-NAD+ | 668>428 | 160 | 22 | 7 |
| D3-NAD+ | 667>428 | 160 | 22 | 7 |
| NaAD | 669>428 | 150 | 20 | 7 |
| NMN | 335>123 | 90 | 11 | 1 |
| NaMN | 336>124 | 80 | 10 | 7 |
| ATP | 508>136 | 90 | 30 | 2 |
| ADP | 428>136 | 50 | 30 | 3 |
| AMP | 348>136 | 30 | 30 | 7 |
Download links
A two-part list of links to download the article, or parts of the article, in various formats.
Downloads (link to download the article as PDF)
Open citations (links to open the citations from this article in various online reference manager services)
Cite this article (links to download the citations from this article in formats compatible with various reference manager tools)
NMNAT1 inhibits axon degeneration via blockade of SARM1-mediated NAD+ depletion
eLife 5:e19749.
https://doi.org/10.7554/eLife.19749


