Live imaging reveals the progenitors and cell dynamics of limb regeneration
- Institut de Génomique Fonctionnelle de Lyon (IGFL), École Normale Supérieure de Lyon, France
- Centre National de la Recherche Scientifique (CNRS), France
Figures
Figure 1
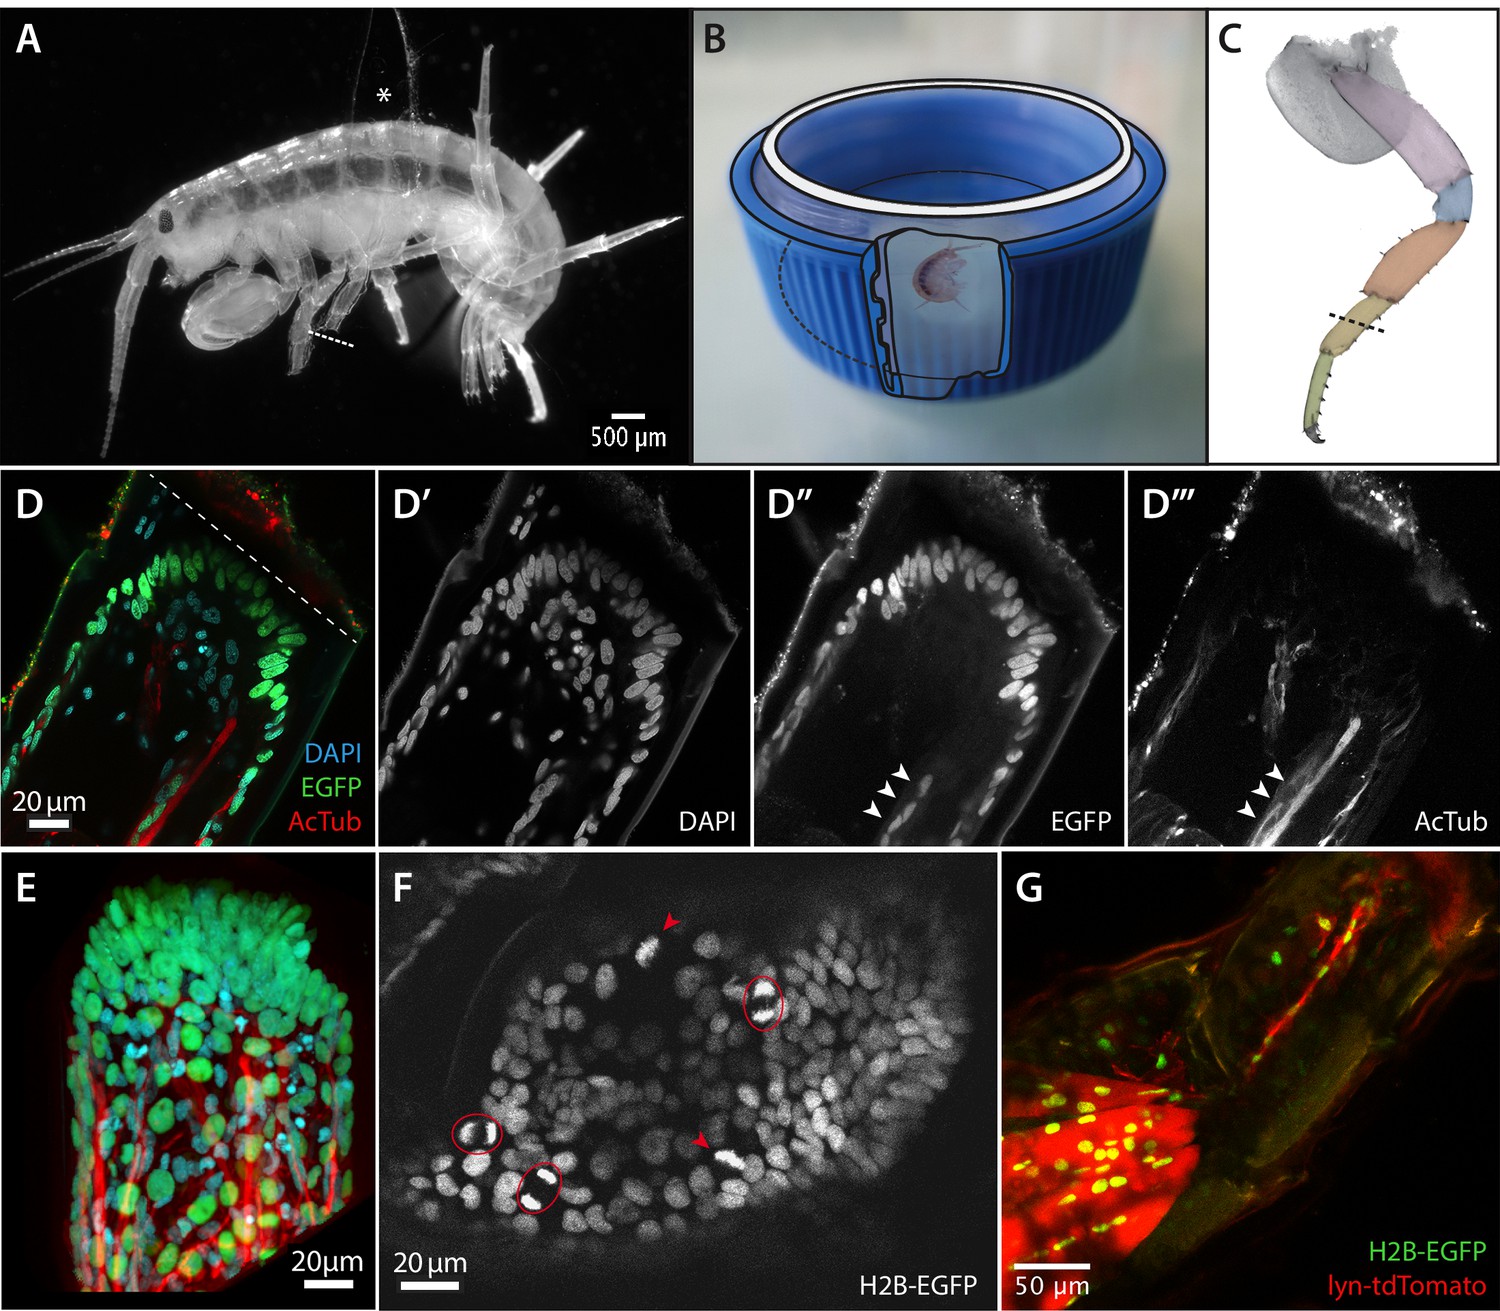
Imaging leg regeneration in Parhyale hawaiensis.
(A) Amputated Parhyale adult mounted for imaging. The body of the animal is glued onto a coverslip, using a small piece of broken coverslip as a spacer (asterisk). The immobilized leg was amputated as marked with the dashed line. (B) Mounting of the coverslip carrying live Parhyale in a chamber for live imaging (see Materials and methods). (C) Outline of Parhyale thoracic leg (T4 or T5); individual podomeres are highlighted and the position of amputations marked with a dashed line. (D–D’’’) Cellular organization at the distal part of the amputated leg stump. Leg of a mosaic individual expressing H2B-EGFP specifically in the ectoderm (Konstantinides and Averof, 2014); fixed 63 hr post amputation and stained with antibodies for EGFP and acetylated tubulin to reveal ectodermal nuclei and neurons, respectively, and DAPI to label all nuclei. (E) 3-dimensional reconstruction of the same leg stump. (F) Single frame from live recording #04, showing histone-EGFP-labelled nuclei on the leg stump, 52 hr post amputation. Arrowheads and circles mark dividing cells in metaphase and telophase, respectively. (G) Leg stump of a mosaic individual expressing lyn-tdTomato and H2B-EGFP specifically in the mesoderm, 20 hr post amputation. Muscles persist in the proximal part of the leg stump but degenerate in the distal part (top right). The distal part of the leg stump contains a thin strand of interconnected mesodermal cells.
Figure 2
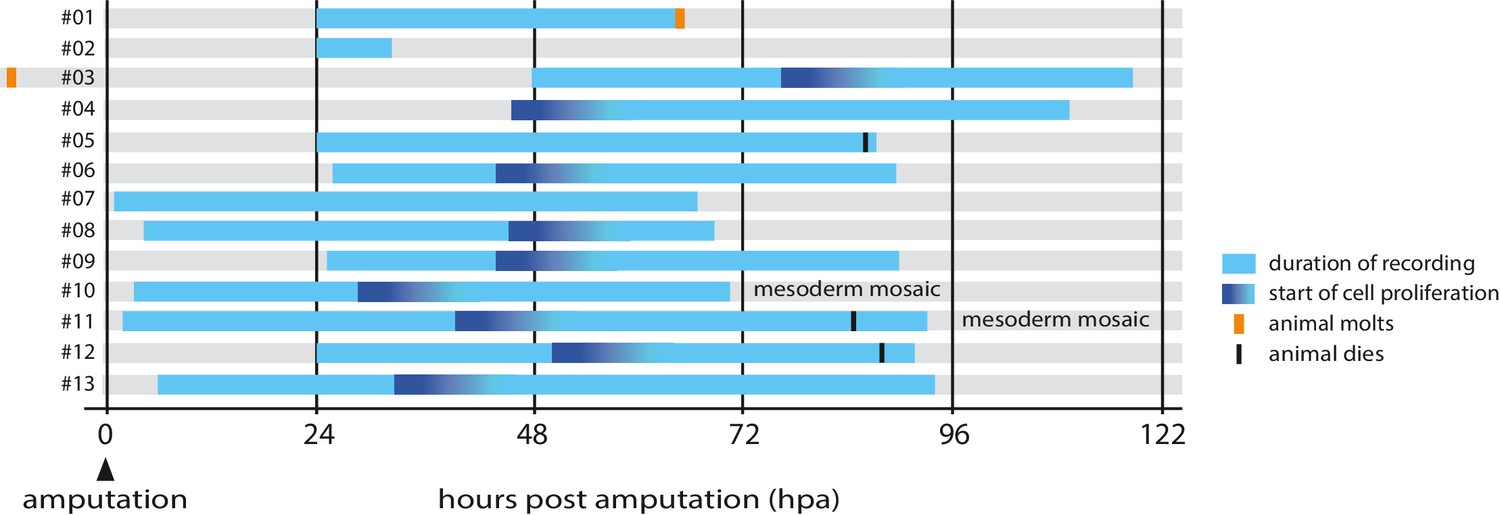
Overview of timelapse recordings captured by confocal microscopy.
For each recording (numbered #1 to #13) we indicate the time period covered relative to the time of amputation (hpa, hours post amputation), the onset of cell proliferation, molting events and survival. Further details on each recording are given in Table 1.
Figure 3

Phases of Parhyale leg regeneration.
Three phases of regeneration are defined based on distinct cellular events and behaviours observed by live imaging (see text). Immediately after amputation, haemocytes adhere to the wound surface and close the wound (phase 1). In the hours that follow, a melanized scab (shown in brown) forms at the site of the wound, surrounding the haemocytes (early phase 2). The leg epithelium (depicted as a thin line surrounding the leg) then closes over the wound, under the surface of the melanized scab. Muscles (shown in red) at the distal part of the limb stump usually detach and degenerate, while those in proximal parts remain intact. During phase 2 we observe very limited or no cell proliferation. Phase 3 is marked by the onset of extensive cell proliferation and cell movements, leading to extensive growth and morphogenesis. This phase results in the formation of an elongated and patterned leg primordium within the amputated limb stump. Mesodermal cells, haemocytes and macrophages (shown in red), as well as nerves (in blue), are present in the inner spaces of the leg stump throughout the regenerative process.
Figure 4

Wound closure during Parhyale leg regeneration.
(A–A’’) Mosaic Parhyale expressing EGFP in haemocytes show the role of these cells in the early stages of wound closure (same individual as in Video 2). (A) EGFP-labelled haemocytes in the leg prior to amputation; the outline of the leg and the amputation plane are highlighted. (A’) In the first few minutes post amputation we observe bleeding (haemocytes marked by arrowhead) and haemocytes adhering to the wound. (A’’) 15 min post amputation the bleeding has stopped and the wound is plugged by a mass of adhering haemocytes. (B–B’’) Epithelial closure and wound melanization followed live in a transgenic animal expressing H2B-EGFP in all cells (still images from Video 3). (B) Amputated leg prior to epithelial closure and melanization; the amputation plane is marked with a dashed line. (B’) 5 hr post amputation (hpa) a new epithelial layer has formed under the wound (arrowhead); more distally, the mass of haemocytes is not yet melanized (curly bracket). (B’’) 9 hr post amputation, the distal part of the stump has been melanized; the haemocytes are embedded in the melanized scab and their fluorescence is no longer visible.
Figure 5
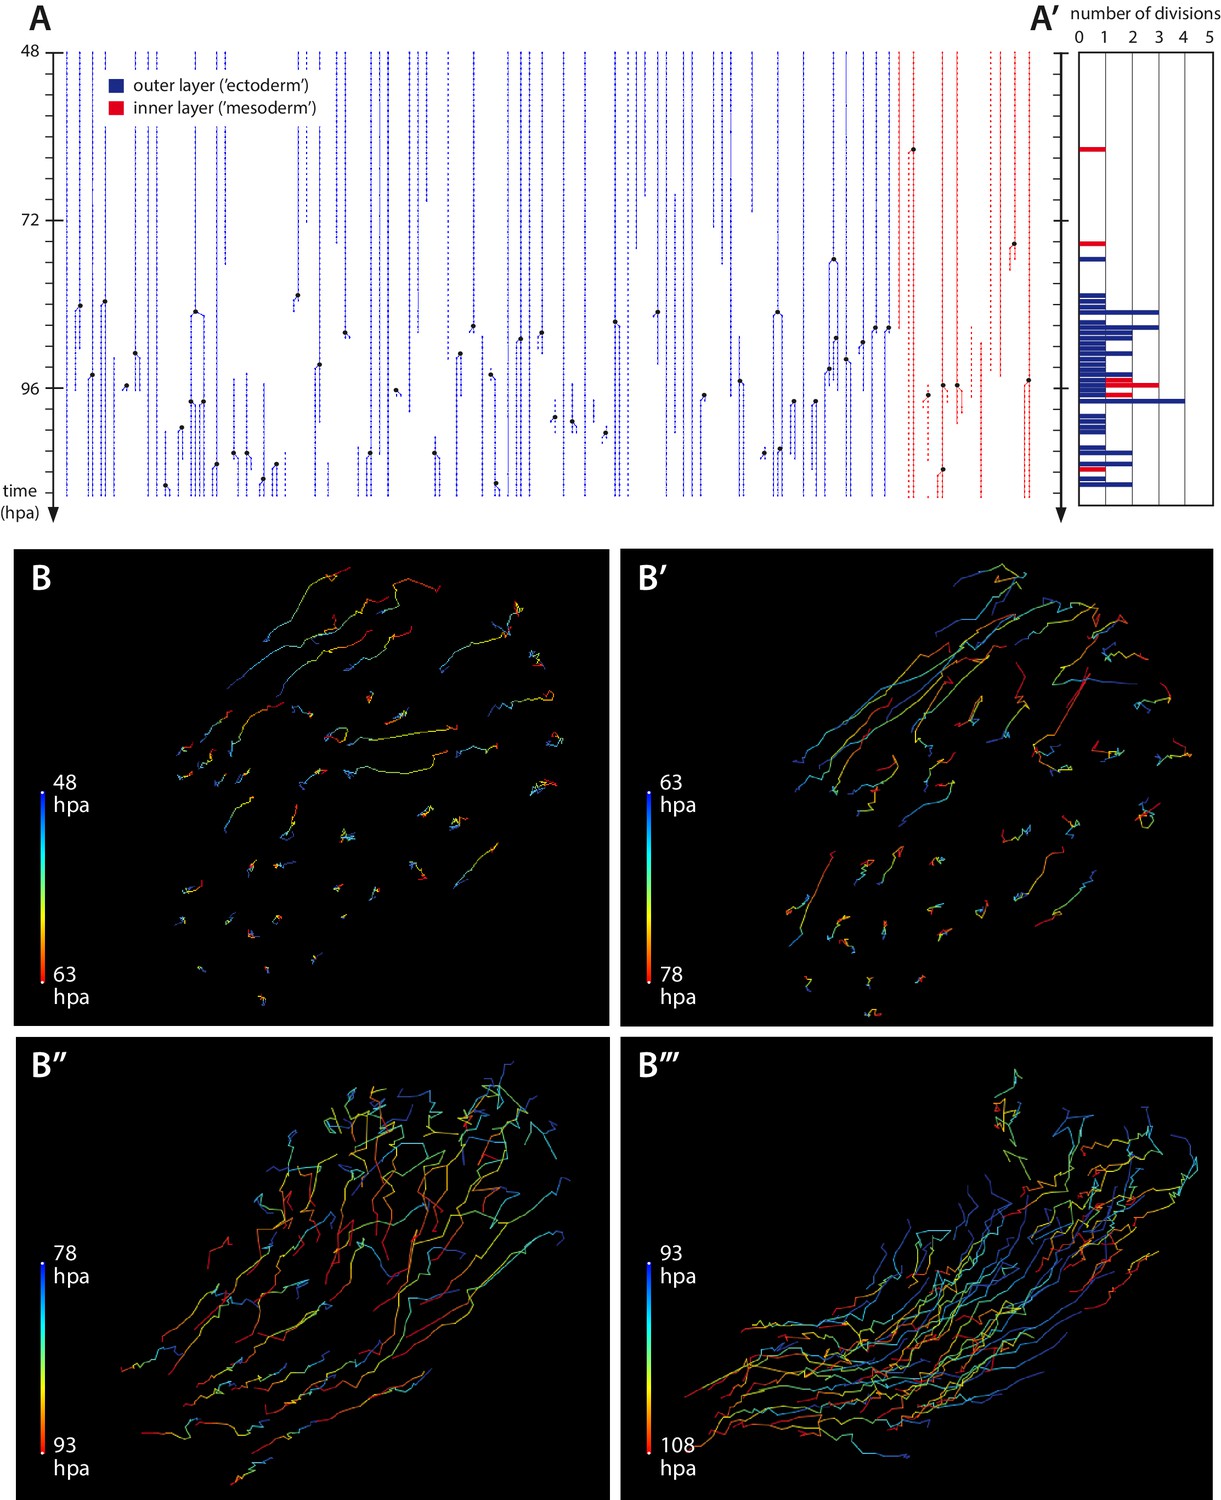
Cell proliferation and cell movements during Parhyale leg regeneration.
(A) Cell lineages at the distal leg stump, tracked 48–111 hr post amputation (hpa) in recording #03. Vertical lines depict individual cells of the outer (blue) or inner (in red) cell layers tracked at successive timepoints. Cell divisions are depicted as lineage bifurcations and marked by a black dot. Incomplete lines indicate when a cell was not tracked throughout the recording. (A’) Histogram depicting the number of cell divisions observed at each timepoint. (B–B’’’) Tracks of individual epidermal cells during successive 15-hr time intervals, from recording #03 (Video 5), depicting cell movements at the distal leg stump. The amputation plane is at the top right corner of each panel. Each cell track is colour-coded such that the position of each cell at the start and the end of the given time interval are depicted in blue and red, respectively. (B, B’) Before the onset of extensive cell proliferation (48–78 hpa) cells show limited movements towards the wound surface or no movement. (B’’–B’’’) After the start of cell proliferation (78–108 hpa) epidermal cells participate in extensive morphogenetic movements. The length of the coloured bars corresponds to 50 microns.
Figure 6
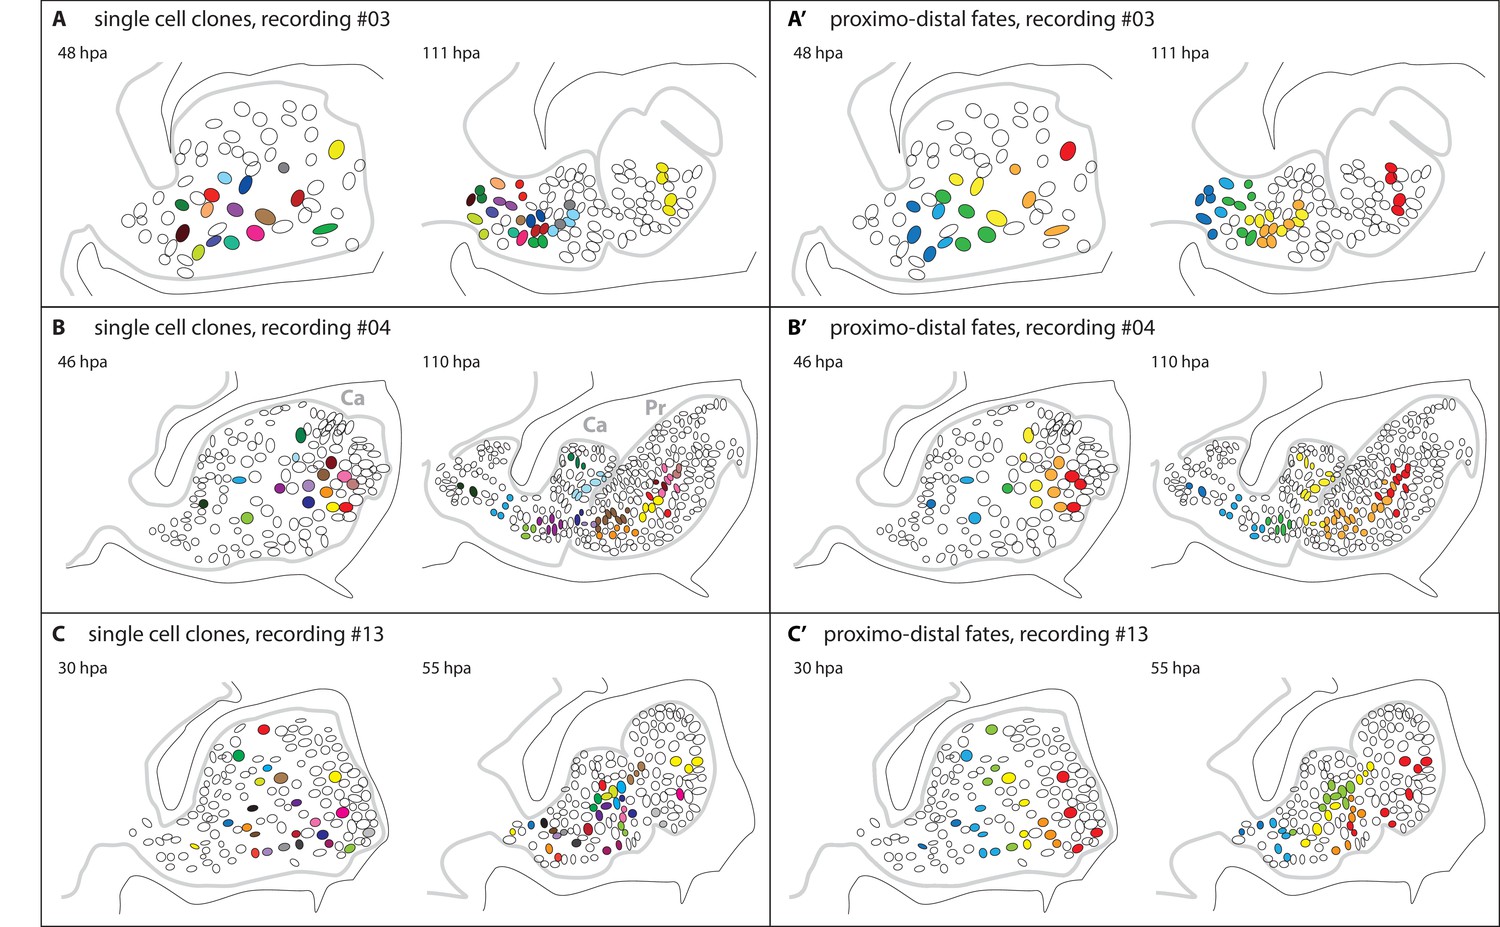
Epidermal cell clones and fate maps in regenerating leg stumps.
(A–C) Tracked cells and their clonal progeny are shown from three separate recordings, #03, #04 and #13, respectively. The illustrations depict the outline of the regenerating leg epithelium (grey line) at the start (left) and the end (right) of cell tracking. Individual nuclei and their clonal progeny are colour coded. The leg stumps are shown with their distal end to the right and ventral side down. The outline of the surrounding exoskeleton is depicted by a black line. (A’–C’) Same tracking data, colour-coded according to the proximo-distal location of each nucleus at the start of cell tracking. In panel 6B, two podomeres, the carpus (Ca) and the propodus (Pr), are labelled.
Figure 7

Morphogenesis of regenerating Parhyale legs.
(A) Orientation of cell divisions occurring during the proliferative phase in recording #04 (46–110 hr post amputation). Each point represents a cell division; divisions occurring along the direction of the proximo-distal axis of the leg are at 0˚. (B) Number of cell divisions occurring in successive 2-hr time intervals, in the same dataset (recording #04). (C) Overall shape of regenerating leg before and after elongation (from recording #04). The outer black line shows the exoskeleton of the amputated leg that constrains the regenerating leg. Arrows highlight the detachment of the epidermis from the exoskeleton and the retraction of the leg proximally. Coloured circles depict the proximal movement of four cell clones (taken from Figure 6B) in the proximal part of the blastema.
Videos
Video 1
Amputated Parhyale adult mounted for live imaging.
Video of the individual shown in Figure 1A, moving extensively while an amputated leg remains immobilised on the coverslip. The amputated limb is marked by an arrowhead in the first frame of the movie.
Video 2
Real-time imaging of amputated Parhyale leg, 5 min post amputation.
This mosaic individual has an insertion of an EGFP-expressing transgene specifically in the Mav lineage, labelling haemocytes. We can observe bleeding and adherence of haemocytes to the wound surface. This individual was anaesthetised using clove oil and imaged without our usual mounting procedure.
Video 3
Live imaging of two amputated Parhyale legs, 0 to 14 hr post amputation (hpa), using histone-EGFP to visualize all nuclei.
Histone-EGFP is expressed from the PhHS>H2B-EGFP transgene after a heat shock. We can observe melanization of the wound at the distal end of each leg stump (arrowheads).
Video 4
Live imaging of amputated Parhyale leg, 1 to 67 hr post amputation (hpa), using histone-EGFP to visualize all nuclei.
Histone-EGFP is expressed from the PhHS>H2B-EGFP transgene after heat shock. Maximum projection of focal planes capturing the surface of the leg epithelium, from recording #07. We can observe the rapid motility of some cells, probably macrophages, and the slower movement of epithelial cells towards the wound site, located at the bottom of the frame (~15–40 hpa). The video was assembled from three separate clips (0:50–3:50, 4:20–18:20 and 18:55– 66:55 hpa) captured with different settings.
Video 5
Live imaging of regenerating Parhyale leg, 48 to 111 hr post amputation (hpa), using histone-EGFP to visualize all nuclei.
Histone-EGFP is expressed from the PhHS>H2B-EGFP transgene after a heat shock. Maximum projection of green fluorescence channel, from recording #03. The amputation plane is at the top-right corner of the frame.
Video 6
Live imaging of regenerating Parhyale leg, 48 to 111 hr post amputation (hpa), using DsRed to visualize neurons.
DsRed is expressed from the DC5>DsRed transgene. Maximum projection of red fluorescence channel, from recording #03 (same recording as Video 2).
Video 7
Live imaging of regenerating Parhyale leg, 46 to 110 hr post amputation (hpa), using histone-EGFP to visualize all nuclei.
Histone-EGFP is expressed from the PhHS>H2B-EGFP transgene after a heat shock. Arrowheads highlight two apoptotic nuclei. Maximum projection of focal planes capturing the surface of the leg epithelium, from recording #04. The amputation plane is to the right of the frame.
Video 8
Live imaging of macrophages engulfing cellular debris in a regenerating Parhyale leg.
Nuclei are marked by histone-EGFP (PhHS>H2B-EGFP transgene, in green) and neurons are marked by DsRed (DC5>DsRed transgene, in red). Starting around 35 hr post amputation (hpa), a fragment of DsRed-labelled debris becomes engulfed by macrophages (arrowhead). Maximum projection of multiple focal planes, from recording #05.
Video 9
Live imaging of the onset of cell proliferation in a regenerating leg stump, 32 to 55 hr post amputation (hpa), visualized with a geminin-based cell cycle reporter.
Cells in the S, G2 and M phases of the cell cycle are marked by EGFP-PhGemN (PhHS>EGFP-PhGemN transgene, in green) and all nuclei are marked by histone-mRuby (PhHS>H2B-mRuby transgene, in red) following a heat shock. The loss of the EGFP-PhGemN after mitosis can be seen clearly in a cell marked by an arrowhead. Maximum projection of several focal planes, from recording #13. The amputation plane is at the top-right corner of the frame.
Video 10
Live imaging of mesoderm in two regenerating Parhyale leg stumps, 3 to 76 hr post amputation (hpa).
Two adjacent legs are imaged in a mosaic individual expressing lyn-tdTomato (in white) and H2B-EGFP (in red) specifically in the mesoderm. Muscles at the proximal part of the legs persist, but those near the amputation plane (to the right) degenerate and the inner space of the stump becomes populated by proliferating mesenchymal cells. Maximum projection of multiple focal planes from recording #11. The amputation planes are at the right edge of the frame.
Tables
Table 1
Summary of live recordings by confocal microscopy.
| # | Transgenes | Start of recording (hpa) | Duration of recording (hours) | Timelapse interval (min) | Number of z slices | Step ofz slices (µm) | Videos and Figures |
|---|---|---|---|---|---|---|---|
01 | PhHS>H2B-EGFP | 24 | 40 | 30 | 22 | 4.5 | |
02 | PhHS>H2B-EGFP | 24 | 8 | 15 | 25 | 4.6 | |
03 | PhHS>H2B-EGFP, DC5>DsRed | 48 | 63 | 45 | 22 | 3.1 | Figure 5, 6A Videos 5, 6 |
04 | PhHS>H2B-EGFP | 46 | 64 | 30 | 28 | 2.1 | Figures 1F, 6B Video 7 |
05 | PhHS>H2B-EGFP, DC5>DsRed | 24 | 62* | 30 | 19 | 3.5 | Video 8 |
06 | PhHS>H2B-EGFP, DC5>DsRed | 26 | 63 | 30 | 16 | 2.5 | |
07 | PhHS>H2B-EGFP | 1 | 66 | 10, 15, 30 | 29 | 4.5 | Video 4 |
08 | PhHS>lyn-tdTomato-2A-H2B-EGFP (unilateral ectoderm and mesoderm mosaic) | 5 | 65 | 30 | 22 | 4.5 | |
09 | PhHS>EGFP-PhGemN, PhHS>H2B-mRuby | 25 | 64 | 25 | 23 | 3.6 | |
10 | PhHS>lyn-tdTomato-2A-H2B-EGFP (mesoderm mosaic) | 3 | 68 | 30 | 21 | 3.5 | Figure 1G |
11 | PhHS>lyn-tdTomato-2A-H2B-EGFP (mesoderm mosaic) | 2 | 92* | 30 | 24 | 3.5 | Video 10 |
12 | PhHS>H2B-EGFP, DC5>DsRed | 24 | 68* | 30 | 21 | 3.5 | |
13 | PhHS>EGFP-PhGemN, PhHS>H2B-mRuby | 6 | 88 | 30 | 20 | 3.8 | Figure 6C Video 9 |
-
*Animal died during the recording (see Figure 2).
Additional files
-
Supplementary file 1
Sequences for constructs PhHS>lyn-TdTomato-2A-H2B-EGFP, DC5>DsRed and PhHS>EGFP-PhGemN.
- https://doi.org/10.7554/eLife.19766.020
Download links
A two-part list of links to download the article, or parts of the article, in various formats.
Downloads (link to download the article as PDF)
Open citations (links to open the citations from this article in various online reference manager services)
Cite this article (links to download the citations from this article in formats compatible with various reference manager tools)
Live imaging reveals the progenitors and cell dynamics of limb regeneration
eLife 5:e19766.
https://doi.org/10.7554/eLife.19766


