Genome-wide identification of neuronal activity-regulated genes in Drosophila
- Howard Hughes Medical Institute, Brandeis University, United States
- Brandeis University, United States
Figures
Figure 1 with 1 supplement
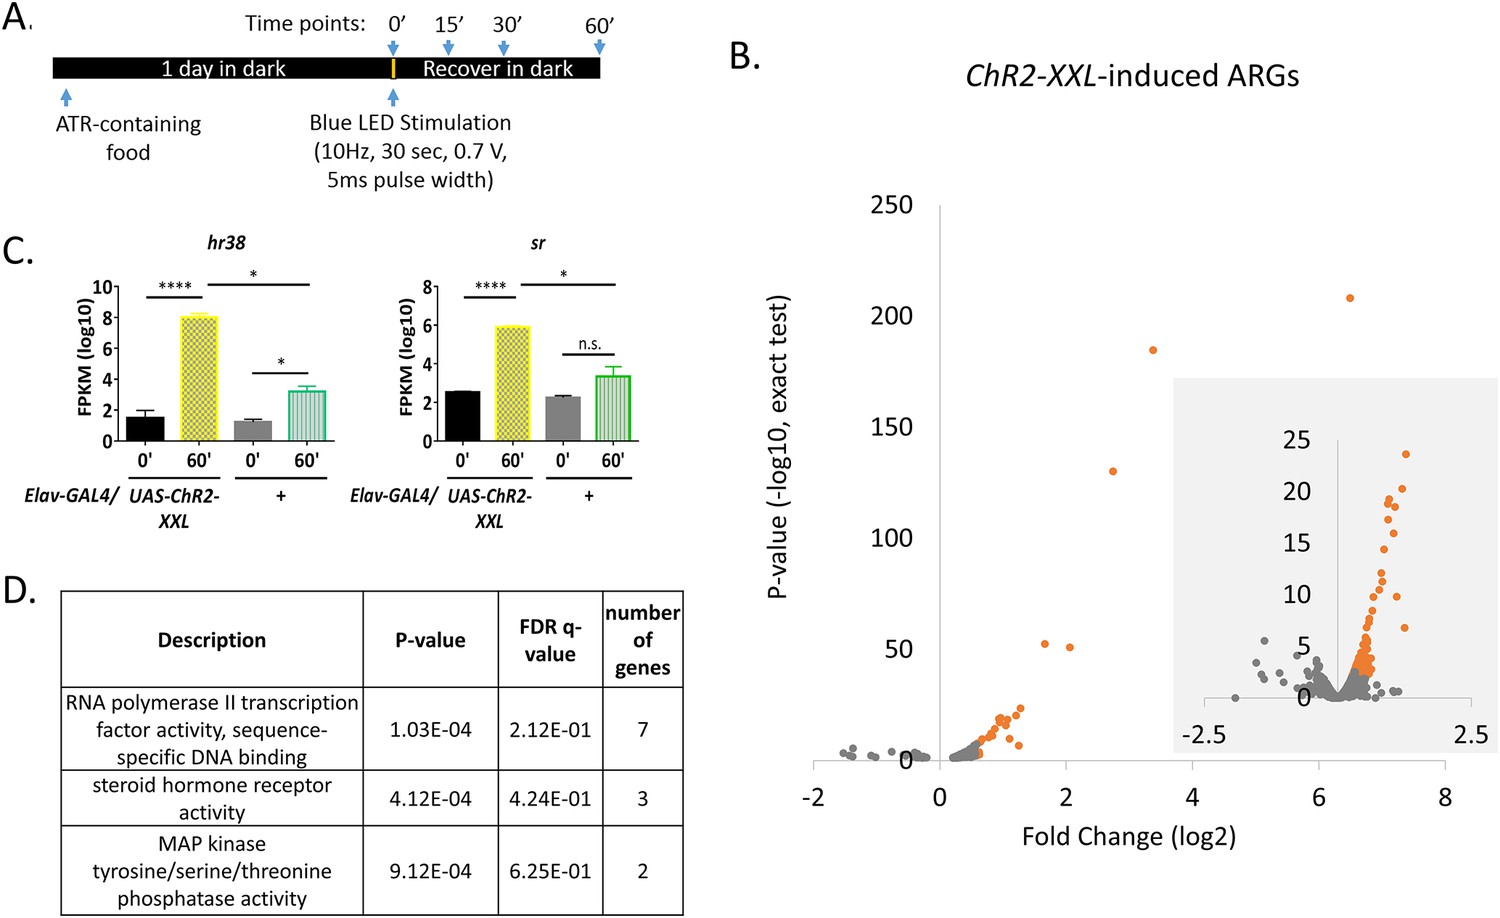
High-throughput sequencing and optogenetics reveal ARGs in Drosophila.
(A) Stimulation paradigm for Elav-GAL4;UAS-ChR2-XXL flies. (B) Volcano plots of individual genes (FPKM > 0) with log2 fold changes (x-axis) against p-value (y-axis, exact test). Genes significantly induced (p-value < 0.01 for both exact test and GLM) are in red. The smaller area with grey background is the zoom-in view with larger scales. N = 3 biological replicates. (C) Gene expression of hr38 and sr in Elav-GAL4;UAS-ChR2-XXL and Elav-GAL4/+ (control) flies 0 or 60 min after LED stimulation. N = 3 biological replicates, error bars represent ±SEM, n.s. represents non-significant. *p<0.05, ****p<0.0001, exact test. (D) Gene ontology analysis on ChR2-XXL-induced ARGs. P-value is the enrichment p-value, not corrected for multiple testing. FDR q-value is the corrected p-value for multiple testing using the Benjamini and Hochberg (1995) method (Eden et al., 2009; Eden et al., 2007). Number of genes indicates the number of ARGs with the specified functions.
-
Figure 1—source data 1
ChR2-XXL-induced ARGs in fly brains.
- https://doi.org/10.7554/eLife.19942.003
Figure 1—figure supplement 1
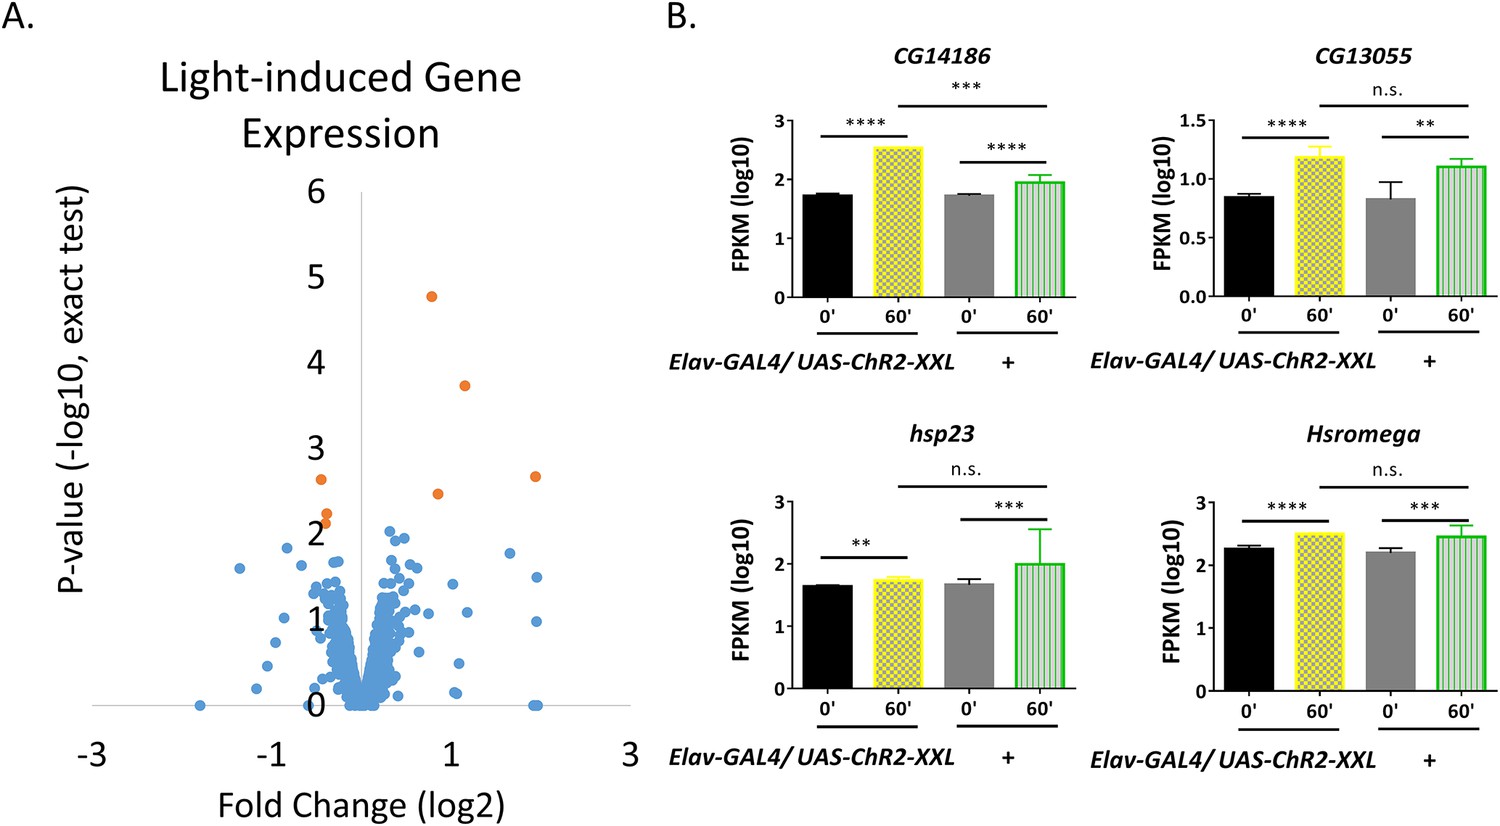
Light-induced gene expression.
(A) Volcano plots of individual genes (FPKM > 0 at baseline, FPKM > 10 with stimulation) with fold changes (log2, x-axis) against p-value (-log10, exact test, y-axis). Genes with expression levels significantly changed (pf-value < 0.01 for both exact test and GLM) are shown in red. (B) Expression levels of the four genes up-regulated with LED in control flies. N = 3 biological replicates, error bars represent ±SEM, n.s. represents non-significant, **p<0.01, ***p<0.001, ****p<0.0001, exact test.
Figure 2 with 1 supplement
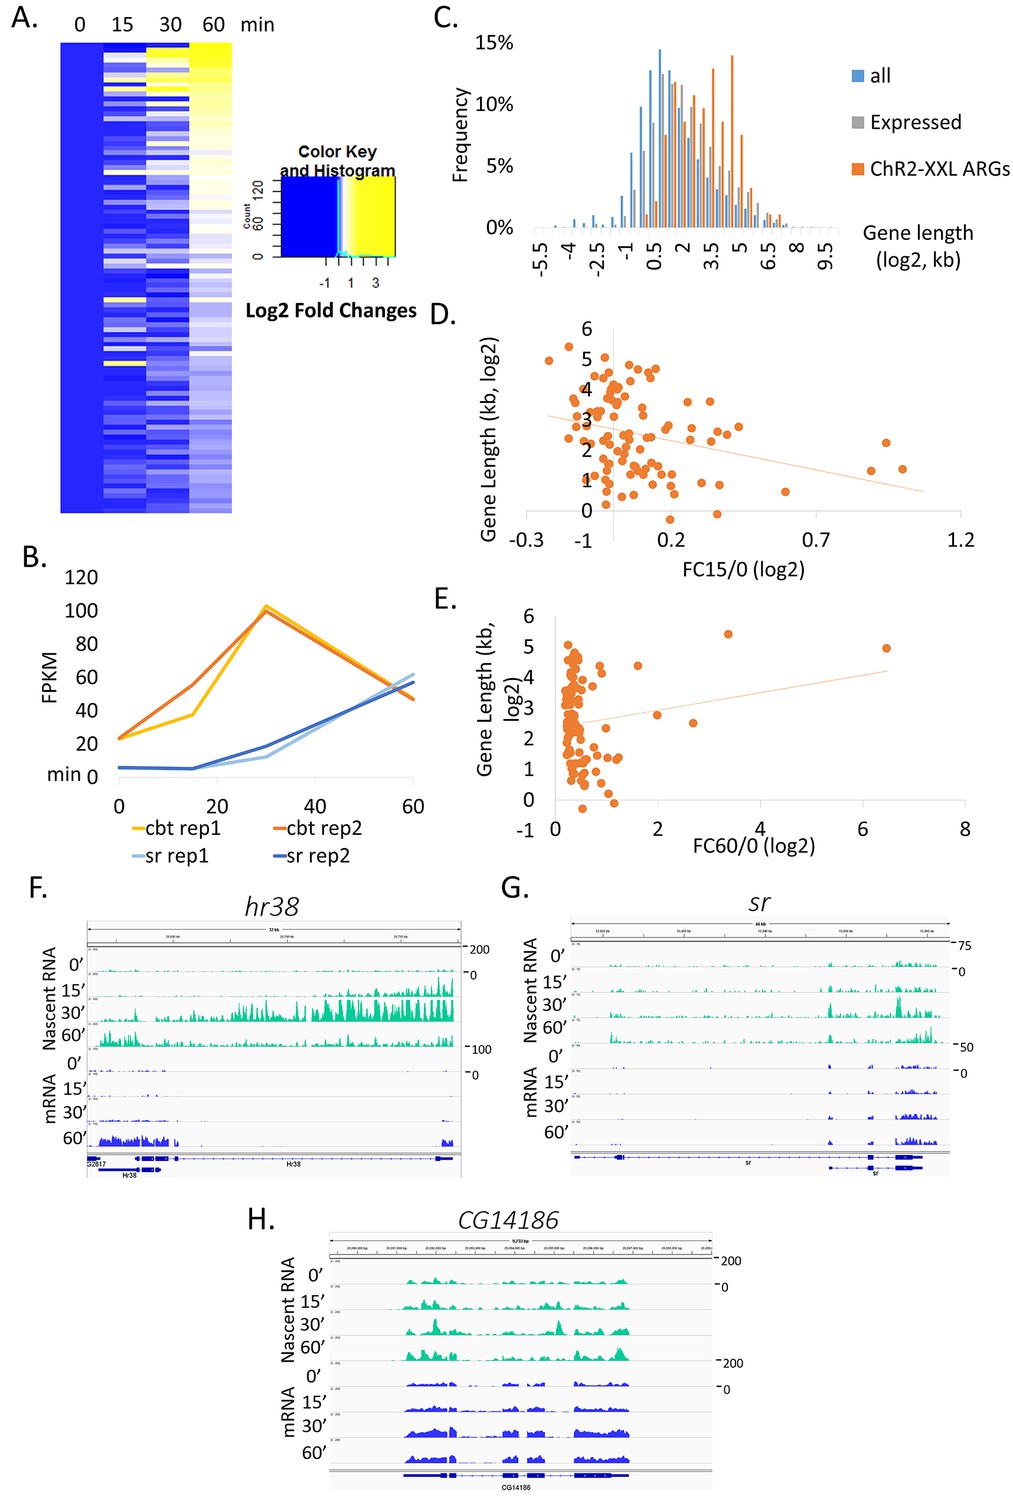
Gene sizes of ARGs correlate with induction rates.
(A) Heat map of ChR2-XXL-induced ARG expression from 0, 15, 30 to 60 min (normalized to 0 min expression) post-LED stimultaion. Each row represents one gene. Data are averages of 2 biological replicates. (B) Gene induction profiles of cbt (gene length = 2.6 kb, red) and sr (gene length = 11 kb, blue) with LED stimulation in Elav-GAL4;UAS-ChR2-XXL flies (N = 2 biological replicates, abbreviated as rep1/2). (C) Gene length distribution of all annotated genes in the genome (blue), genes expressed in brains (gray, FPKM > 0 at baseline, FPKM > 10 with stimulation), and ChR2-XXL-induced ARGs (red). Only the longest isoform of each gene is plotted. (D) Correlation of ChR2-XXL-induced ARGs gene length (y-axis) and fold changes of 15 min compared to 0 min (abbreviated as FC15/0, x-axis). (E) Correlation of ChR2-XXL-induced ARGs gene length (y-axis) and fold changes of 60 min compared to 0 min (abbreviated as FC60/0, x-axis). (F–H) Expression profiles of hr38, sr, and CG14186 from fly heads 0, 15, 30 and 60 min after LED stimulation. Nascent RNA levels are shown in green and mRNA levels in blue. Numbers to the right of the expression graphs indicate data range.
Figure 2—figure supplement 1
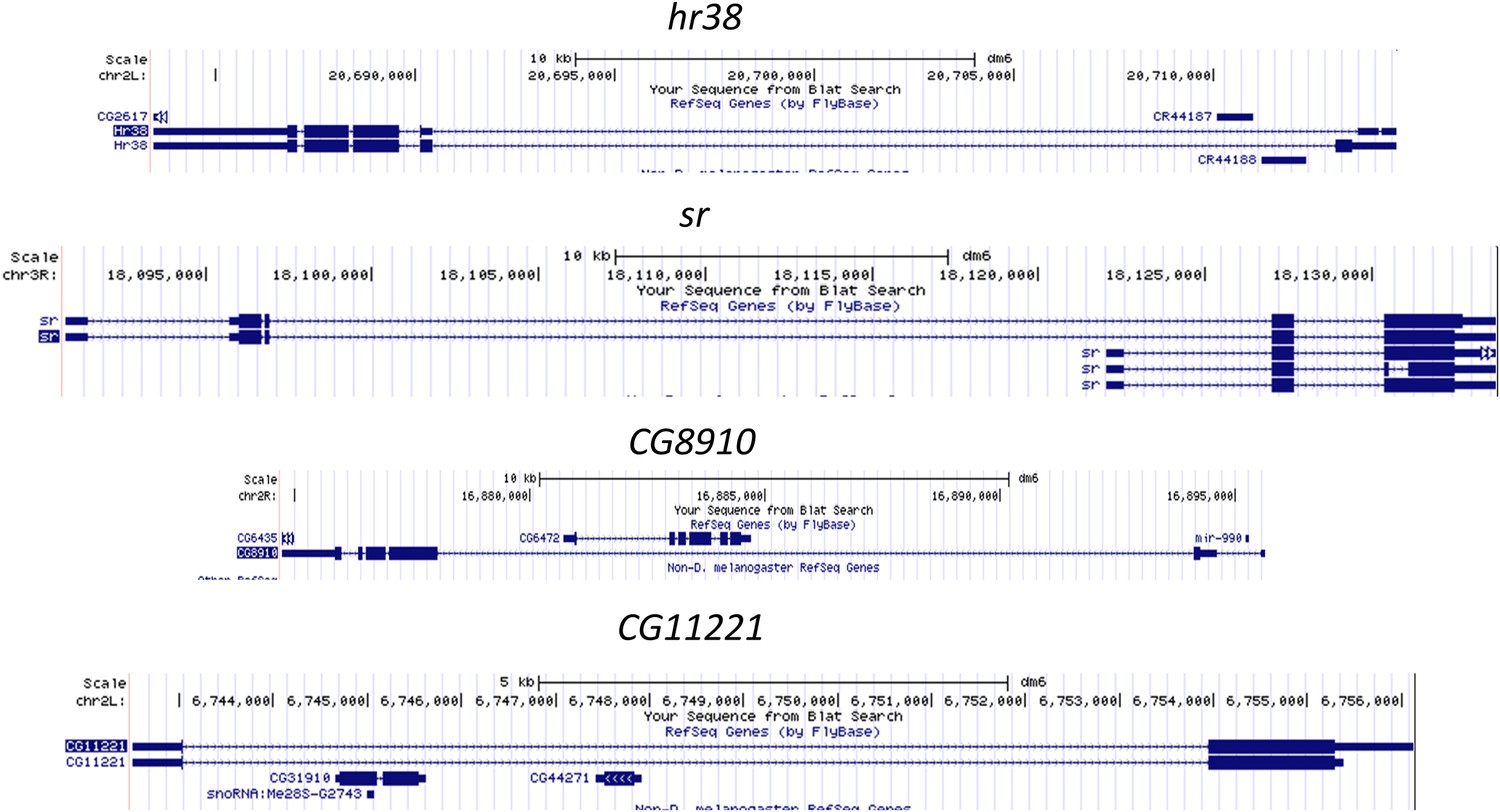
Gene structure of some long ARGs induced by ChR2-XXL, including hr38, sr, CG8910, and CG11221.
Gene structures obtained from UCSC genome browser (https://genome.ucsc.edu/).
Figure 3 with 4 supplements
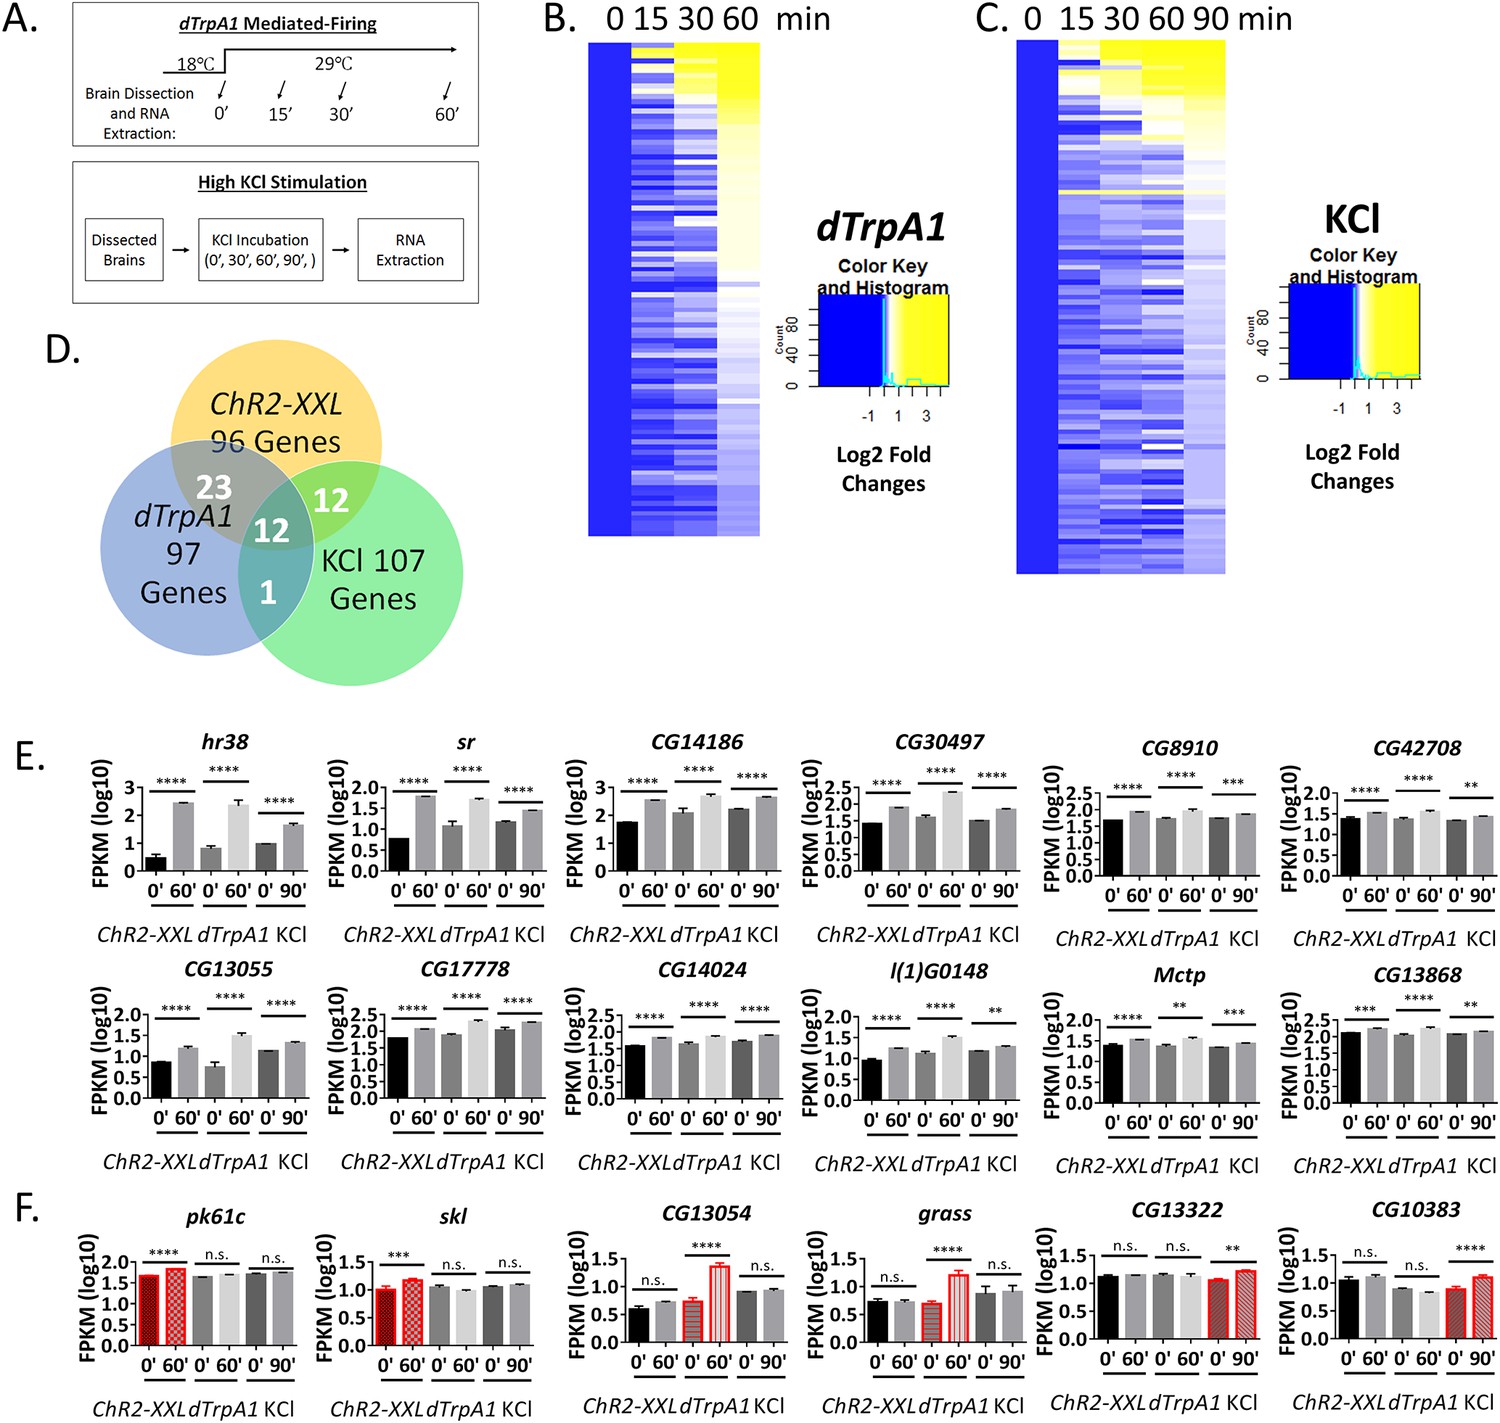
ARGs induced by two additional stimulation paradigms.
(A) Schemes of two additional stimulation paradigms: dTrpA1 and KCl. (B) Heat map of dTrpA1-induced ARG expression with 0, 15, 30 and 60 min temperature shift (normalized to 0 min expression). N = 3 biological replicates. (C) Heat map of KCl-inducd ARG expression with 0, 15, 30, 60 and 90 min KCl incubation (normalized to 0 min expression). N = 3 biological replicates. (D) Overlap of ARGs among the three different stimulation paradigms: ChR2-XXL, dTrpA1 and KCl (90 min). (E) Gene expression of the 12 shared ARGs induced by all three stimulation paradigms. N = 3 biological replicates, error bars represent ±SEM, **p<0.01, ***p<0.001, ****p<0.0001, exact test. (F) Gene expression of paradigm-specific ARGs: pk61c and skl are specific to the ChR2-XXL paradigm; CG13054 and grasss are specific to the dTrpA1 paradigm; and CG13322 and CG10383 are specific to the KCl paradigm. N = 3 biological replicates, error bars represent ±SEM, n.s. represents non-significant, **p<0.01, ***p<0.001, ****p<0.0001, exact test.
-
Figure 3—source data 1
dTrpA1-induced ARGs in fly brains.
- https://doi.org/10.7554/eLife.19942.008
-
Figure 3—source data 2
KCl-induced ARGs in 60 min in fly brains.
- https://doi.org/10.7554/eLife.19942.009
-
Figure 3—source data 3
KCl-induced ARGs in 90 min in fly brains.
- https://doi.org/10.7554/eLife.19942.010
-
Figure 3—source data 4
Overlapped ARGs in brains.
- https://doi.org/10.7554/eLife.19942.011
Figure 3—figure supplement 1
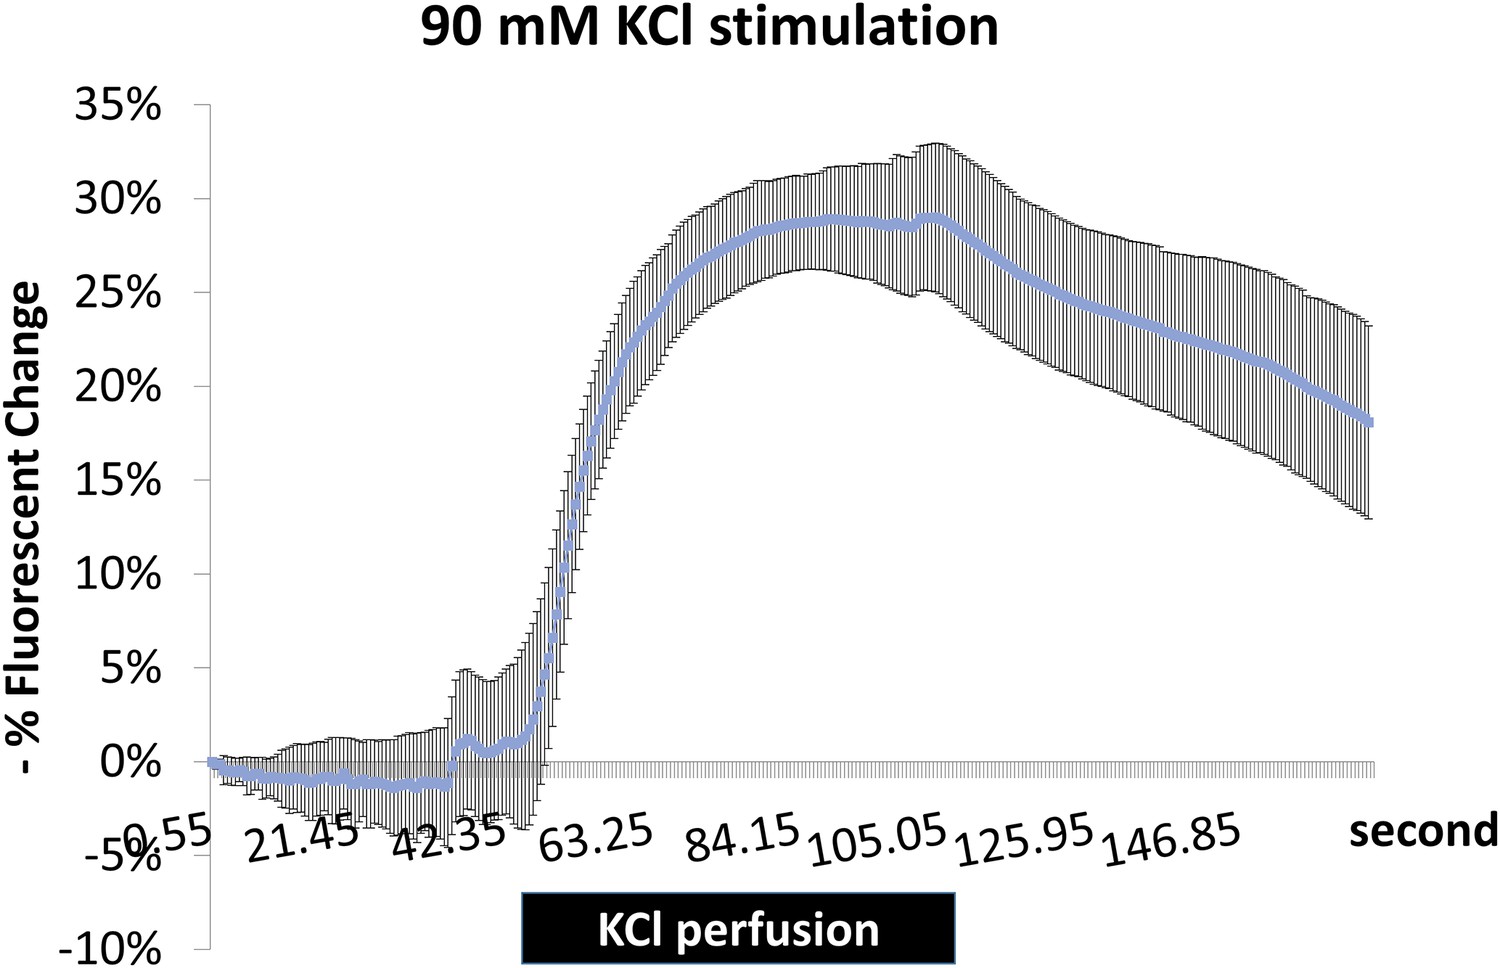
Fluorescence changes of ArcLight indicate successful depolarization of neurons with KCl stimulation.
Brains expressing ArcLight in PDF+ neurons were dissected and mobilized in chamber with AHL for recording with fluorescence microscope. KCl was perfused to the chamber at ~60 s and washed out at ~110 s with AHL. KCl stimulation is indicated with the black bar. N = 4 flies. A representative recording plot of multiple biological replicates is shown. Error bars represent ±SEM.
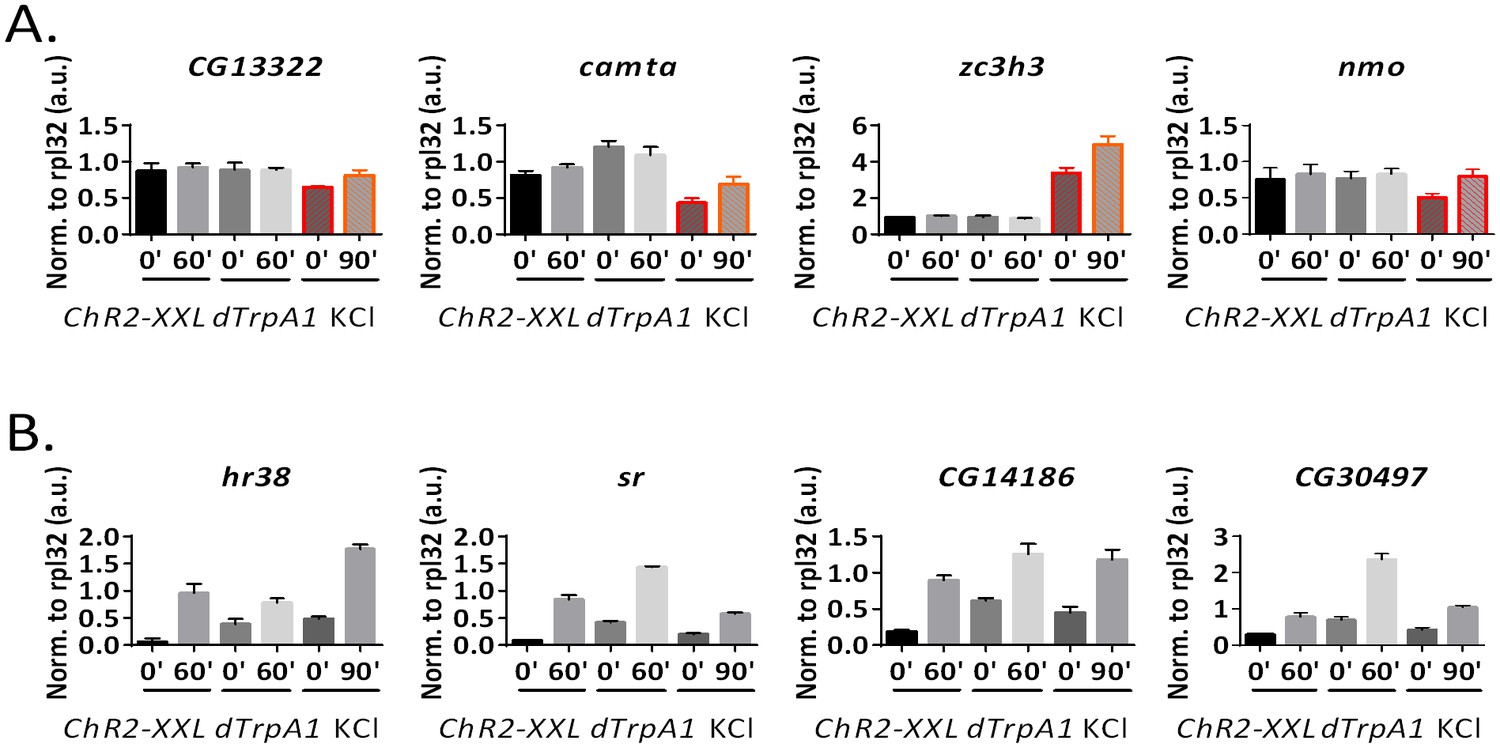
Figure 3—figure supplement 2
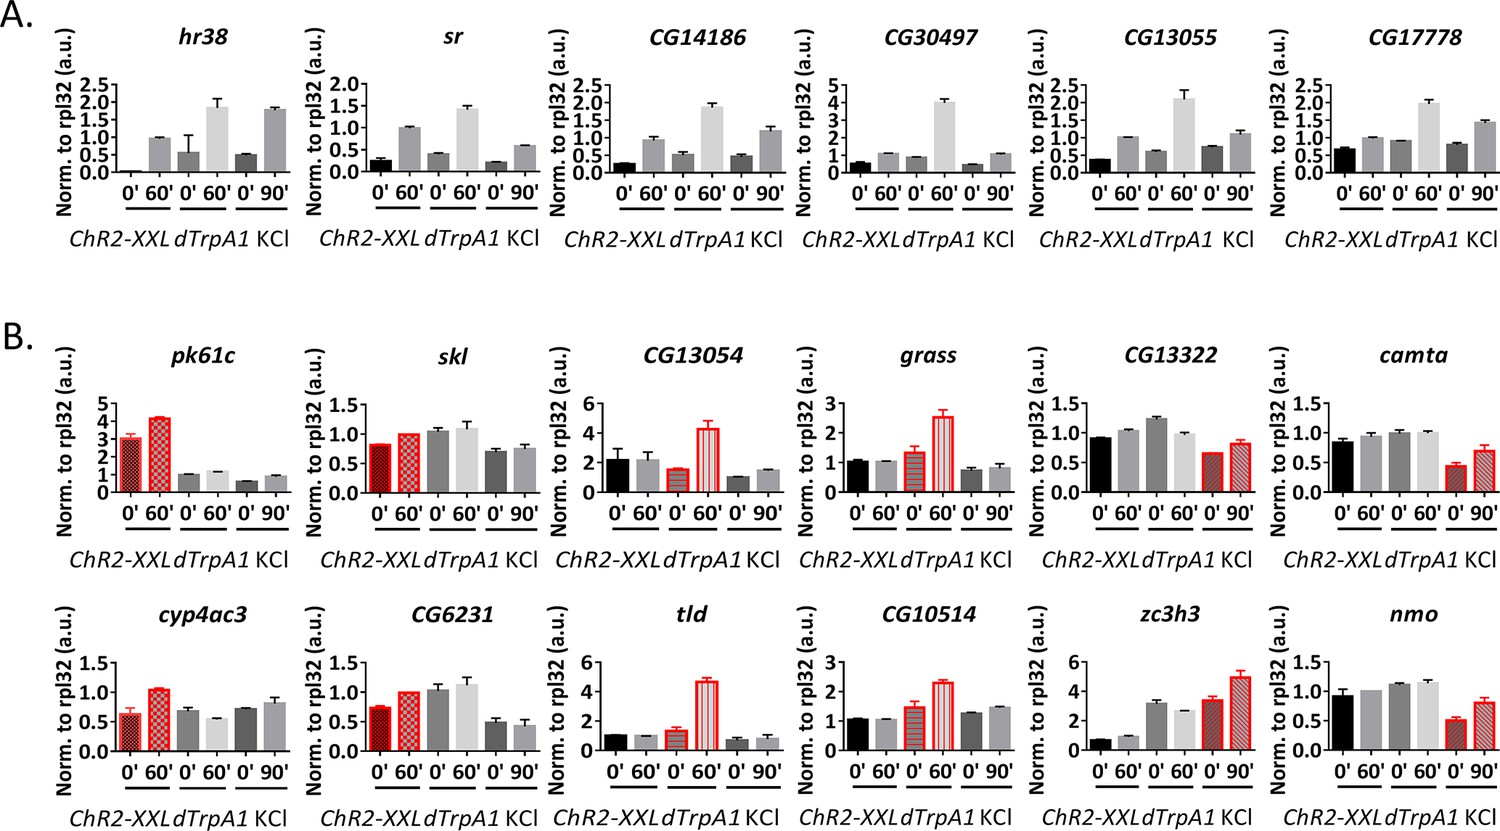
qPCR verification of high-throughput RNA sequencing results.
(A) qPCR verification of the shared ARGs by all three stimulation paradigms. 6 out of 6 genes tested are consistent with high-throughput sequencing results. N = 3 biological replicates, error bars represent ±SEM. (B) qPCR verification of stimulation paradigm-specific ARGs. Highlighted in red is the paradigm identified by high-throughput sequencing to induce expression of the particular gene. All genes tested are consistent with the high-throughput sequencing results. N = 3 biological replicates, error bars represent ±SEM.
Figure 3—figure supplement 3
qPCR quantification of paradigm-specific ARGs in ChR2-XXL flies with a 30 min LED stimulation followed by another 30 min recovery.
N = 3 biological replicates, error bars represent ±SEM, n.s. represents non-significant, *p<0.05, two-tail t-test.
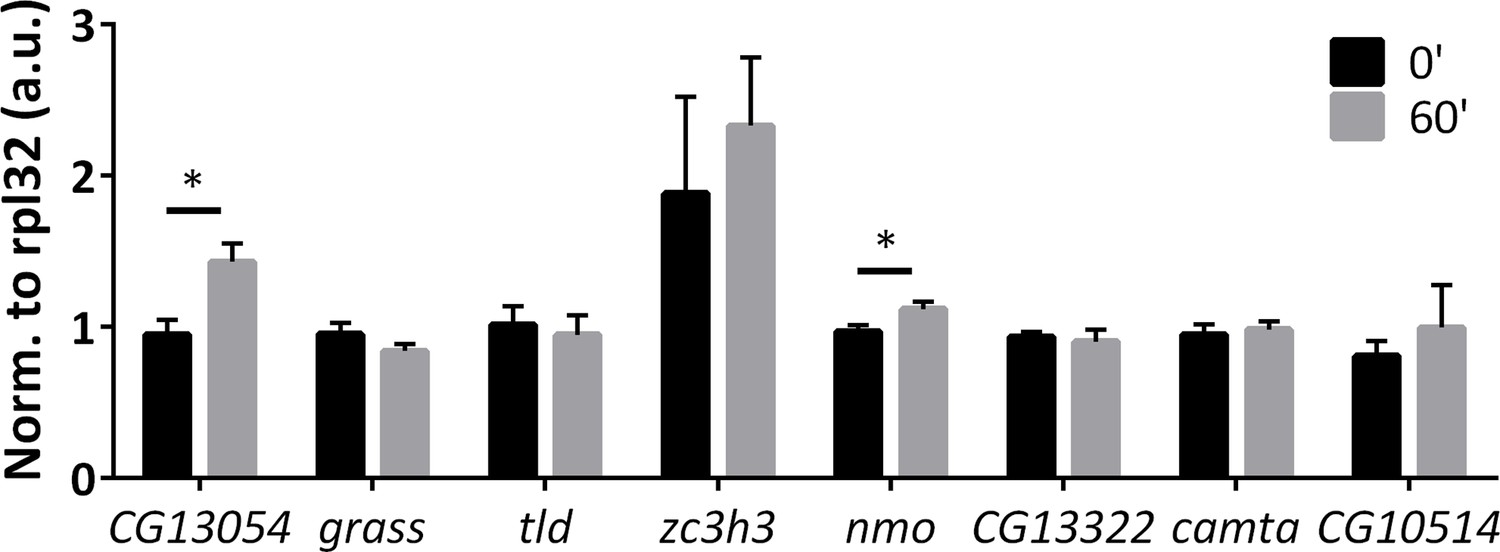
Figure 3—figure supplement 4
qPCR quantification of ARGs induction under ex vivo condition.
ChR2-XXL indicates dissected brains of Elav-GAL4;UAS-ChR2-XXL flies exposed to a 30 s LED exposure. dTrpA1 indicates dissected brains of Elav-GAL4;UAS-dTrpA1 flies incubated in a 29°C water bath. A.u. indicates arbitrary unit. N = 3 biological replicates, error bars represent ±SEM. (A) qPCR quantification of the KCl-specific ARGs according to the high-throughput RNA sequencing results. All four genes tested are only induced by the KCl paradigm. (B) qPCR quantification of the shared ARGs by all three stimulation paradigms according to the high-throughput RNA sequencing results. All four genes tested are induced by all three ex vivo paradigms.
Figure 4 with 1 supplement
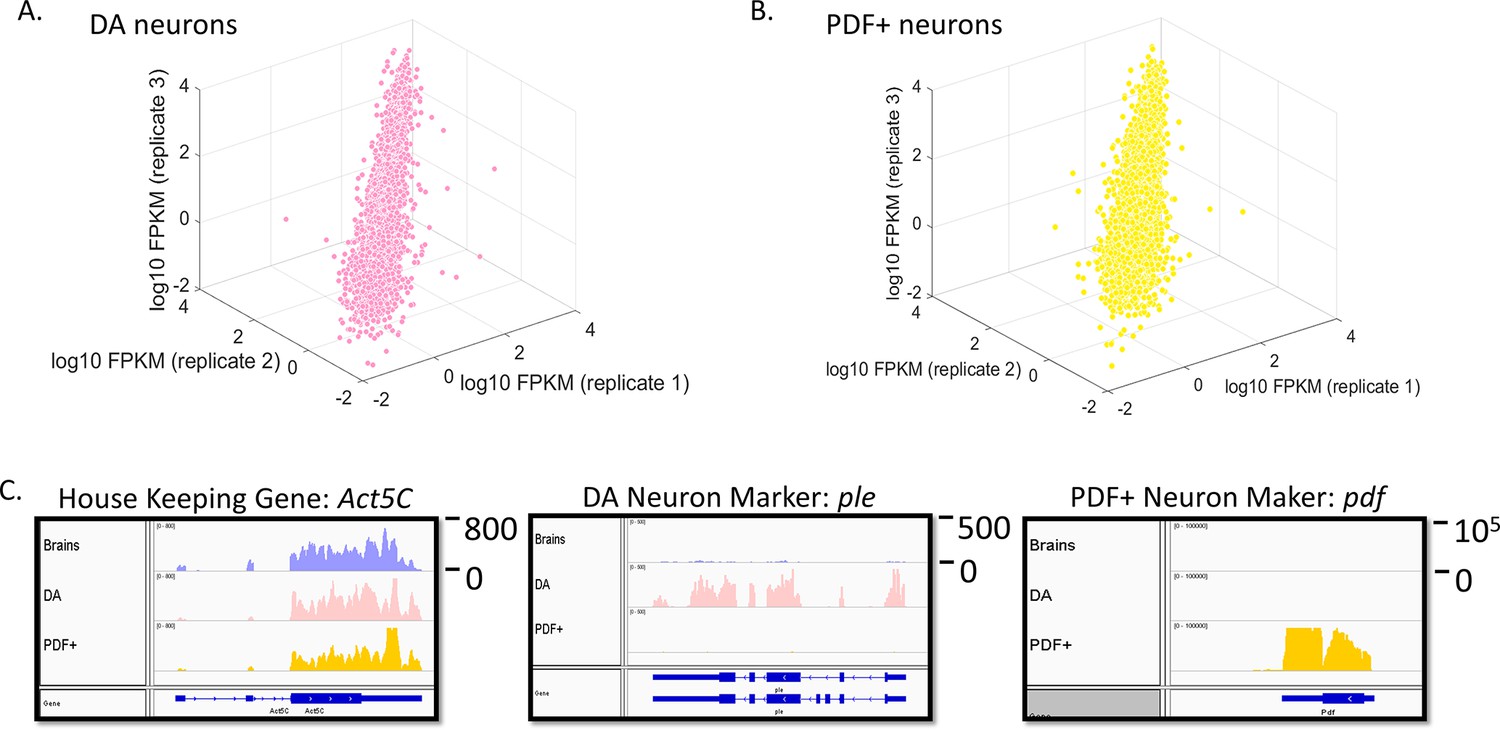
Transcriptome profiling in sorted DA and PDF+ neurons.
(A) Gene expression (log10 FPKM) plot among three biological replicates (baseline levels) in DA neurons. Only genes with FPKM > 0.01 are plotted. (B) Gene expression (log10 FPKM) plot among three biological replicates (baseline levels) in PDF+ neurons. Only genes with FPKM > 0.01 are plotted. (C) Expression levels of the house-keeping gene (act5c) and marker genes (ple specific for DA neurons and pdf specific for PDF+ neurons) in all three tissues. Numbers to the right of the expression graphs represent data range.
Figure 4—figure supplement 1

Transcriptomes of brains, DA and PDF+ neurons are very distinct.
Baseline gene expression (log10 FPKM) plot of brains, DA and PDF+ neurons.
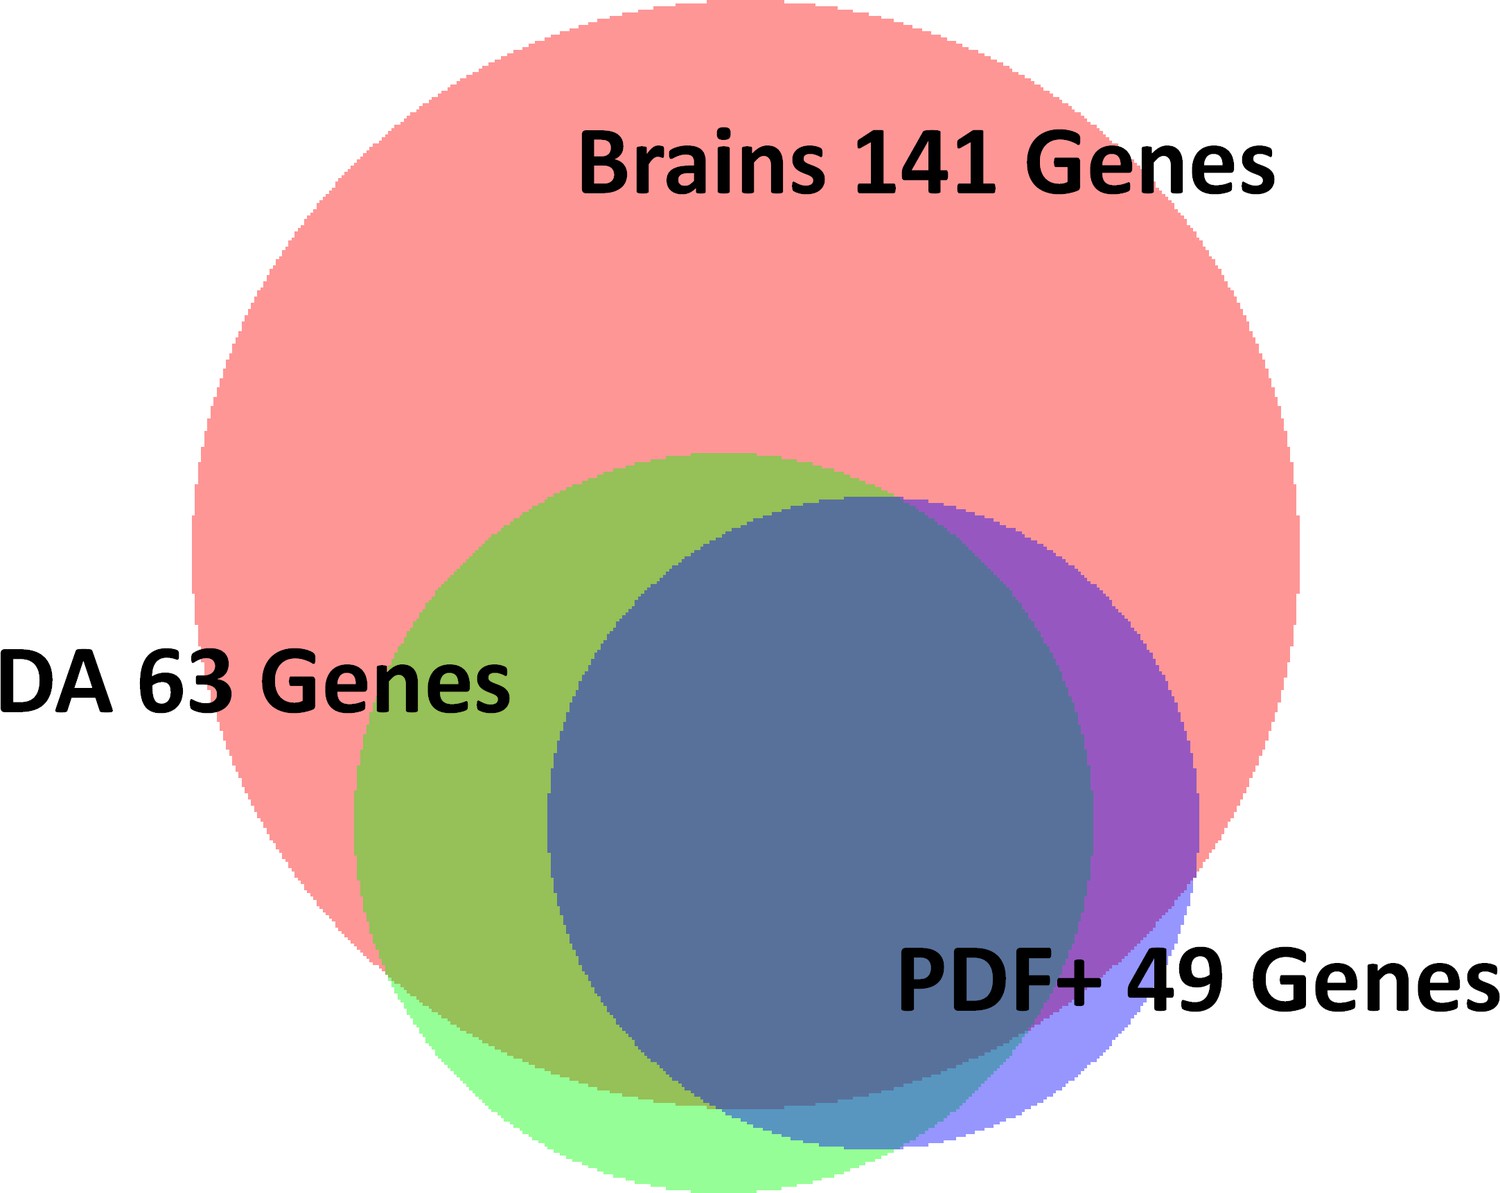
Figure 5 with 2 supplements
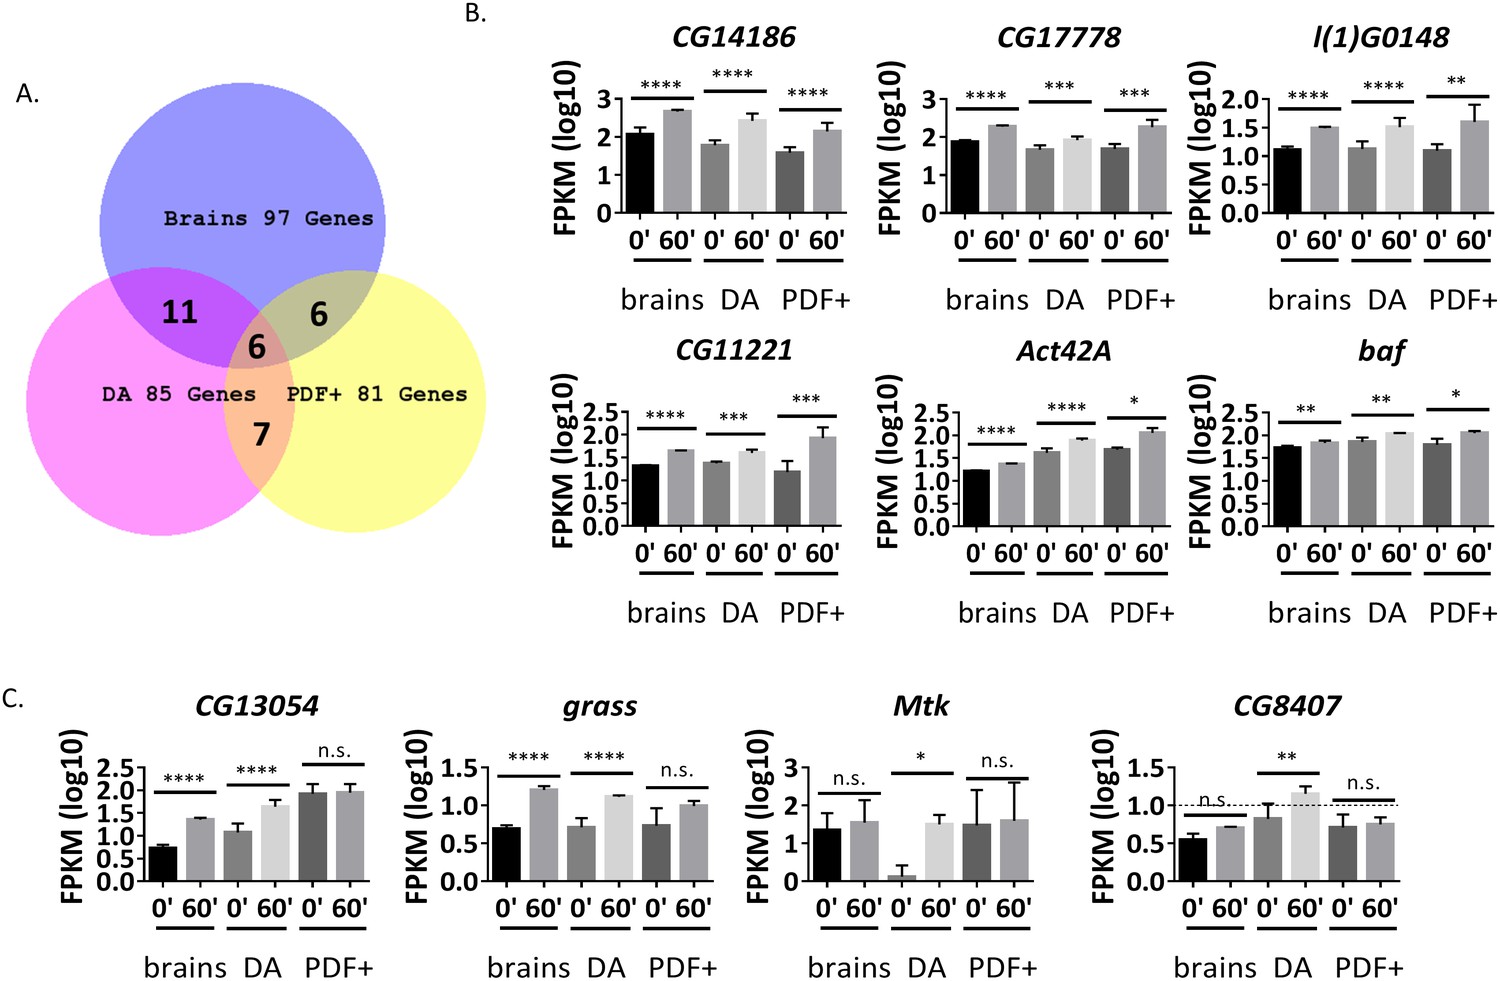
Many ARGs are tissue-specifically regulated in response to firing.
(A) Overlap of ARGs in different tissues. (B) Gene expression of shared ARGs induced in all tissue types. N = 3 biological replicates, error bars represent ±SEM, *p<0.05, **p<0.01, ***p<0.001, ****p<0.0001, exact test. (C) Gene expression of tissue-specific ARGs. N = 3 biological replicates, error bars represent ±SEM, n.s. represents non-significant, *p<0.05, **p<0.01, ***p<0.001, ****p<0.0001, exact test.
-
Figure 5—source data 1
ARGs induced in DA neurons.
- https://doi.org/10.7554/eLife.19942.020
-
Figure 5—source data 2
ARGs induced in PDF+ neurons.
- https://doi.org/10.7554/eLife.19942.021
-
Figure 5—source data 3
Overlapped ARGs in different tissue types.
- https://doi.org/10.7554/eLife.19942.022
Figure 5—figure supplement 1
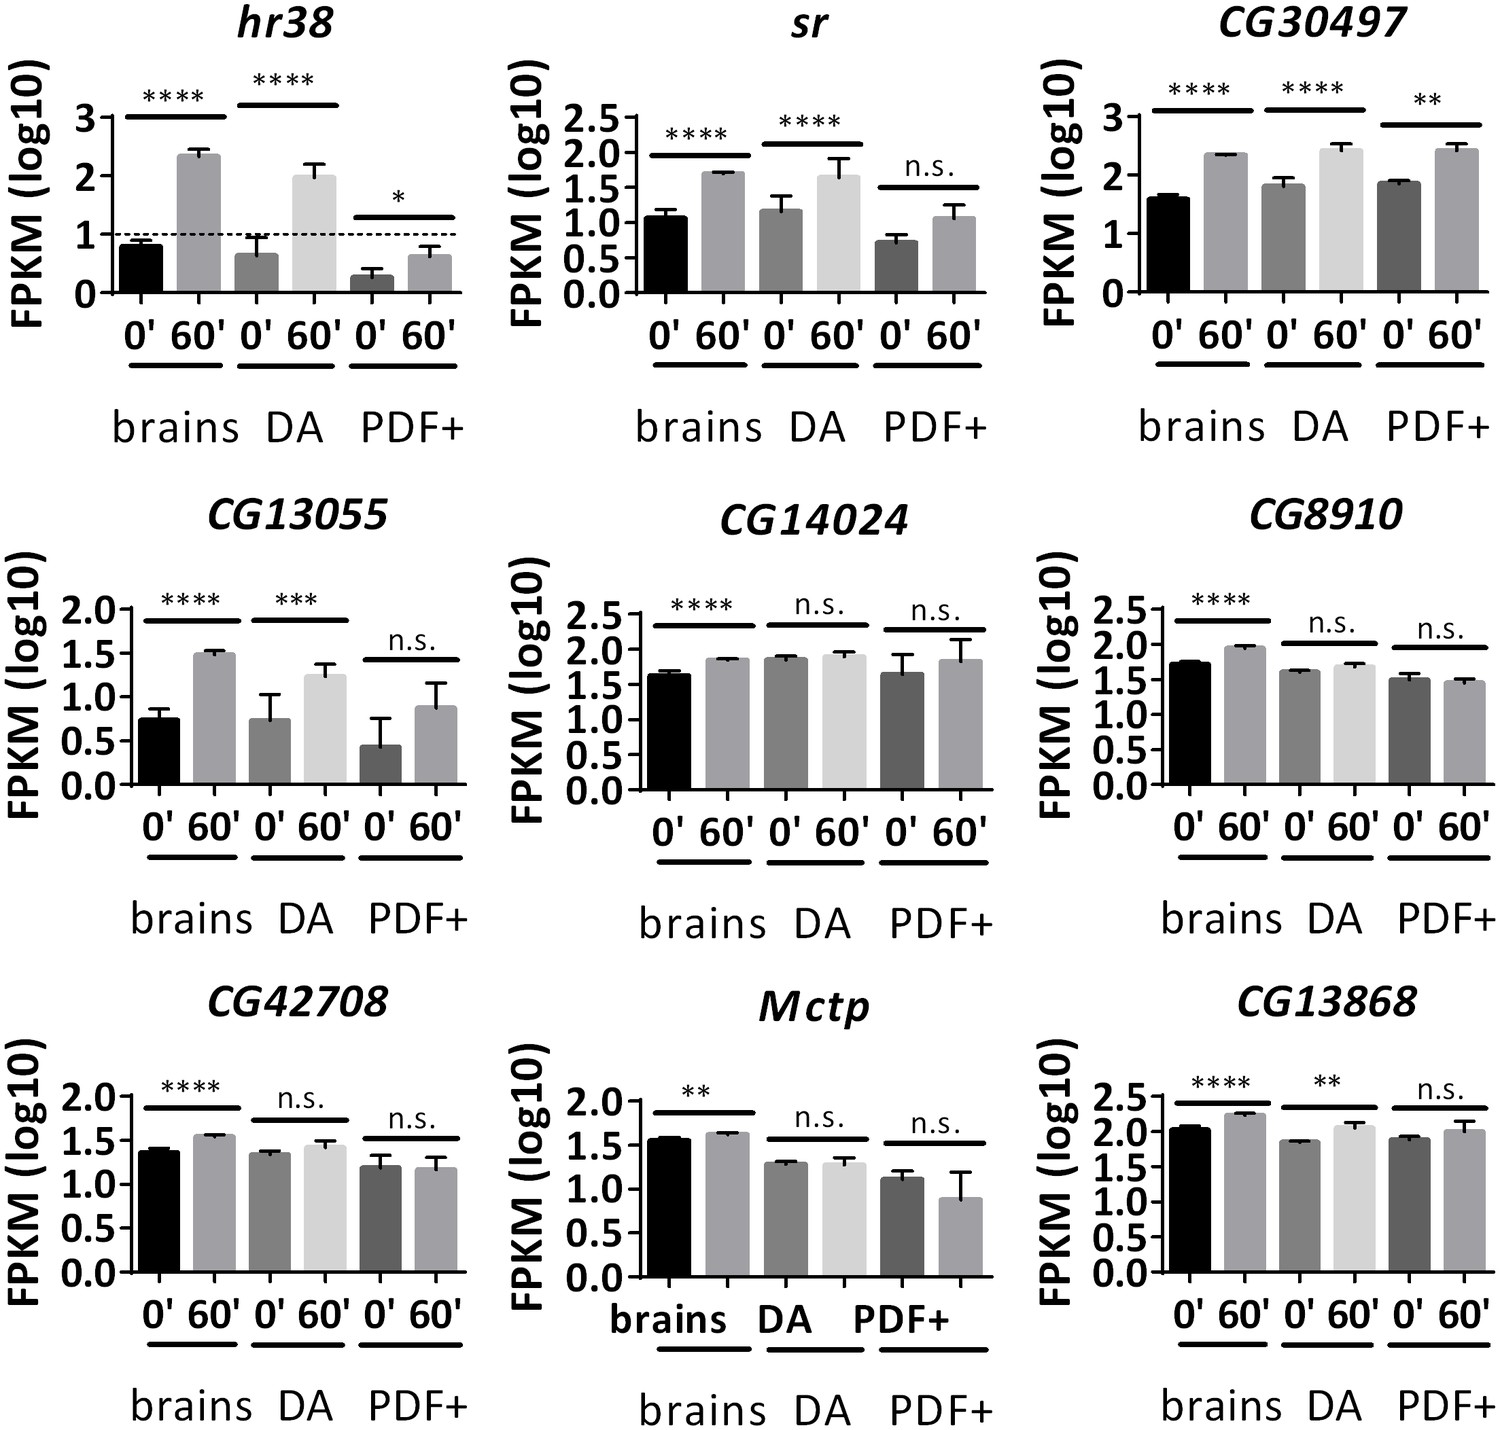
Not all common ARGs in brains are induced in DA and PDF+ neurons.
Gene expression of common brain ARGs in brains, DA and PDF+ neurons with dTrpA1 stimulation. N = 3 biological replicates, error bars represent ±SEM, n.s. represents non-significant, *p<0.05, **p<0.01, ***p<0.001, ****p<0.0001, exact test. Hr38 in PDF+ neurons is below the expression cutoff (FPKM < 10 even at 60 min after stimulation. Dash line indicates expression cutoff). Sr – insignificant increase in PDF+ neurons. CG30497 – heat-induced in DA neurons. CG13055 – heat-induced in DA neurons, low expression and insignificant change in PDF+ neurons. CG14024, CG8910, CG42708, Mctp – only induced in brains. CG13868 – insignificant in PDF+ neurons.
Figure 5—figure supplement 2
Big overlap among heat-induced genes in different tissues.
https://doi.org/10.7554/eLife.19942.024
Figure 6 with 3 supplements
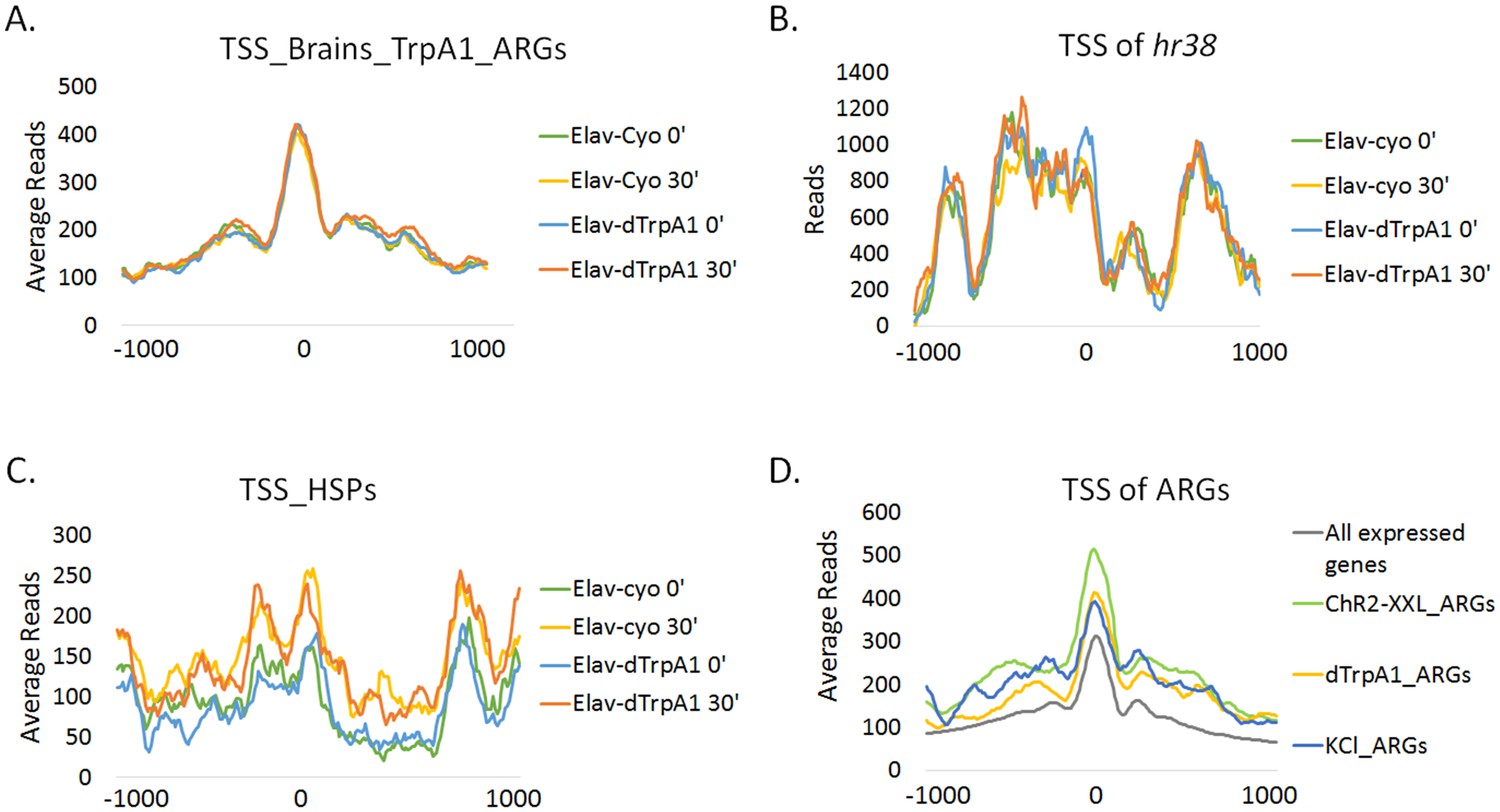
Promoter regions of ARGs are at permissive state prior to stimulation.
(A) Average chromatin accessibility at TSS of dTrpA1-induced ARGs in brains expressing Elav-GAL4;UAS-dTrpA1 or Elav-GAL4/CyO (control) at 0 or 30 min of temperature shift. TSS is aligned to 0 at x-axis which indicates the distance from TSS in base pair. Negative numbers indicate upstream of TSS and positive indicates downstream. Same for all the graphs in this figure. (B) Average chromatin accessibility at TSS of hr38 in brains expressing Elav-GAL4;UAS-dTrpA1 or Elav-GAL4/CyO (control) at 0 or 30 min of temperature shift. (C) Average chromatin accessibility at TSS of heat-shock proteins in brains expressing Elav-GAL4;UAS-dTrpA1 or Elav-GAL4/CyO (control) at 0 or 30 min of temperature shift. (D) Average chromatin accessibility at TSS of all expressed genes (FPKM > 0.1) and ARGs induced with different stimulation paradigms. Data are the average of all different conditions (genotypes and time points) and no changes of chromatin accessibility were observed among these conditions.
Figure 6—figure supplement 1
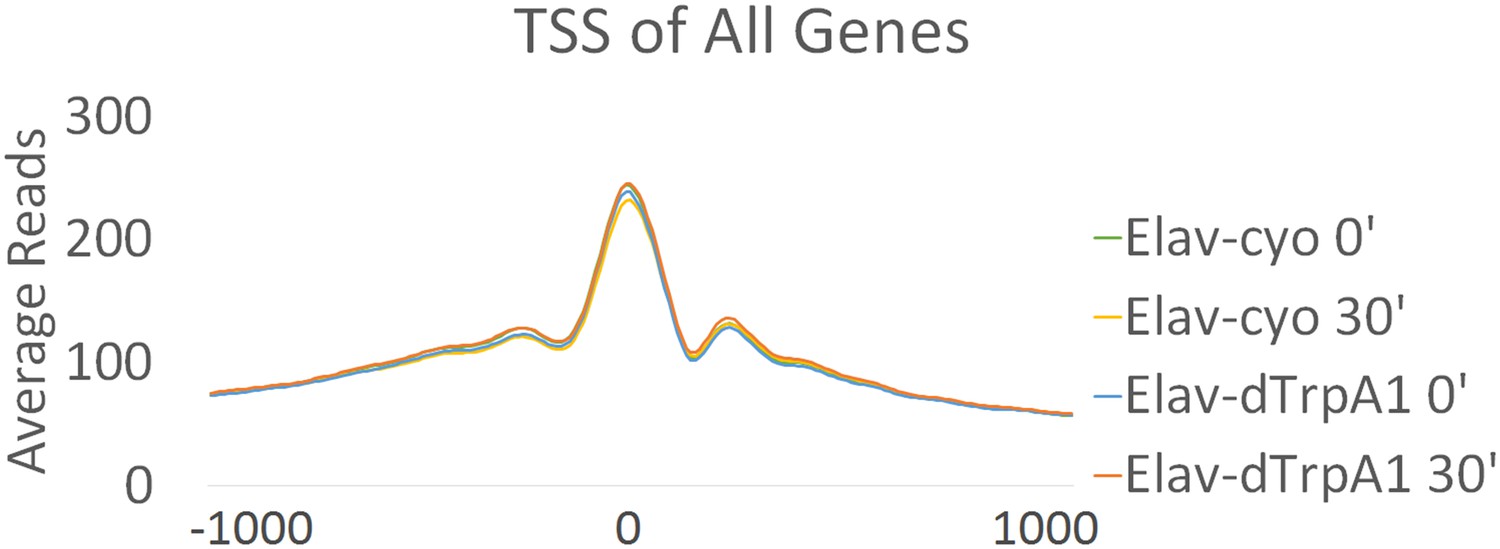
Promoter regions of all annotated genes are more accessible in brains.
Average reads of TSS sites of all annotated genes in different genotypes (Elav/CyO and Elav/dTrpA1) and time points (0 and 30 min). Chromatin accessibility shows almost no changes under different conditions. TSS is aligned to 0 at x-axis which indicates the distance from TSS in base pair. Negative numbers indicate upstream of TSS and positive indicates downstream.
Figure 6—figure supplement 2
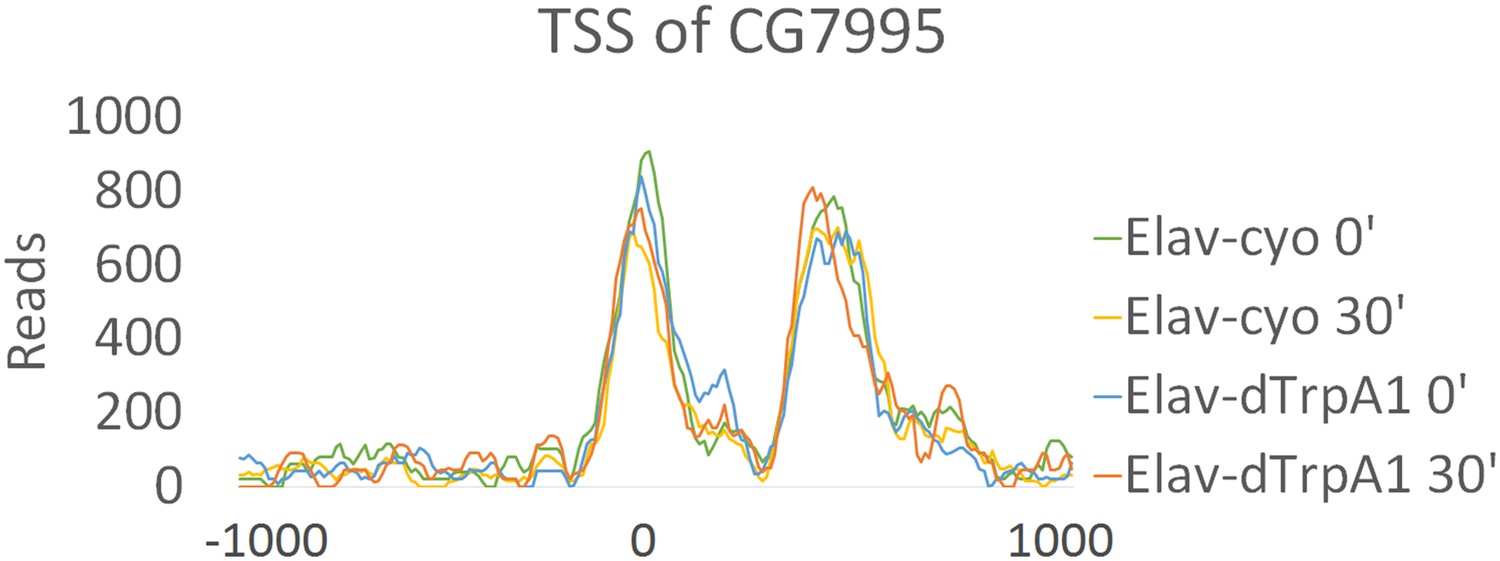
Chromatin accessibility of TSS of CG7995 show no changes with firing.
Reads of TSS sites of CG7995 in different genotypes (Elav/CyO and Elav/dTrpA1) and time points (0 and 30 min). Chromatin accessibility shows almost no changes under different conditions. TSS is aligned to 0 at x-axis which indicates the distance from TSS in base pair. Negative numbers indicate upstream of TSS and positive indicates downstream.
Figure 6—figure supplement 3
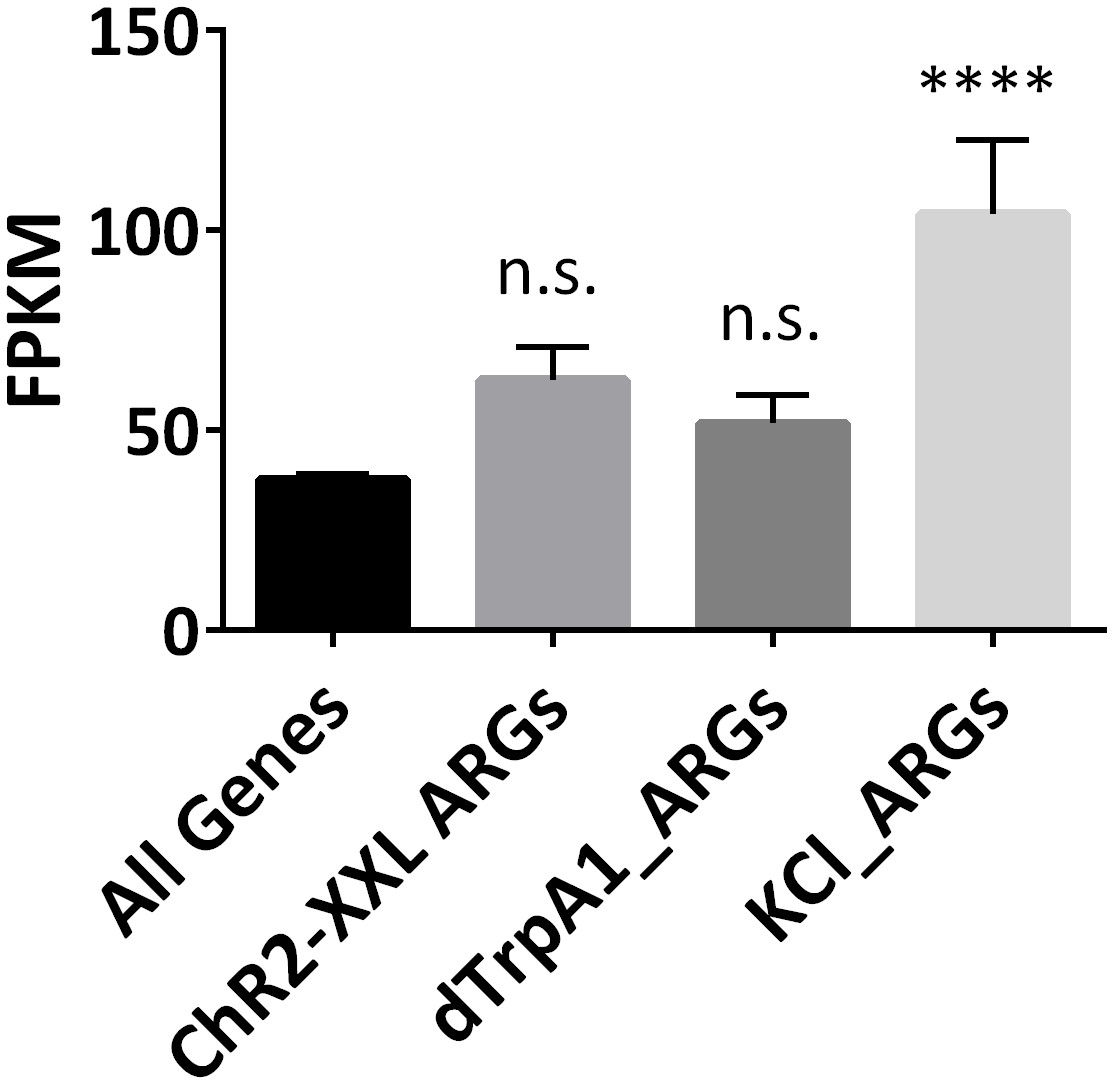
Expression levels of ARGs at baseline levels.
Expression levels of all expressed annotated genes (FPKM > 0.1), and ARGs induced with different paradigms. Only KCl-induced ARGs show significantly higher expression levels. Error bars represent ±SEM, n.s. represents non-significant, ****p<0.0001, one-way ANOVA.
Figure 7 with 1 supplement
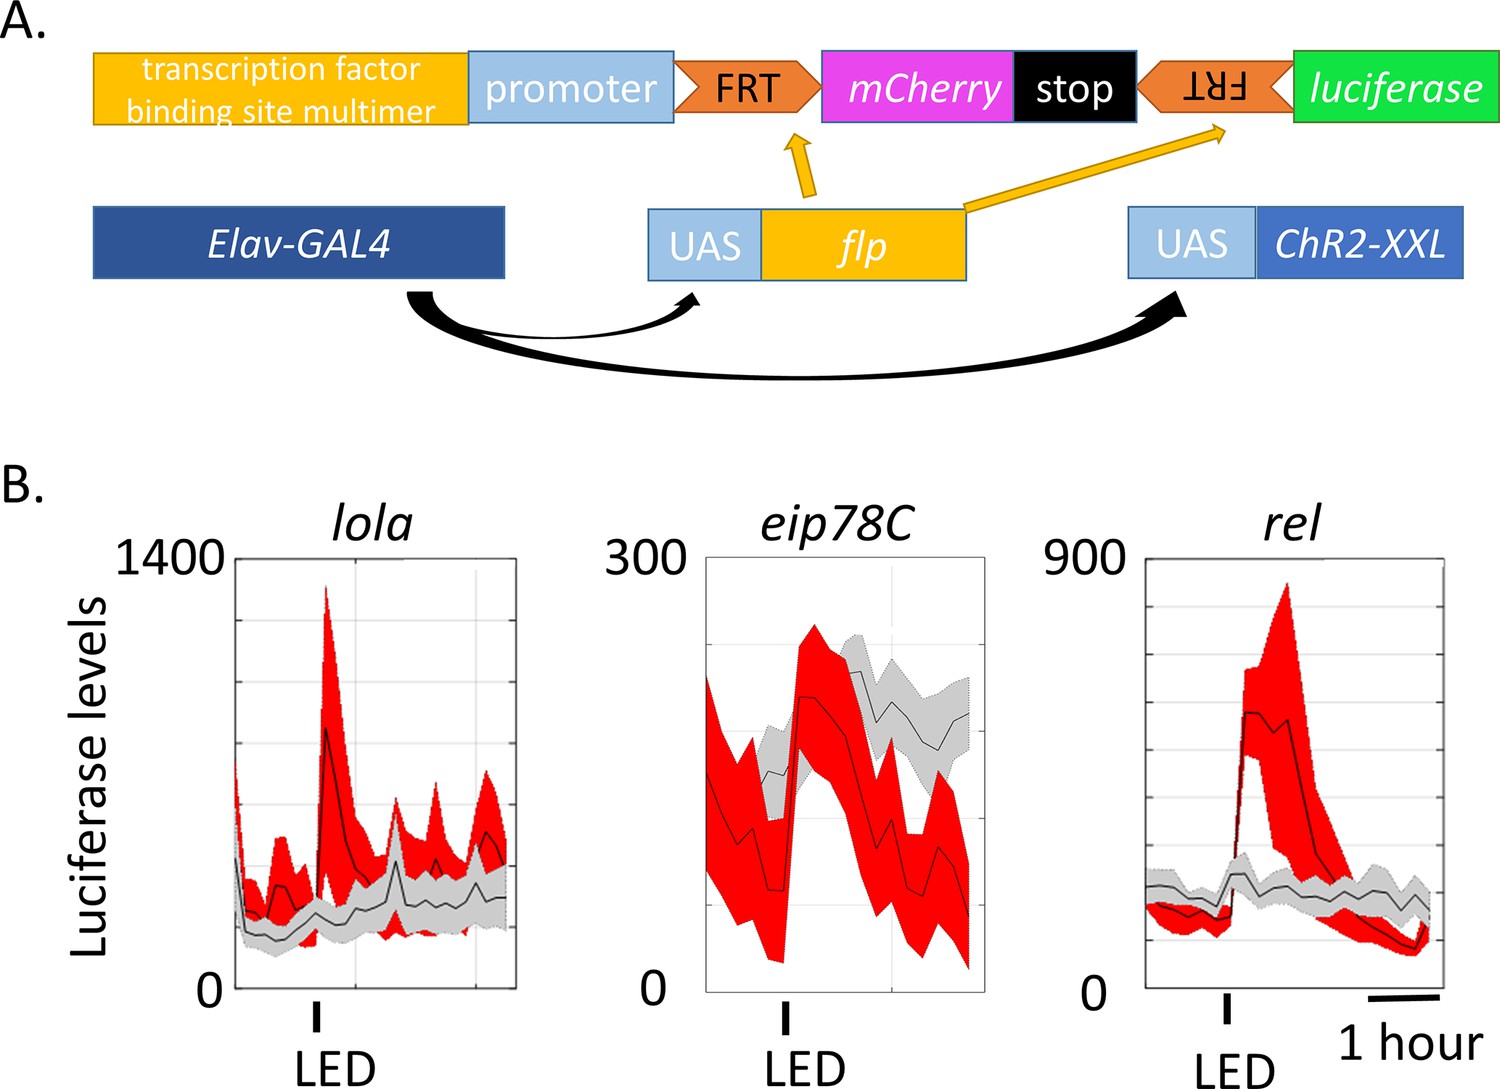
Generation of luciferase reporters for in vivo monitoring of neuronal activity.
(A) Schemes of transgenes constructed for monitoring neuronal activity (top) and other transgenes crossed to be expressed in the same flies. Transcription factor binding sites include binding sites of LOLA, EIP78C and REL. Three of each transcription factor binding site were multimerized and fused upstream to the promoter and individually injected to fly embryos. These reporter-containing flies were then crossed to the existing Elav-GAL4, UAS-FLP and UAS-ChR-XXL (not in controls) flies. (B) Luciferase levels of flies expressing the constructed reporters exposed to a 30 s LED stimulation recorded every 10–15 min for ~4 hr. Gray indicates luciferase levels of control flies expressing all the transgenes in (A) except for UAS-ChR2-XXL. Red indicates flies expressing all the transgenes in (A). The experimental and control flies were put in the same 96-well plate and stimulated and recorded in parallel. The 30 s LED exposure is indicated by the black bars below the graphs. N = 8 flies. Representative images of multiple biological replicates are shown. Shaded regions represent ±SD.
-
Figure 7—source data 1
Motif enrichment in the 5 kb upstream regions of ChR2-XXL-induced ARGs.
- https://doi.org/10.7554/eLife.19942.030
-
Figure 7—source data 2
Motif enrichment in the 1 kb upstream regions of ChR2-XXL-induced ARGs.
- https://doi.org/10.7554/eLife.19942.031
Figure 7—figure supplement 1
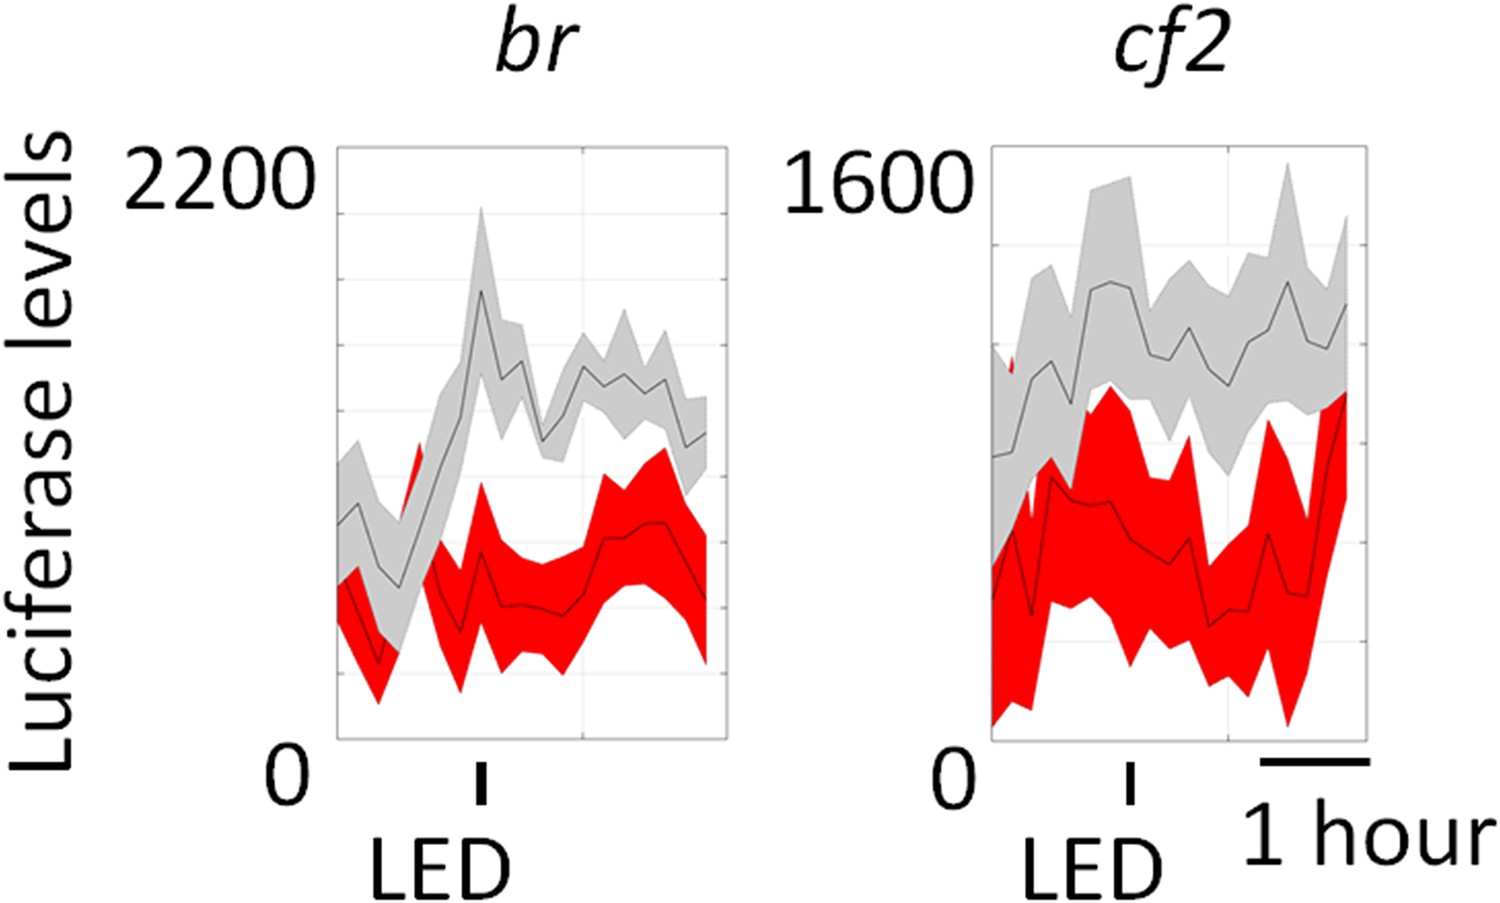
Luciferase reporters for br and cf2 show no change with LED stimulation in both experiment (red) and control (gray) flies.
The 30 s LED exposure is indicated by the black bars below the graphs. N = 8 flies. Shaded regions represent ±SD.
Figure 8

Fold changes distribution of all ARGs.
X-axis indicates fold changes (log2) at 60 or 90 (for KCl) min. Y-axis indicates the frequency of genes. ChR2-XXL indicates ChR2-XXL-induced ARGs. dTrpA1 (brains) indicates dTrpA1-induced genes in brains. KCl (60 min/90 min) indicates KCl-induced ARGs in 60 or 90 min. DA indicates dTrpA1-induced ARGs in DA neurons. PDF+ indicates dTrpA1-induced ARGs in PDF+ neurons.
Figure 9
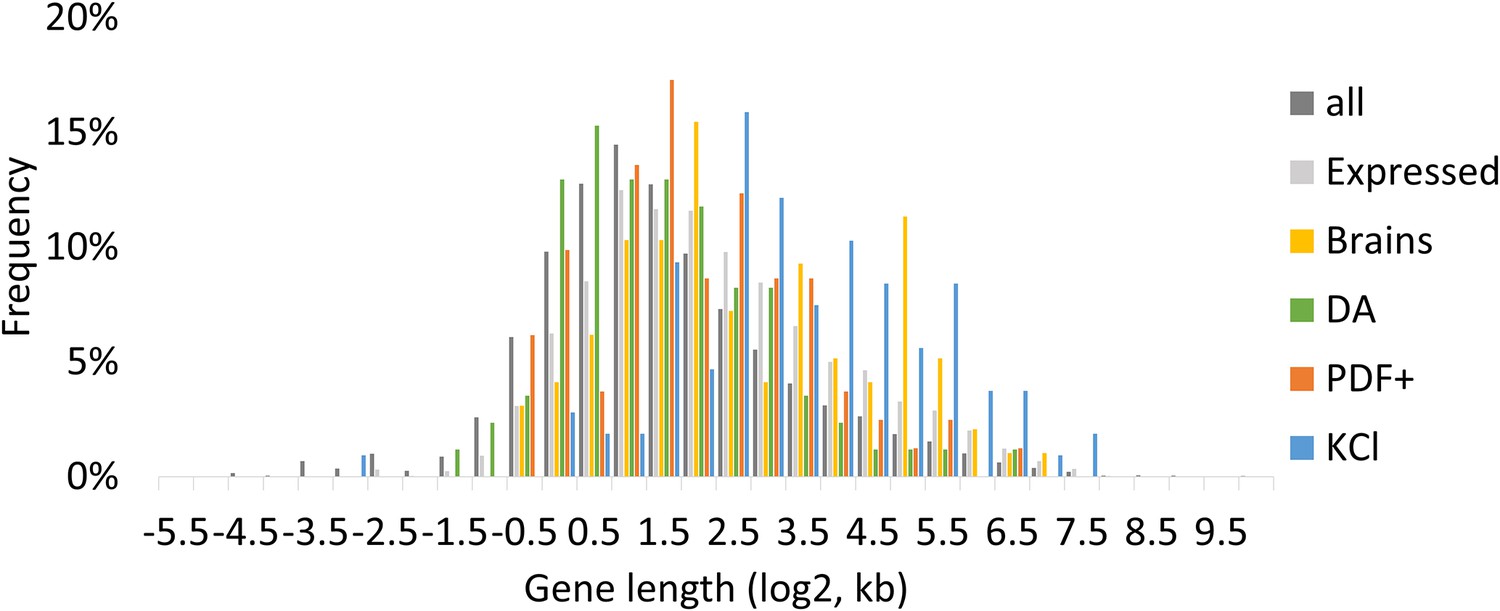
Gene length distribution of all annotated genes and ARGs.
All indicates all annotated genes. Expressed indicates genes with FPKM > 0 at baseline, FPKM > 10 with stimulation in brains. Brains indicate dTrpA1-induced ARGs in brains. DA indicates dTrpA1-induced ARGs in DA neurons. PDF+ indicates dTrpA1-induced ARGs in PDF+ neurons. KCl indicates KCl-induced ARGs in 90 min.
Videos
Video 1
S1 Live imaging of Arclight in PDF+ neurons in response to KCl treatment.
To show KCl treatment can successfully depolarize neurons, Arclight was artificially expressed in PDF+ neurons (Pdf-GAL4;UAS-ArcLight). Arclight signal was monitored with fluorescent microscope while KCl was perfused into the chamber containing a dissected brain. Quantification of fluorescent intensity is shown in Figure 3—figure supplement 1.
Tables
Table 1
Gene ontology analysis on dTrpA1-induced ARGs in different tissues with GOrilla.
Functions | p-value | Genes | |
|---|---|---|---|
Brains | Steroid hormone receptor activity | 0.000536 | 3 |
DA | Imaginal disc growth factor receptor binding | 0.000843 | 4 |
PDF+ | Organic anion transmembrane transporter activity | 0.000742 | 5 |
Additional files
-
Supplementary file 1
Supplementary tables.
(A) Primers for qPCR validation. (B) Primers for reporter generation
- https://doi.org/10.7554/eLife.19942.036
Download links
A two-part list of links to download the article, or parts of the article, in various formats.
Downloads (link to download the article as PDF)
Open citations (links to open the citations from this article in various online reference manager services)
Cite this article (links to download the citations from this article in formats compatible with various reference manager tools)
Genome-wide identification of neuronal activity-regulated genes in Drosophila
eLife 5:e19942.
https://doi.org/10.7554/eLife.19942


