Disordered clusters of Bak dimers rupture mitochondria during apoptosis
- The Walter and Eliza Hall Institute of Medical Research, Australia
- The University of Melbourne, Australia
Figures
Figure 1 with 3 supplements

Following oligomerisation, the Bak N-segment, α1 and α1-α2 loop become fully solvent-exposed in contrast to the partially exposed core (α2-α5) and latch (α6-α9).
(A) Solvent exposure of hBak cysteine mutants was assessed by IASD labelling before (lane 2), during (lane 3) and after (lane 4) treatment with tBid. Controls of unlabelled (untreated, lane 1) and fully labelled (denatured, lane 5) Bak were included for comparison. Example IEF western blots are shown. (B) Quantitation of IASD labelling before and after treatment with tBid for the panel of previously untested Bak residues. Data are mean ± SD (n ≥ 3), or range (n = 2), with n for each residue labelled on the x-axis. IASD labelling data for residue V194C were from (Westphal et al., 2014) (denoted #). Residues for which there is a significant difference in IASD labelling before versus after tBid are in bold and underlined (p<0.05). (C) Heat map overview of Bak IASD labelling with tBid treatment from (B) pooled with published analyses from (Westphal et al., 2014)(denoted #) or (Iyer et al., 2015)(denoted ^ ) and from treatment with the tBidBax chimera (denoted *; see also Figure 1—figure supplement 3; Figure 1—source data 1). (D) Schematic of Bak structural rearrangement from its non-activated monomeric state to the activated dimer. Helices are numbered for the non-activated Bak. Note the complete solvent-exposure of α1 and the α1-α2 loop in the activated dimer. The following figure supplements are available for Figure 1.
-
Figure 1—source data 1
Quantitation of Bak IASD labelling before, during and after Bak activation; table of values.
The percentage IASD labelling for each replicate and the summary statistics (number of replicates, mean, standard deviation) are shown. Two-tailed unpaired t-tests comparing the mean percentage of IASD labelled Bak (before versus after, before versus during, and during versus after tBid treatment) are shown, and significant p-values (p<0.05) are highlighted in green. Previously untested Bak residues have been pooled with data from previous studies (# denotes data from Westphal et al. [2014], ^ denotes data from Iyer et al. [2015]).
- https://doi.org/10.7554/eLife.19944.004
Figure 1—figure supplement 1
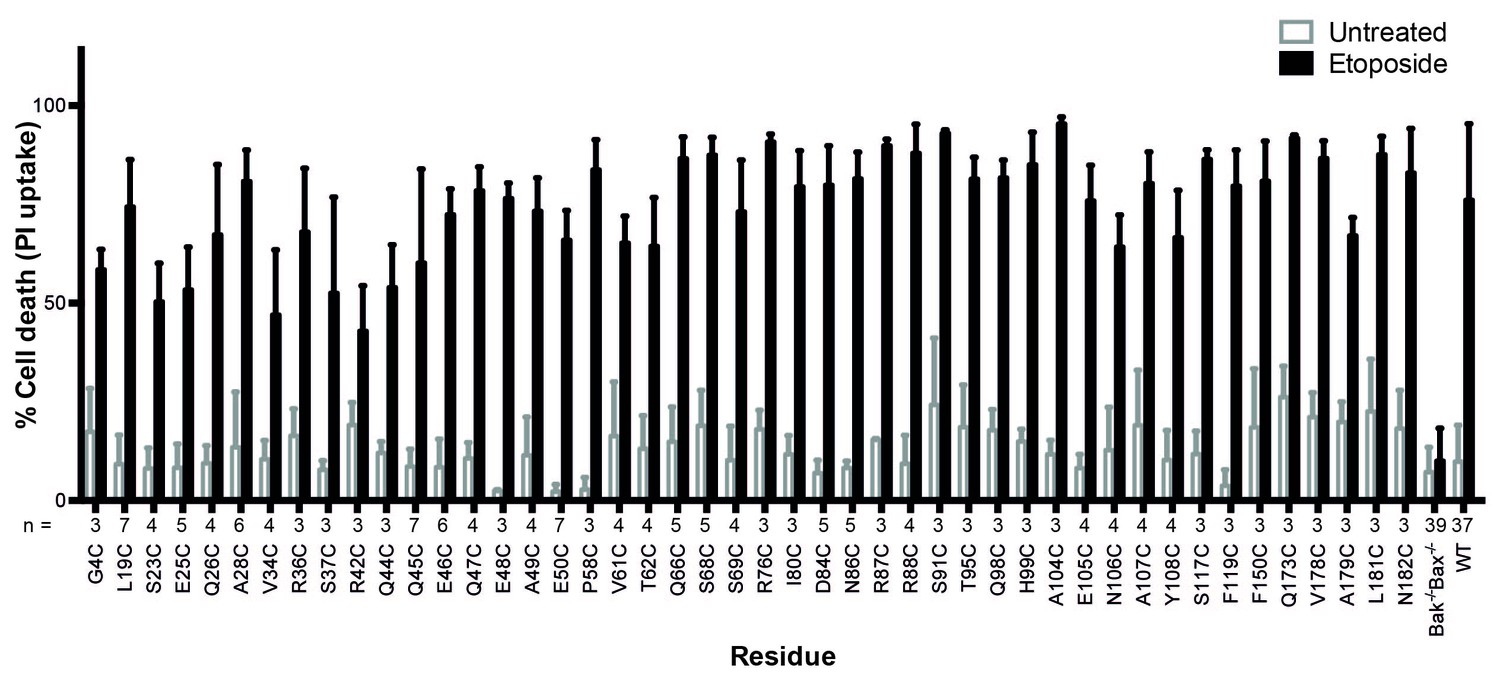
Bak cysteine variants retain apoptotic function.
Bak-/-Bax-/- MEF expressing Bak cysteine variants were treated with 10 μM etoposide for 24 hr and the percentage cell death quantified by propidium iodide uptake. Data are for unpublished mutants only and are the mean ± SD. The number of replicates (n) for each residue is labelled on the x-axis.
Figure 1—figure supplement 2
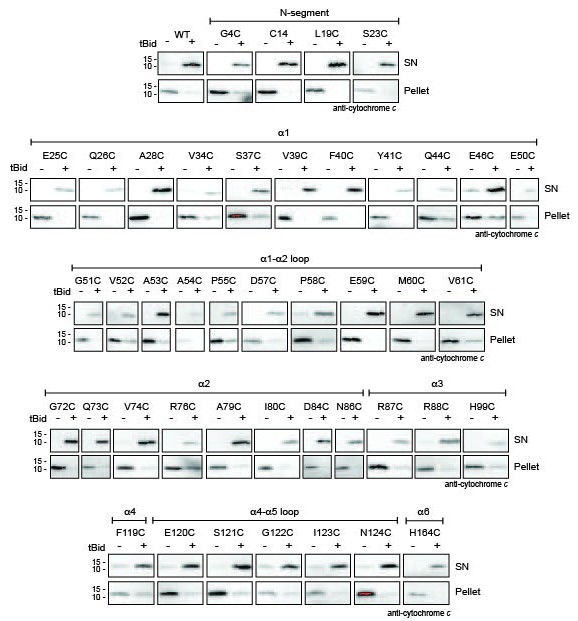
Bak cysteine variants retain apoptotic function in response to tBid.
Mitochondrial fractions from cells expressing the indicated Bak cysteine mutants were incubated with tBid, and samples fractionated to measure Bak-mediated release of cytochrome c from the pellet into the supernatant (SN). This data shows that cell killing in response to etoposide (Figure 1—figure supplement 1) correlates with cytochrome c release initiated by tBid.
Figure 1—figure supplement 3
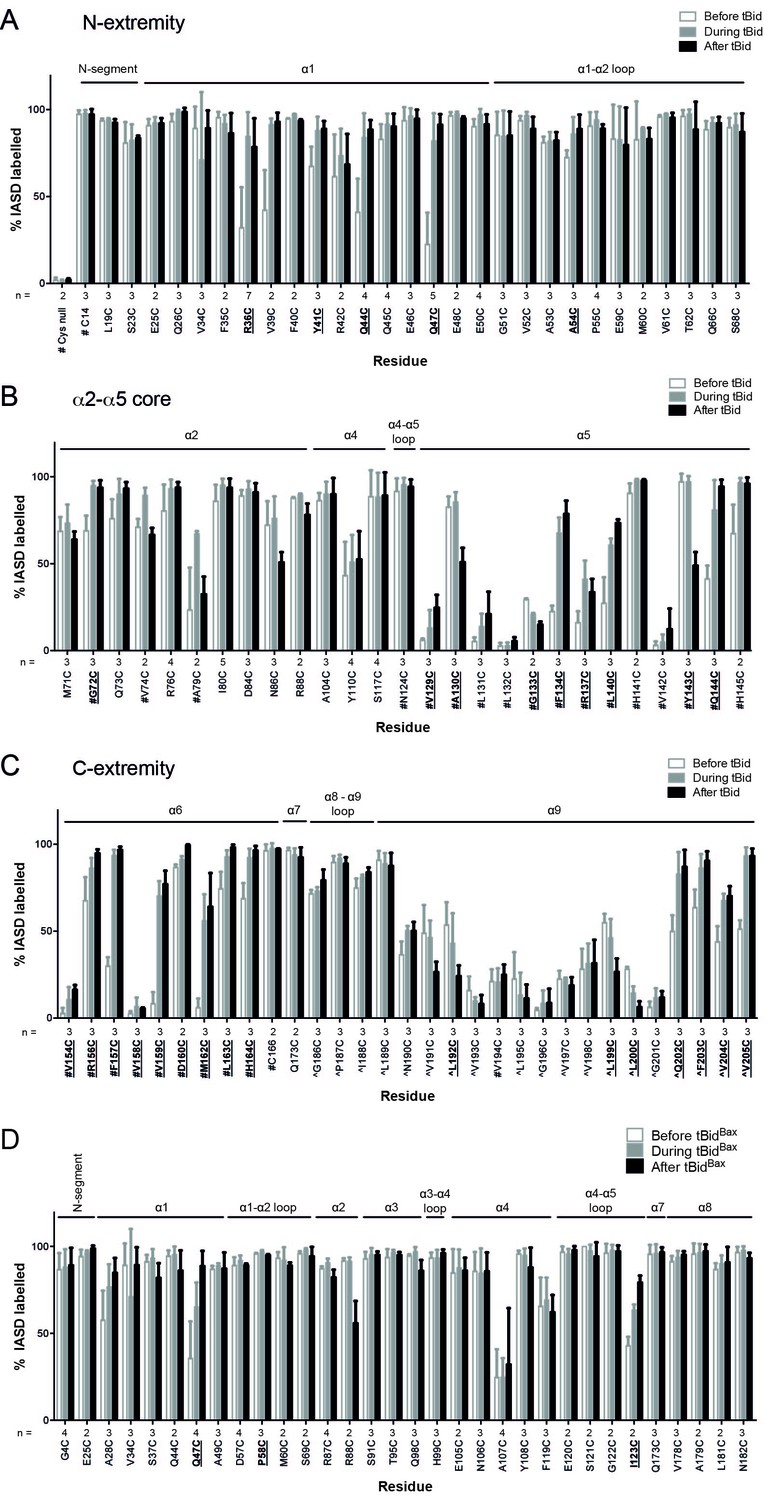
Quantitation of Bak IASD labelling before, during and after Bak activation; graphical output.
(A,B,C). Labelling before, during or after treatment with tBid, segregated by Bak N-extremity (A), Core (B), and C-extremity (C). Previously untested Bak residues have been pooled with data from previous studies (# denotes data from Westphal et al. [2014], ^ denotes data from Iyer et al. [2015]). Data are mean ± SD, or range (n = 2), with n for each residue labelled on the x-axis. Residues for which there is a significant difference in IASD labelling before versus after tBid are in bold and underlined (p<0.05). (D) IASD labelling for selected Bak variants before, during and after treatment with tBidBax chimera (Hockings et al., 2015). Data are mean ± SD, or range (n = 2), with n for each residue labelled on the x-axis. Residues for which there is a significant difference in IASD labelling before versus after tBid are in bold and underlined (p<0.05).
Figure 2 with 1 supplement
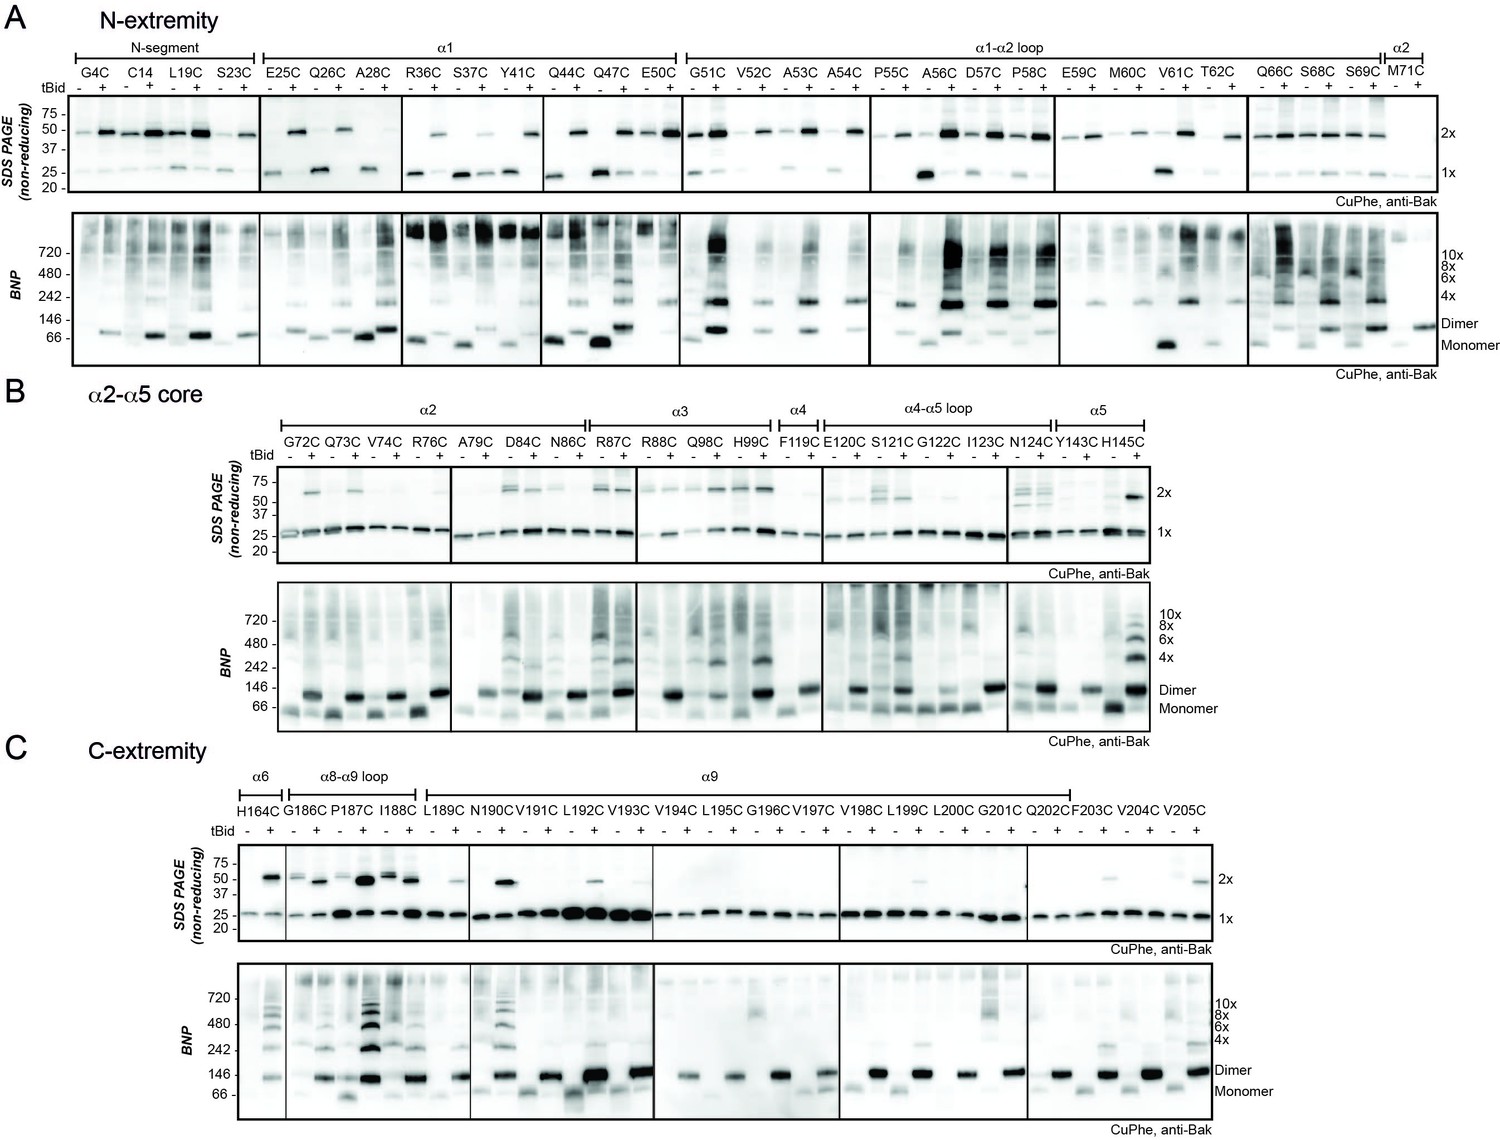
The N- and C-extremities of oligomerised Bak are mobile relative to the α2-α5 core dimer.
Mitochondrial fractions from cells expressing the indicated Bak cysteine mutants were incubated with tBid to oligomerise Bak, and oxidant (CuPhe) added to induce disulphide bonds. Aliquots were analyzed by non-reducing SDS PAGE (upper panels) and BNP (lower panels), and immunoblotted for Bak to detect linked species. Data are representative of at least two biological replicates. (A) Cysteine linkage occurs throughout the N-extremity. (B) Cysteine linkage occurs, but is less complete, in the α2-α5 dimer core. (C) Cysteine linkage occurs in the C-extremity. (See also α6:α6 linkage in Dewson et al. [2008] and α9:α9 linkage in Iyer et al. [2015]).
Figure 2—figure supplement 1
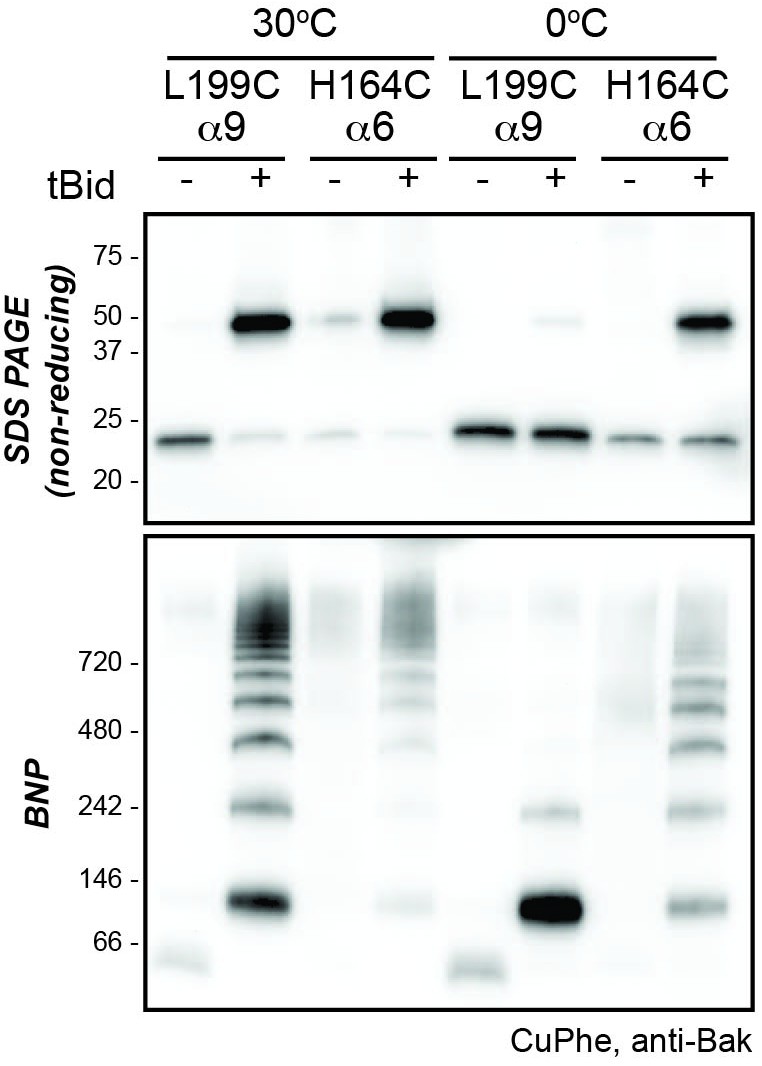
Higher temperature enhances disulphide bonding of cysteine residues in α6 (H164C) and the α9 transmembrane domain (L199C).
Mitochondrial fractions from cells expressing the indicated Bak cysteine mutants were incubated with tBid to oligomerise Bak, and oxidant (CuPhe) added to induce disulphide bonds. Samples were incubated with CuPhe for 15 min either at 0°C or at 30°C. Aliquots were analyzed by non-reducing SDS PAGE (upper) and BNP (lower), and immunoblotted for Bak to detect linked species. Note that linkage outside the membrane (H164C:H164C') was efficient even at 0°C. Data are representative of two biological replicates.
Figure 3 with 1 supplement
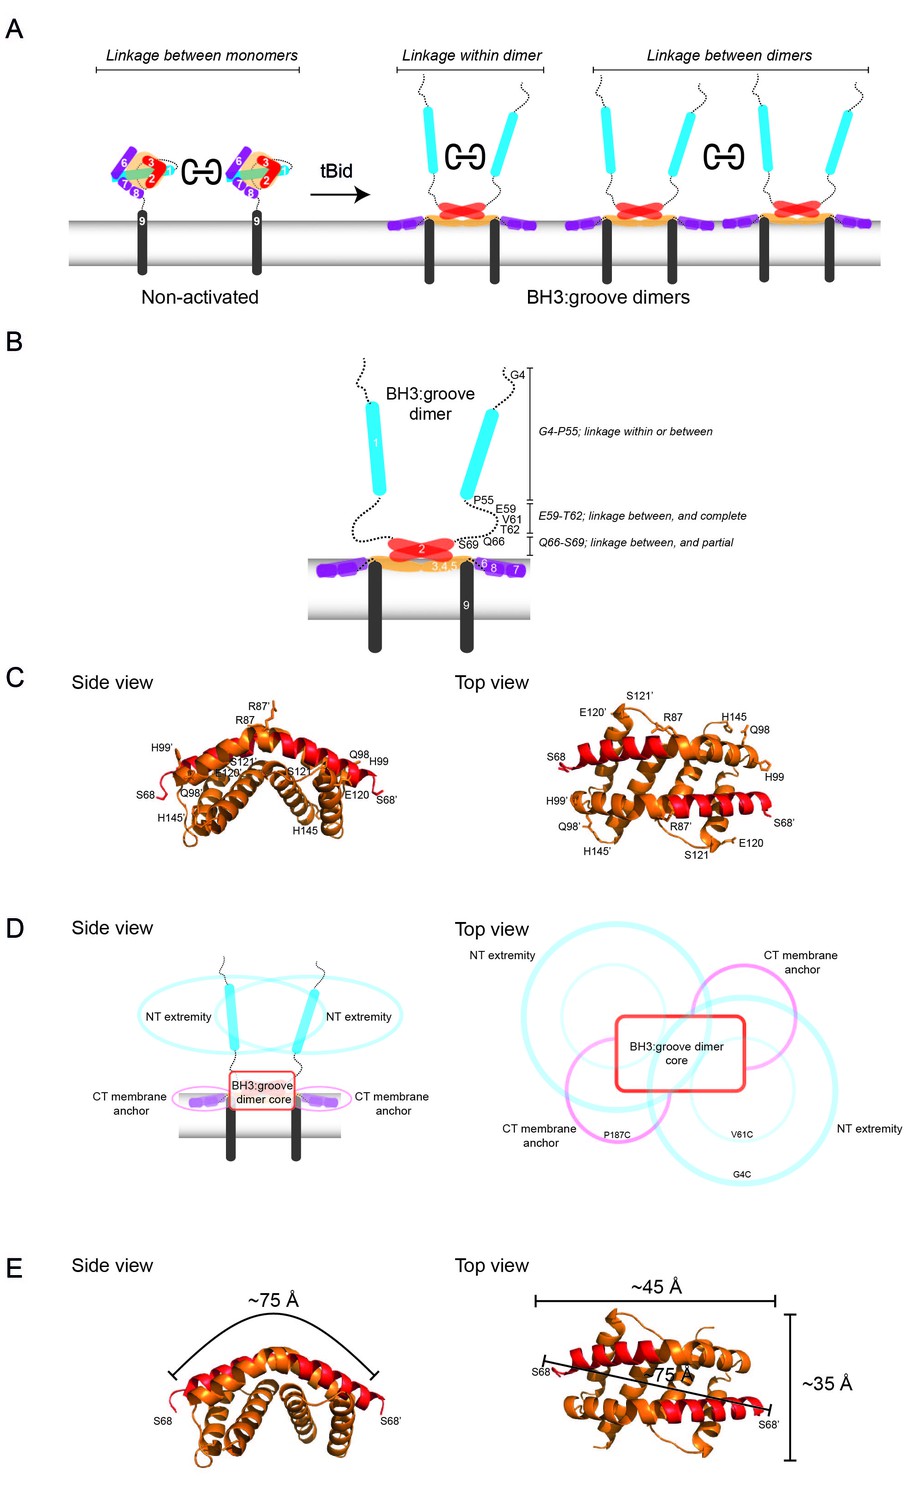
Linkage constraints for different regions of the active Bak dimer support a flexible extremity model for full-length Bak dimers in the MOM.
(A) The oxidant CuPhe induces linkage between Bak monomers, and within or between Bak dimers. Correlation of BNP with non-reducing SDS PAGE can differentiate linkage within and between dimers. (B) Summary of linkage outcomes within or between dimers for residues in the Bak dimer N-extremity. (C) Linkage at the lateral corners of the Bak α2-α5 core dimer is highlighted with residue labels and sticks on the crystal structure (4U2V) [Brouwer et al., 2014]). (D) Schematic of a dimer of activated Bak at the membrane in side and top views. The range of movement of the N- and C-extremities is indicated with coloured ovals (blue and pink respectively). (E) Our linkage data are consistent with the dimensions of the Bak core dimer. The dimensions of the Bak α2-α5 core dimer (4U2V (Brouwer et al., 2014) are shown in side view and top view. In the crystal structure, the distance from one edge of the core at S68 over the bended structure of the symmetric core dimer to the opposing S68’ is ~75 Å. Thus, for residues in the mobile N-extremity to link within the core dimer, the two homotypic cysteine residues must bridge a distance of ~75 Å. This is not feasible for the residue V61C which is ~30 Å from the symmetric core.
Figure 3—figure supplement 1
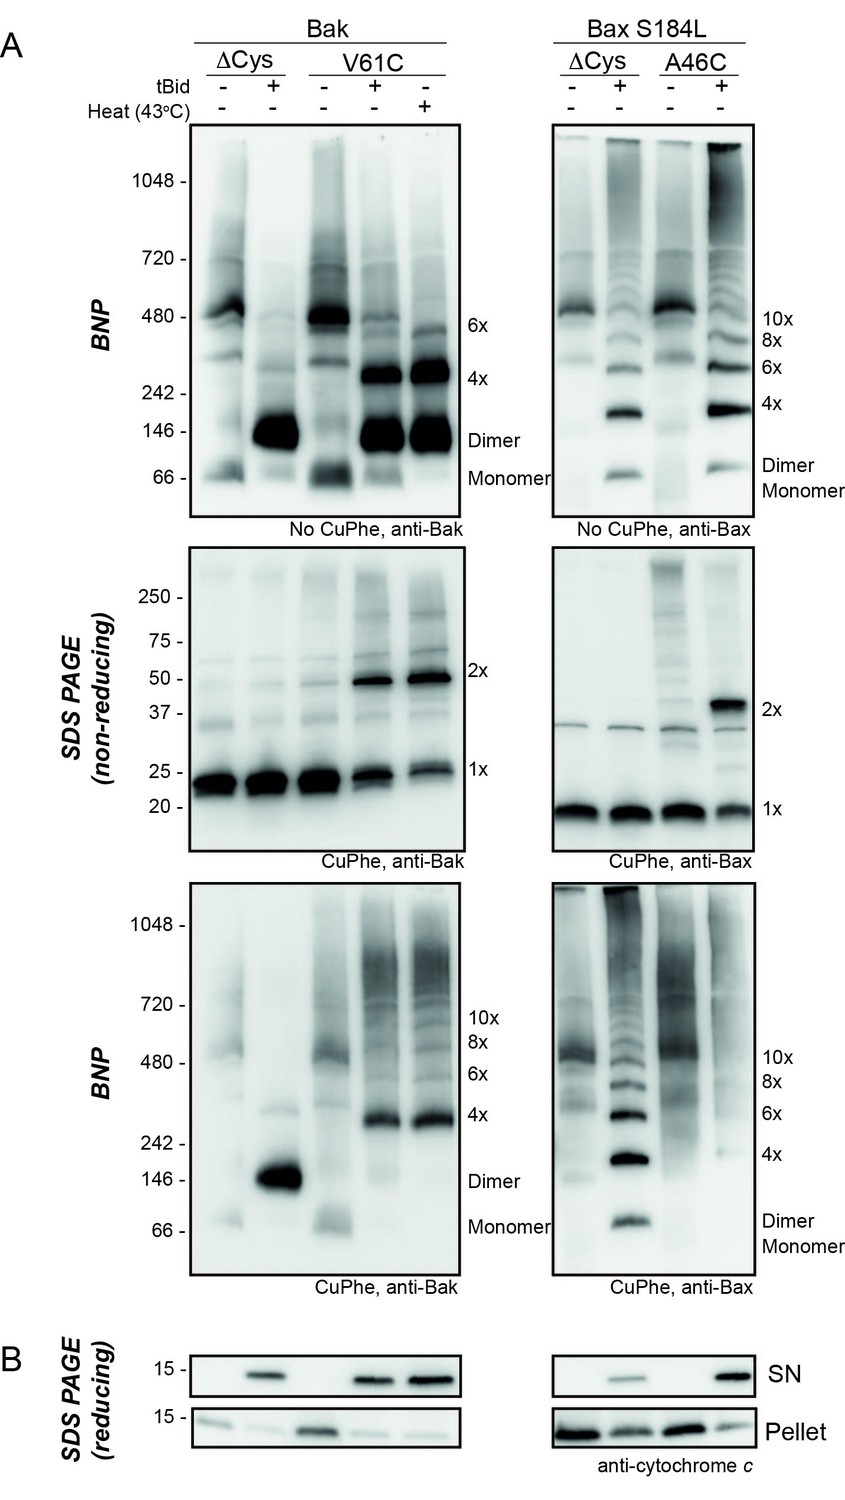
Bak V61C linkage is generalisable to a heat stimulus and to the linkage of the equivalent Bax A46C residue.
(A) Mitochondrial fractions from cells expressing the indicated cysteine variants were incubated with tBid (or heated to 43°C) to oligomerise Bak, or Bax, and oxidant (CuPhe) added to induce disulphide bonds where indicated. Aliquots were analyzed by BNP, non-reducing SDS PAGE, and immunoblotted for Bak or Bax. Variants lacking cysteines (Cys null) were included to show the altered migration of Bak and Bax complexes on BNP in the absence of disulphide bond formation. Data are representative of at least two biological replicates. Note that in the left panels, Bak V61C exhibits the same CuPhe linkage pattern with both tBid (lane 4) and heat treatment (lane 5). In the right panels, linkage between A46C in a mitochondrial form of Bax efficiently links between dimers. Bax S184L/A46C is a Bax variant that is constitutively membrane localised (due to the hydrophobic substitution of S184L in the transmembrane domain [Nechushtan et al., 1999; Fletcher et al., 2008]) with a N-terminal cysteine substitution (A46C) analogous to Bak V61C. Bax exhibits laddering on BNP in the absence of CuPhe treatment, but addition of CuPhe induces efficient linkage between Bax dimers at residue A46C, resulting in the disappearance of dimers and appearance of high molecular weight complexes on BNP (lane 9). Thus, we predict Bax dimers exhibit similar flexible extremity characteristics as Bak dimers at the MOM. (B) Pellet and supernatant fractions were further analysed for cytochrome c release, and confirmed each variant was responsive to tBid (and heat treatment in the case of Bak V61C). Data are representative of at least two biological replicates.
Figure 4
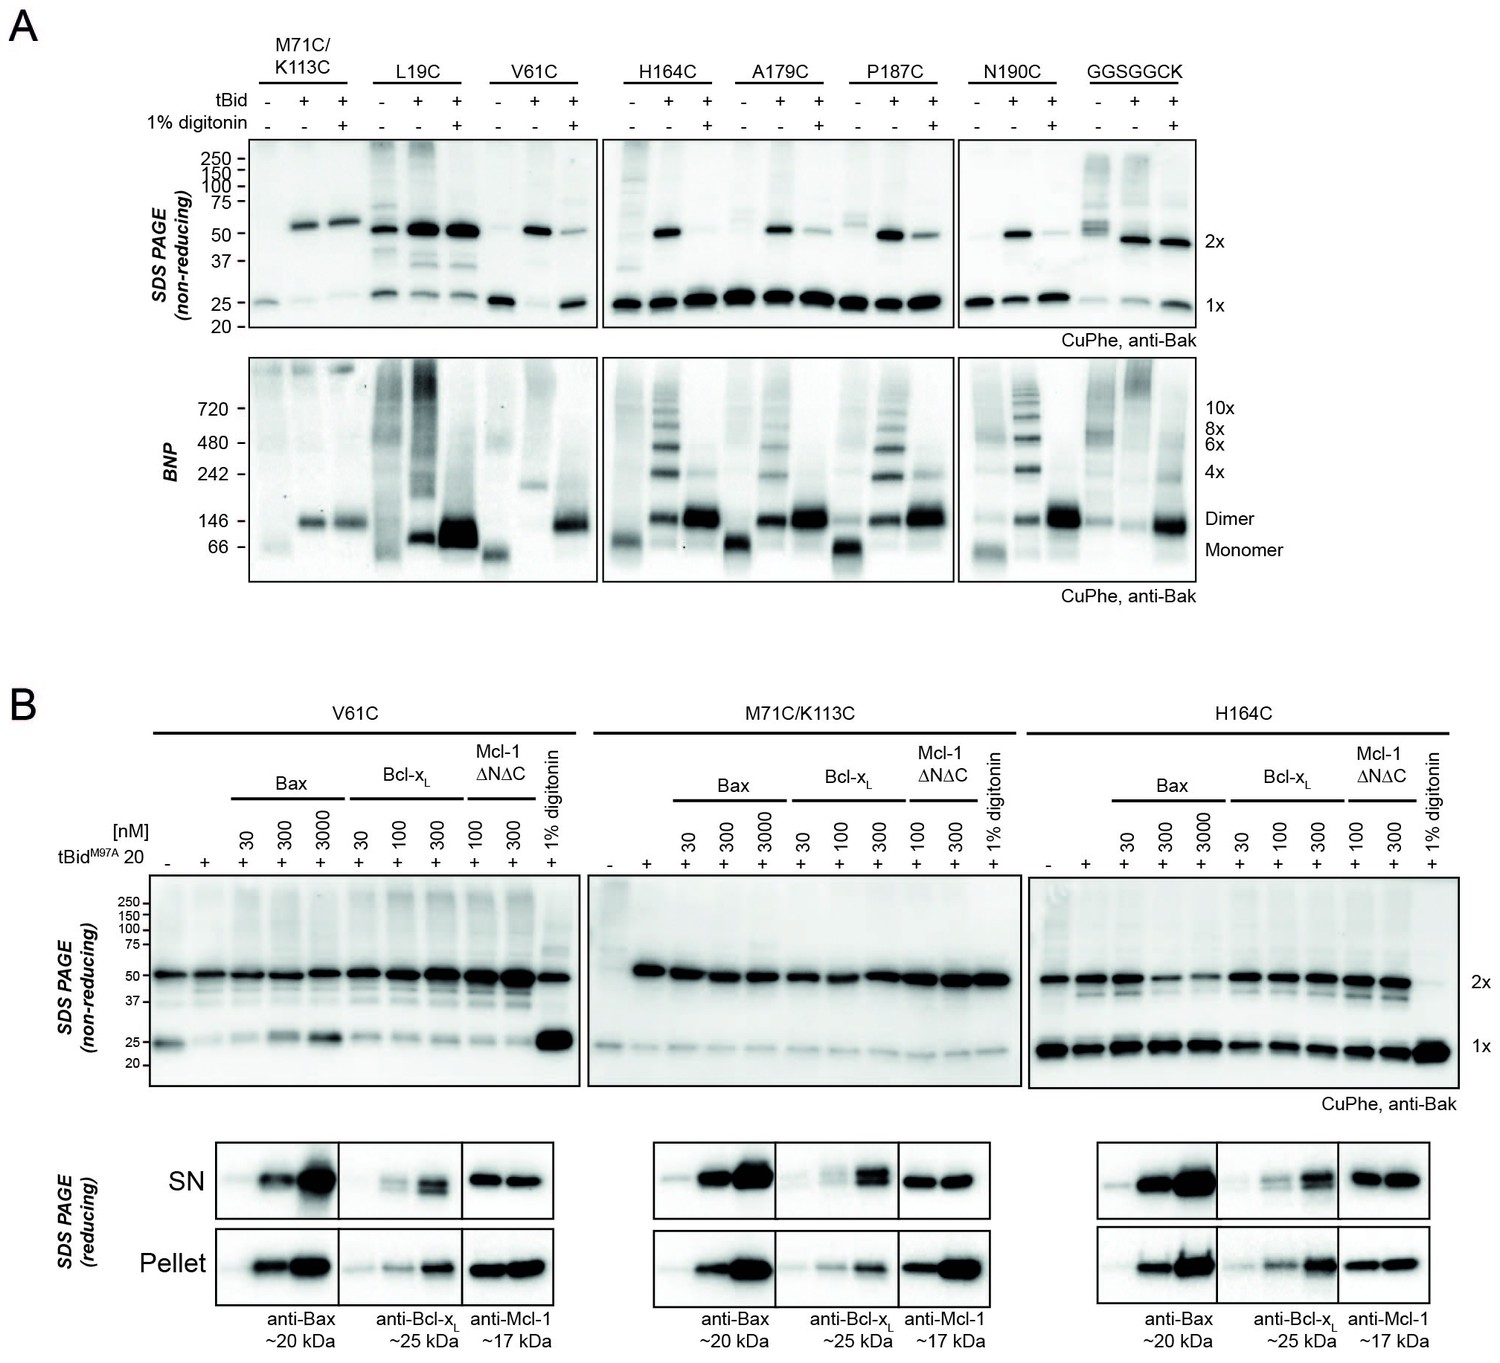
Bak dimer-dimer interactions are disrupted by detergent or Bax.
(A) Digitonin prevents linkage between Bak dimers. Membrane fractions expressing the indicated Bak single-cysteine variants were first treated with tBid, and then supplemented, as indicated, with detergent (1% digitonin) prior to cysteine linkage. Two additional mutants were included to show linkage within dimers at the BH3:groove interface (M71C/K113C) and at extensions to the C-terminus (GGSGGCK). Data are representative of two biological replicates. (B) Bax can disrupt Bak dimer-dimer association. Membrane fractions first treated with tBidM97A were then incubated, as indicated, with Bax, Bcl-xL, Mcl-1ΔN151ΔC23 or digitonin prior to cysteine linkage (upper panels). Supernatant and pellet fractions showed partial localisation of each recombinant protein to the membrane fraction (lower panels). Data are representative of three biological replicates.
Figure 5
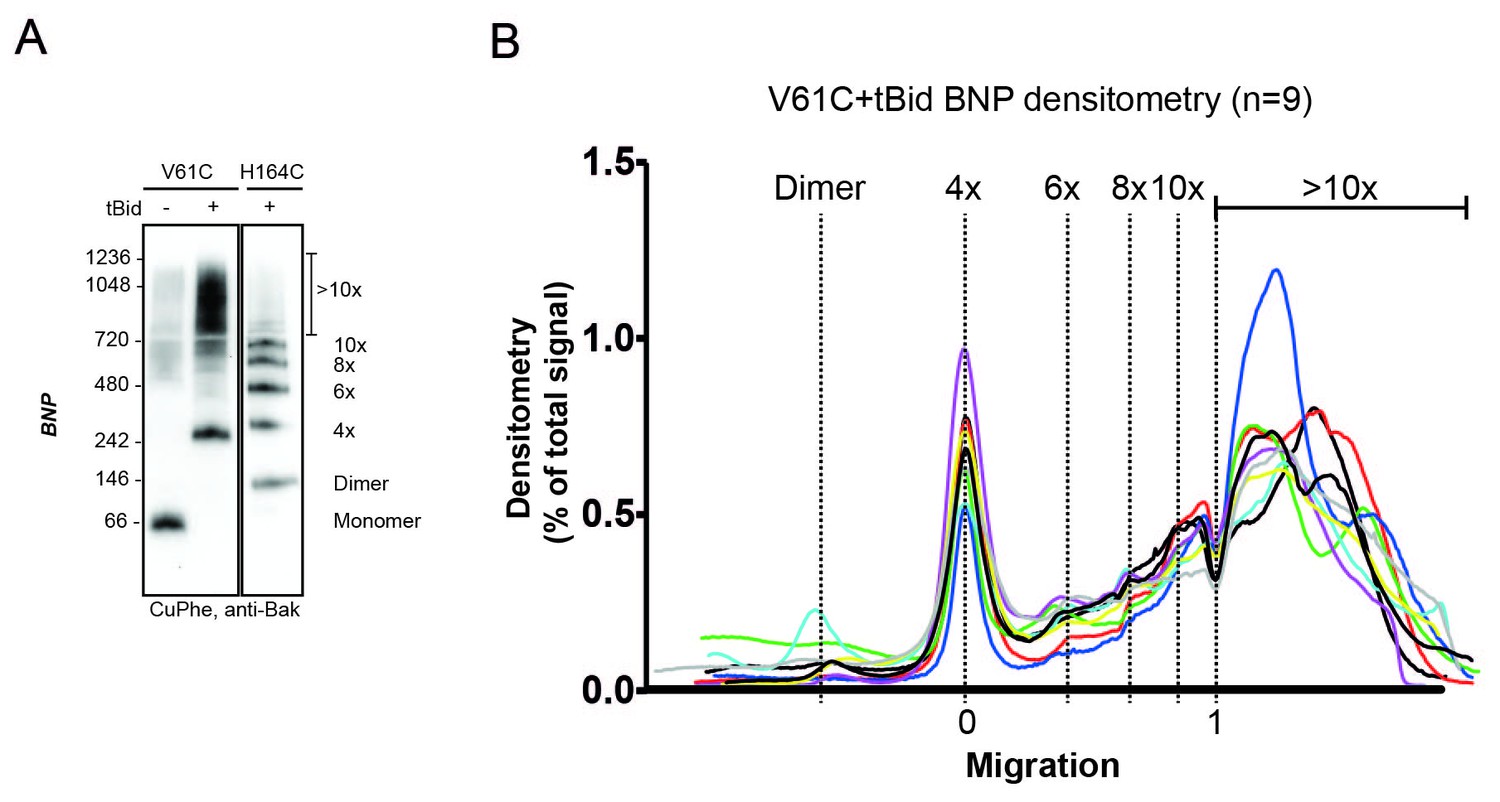
V61C:V61C' linkage is a marker of dimer-dimer interaction.
(A) BNP analysis of V61C:V61C' linkage revealed no dimers, and a high proportion of 4x and >10x species. In contrast, H164C:H164C’ linkage revealed a ladder of linked species. Data are representative of nine biological replicates. (B) Densitometry of V61C:V61C' BNP linkage in Bak oligomers shows negligible dimers but reproducible linked species at 4x, 6x, 8x, and 10x, and a large population of species > 10x. Densitometry data (n = 9) were normalised to the area under the curve after alignment as described in Materials and Methods. To correct for small variations in electrophoretic migration, we employed a noise reduction algorithm in which the 4x peak (0) and a minima at ~720 kDa (1) were aligned between replicates.
Figure 6 with 4 supplements
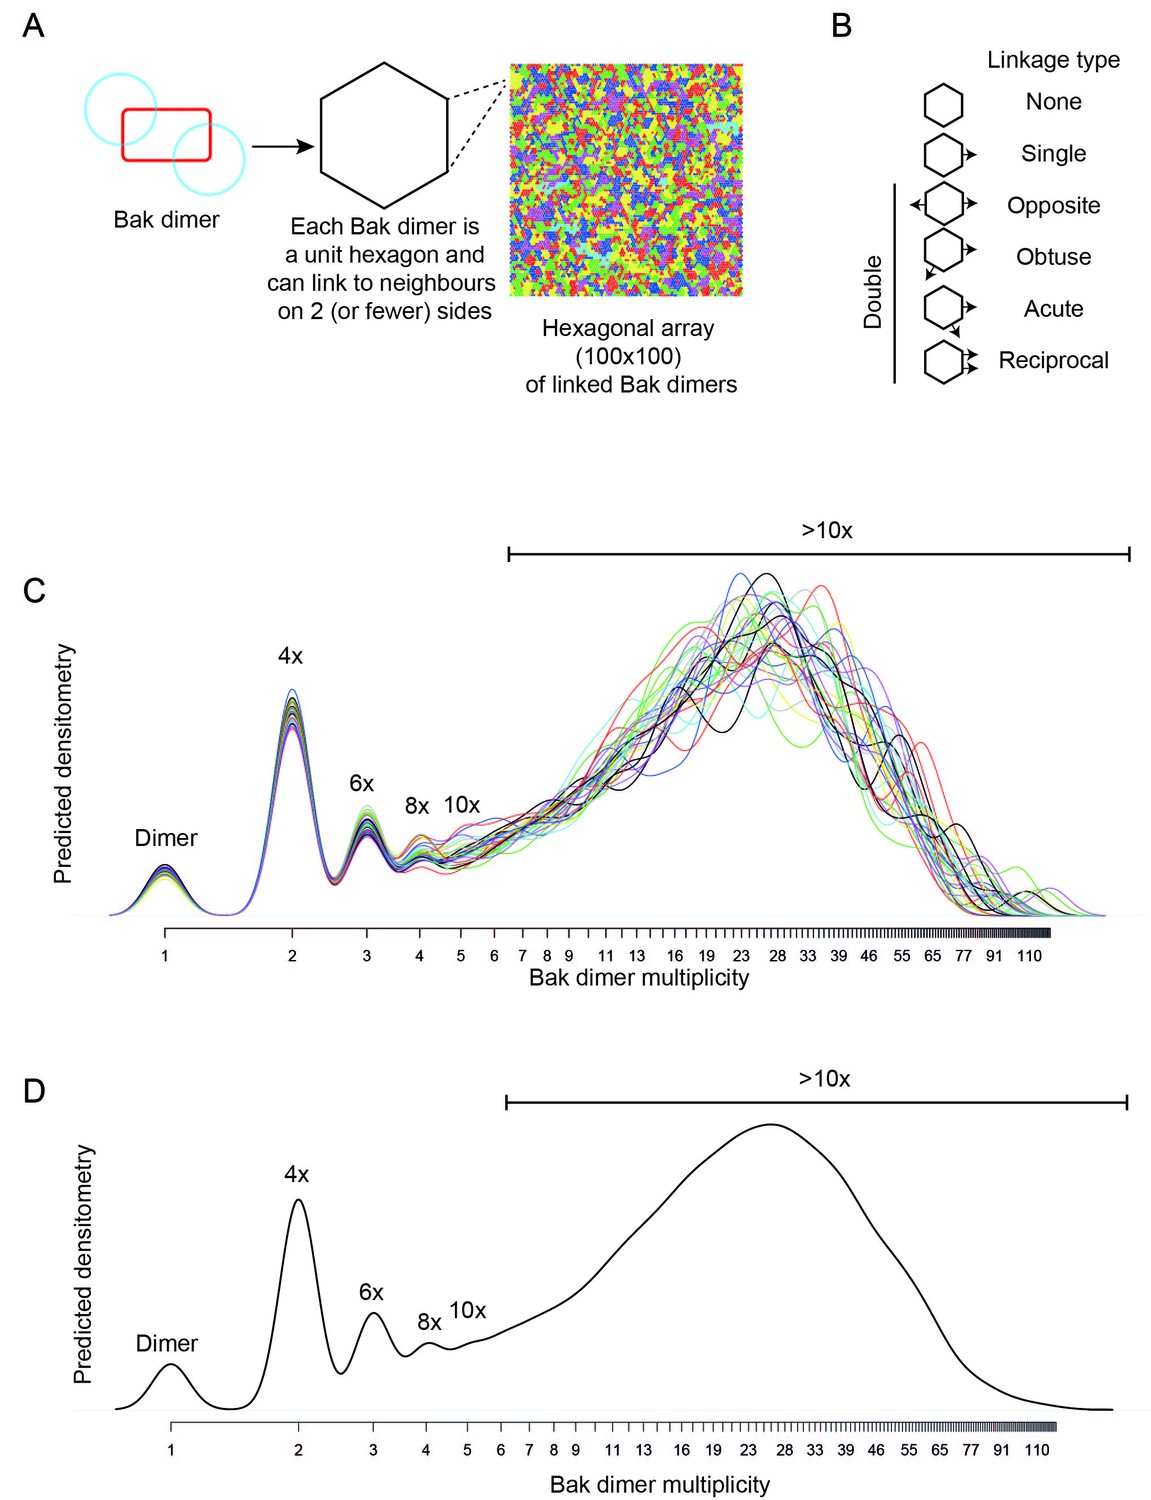
Bak dimer arrangement examined by two-dimensional stochastic simulations: a random arrangement successfully models the V61C:V61C’ BNP linkage densitometry.
(A) A grid of 100 × 100 was designated for the 2D simulations. Each unit hexagon within that grid represented a Bak dimer, with the capacity to link to two neighbouring hexagons. The direction of linkage from each hexagon was randomised. An example visual output from a 100 × 100 hexagonal array is shown: neighbouring subsets of linked Bak dimers within the grid are delineated by different colours. (B) Linkage possibilities between each dimer unit in a hexagonal 2D array. (C,D) Overlay (C), and average (D) of 30 predicted densitometry plots.
Figure 6—figure supplement 1
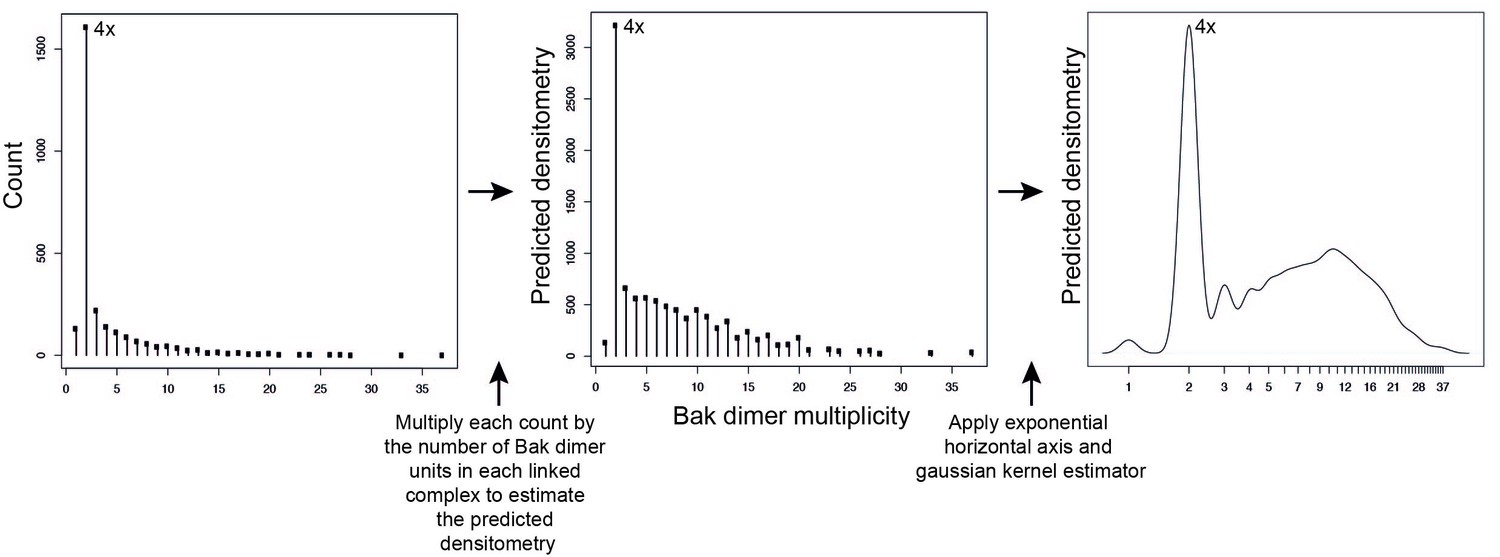
Adjustment to simulation output to allow qualitative comparison to western blot data.
Mathematical simulations of Bak dimer linkage generated frequency distributions of the size of Bak complexes (multiples of Bak dimers). These frequency distributions were then transformed to a predicted densitometry by multiplying each count by the number of Bak dimer units present in each linked Bak complex. For instance, the count representing 2x complexes, is multiplied by 1, the count representing 4x complexes is multiplied by 2, the count representing 6x complexes is multiplied by 3, etc. This predicted densitometry approximates the total relative abundance of Bak molecules in each linked Bak complex, which was then transformed with an exponential horizontal axis to mimic the nonlinear spacing of bands, and a kernel estimator to approximate the smearing of bands (especially at higher molecular weights) to allow qualitative comparison to western blot densitometry outputs.
Figure 6—figure supplement 2
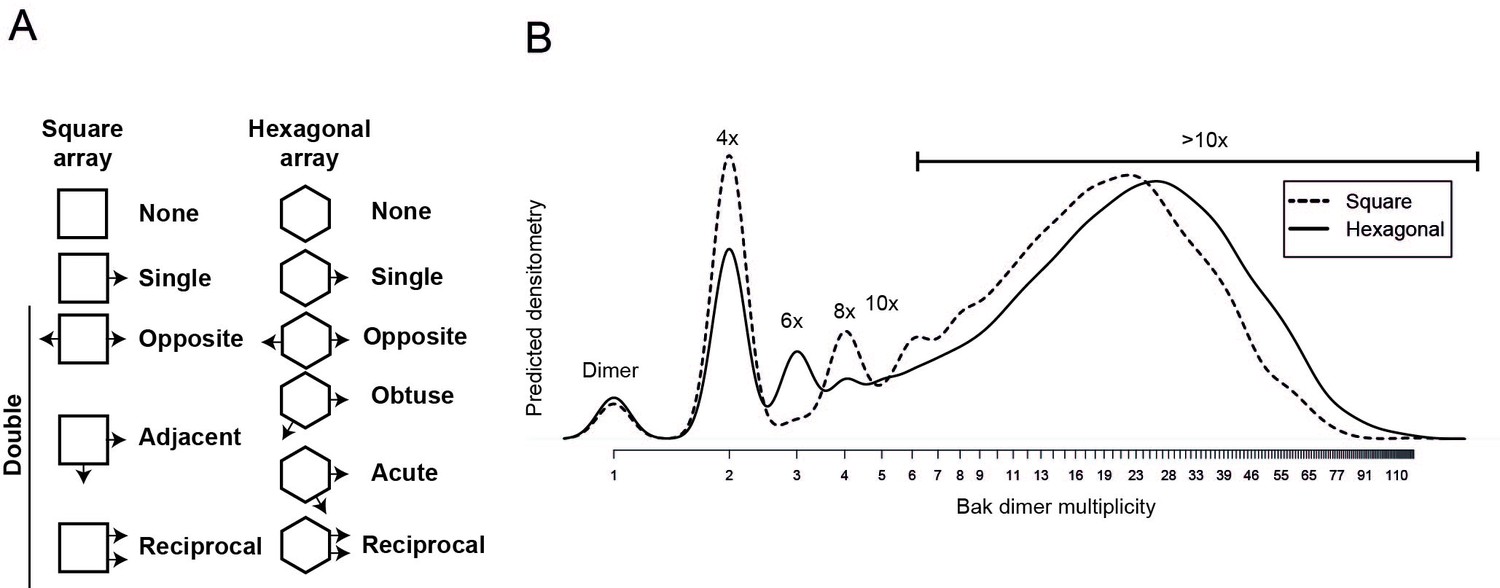
Comparison of 2D simulation using a square or hexagonal array reveals that either geometry offers a reasonable fit for the empirical data.
(A) Linkage possibilities are slightly greater in a hexagonal than in a square 2D array. (B) A slight reduction in the size of complexes with the square simulation is consistent with the reduced degrees of freedom using the square geometry compared to the hexagonal geometry.
Figure 6—figure supplement 3
2D simulation with reduced efficiency linkage successfully models reduced linkage in mitochondrial experiments.
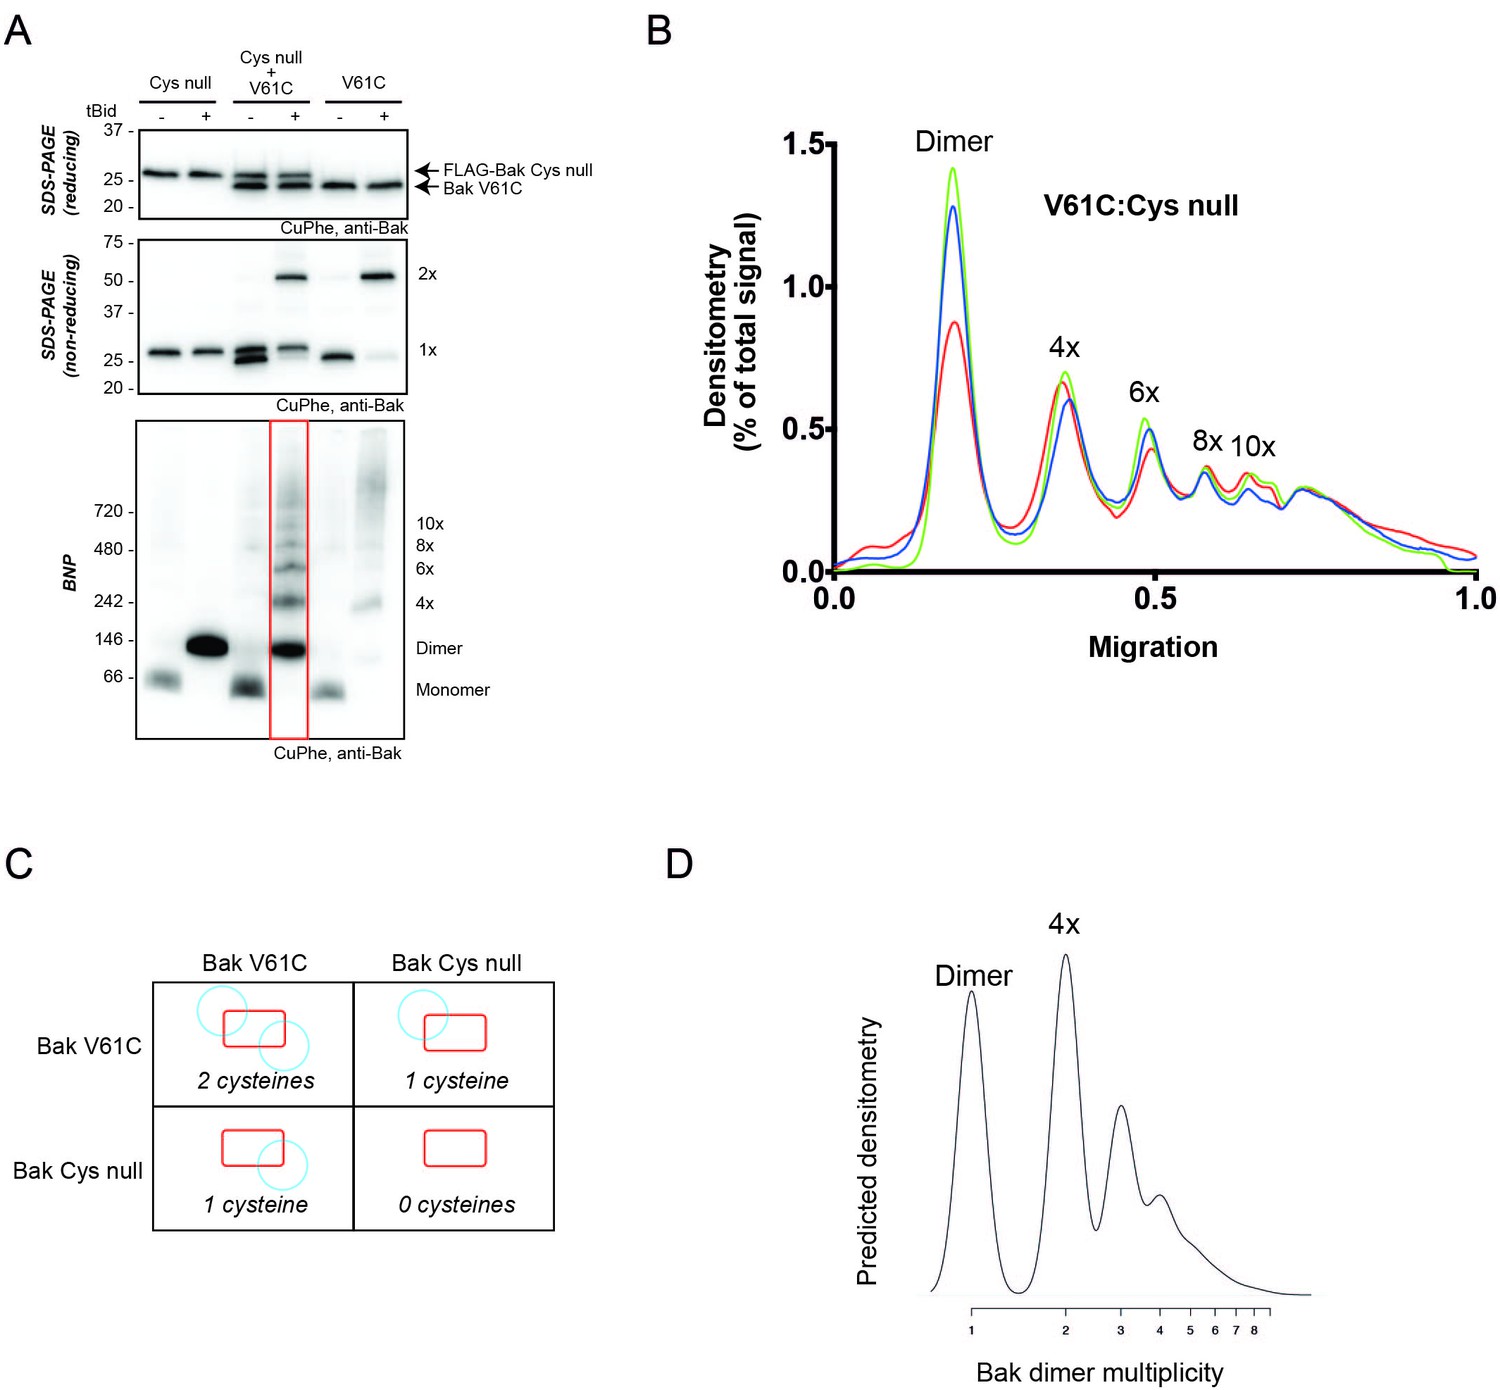
(A) Co-expression of Bak V61C with Bak Cys null resulted in less high order linkage species on BNP. Membrane fractions expressing Bak V61C, FLAG-Cys null, or both, were incubated with or without tBid, and then subjected to CuPhe linkage and analysis by BNP, non-reducing SDS PAGE or reducing SDS PAGE. Data are representative of three biological replicates. Note that the greatly reduced V61C linkage in the presence of Bak Cys null also indicates that most linked species in the V61C cells involve Bak and not some other protein. (B) Densitometry of BNP linkage data following tBid treatment for 3 replicates of the V61C:Flag-Cys null co-expression. Data are normalised to the area under the curve. (C) Diagram showing the four types of dimers that would form upon co-expression of V61C and Cys null variants of Bak (i.e. a system in which 50% of Bak molecules are unable to link). Note that dimers will be capable of 0, 1 or 2 linkages. (D) The 2D simulation was altered to incorporate 50% linkage-incompetent Bak molecules. This simulation yielded a good concordance with the V61C:Flag Cys null densitometry.
Figure 6—figure supplement 4
2D simulation with edge blocking probability successfully models mitochondrial experiments in which Bak linkage becomes constrained as cysteines are positioned closer to the dimer core.
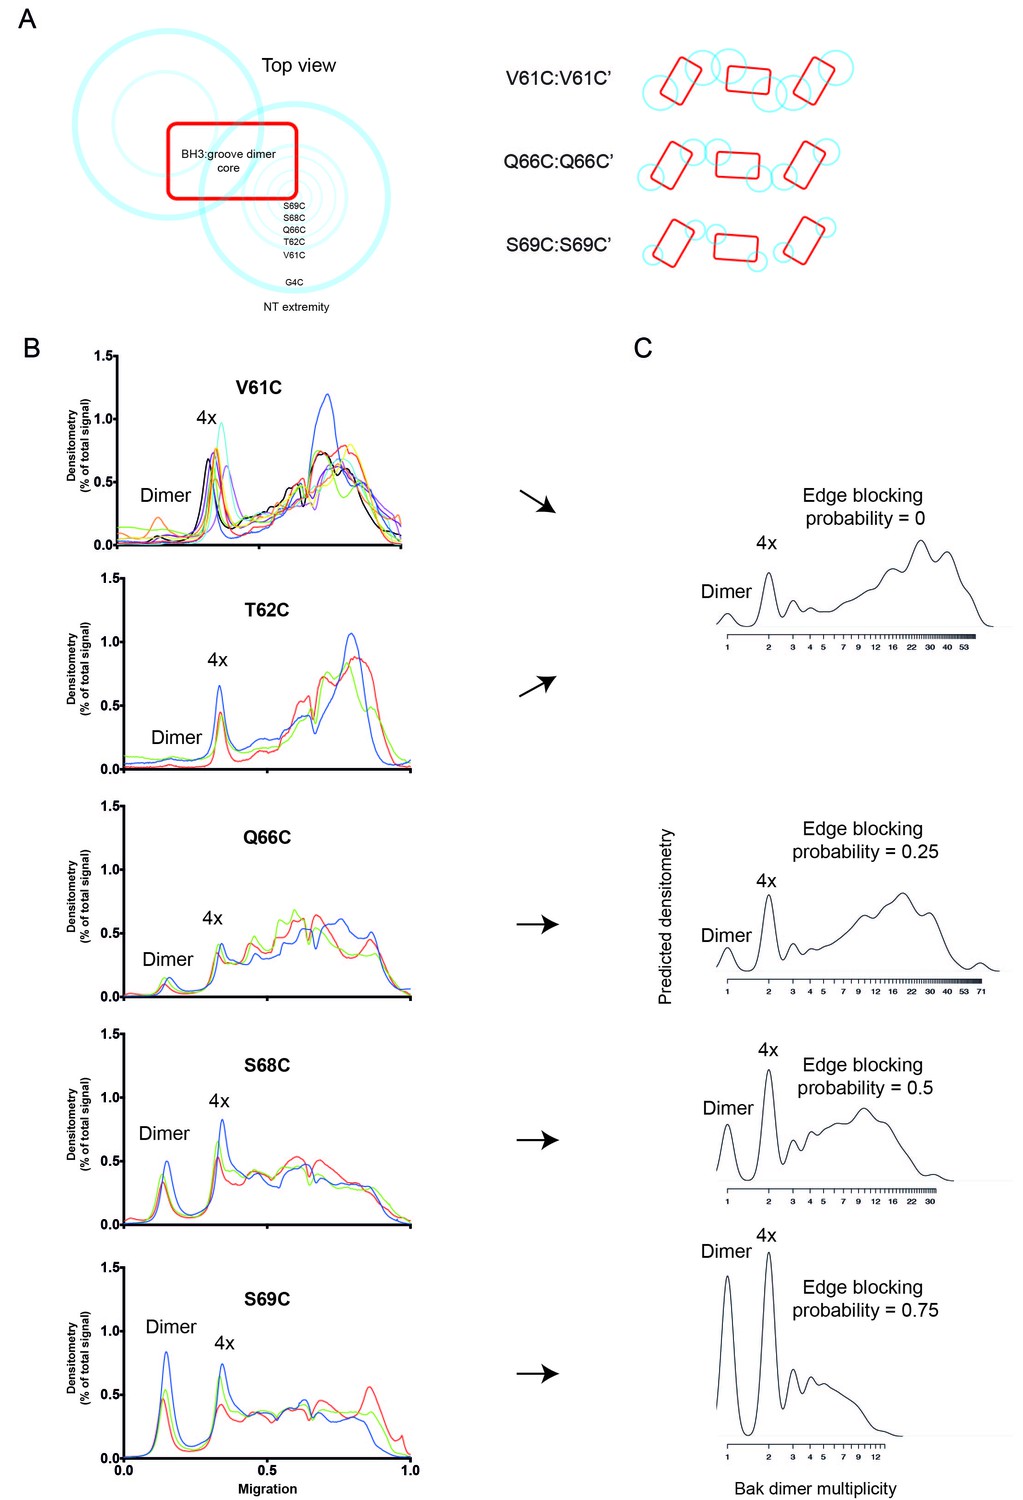
(A) Residues between V61C and the core of the Bak dimer have a progressively more limited range of movement. On the left, the blue circles are shown on a schematic of the Bak dimer to represent the range of movement for G4C, V61C, T62C, Q66C, S68C and S69C. On the right, an illustration of the reduced overlap of Bak dimer extremities (blue circles) is shown for residues with progressively smaller ranges of movement (e.g. V61C>Q66C>S69C). (B) Densitometry of BNP outputs from V61C, T62C, Q66C, S68C and S69C highlight the reduced linkage efficiency (relative to V61C) as cysteine substitutions approach the constrained core of the Bak dimer. Data are shown for three or nine biological replicates. (C) The 2D simulation was altered to incorporate an ‘edge blocking probability’ to mimic the increasing linkage constraint experienced by cysteine substitutions as they approached the core. The best approximation of each cysteine substitution mutant is indicated by arrows.
Figure 7

Bak dimers adopt various conformations on the membrane surface and aggregate in compact, disordered clusters to disrupt the mitochondrial outer membrane.
(A) The top view of Bak dimers lying in-plane on the mitochondrial surface. The α2-α5 core is bounded by the large oval. Extending from the core are the membrane anchored C-terminal helices α6, α7 and α8. For simplicity, the α9 transmembrane domains that project into the membrane plane, and the flexible, solvent exposed N-termini of each dimer are not shown. (B) We hypothesise that growing clusters of Bak dimers induce membrane tension to rupture mitochondria. (i) Upon activation, Bak dimers penetrate the outer leaflet of the membrane and accumulate in a compact irregular cluster. (ii) More dimers converge on the cluster thus enlarging the patch of membrane disturbance. (iii) Once the patch attains a critical area a non-lamellar lipidic arrangement is generated, relieving membrane tension. (iv) Lipids and Bak dimers rearrange to bury exposed hydrophobic surfaces, yielding a variety of proteolipid (toroidal) ‘pores’. Our assays survey a mixture of Bak linkage products derived from stages (ii), (iii) and (iv).
Additional files
-
Supplementary file 1
Primer sequences (5’−3’) used for PCR mutagenesis.
- https://doi.org/10.7554/eLife.19944.020
Download links
A two-part list of links to download the article, or parts of the article, in various formats.
Downloads (link to download the article as PDF)
Open citations (links to open the citations from this article in various online reference manager services)
Cite this article (links to download the citations from this article in formats compatible with various reference manager tools)
Disordered clusters of Bak dimers rupture mitochondria during apoptosis
eLife 6:e19944.
https://doi.org/10.7554/eLife.19944


