Genetic evidence that Nkx2.2 acts primarily downstream of Neurog3 in pancreatic endocrine lineage development
- Naomi Berrie Diabetes Institute, Columbia University Medical School, Columbia
- Columbia University Medical School, Columbia
- Barbara Davis Center, University of Colorado, United States
Figures
Figure 1 with 1 supplement
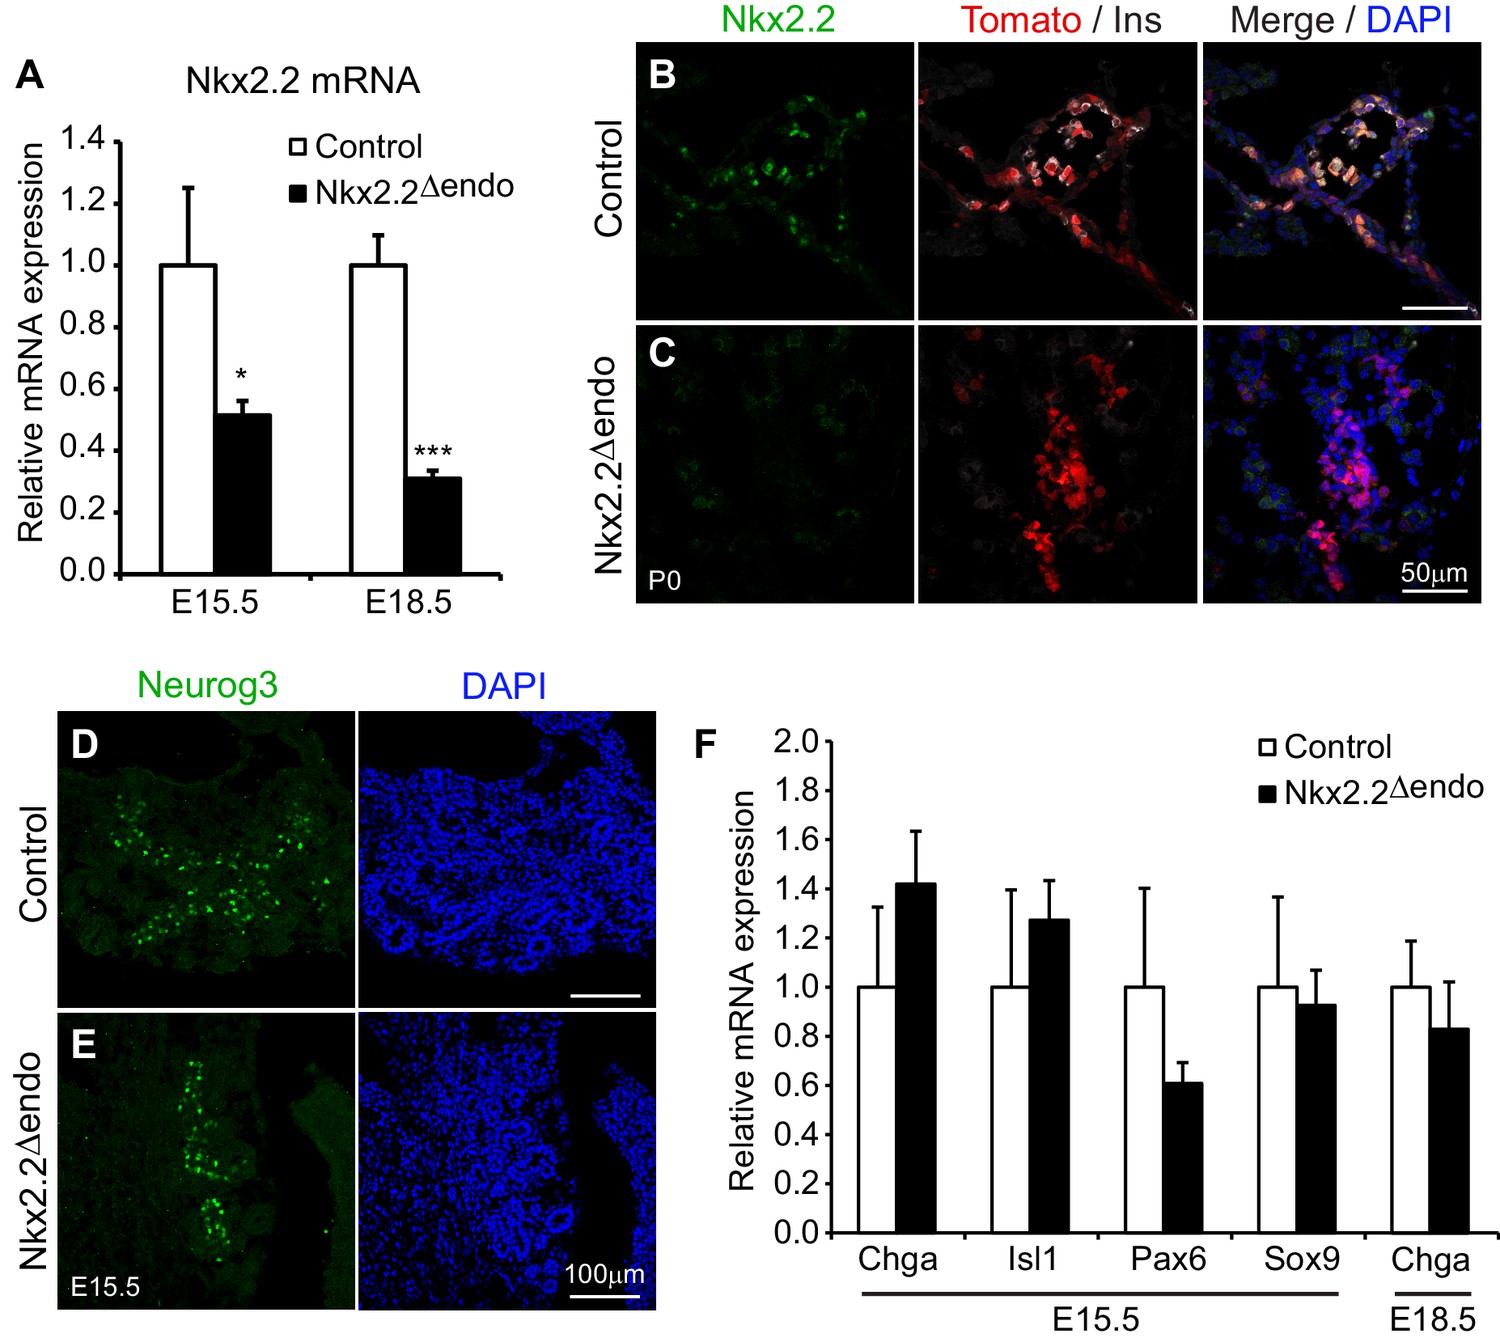
Nkx2.2 is ablated specifically in the endocrine lineage in Nkx2.2△endo mice.
(A) Nkx2.2 gene expression is decreased at E15.5 (Control n = 3, Nkx2.2△endo n = 6) and E18.5 (Control n = 6, Nkx2.2△endo n = 4). (B–C) Immunostaining for Nkx2.2 shows decreased expression in Nkx2.2△endo mice at P0 (n = 3). (D–E) Immunostaining for Neurog3 shows no apparent changes in the Neurog3+ cell population at E15.5 (n = 3). (F) Endocrine compartment gene expression is unchanged at E15.5 (Control n = 3, Nkx2.2△endo n = 6) and E18.5 (Control n = 6, Nkx2.2△endo n = 4). (*) p<0.05; (***) p<0.001.
Figure 1—figure supplement 1
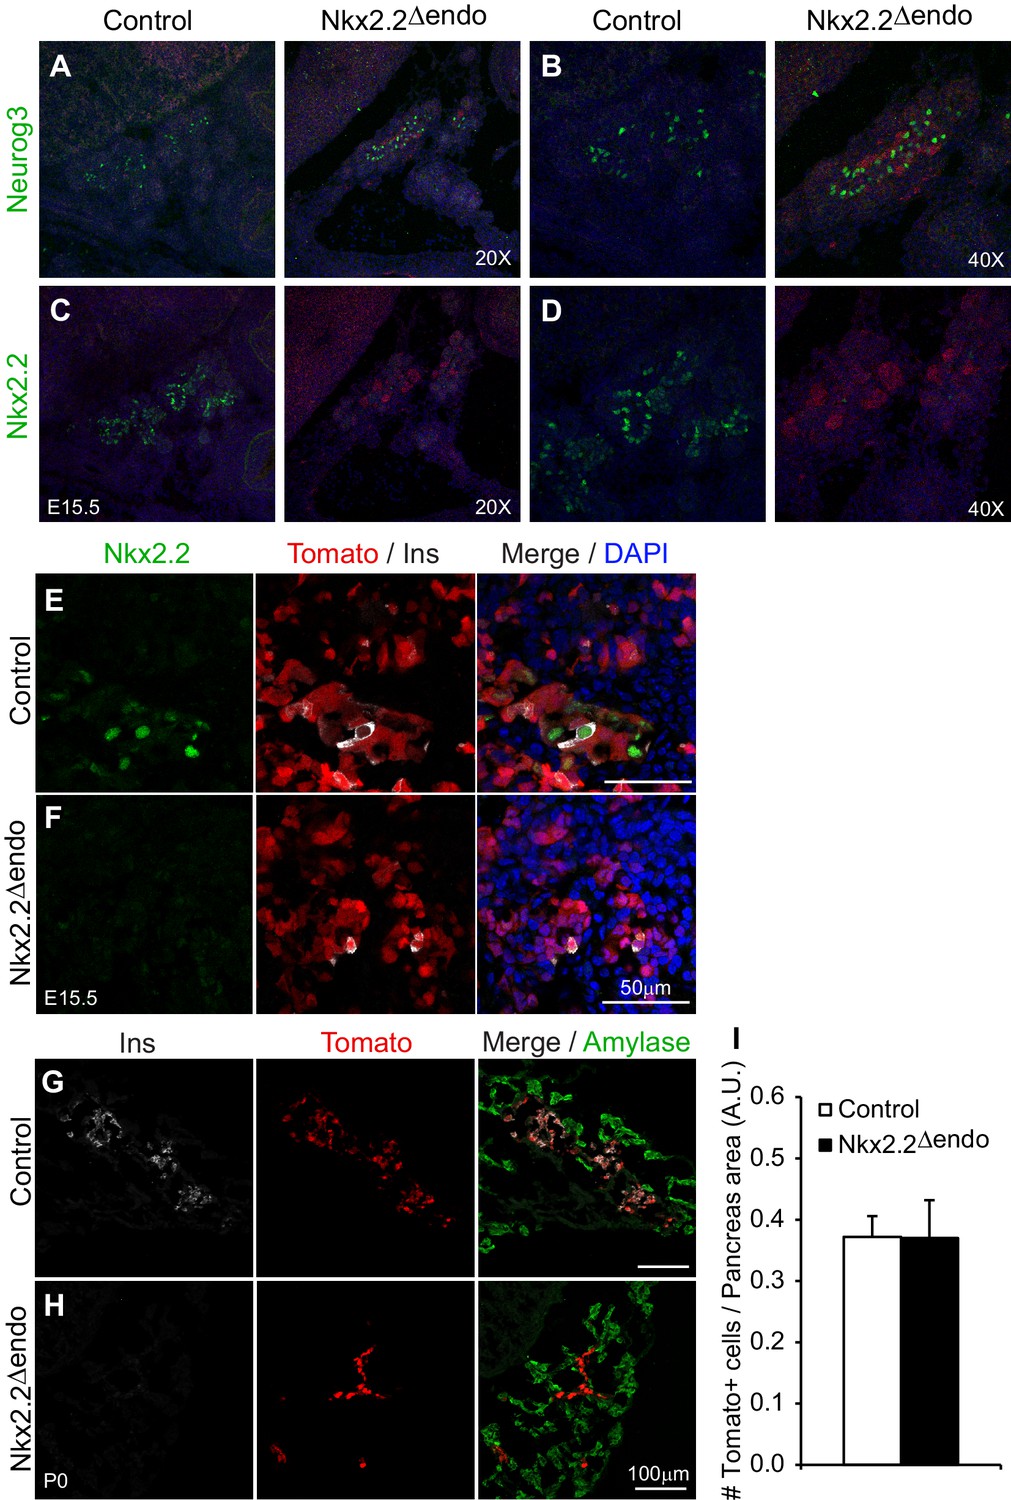
Exocrine and endocrine compartment size is unaffected Nkx2.2△endo mice.
(A–B) Immunostaining for Neurog3 shows no change in Neurog3+ cell number; (C–D) adjacent sections show decreased Nkx2.2+ cells in Nkx2.2△endo embryos at E15.5. (E–F) Immunostaining for Nkx2.2 shows decreased expression in Nkx2.2△endo embryos at E15.5 (n = 3). (G–H) Amylase immunostaining and Tomato+ cells are not changed in Nkx2.2△endo mice at P0 (n = 3). (I) Whole pancreas quantification of Tomato+ cells normalized to total pancreas area shows no change in Nkx2.2△endo mice at P0 (n = 3). A.U., arbitrary units.
Figure 2 with 2 supplements

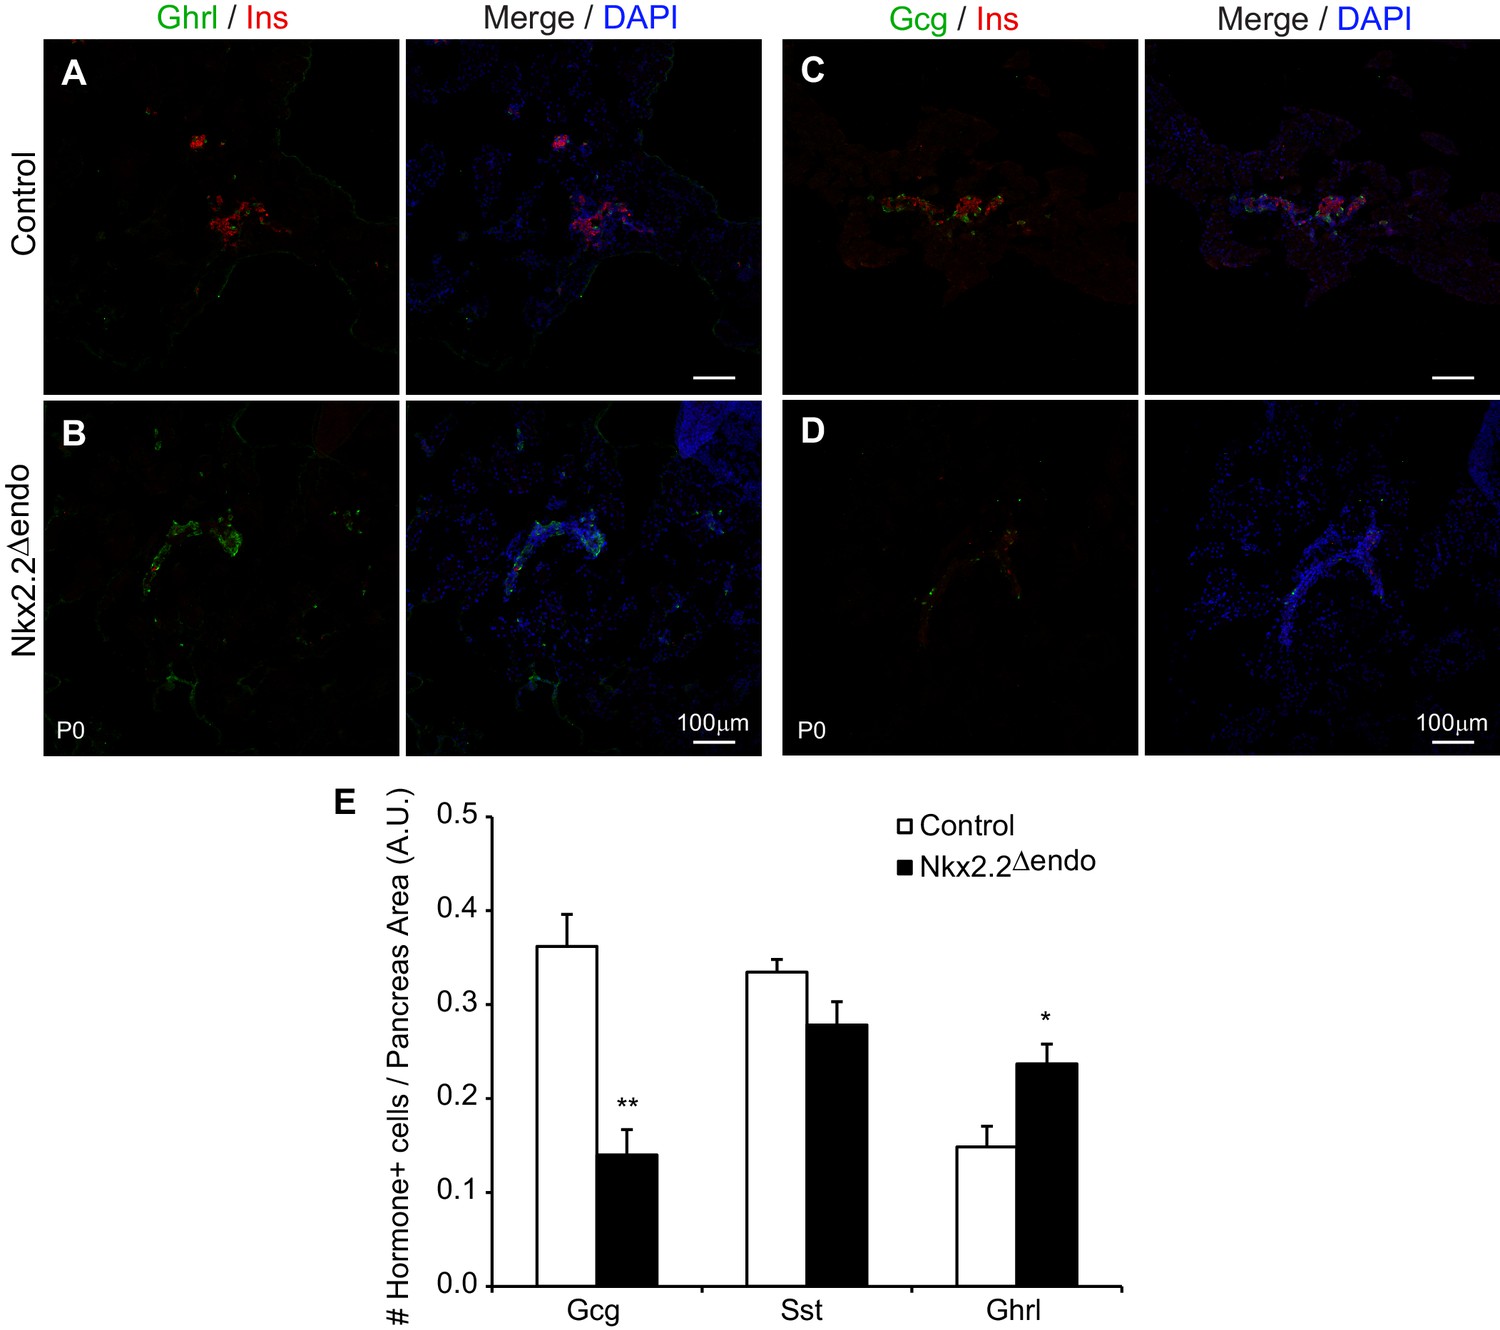
Nkx2.2△endo mice recapitulate the Nkx2.2KO phenotype.
(A–H) Ghrl+ cells are increased, Ins+ cells are greatly reduced, and Gcg+ cells are decreased at E15.5 and P0 in Nkx2.2△endo mice (n = 3). (I–J) Gast+ cells are reduced in Nkx2.2△endo embryos at E15.5 (n = 3). (K–L) SST+ cells are unchanged in Nkx2.2△endo mice at P0 (n = 3). (M) Hormone gene expression changes recapitulate Nkx2.2KO mice at E15.5 (Control n = 3, Nkx2.2△endo n = 6) and E18.5 (Control n = 6, Nkx2.2△endo n = 4). Ppy gene expression is increased at these time points. (N) Nkx2.2△endo mice die neonatally. (O) qRT-PCR confirms increased Ppy at E15.5 in Nkx2.2KO embryos (Control n = 3, Nkx2.2KO n = 3). (*) p<0.05; (**) p<0.01; (***) p<0.001.
Figure 2—figure supplement 1
Nkx2.2△endo mice display endocrine specification defects at P0.
(A–D) Low magnification images showing increased Ghrl+ cells, and decreased Ins+ cells and Gcg+ cells in Nkx2.2△endo mice at P0 (n = 3). (E) Whole pancreas quantification of Gcg+, Sst+, and Ghrl+ cells normalized to pancreas area at P0. Nkx2.2△endo mice display decreased Gcg+ cells, no change in Sst+ cells, and increased Ghrl+ cells (Control n = 3, Nkx2.2△endo n = 5). (*) p<0.05; (**) p<0.01. A.U., arbitrary units.
Figure 2—figure supplement 2

PP cells are increased in Nkx2.2△endo mice.
(A–D) Immunostaining for PP shows increased PP+ cells at E15.5 and P0 in Nkx2.2△endo mice (n = 3). Arrow indicates a PP+Ins+ cell. (E–F) Low magnification images showing increased PP+ cells at P0 in Nkx2.2△endo mice. (G) Whole pancreas quantification of Ins+ and PP+ cells normalized to the total number of Tom+ cells shows increased Ins-PP+Tom+ cells and decreased Ins+PP-Tom+ cells in Nkx2.2△endo mice at P0 (n = 3). No changes in Ins+PP+Tom+ cells are detected. (**) p<0.01; (***) p<0.001.
Figure 3 with 1 supplement

Nkx2.2△endo and Nkx2.2KO embryos have shared and distinct gene expression changes.
(A) Comparison of Nkx2.2△endo and Nkx2.2KO RNA-Seq experiments shows significant overlap of dysregulated genes (adjusted p-value <0.05.) (B) RNA-Seq reveals similar changes in hormone expression in Nkx2.2△endo and Nkx2.2KO embryos, relative to littermate controls. (C) RNA-Seq shows decreases in Mafa and Mafb gene expression in Nkx2.2△endo and Nkx2.2KO embryos, relative to littermate controls. (D) qRT-PCR confirms decreases in Mafa and Mafb at E15.5 (Control n = 3, Nkx2.2△endo n = 6) and E18.5 (Control n = 6, Nkx2.2△endo n = 4). (E) RNA-Seq shows unchanged Neurog3, Neurod1, and Rfx6 gene expression in Nkx2.2△endo embryos; Nkx2.2KO embryos show downregulation, relative to littermate controls. (F) qRT-PCR confirms RNA-Seq results. Neurod1 and Rfx6 gene expression are unchanged at E15.5 and E18.5. Neurog3 gene expression is unchanged at E15.5 and increased at E18.5. (E15.5: Control n = 3, Nkx2.2△endo n = 3–6; E18.5: Control n = 5–6, Nkx2.2△endo n = 4). (G–H) Neurog3+ cells are not detected at P0 (n = 3). Mutant RNA-Seq data was normalized to littermate controls; dotted lines refer to 1.0 fold change. (*) p<0.05; (**) p<0.01; (***) p<0.001.
-
Figure 3—source data 1
Nkx2.2△endo and Nkx2.2KO E15.5 RNA-Seq: Genes showing significant differential expression in both Nkx2.2△endo and Nkx2.2KO mice (120 genes).
- https://doi.org/10.7554/eLife.20010.009
-
Figure 3—source data 2
Nkx2.2△endo and Nkx2.2KO E15.5 RNA-Seq: Genes showing significant differential expression in only Nkx2.2KO mice (325 genes).
- https://doi.org/10.7554/eLife.20010.010
-
Figure 3—source data 3
Nkx2.2△endo and Nkx2.2KO E15.5 RNA-Seq: Genes showing significantly differential expression in only Nkx2.2△endo mice (55 genes).
- https://doi.org/10.7554/eLife.20010.011
Figure 3—figure supplement 1

Many islet transcription factor genes are relatively unchanged in Nkx2.2deltaendo embryos.
(A) RNA-Seq at E15.5 shows no changes in Nkx6.1, Pax4, or Pdx1 gene expression in Nkx2.2△endo and Nkx2.2KO embryos, relative to respective littermate controls; dotted line refers to 1.0 fold change. (B) qRT-PCR confirms no changes in Nkx6.1, Pax4, or Pdx1 at E15.5 (Control n = 3, Nkx2.2△endo n = 6), no changes in Nkx6.1 or Pax4 at E18.5, and decreased Pdx1 at E18.5 in Nkx2.2△endo mice (Control n = 6, Nkx2.2△endo n = 4). (*) p<0.05.
Figure 4
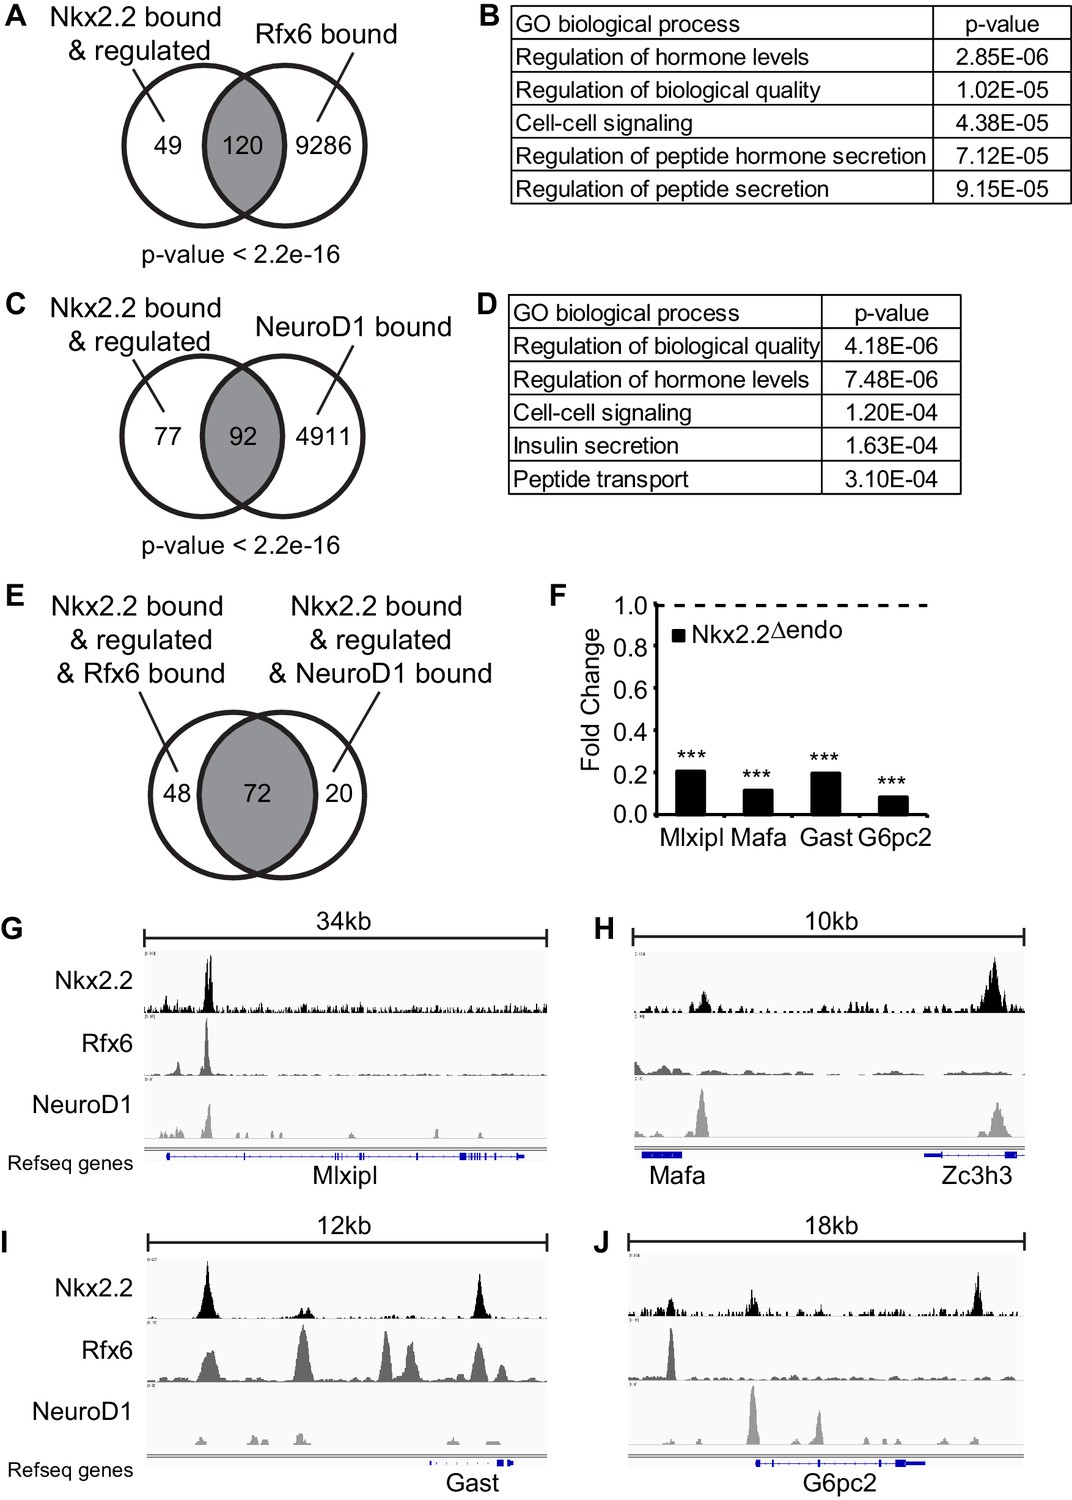
Nkx2.2 bound and regulated genes are co-bound by Rfx6 and Neurod1.
(A) Comparison of Nkx2.2 bound and regulated genes and Rfx6 bound genes (B) Gene ontology (GO) analysis of genes with Nkx2.2 binding and regulation and Rfx6 binding. (C) Comparison of Nkx2.2 bound and regulated genes and Neurod1 bound genes. (D) GO analysis of genes with Nkx2.2 binding and regulation and Neurod1 binding. (E) Comparison between Nkx2.2 bound and regulated and Rfx6 bound genes with Nkx2.2 bound and regulated and Neurod1 bound genes. 72 genes are shared. (F) RNA-Seq shows decreased Mlxipl, Mafa, Gast, and G6pc2 expression at E15.5 in Nkx2.2△endo embryos. Dotted line refers to 1.0 fold change. (***) p<0.001. (G) Nkx2.2, Rfx6, and Neurod1 show overlapping binding peaks at Mlxipl locus (mm9 chr5:135,580,783–135,615,792 shown). (H) Nkx2.2 and Neurod1 show overlapping binding peaks at a region upstream of Mafa (mm9 chr15:75,577,046–75,587,657 shown). (I) Nkx2.2 and Rfx6 show overlapping binding peaks upstream of Gast and within intron 1 (mm9 chr11:100,186,915–100,199,407 shown). (J) Non-overlapping Nkx2.2, Rfx6, and Neurod1 binding peaks near G6pc2 locus (mm9 chr2:69,052,146–69,070,781 shown).
-
Figure 4—source data 1
Nkx2.2 bound and regulated genes that are also Rfx6 bound (120 genes) or NeuroD1 bound (92 genes).
- https://doi.org/10.7554/eLife.20010.014
-
Figure 4—source data 2
Nkx2.2 bound and regulated genes that are also Rfx6 bound and NeuroD1 bound (72 genes).
- https://doi.org/10.7554/eLife.20010.015
Figure 5
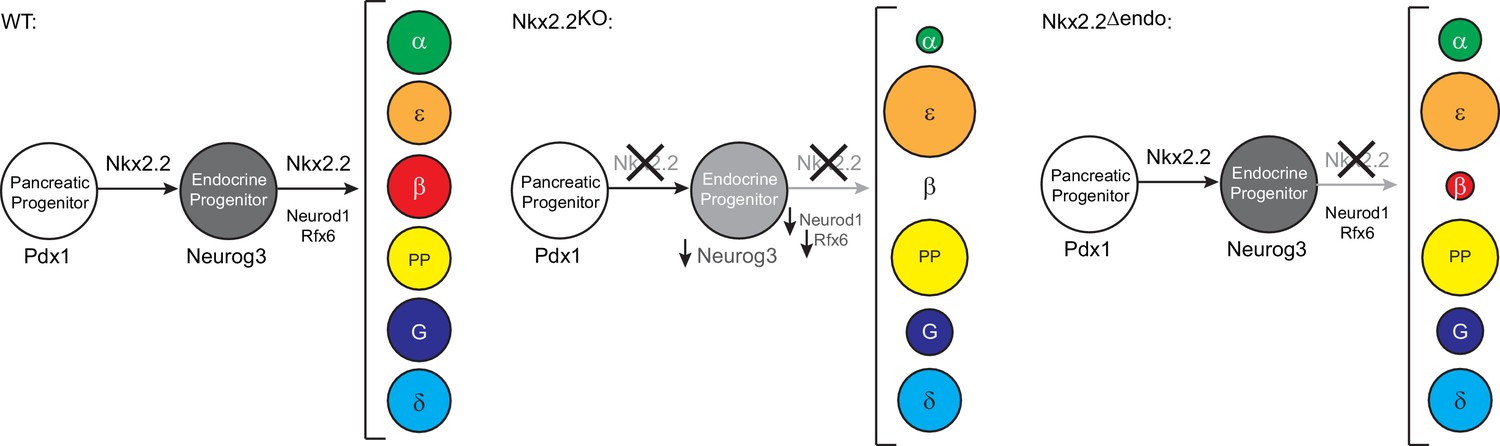
Model of transcriptional networks involved in endocrine cell specification in wildtype (WT), Nkx2.2KO, and Nkx2.2△endo conditions.
Neurog3, Neurod1, and Rfx6 are not sufficient to allow for β cell specification in the absence of Nkx2.2 in Nkx2.2△endo mice. The size of the circles represents the proportion of cell numbers compared to wildtype.
Tables
Table 1
NKx2.2Δendo and Nkx2.2KO E15.5 RNA-Seq - Gene expression changes in select transcription factors and pancreatic hormones.
Nkx2.2△endo fold change | Adjusted p-value | Nkx2.2KO fold change | Adjusted p-value | |
|---|---|---|---|---|
Transcription factors | ||||
Arx | 2.16 | 3.26E-09 | 1.57 | 0.0031 |
MafA | 0.11 | 3.39E-06 | 0.13 | 0.0040 |
MafB | 0.43 | 1.31E-10 | 0.22 | 3.92E-38 |
NeuroD1 | 0.89 | 1 | 0.32 | 3.01E-23 |
Neurog3 | 1.11 | 1 | 0.59 | 0.0198 |
Nkx6.1 | 0.77 | 1 | 0.82 | 0.9684 |
Pax4 | 1.02 | 1 | 0.73 | 0.4762 |
Pax6 | 0.36 | 1.07E-06 | 0.21 | 2.84E-30 |
Pdx1 | 0.88 | 1 | 1.25 | 0.7916 |
Rfx6 | 1.00 | 1 | 0.63 | 0.0013 |
Sox9 | 0.94 | 1 | 1.08 | 1 |
Pancreatic hormones | ||||
Gast | 0.19 | 2.16E-07 | 0.09 | 2.63E-09 |
Gcg | 0.16 | 2.23E-12 | 0.01 | 4.64E-16 |
Ghrl | 8.27 | 1.94E-31 | 6.43 | 6.72E-16 |
Ins1 | 0.03 | 4.84E-24 | 0.00 | 4.32E-11 |
Ins2 | 0.01 | 2.99E-55 | 0.00 | 1.48E-11 |
Ppy | 10.08 | 4.99E-42 | 2.17 | 7.15E-05 |
Sst | 1.14 | 1 | 0.45 | 0.5130 |
Download links
A two-part list of links to download the article, or parts of the article, in various formats.
Downloads (link to download the article as PDF)
Open citations (links to open the citations from this article in various online reference manager services)
Cite this article (links to download the citations from this article in formats compatible with various reference manager tools)
Genetic evidence that Nkx2.2 acts primarily downstream of Neurog3 in pancreatic endocrine lineage development
eLife 6:e20010.
https://doi.org/10.7554/eLife.20010


