Nematophagous fungus Arthrobotrys oligospora mimics olfactory cues of sex and food to lure its nematode prey
- Howard Hughes Medical Institute, California Institute of Technology, United States
- Academia Sinica, Taiwan
- State University of New York at Fredonia, United States
- Cornell University, United States
Figures
Figure 1
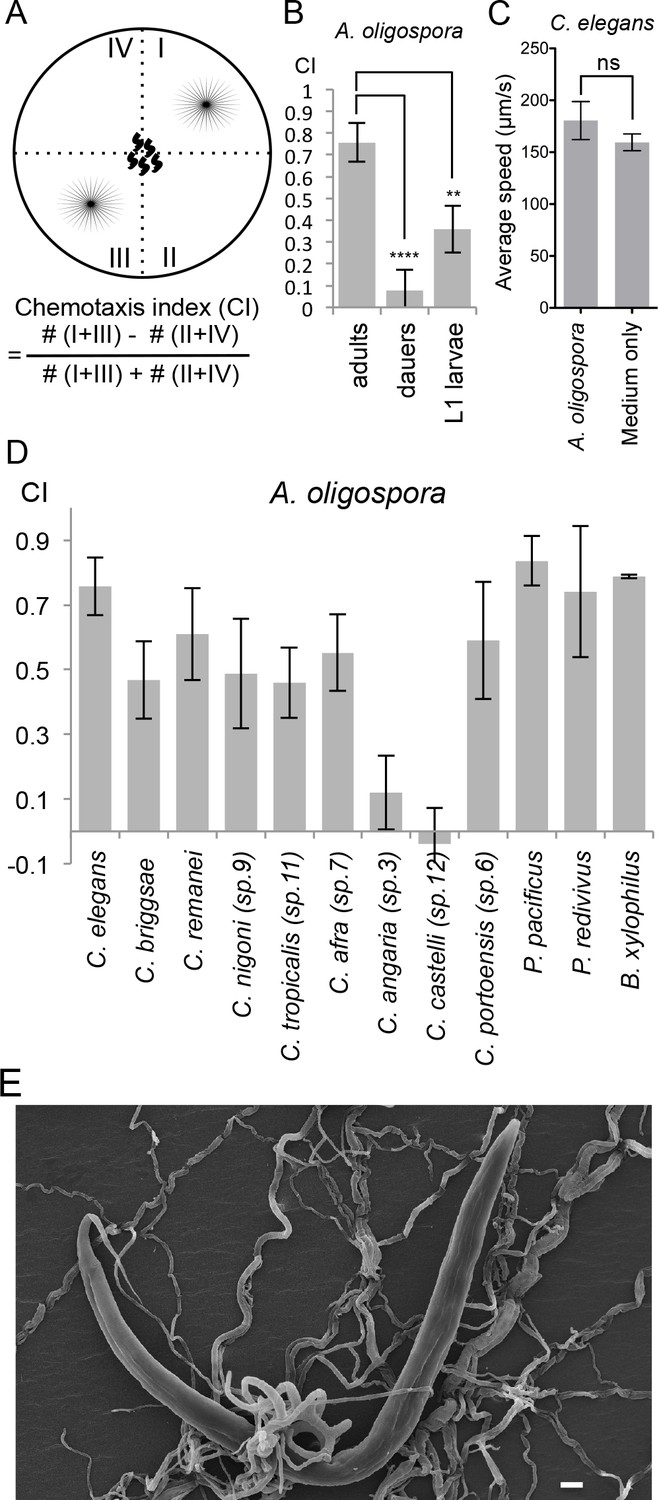
A. oligospora attracts many nematode species, including C. elegans.
(A) Schematic representation of the 4-point chemotaxis assays and the formulation used to calculate the chemotaxis index (CI). (B) C. elegans adults are attracted to A. oligospora, but the dauers and the L1 larvae have much weaker attraction (Mean ± SD, n = 4–12 trials). (C) Speed of wild-type C. elegans on A. oligospora culture or medium only control. Locomotion of the animals was tracked by the commercial WormLab system (MBF bioscience). (D) Many Caenorhabditis nematodes and the more distant Panagrellus redivivus, Pristionchus pacificus, and Bursaphelenchus xylophilus were attracted to A. oligospora (Mean ± SD, n = 4–12 trials). (E) SEM image of C. elegans trapped in A. oligospora. Scale bar = 10 μm.
Figure 2
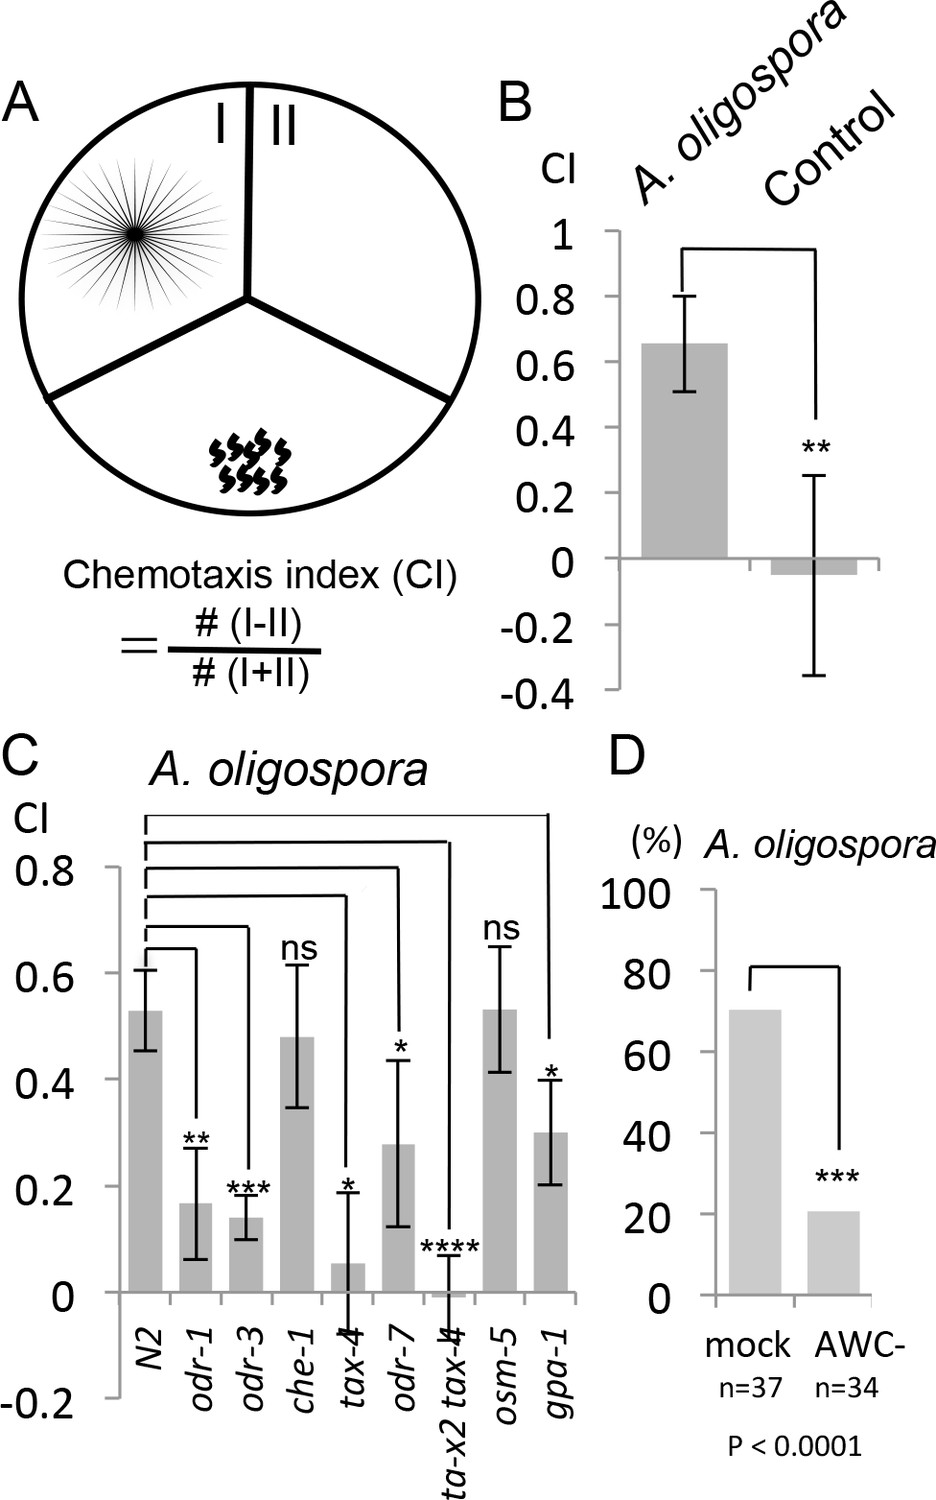
C. elegans are attracted to volatile compounds produced by A. oligospora.
(A) Schematic representation of the volatile chemotaxis assays in which A. oligospora were grown in compartmentalized Petri dishes that contained three sections. The CI was calculated based on the formula presented. (B) C. elegans adults preferentially migrate to the section that was inoculated with A. oligospora (Mean ± SD, n = 6–7 trials). (C) A. oligospora attraction is reduced in several mutants defective in AWC neuron function (Mean ± SD, n = 3–4 trials). (D) Laser ablation of the AWC neurons reduced attraction to A. oligospora.
Figure 3
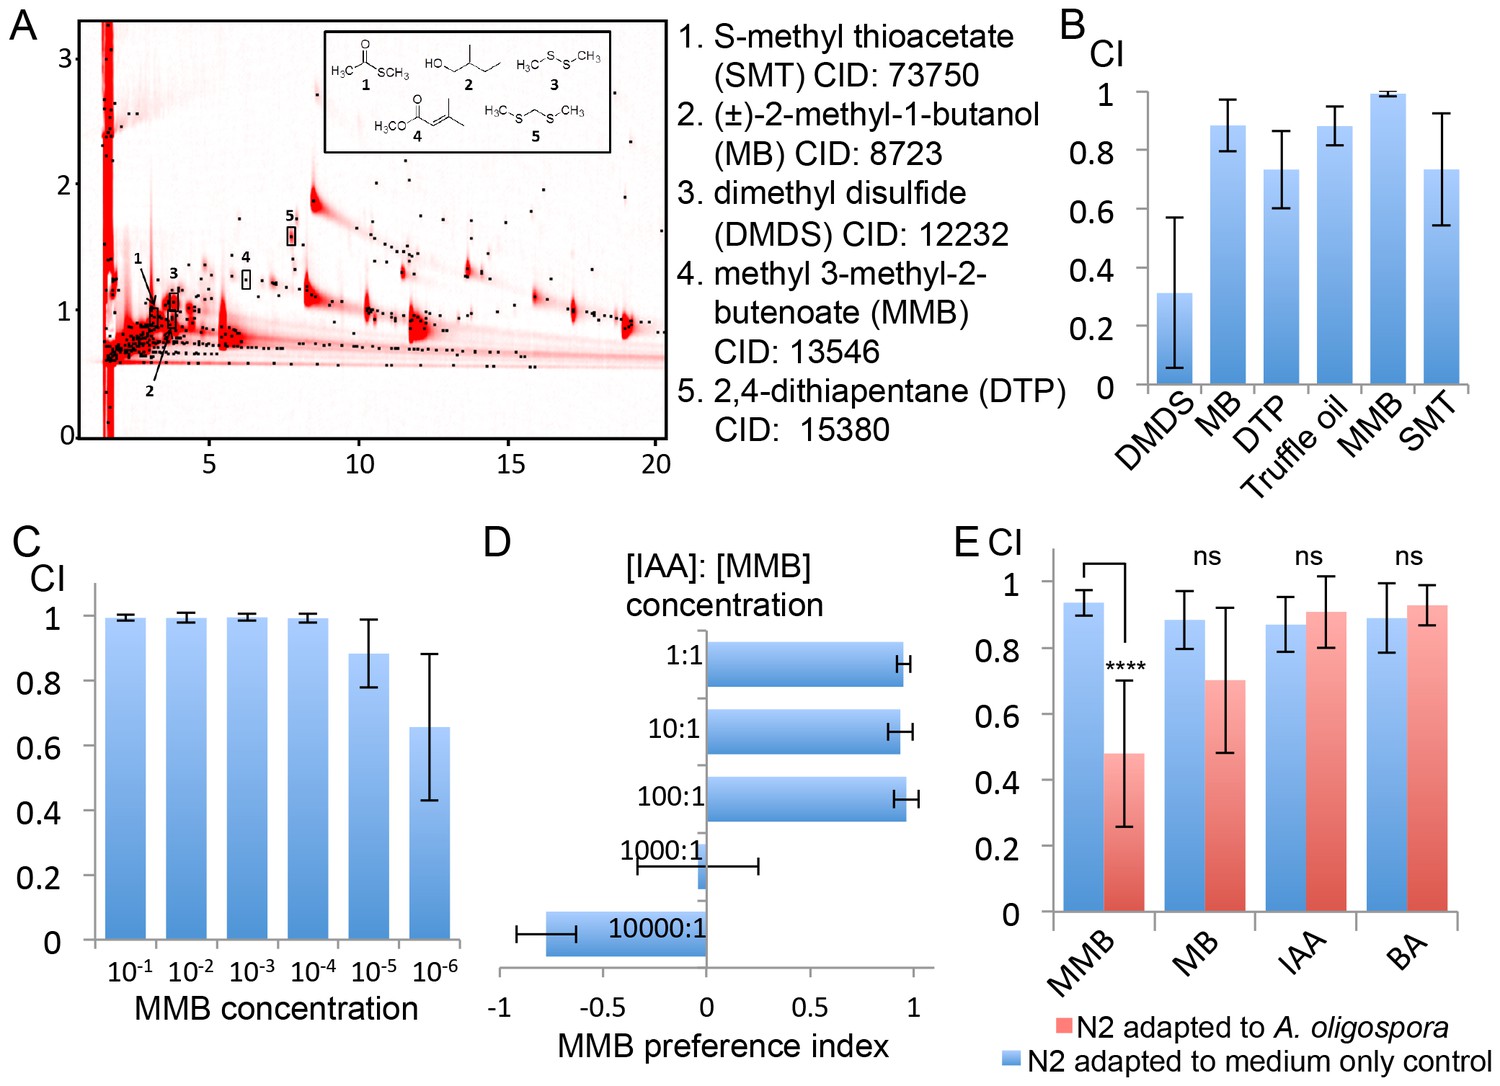
GC x GC-TOFMS analyses identified A. oligospora-derived odorants that are attractive to C. elegans.
(A) Representative two-dimensional gas chromatogram obtained from SPME sampling of headspace above A. oligospora cultures. The total detector response is indicated by the intensity of red in the chromatogram. Black dots represent discrete elution peaks identified during data processing (shown for a signal-to-noise threshold of 100). The elution peaks labeled 1–5 represent compounds that were detected only in A. oligospora cultures, and not in the medium-only controls. (B) Chemotaxis assays of A. oligospora-derived odorants. Chemicals were tested at a 10−2 dilution and truffle oil was tested undiluted (Mean ± SD, n = 6 trials). (C) N2 adults were strongly attracted to MMB across a wide-range of concentrations (Mean ± SD, n = 6 trials). (D) C. elegans prefers MMB over isoamyl alcohol (IAA; Mean ± SD, n = 3–7 trials). The MMB preference index was calculated according to the formula in Figure 1. (E) Chemotaxis plot showing C. elegans chemotactic response to different odorants after 2 hr adaptation to A. oligospora culture (red) or the medium-only control (blue; Mean ± SD, n = 4–10 trials).
Figure 4
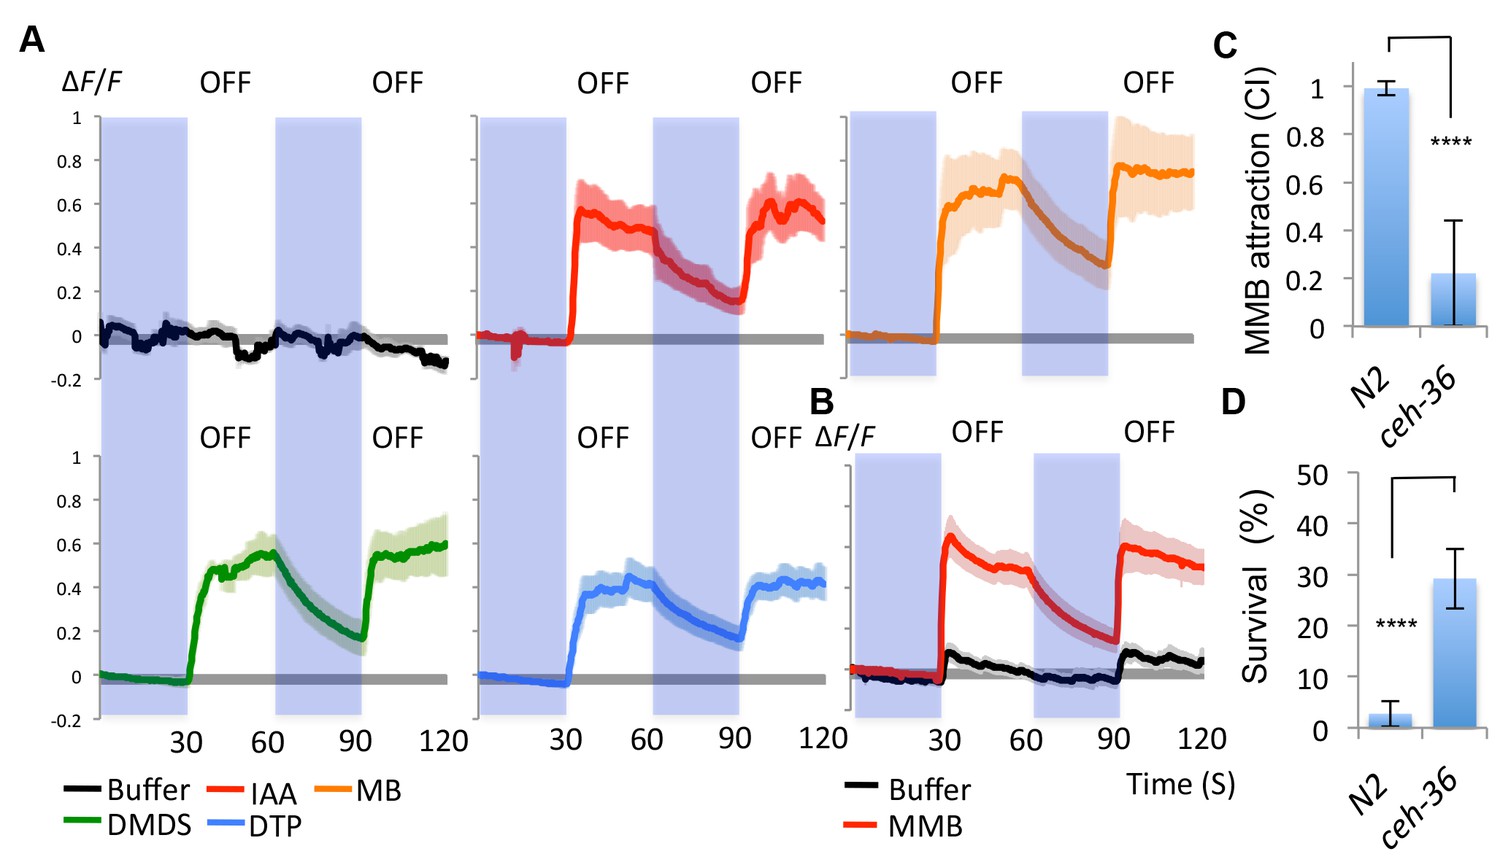
AWCon neurons respond to A. oligospora-derived odorants.
(A) GCaMP6 measurements of the AWCon neurons in response to A. oligospora-derived odorants (10−3) and buffer control (n = 4–7 trials for each odorant tested). (B) GCaMP6 measurements of the AWCon neurons in response to MMB in the unc-13 mutant background (n = 11 and 14 for MMB and buffer control respectively). (C) The AWC- mutant is defective in MMB attraction. Chemotaxis response to 10−4 MMB was measured for the wild-type (N2) or AWC- mutant (ceh-36). (D) The AWC- mutant is more likely to survive predation by A. oligospora. Y axis indicates % of nematodes that were still alive after 16 hr incubation with A. oligospora culture (Mean ± SD, n = 10–12 trials).
Figure 5
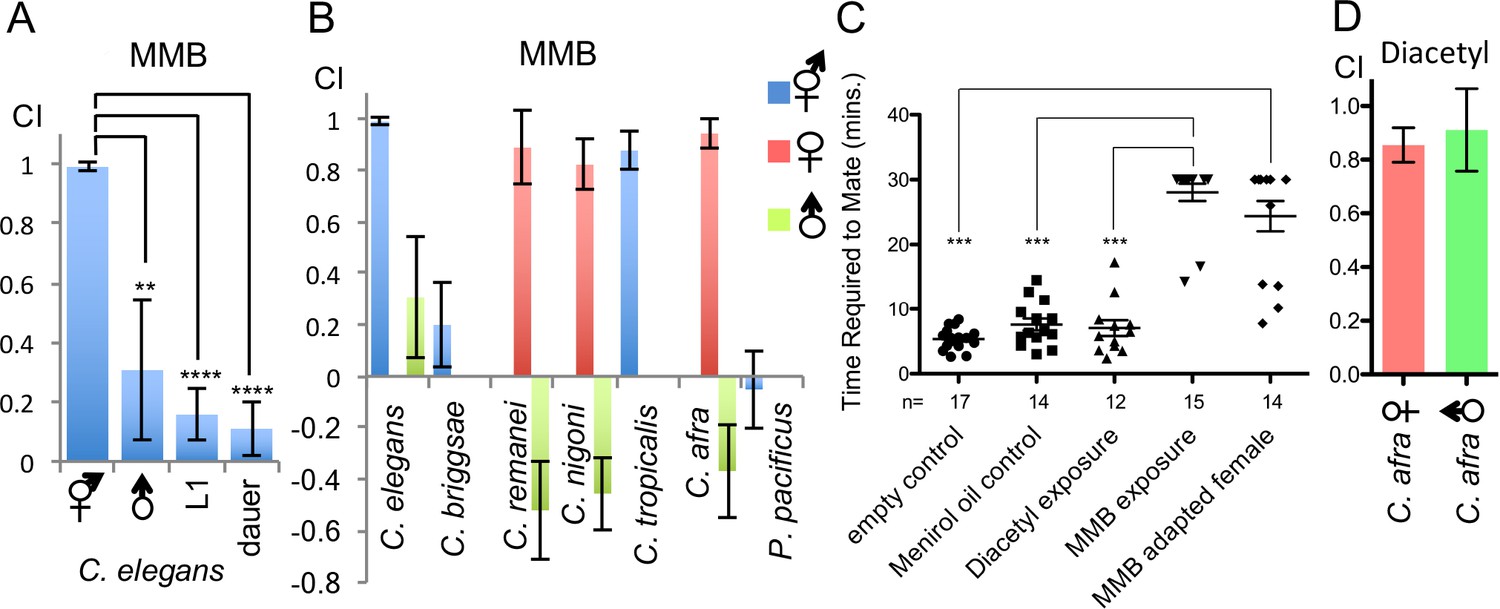
MMB triggers a sex- and lifestage-specific attraction in Caenorhabditis species and interferes with mating in C. afra.
(A) Responses of C. elegans hermaphrodites, males, L1 larvae and dauers to a 10−4 dilution of MMB (Mean ± SD, n = 4–10 trials). (B) Responses of Caenorhabditis sp. and P. pacificus to a 10−4 dilution of MMB (Mean ± SD, n = 4–10 trials). (C) Mating behavior of C. afra was recorded. Y axis indicates the time required for the nematodes to mate; if no mating was observed within the 30 min tracking period, data points were represented as 30 min. (D) Chemotaxis of C. afra male and female nematodes in response to 10−2 diacetyl.
Figure 6 with 2 supplements
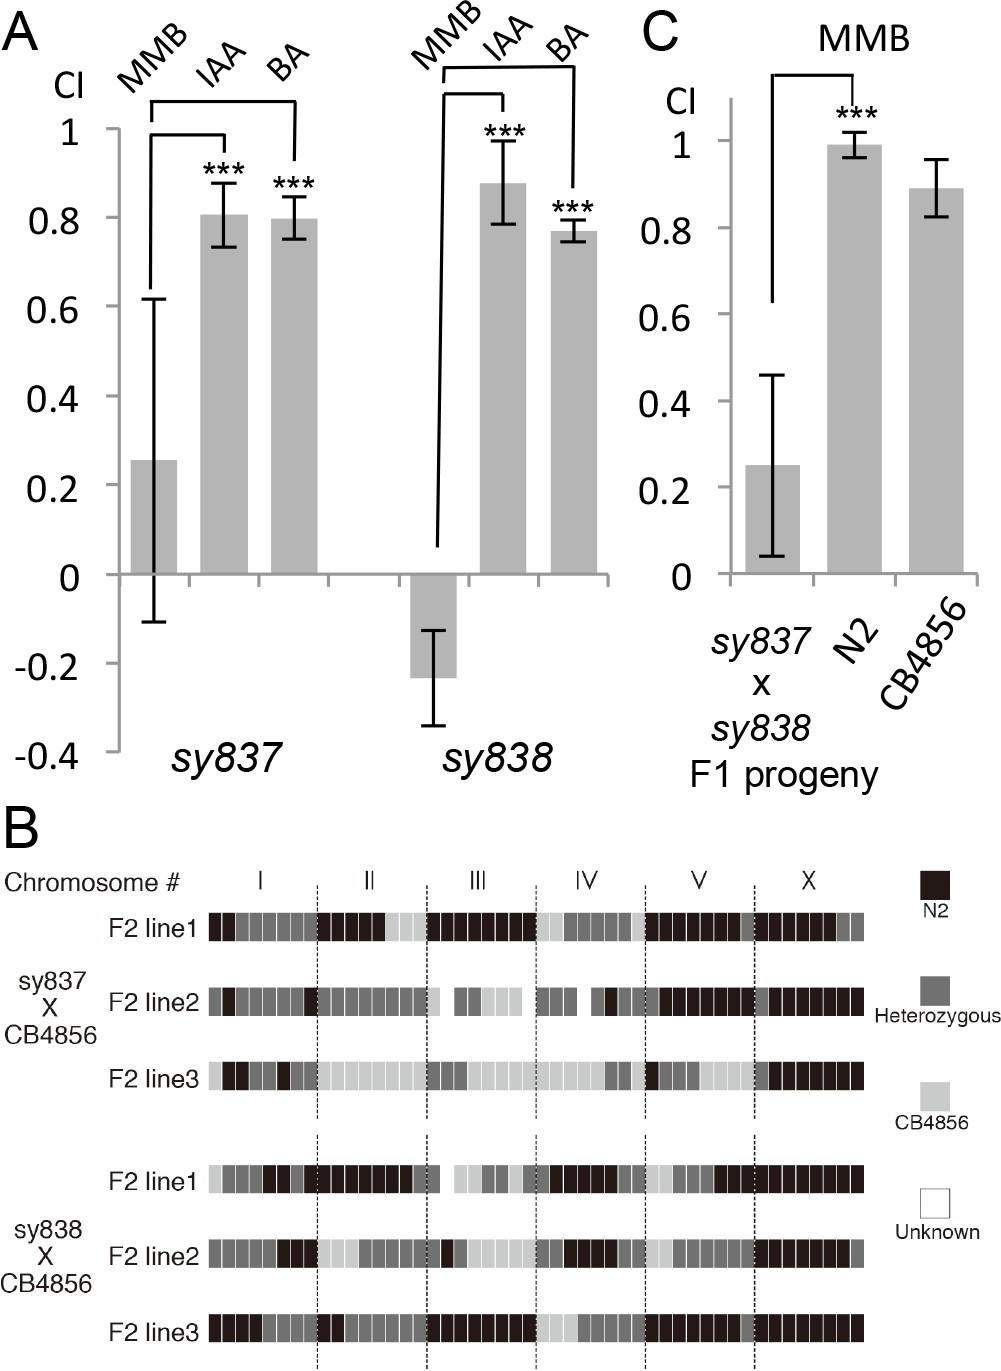
Forward genetic screens isolated two mutants with strong defects in MMB chemotaxis.
(A) Response of the two mutant lines to MMB, IAA, and Benzaldehyde (BA; n = 4–8 trials for each odorant tested). The mutants showed strong defects in MMB chemotaxis but remained attracted to two other odorants, IAA and BA. (B) SNP mapping with the Hawaiian polymorphic strain CB4856 revealed that the mutations in both mutants were located on chromosome X. Mutants #7–22 and #18–10 were crossed to CB4856 and three F2 progeny from each mutant line that had MMB chemotaxis defects were analyzed for eight SNP markers on each chromosome. (C) Mutants #7–22 and #18–10 failed to complement. Responses of the F1 progeny from a cross between the two mutants to 10−4 dilution of MMB. (Mean ± SD, n = 5–8 trials).
Figure 6—figure supplement 1
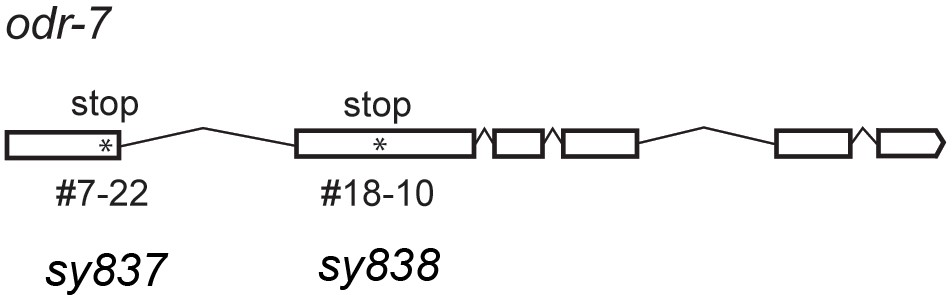
Gene structure of odr-7.
Asterisks indicate two nonsense mutations caused by EMS mutagenesis.
Figure 6—figure supplement 2
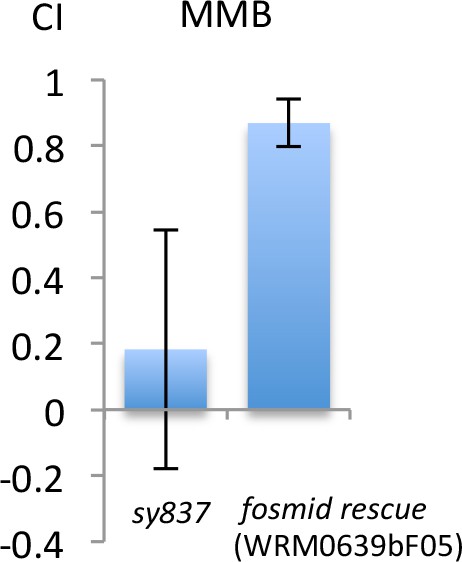
Fosmid clone WRM0639bF05 which contains odr-7 rescues the MMB attraction defect of odr-7 (sy837).
Responses of the mutant or the rescue line to 10−4 dilution of MMB. (Mean ± SD, n = 8–16 trials).
Figure 7
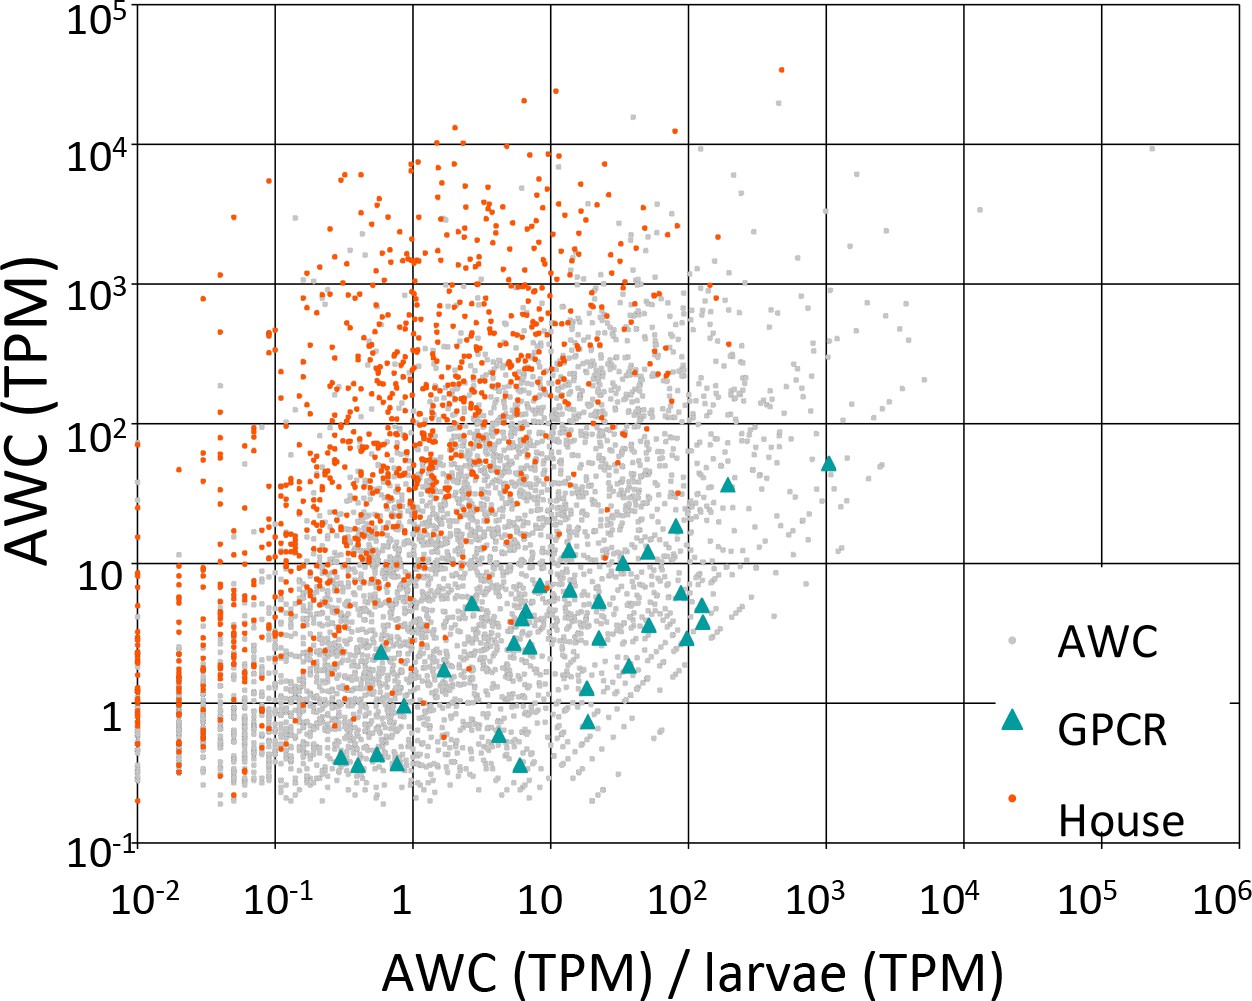
Candidate GPCRs expressed in AWC neurons.
Gene expression in AWC neurons. Expression data are shown for 5326 C. elegans genes (5294 protein-coding and 32 non-coding RNAs) that exhibited above-background expression in our pooled AWC RNA-seq (i.e., that had a minimum expression level, in a 99% credibility interval, of ≥0.1 TPM). The x-axis shows AWC-specificity, computed as the ratio of AWC gene expression (in TPM) to larval gene expression (in TPM) for each gene. The y-axis shows the absolute magnitude of AWC gene activity in TPM. Among most genes (labeled ‘AWC’ and shown as gray dots) are highlighted 32 genes encoding G-protein coupled receptors shown as green triangles and 984 genes encoding housekeeping functions shown as red dots. The housekeeping genes were identified in a previous single-cell RNA-seq analysis (Schwarz et al., 2012). Full identities, annotations, and expression data for all C. elegans genes are provided in Figure 7—source data 1.
-
Figure 7—source data 1
Traits of C. elegans genes expressed in AWC, with RNA-seq expression data generated with our full data set and our most recent computational methods.
Data columns are as follows. Gene: a given predicted protein-coding or ncRNA-coding gene in the C. elegans genome, from WormBase release WS245, for which we observed non-zero gene activity in AWC neurons. All further data columns are pertinent to that particular gene. AWC: the expression level for a given gene in AWC neurons, generated from a pooled set of all AWC RNA-seq reads, measured in TPM. Larvae: the expression level for a given gene in whole larvae, generated from a pooled set of all larval RNA-seq reads, measured in TPM. AWC/larvae: the ratio of gene expression (measured in TPM) between AWC neurons and whole C. elegans larvae. Genes in this table have been ranked by descending values of AWC/larvae, as a general measure of their AWC-specificity. AWC.vs.larvae_padj: the statistical significance (if any) with which a given gene was expressed either more or less strongly in AWC neurons than in larvae. Significance is given as a p-value, adjusted for multiple testing (hence, named ‘padj’) by the collective false discovery rate (FDR) formula of Benjamini and Hochberg (Benjamini and Hochberg, 1995). To compute this set of padj values, we compared mapped reads per gene from two biologically independent sets of single-cell AWC RNA-seq data (set 1, cells 1, 2, and 4; set 2, cells 3 and 5) to mapped reads from two pools of whole C. elegans larvae (Supplementary file 2). Significance was calculated with DESeq2 (Love et al., 2014) using default arguments to optimize the number of genes detected with a padj of ≤0.01. AWC_minTPM: the minimum expression level for a given gene in AWC neurons at a credibility interval of 99%, generated from a pooled set of all AWC RNA-seq reads (Supplementary file 2), measured in TPM. Larvae_minTPM: the minimum expression level for a given gene in whole larvae at a credibility interval of 99%, generated from a pooled set of all larval RNA-seq reads (Supplementary file 2), measured in TPM. AWC_cell_[number]_TPM: the expression level for a given gene in a single AWC neuron (number 1 through 5), generated from the specific set of AWC RNA-seq reads from that individually dissected and amplified neuron (Supplementary file 2), measured in TPM. AWC_cell_[number]_minTPM: the minimum expression level for a given gene in a single AWC neuron (number 1 through 5) at a credibility interval of 99%, generated from the specific set of AWC RNA-seq reads from that individually dissected and amplified neuron (Supplementary file 2), measured in TPM. Coding: the nature of a given gene's coding potential, as annotated in WormBase WS245. Most genes are either solely protein-coding or solely ncRNA-coding, and are noted as such in this data column. For 301 genes in C. elegans, WS245 predicts both protein-coding and non-protein-coding transcripts; in this table, such genes are denoted with ‘protein; ncRNA’. However, for purposes of gene analysis, we assume that any gene with dual predicted nature is solely protein-coding. Prot_size: this shows the full range of sizes for all protein products from a gene's predicted isoforms. Max_prot_size: the size of the largest predicted protein product. Housekeeping: a set of genes that we previously observed, by single-cell RNA-seq, to be consistently active both in whole C. elegans larvae and in three different states of migrating C. elegans linker cells (Schwarz et al., 2012). 7TM_GPCRs: a set of genes encoding G-protein coupled receptors (GPCRs), a class of genes of particular biological interest in deciphering AWC function. Prominent members of this set include dop-1, gar-1, lat-1, odr-10, and ser-2 (Hobert, 2013). Pfam-A: for protein-coding genes, predicted domains from the annotated (Pfam-A) subdivision of PFAM 27 (Finn et al., 2014), PMID 24288371), with an E-value of ≤10–5. eggNOG: for protein-coding genes, predicted orthology groups from the eggNOG 3.0 database (Powell et al., 2012). Phobius: this denotes predictions of signal and transmembrane sequences made with Phobius (Käll et al., 2004). 'SigP' indicates a predicted signal sequence, and 'TM' indicates one or more transmembrane-spanning helices, with N helices indicated with '(Nx)'. Varying predictions from different isoforms are listed. NCoils: this shows coiled-coil domains, predicted by ncoils (Lupas, 1996). As with Psegs, the relative and absolute fractions of each protein's coiled-coil residues are shown. Psegs: this shows what fraction of a protein is low-complexity sequence, as detected by pseg (Wootton, 1994). Both the proportion of such sequence (ranging from 0.01 to 1.00) and the exact ratio of low-complexity residues to total residues are given. Proteins with no predicted low-complexity residues are blank. GO_terms: this denotes Gene Ontology terms for which a gene was annotated in WormBase release WS245.
- https://doi.org/10.7554/eLife.20023.011
-
Figure 7—source data 2
Traits of C. elegans genes expressed in AWC, with RNA-seq expression data generated with our older data set and computational methods.
Data columns are as follows. Gene: a given predicted protein-coding gene (ncRNA-coding genes were not analyzed) in the C. elegans genome, from WormBase release WS190, for which we observed non-zero gene activity in AWC neurons. All further data columns are pertinent to that particular gene. Note that gene identifications have been mapped from the older values used in our older analytical pipeline (which used genes from WormBase release WS190) to the newer values in WormBase release WS245. AWC: the expression level for a given gene in AWC neurons, generated solely from our nine-cell pool of AWC RNA-seq reads, measured in RPKM. Larvae: the expression level for a given gene in whole larvae, generated from a pooled set of all larval RNA-seq reads, measured in RPKM. AWC/larvae: the ratio of gene expression (measured in TPM) between AWC neurons and whole C. elegans larvae. Genes in this table have been ranked by descending values of AWC/larvae, as a general measure of their AWC-specificity. [All other data columns]: these have the same meaning as they do in Figure 7—source data 1. All annotations were generated for WS245 genes.
- https://doi.org/10.7554/eLife.20023.012
-
Figure 7—source data 3
Gene functions associated with genes specifically expressed in AWC.
GO terms whose associated genes exhibited a significant excess of high AWC-specificity (i.e., high ratios of AWC/larval RNA-seq expression), against a background set of 5937 genes with minTPM ≥0.1 in at least one AWC RNA-seq data set. For each GO term, a refined p-value was calculated by FUNC.
- https://doi.org/10.7554/eLife.20023.013
-
Figure 7—source data 4
Comparison of selected data for C. elegans genes encoding GPCRs expressed in AWC.
These data are according to either our newer RNA-seq analysis (using all our data and newer analytical methods) or our older RNA-seq analysis (using our nine-cell pooled data and older analytical methods). The Excel file contains three sheets of data. The first data sheet provides a comparison between GPCR genes identified as expressed in AWC by the newer analysis, versus those identified by the older analysis. Data columns are as follows. Gene: a given predicted protein-coding gene in the C. elegans genome. All further data columns are pertinent to that particular gene. AWC.TPM.new: expression values in AWC for that gene from our newer RNA-seq analysis (Figure 7—source data 1), in units of TPM. AWC.RPKM.old: expression values in AWC for that gene from our older RNA-seq analysis (Figure 7—source data 2), in units of RPKM. Pfam-A: predicted domains from the annotated (Pfam-A) subdivision of PFAM 27 with an E-value of ≤10–5(Finn et al., 2014).
- https://doi.org/10.7554/eLife.20023.014
Figure 8
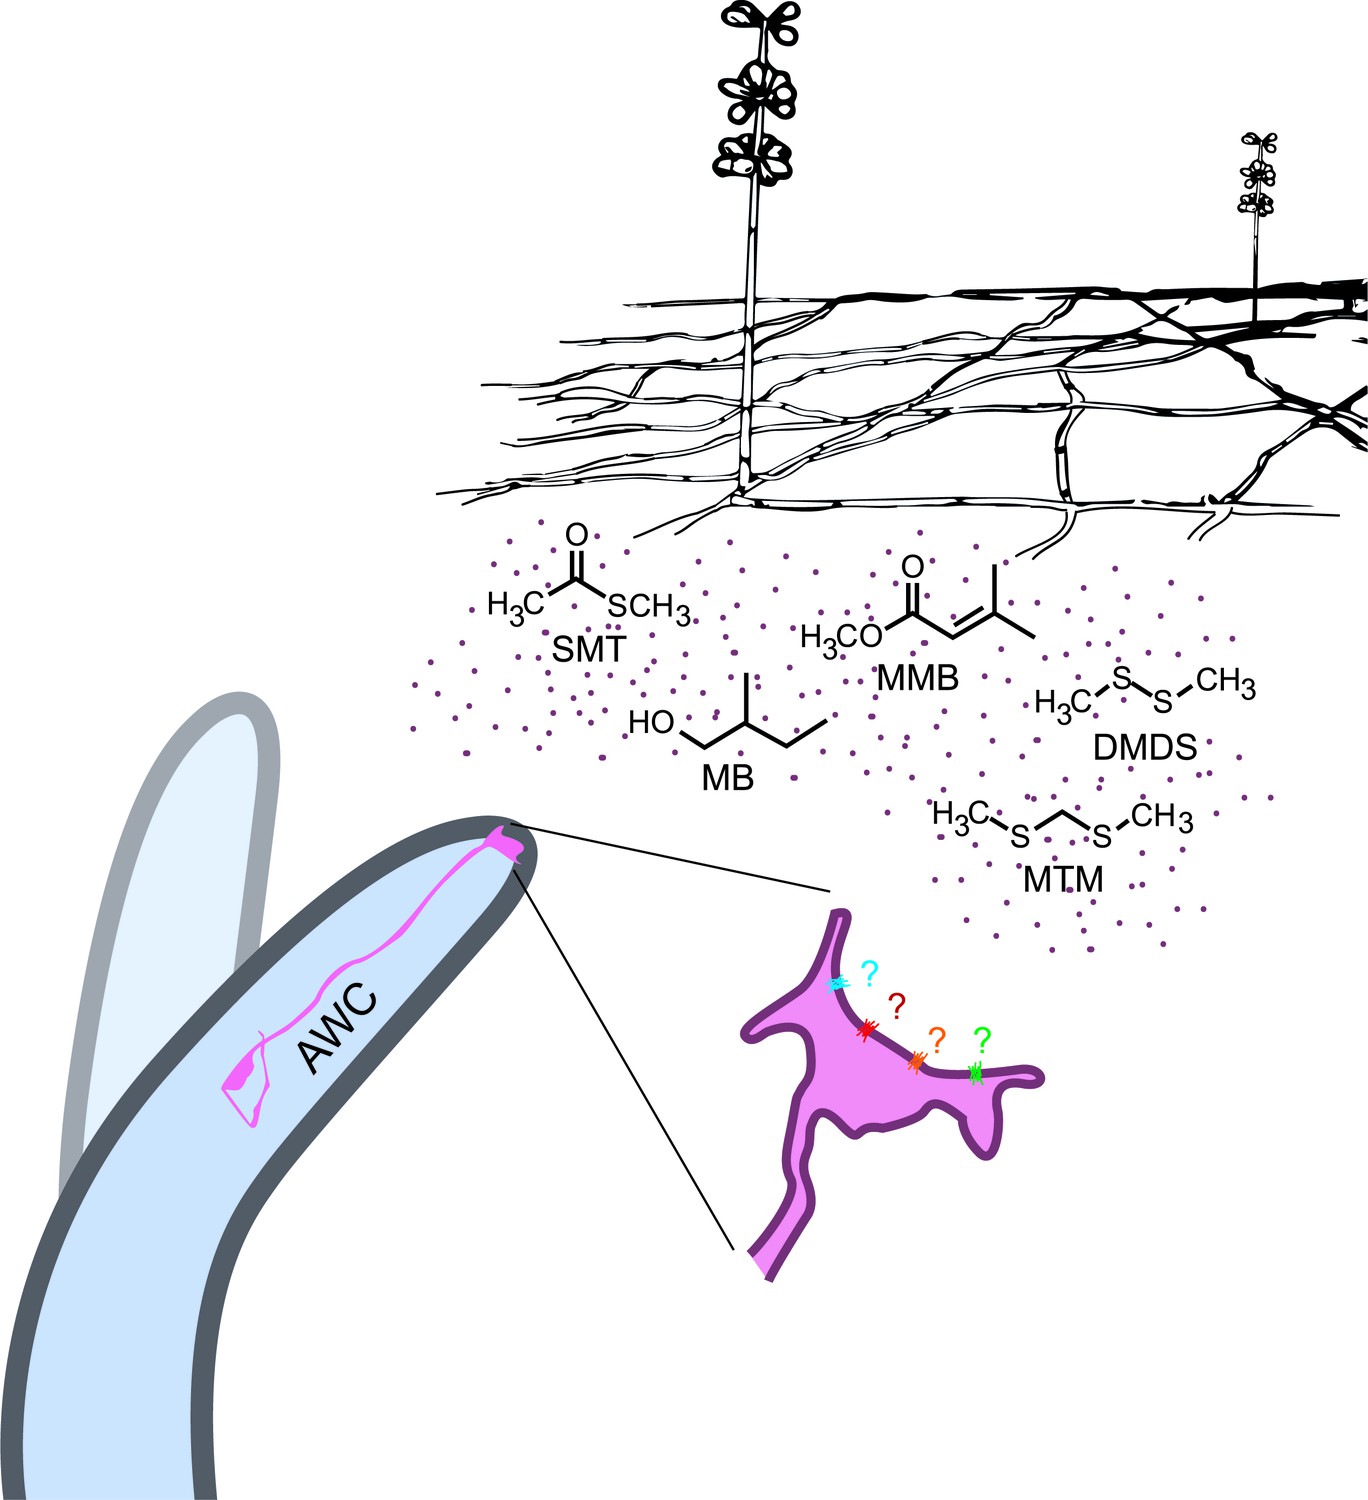
A. oligospora produce volatiles that mimic food and sex cues to attract C. elegans via its olfactory neuron AWCs.
https://doi.org/10.7554/eLife.20023.015Additional files
-
Supplementary file 1
Detection of compounds 1-5 from headspace above fungal cultures of A. oligospora, A. terreus, A. niger, and growth medium-only control samples.
- https://doi.org/10.7554/eLife.20023.016
-
Supplementary file 2
Summary of RNA-seq data and expressed gene counts.
- https://doi.org/10.7554/eLife.20023.017
Download links
A two-part list of links to download the article, or parts of the article, in various formats.
Downloads (link to download the article as PDF)
Open citations (links to open the citations from this article in various online reference manager services)
Cite this article (links to download the citations from this article in formats compatible with various reference manager tools)
Nematophagous fungus Arthrobotrys oligospora mimics olfactory cues of sex and food to lure its nematode prey
eLife 6:e20023.
https://doi.org/10.7554/eLife.20023


