A plasma membrane template for macropinocytic cups
- MRC Laboratory of Molecular Biology, United Kingdom
- Beatson Institute for Cancer Research, United Kingdom
- Janelia Farm Research Campus, Howard Hughes Medical Institute, United States
Figures
Figure 1
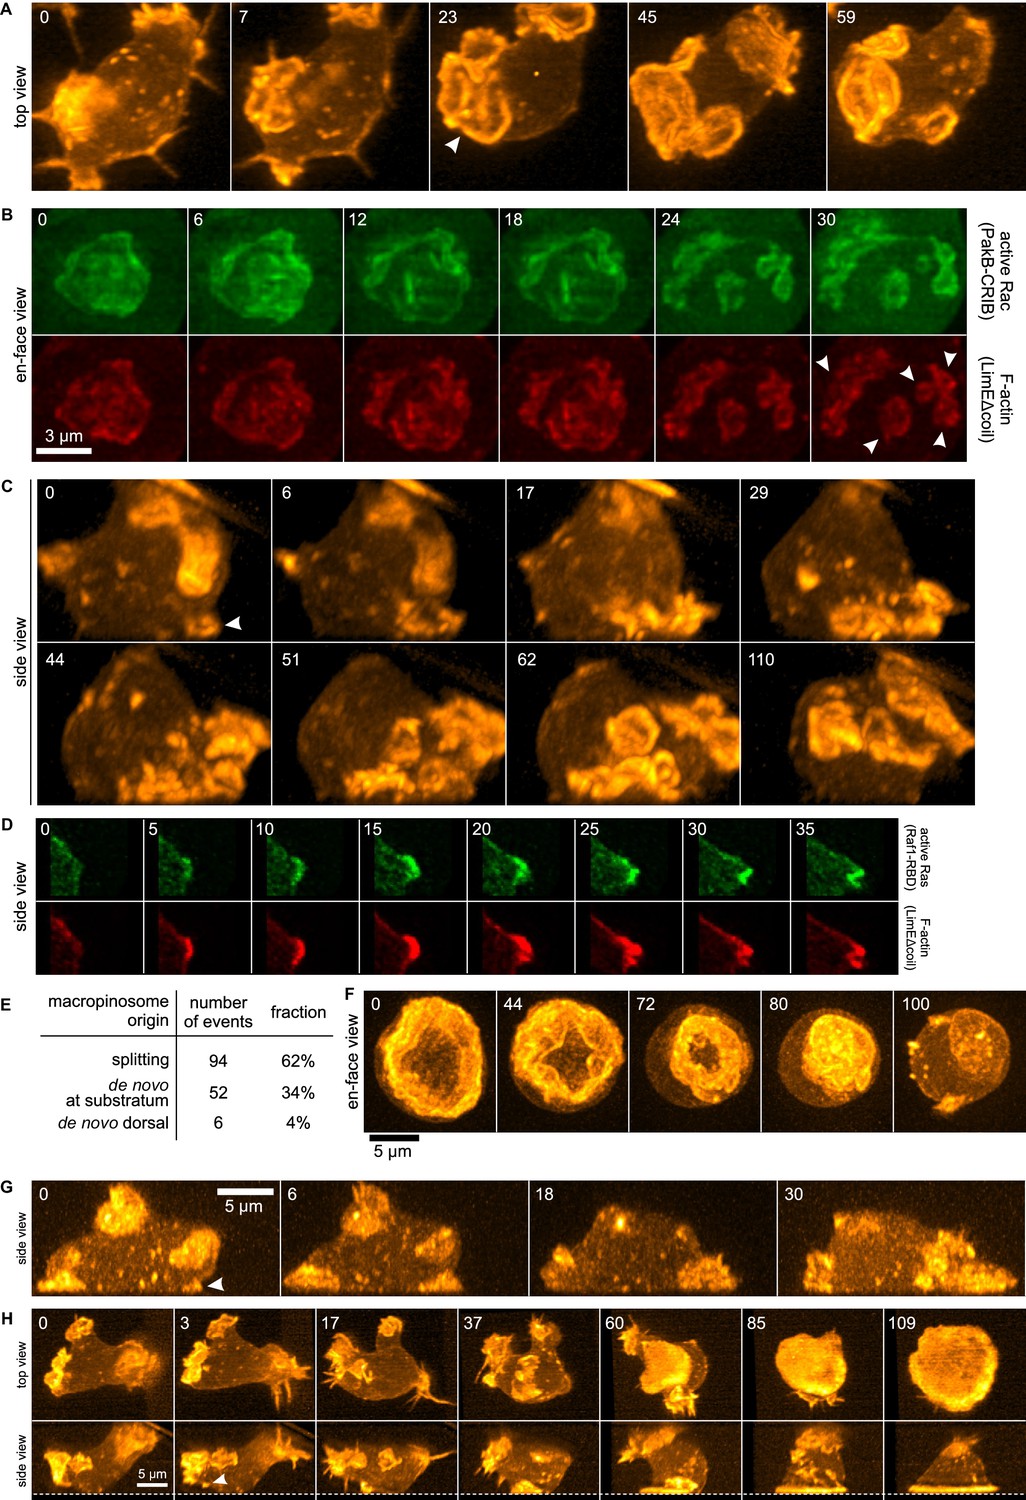
Life histories of macropinocytosis, pseudopods and basal waves.
Vegetative axenic cells of strain Ax2 were followed in 3D time-lapse movies made by lattice light sheet microscopy. Images show maximum intensity projections. Cells express a marker for F-actin (LimEΔcoil-RFP) unless otherwise indicated. Numbers indicate time in seconds. (A) A new macropinocytic cup formed by splitting (arrow marks nascent daughter macropinocytic cup). (B) Close-up of a large macropinocytic cup, viewed en-face, that fragments and forms multiple smaller macropinocytic cups (arrowed). (C) Origin of a cluster of macropinocytic cups from a small basal F-actin structure (arrow). (D) Detail of a cell initiating a de novo dorsal macropinocytic cup (ie not in contact with substratum). (E) Table of macropinocytic cup origins. (F) Close-up of macropinocytic cup closure, viewed en face. (G) Growth of a pseudopod from a small F-actin structure close to the substratum (arrow). (H) Growth of a basal F-actin wave from a small F-actin punctum (arrow), to eventually encompass the entire basal surface of the cell. See also supplementary movie 1-7 for full movies of panel A, B, C, D, F, G and H respectively.
Figure 2
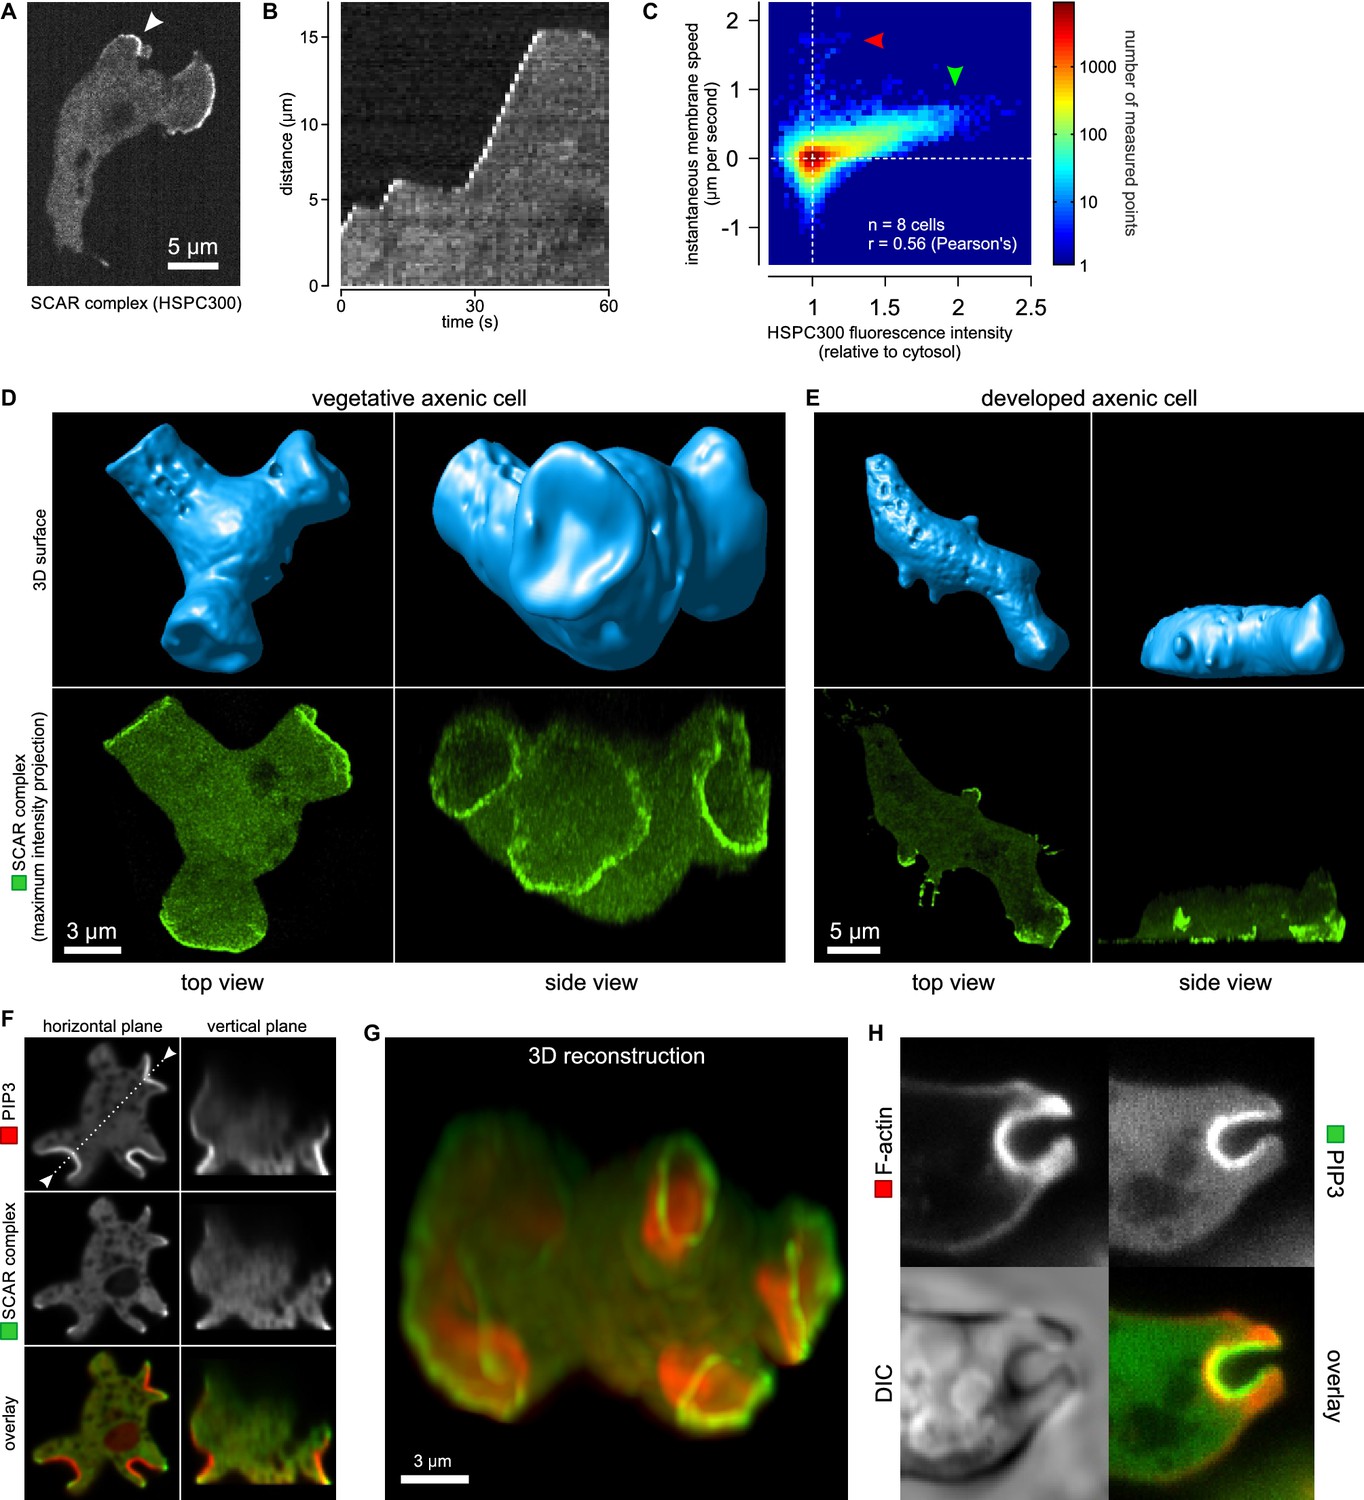
Macropinocytic cups contain a central domain of PIP3 surrounded by a ring of SCAR.
(A, B, C) Evidence that fluorescently tagged SCAR complex faithfully marks regions of active actin polymerisation: (A) An aggregation-competent cell moving under an agarose overlay (optimal conditions for visualising pseudopods) showing HSPC300-GFP recruited to the two pseudopods; (B) Kymograph of expansion of the pseudopod arrowed in (A) showing that the SCAR reporter is present during periods of expansion, but absent in the plateaus when the pseudopod is not expanding; (C) Membrane speed and SCAR complex accumulation are positively correlated. The HSPC300-GFP signal and local membrane speed was measured at 100 points along the membrane of a motile cell. Data of eight independent cells was combined and plotted as a 2D histogram. Green arrow indicates data points with high levels of SCAR and positive displacement. Red arrow indicates data points due to blebs, which are actin-free and expand much faster than pseudopods (Zatulovskiy et al., 2014). (D) SCAR is recruited as a ring to the lip of macropinocytic cups. The upper panels show top and side views of a surface rendering of a cell with three macropinocytic cups and the lower shows the same cell with a SCAR reporter. (E) SCAR is recruited to pseudopods in distinct blocks, not as a ring. Pitted appearance of the 3D surface is a rendering artefact caused by small vesicles that reside just underneath the cell membrane. (F) SCAR is recruited to the edge of an intense PIP3 patch in the macropinocytic cup. The white dotted line in the left panel corresponds to the position of the vertical plane in the right panel. (G) 3D reconstruction of the cell in the previous panel. (H) F-actin is nearly uniformly distributed in the macropinocytic cup and does not predict the localization of SCAR. Ax2 cells were used in all panels. HSPC300 was used as a marker for the SCAR complex, PH-CRAC as a reporter for PI(3,4,5)P3 and Lifeact as a reporter for F-actin. 3D images were reconstructed from Z-stacks taken on a spinning disk microscope.
Figure 3
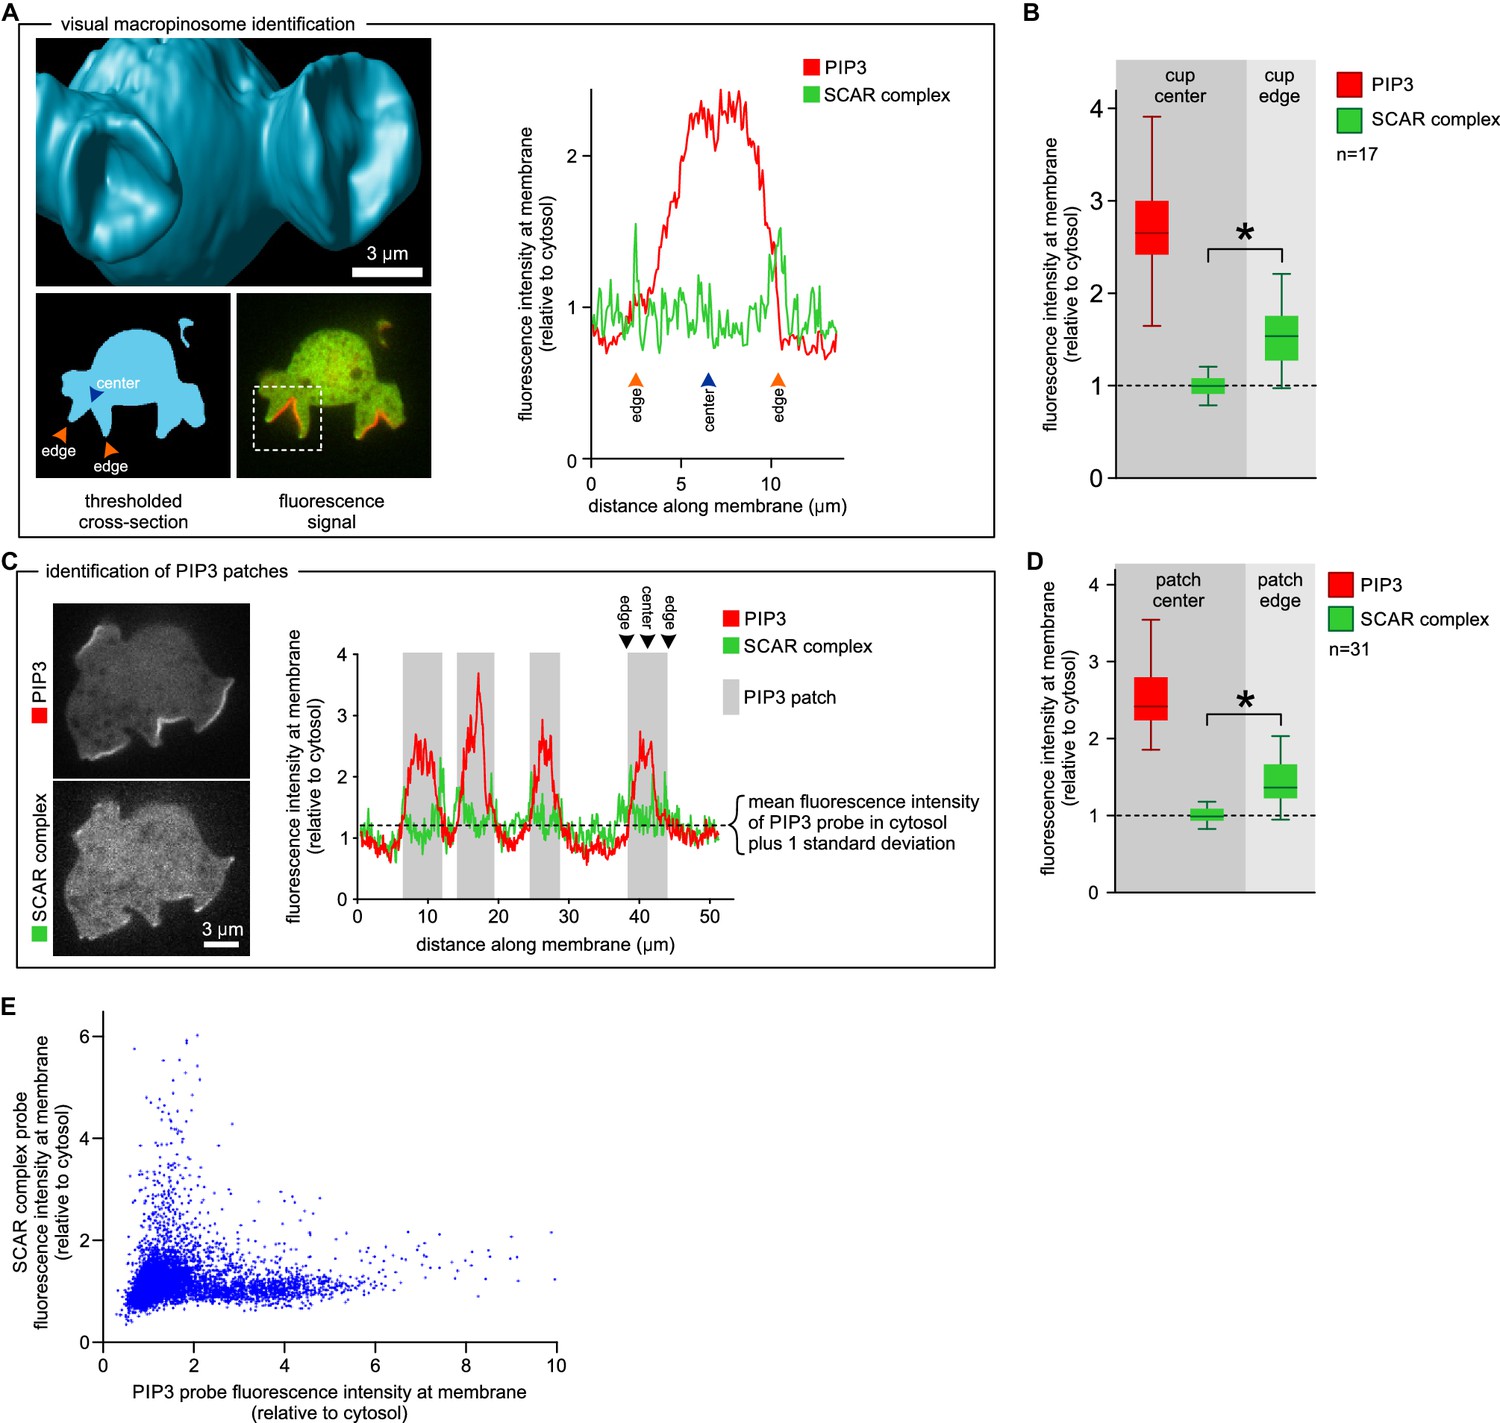
SCAR is present at the edge but not the centre of the macropinocytic cup.
(A, B) Quantification of PIP3 and SCAR in macropinocytic cups identified visually. (A) Method of analysis: Macropinocytic cups were identified morphologically from 3D rendered images and the position of their center (blue arrow) and edge (orange arrows) was noted. Fluorescence intensity along the cell membrane of the boxed macropinocytic cup was plotted and the intensity was measured at the marked center and edge. (B) PIP3 and SCAR fluorescence intensity at center and edge of 17 visually identified macropinocytic cups. Bar indicates the mean, box indicates the second and third quartile. Whiskers indicate the range of the data. (C, D) Analysis of SCAR in PIP3 patches. (C) Method of PIP3 patch analysis: Membrane-bound fluorescence intensity of the respective markers was measured for individual cells. PIP3 patches were defined as those membrane regions where the fluorescence intensity is greater than mean cytosol plus one standard deviation (dotted line) and these regions are marked in grey. (D) Quantification of fluorescence intensity at the centers and edges of 31 identified PIP3 patches. Bar indicates the mean, box indicates the second and third quartile. Whiskers indicate the range of the data. (E) Anti-correlation between SCAR and PIP3 reporter intensity. In this analysis the intensity of fluorescence in all membrane pixels was compared, irrespective of the morphological structure in which they lay. The plot shows the combined data from 16 cells. Vegetative Ax2 cells expressing the SCAR complex reporter HSPC300-GFP and the PI(3,4,5)P3 reporter PH-CRAC-mRFP were used in all experiments. The asterisk marks significant differences (p<0.01).
Figure 4
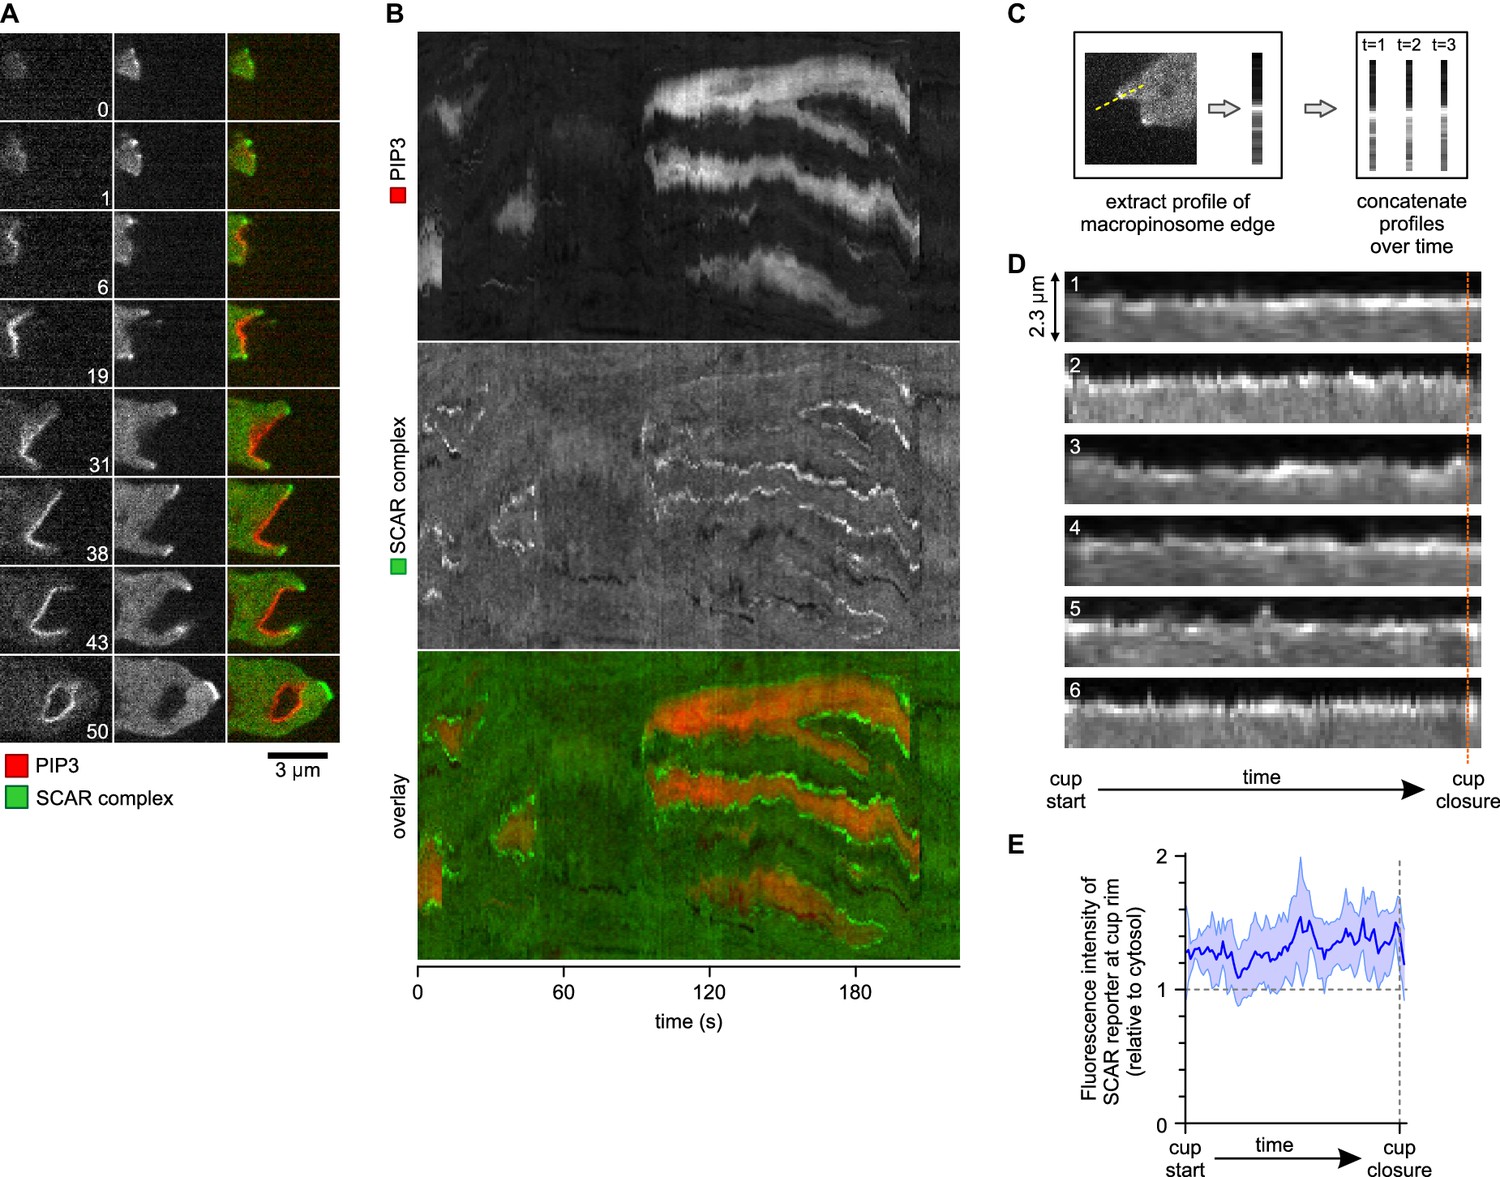
A SCAR ring encircles PIP3 patches throughout their lifetime.
(A) Detail of a cell initiating a de novo macropinocytic cup. Puncta of SCAR flank the PIP3 patch at all times. Time is indicated in seconds. (B) Kymograph of the fluorescence intensity along the membrane of a vegetative cell completing several macropinocytosis events. SCAR is associated with the edge of PIP3 patches during their entire lifetime and never with their centers. (C) Quantification of peripheral SCAR signal during macropinocytosis. A line was drawn through the edge of the macropinocytic cup and extending into the cytosol for each frame of a time lapse of the lifetime of a complete macropinocytosis event. Line plots were concatenated resulting in kymographs as shown in panel (D). Orange dotted line indicates the closure event. Numbers indicate independent macropinocytosis events. (E) The SCAR signal at the edge of macropinocytic cups is present from start to finish. The fluorescence intensity at the macropinocytic cup edge was quantified and averaged for all six analysed macropinocytic cups. Vegetative Ax2 cells expressing the SCAR complex reporter HSPC300-GFP and the PI(3,4,5)P3 reporter PH-CRAC-mRFP were used in all experiments. Images are representative of typical macropinocytosis events.
Figure 5 with 1 supplement
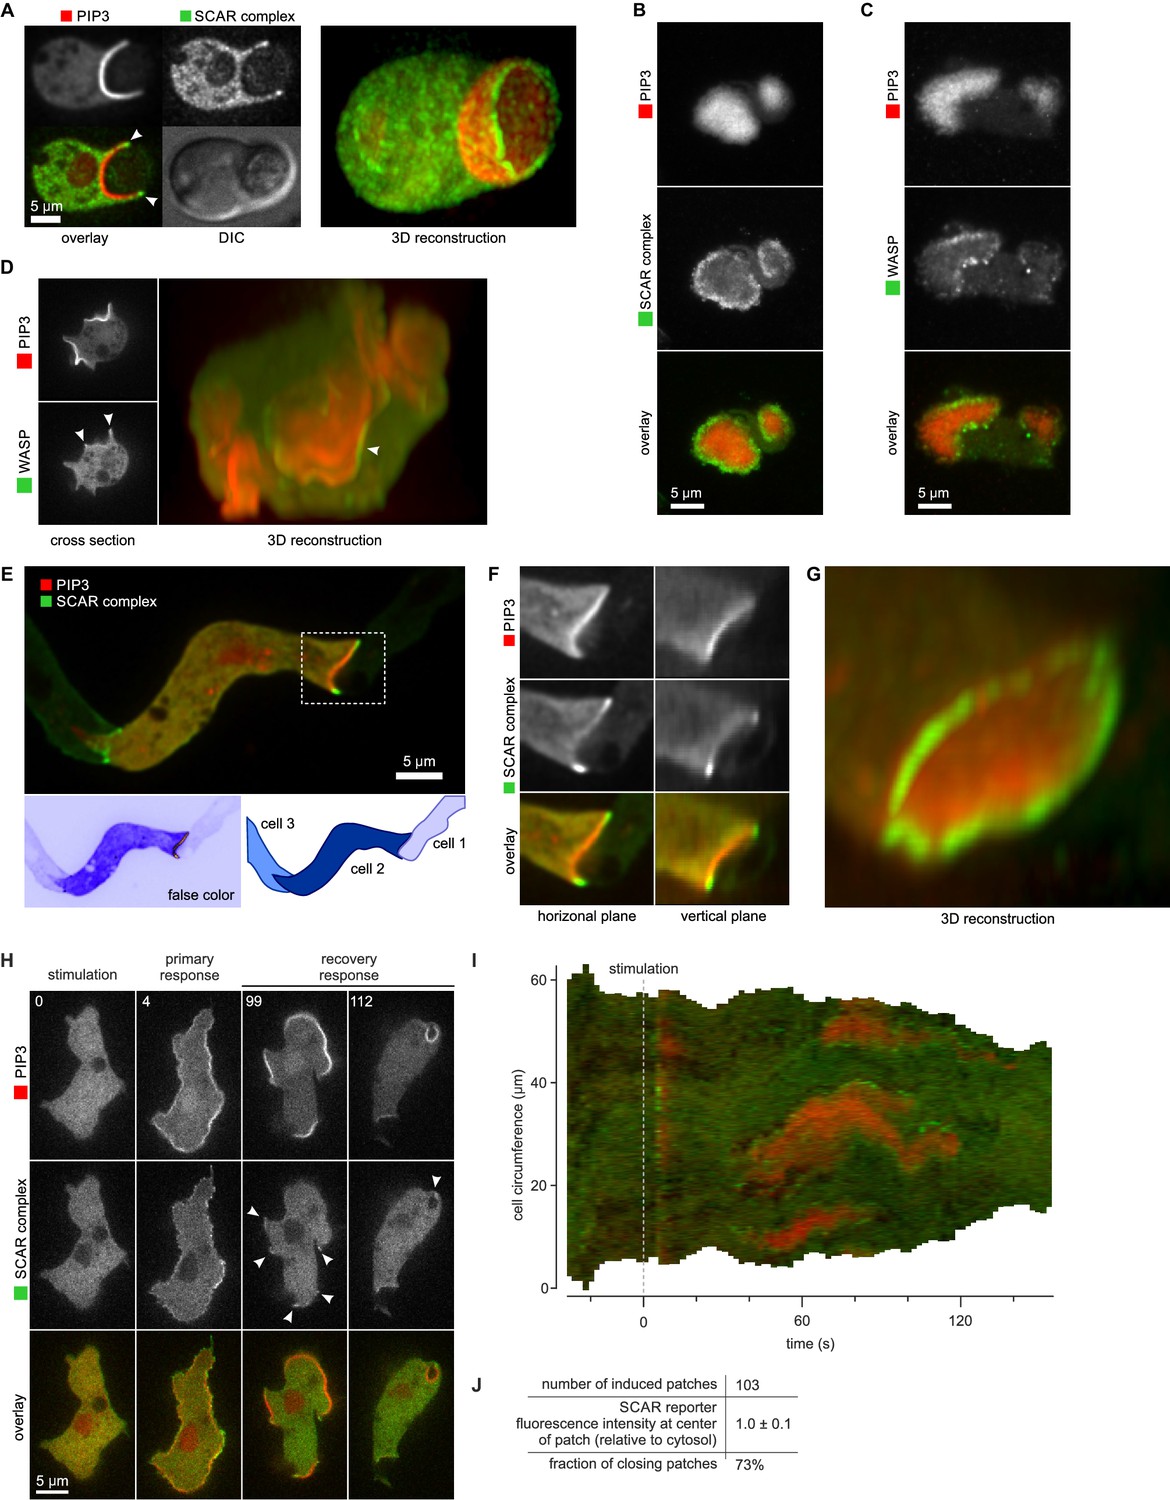
SCAR is recruited to the periphery of PIP3 patches, however they are formed.
(A) Phagocytosis of a yeast cell. Arrows point to the narrow accumulation of SCAR at the rim of the phagocytic cup. A full 3D render of the same cell is displayed on the right. The yeast cell is not labelled and thus not visible in this image. (B) SCAR rings around basal actin waves visualised by TIRF microscopy. These waves consist of a patch of PIP3 surrounded by a zone of actin polymerisation. PIP3 patches are invariably surrounded by a ring of SCAR. (C) WASP is excluded from the PIP3 patches of basal waves and present as a ring around the patch, but less strongly than SCAR. (D) WASP is present at the edge of PIP3 patches in macropinocytic cups, albeit more faintly than SCAR. Confocal cross sections are shown on the left panels and a full 3D render of the same cell is shown on the right. White arrow indicates the faint rim of WASP around the PIP3 patch. (E–G) SCAR rings at cell-cell contacts. During chemotactic aggregation, streaming cells make head-to-tail attachments and form a domain of PIP3 in their anterior attachment, which is surrounded by a strong SCAR ring; (F) A close-up of the region indicated in the white box in (E); (G) A full 3D reconstruction of the same contact site. (H–J) Response to acute stimulation with the chemoattractant cyclic-AMP. Aggregation-competent cells (equivalent to about 5 hr of starvation) were uniformly stimulated with a saturating dose of cyclic-AMP (1 µM). They respond with a fast and spatially fairly uniform production of PIP3 at 4 s and later with a secondary response in which clear PIP3 patches are formed (panel H, t = 99s). SCAR is uniquely present at the edges of these patches (arrowed) as is most evident in the kymograph (I) and not at the centre (J).
Figure 5—figure supplement 1
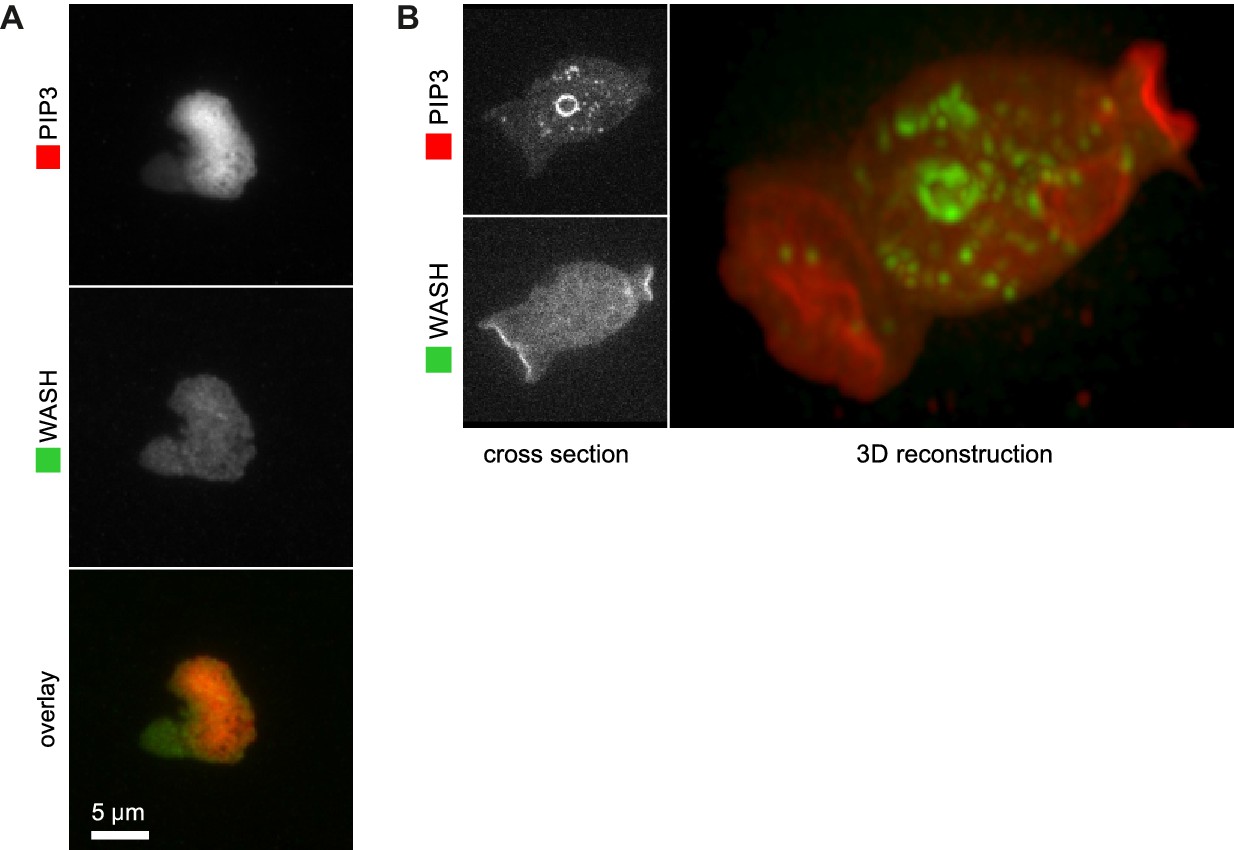
WASH is not recruited to PIP3 patches.
(A) WASH is neither detected at the center nor at the edge of TIRF images of basal PIP3 patches. (B) WASH is present on internal vesicles and not on macropinocytic cups in vegetative cells. A confocal cross section is shown in the left panel and a full 3D render of the same cell is shown on the right.
Figure 6
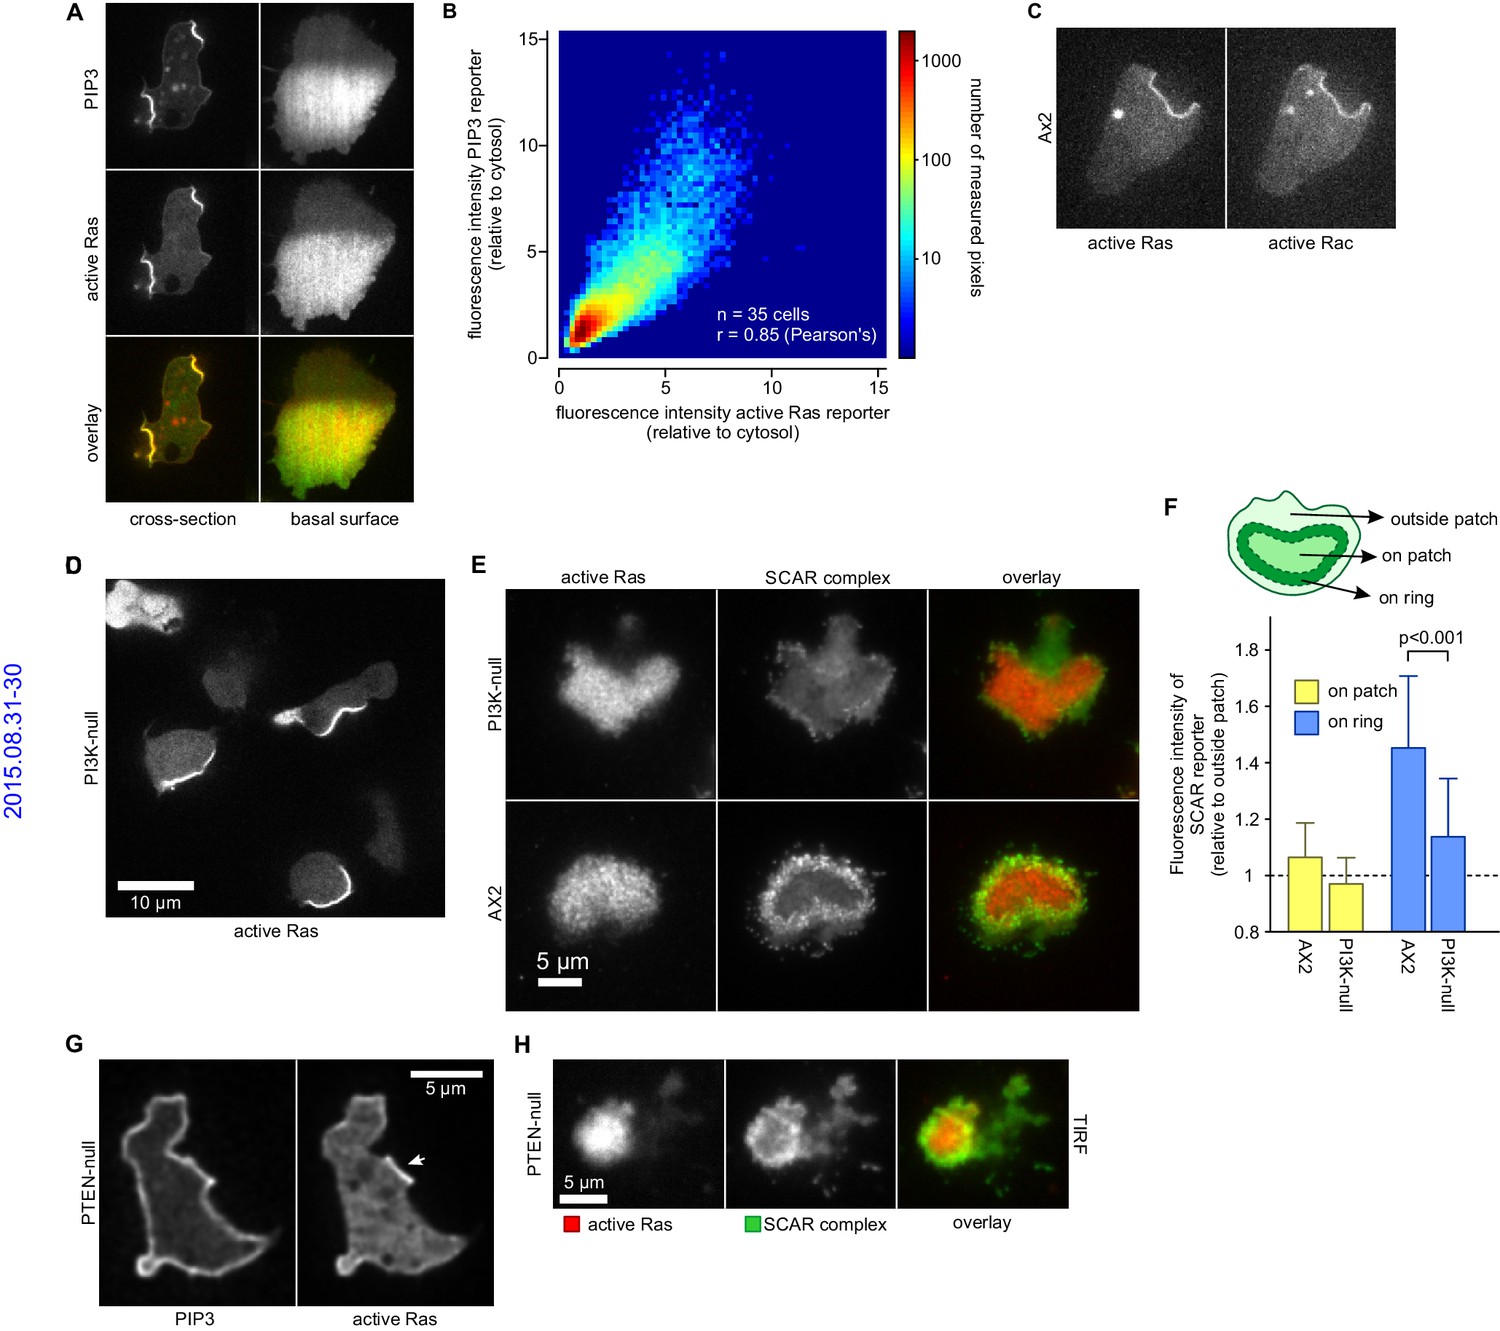
PIP3 patches are supported by coincident patches of activated Ras, which can recruit weaker SCAR rings.
(A, B) PIP3 and activated Ras domains are essentially coincident in vegetative Ax2 cells: (A) dorsal patches (macropinocytic cups) and basal patches. Left and right panels show different cells; (B) 2-D histogram showing strong correlation between PIP3 and activated Ras reporters. Fluorescence intensity values of the active Ras reporter and PIP3 reporter along the perimeter of 35 cells are plotted against each other. (C) Macropinocytic signal patches additionally coincide with patches of active Rac. Shown is a representative image of a macropinocytic cup in a vegetative Ax2 cell co-expressing a marker for active Ras (Raf1-RBD) and active Rac (pakB-CRIB). (D, E) mutant lacking all Ras-activated PI3-kinases (strain HM1200) still forms Ras patches, both off the substratum (D) and basally- see (E). (E, F) Basal patches of the PI3-kinase mutant recruit SCAR to their periphery, though less strongly than the wild-type, Ax2 (TIRF images). Error bars indicate the standard deviation. Thus, loss of PI3K signalling does not allow SCAR to trespass on the Ras patch. (G, H) Ras patches (indicated by white arrow) remain discrete, despite globally high levels of PIP3 in PTEN-null cells (strain HM1289) and these domains still invariably recruit a complete SCAR ring to their edges.
Figure 7 with 1 supplement
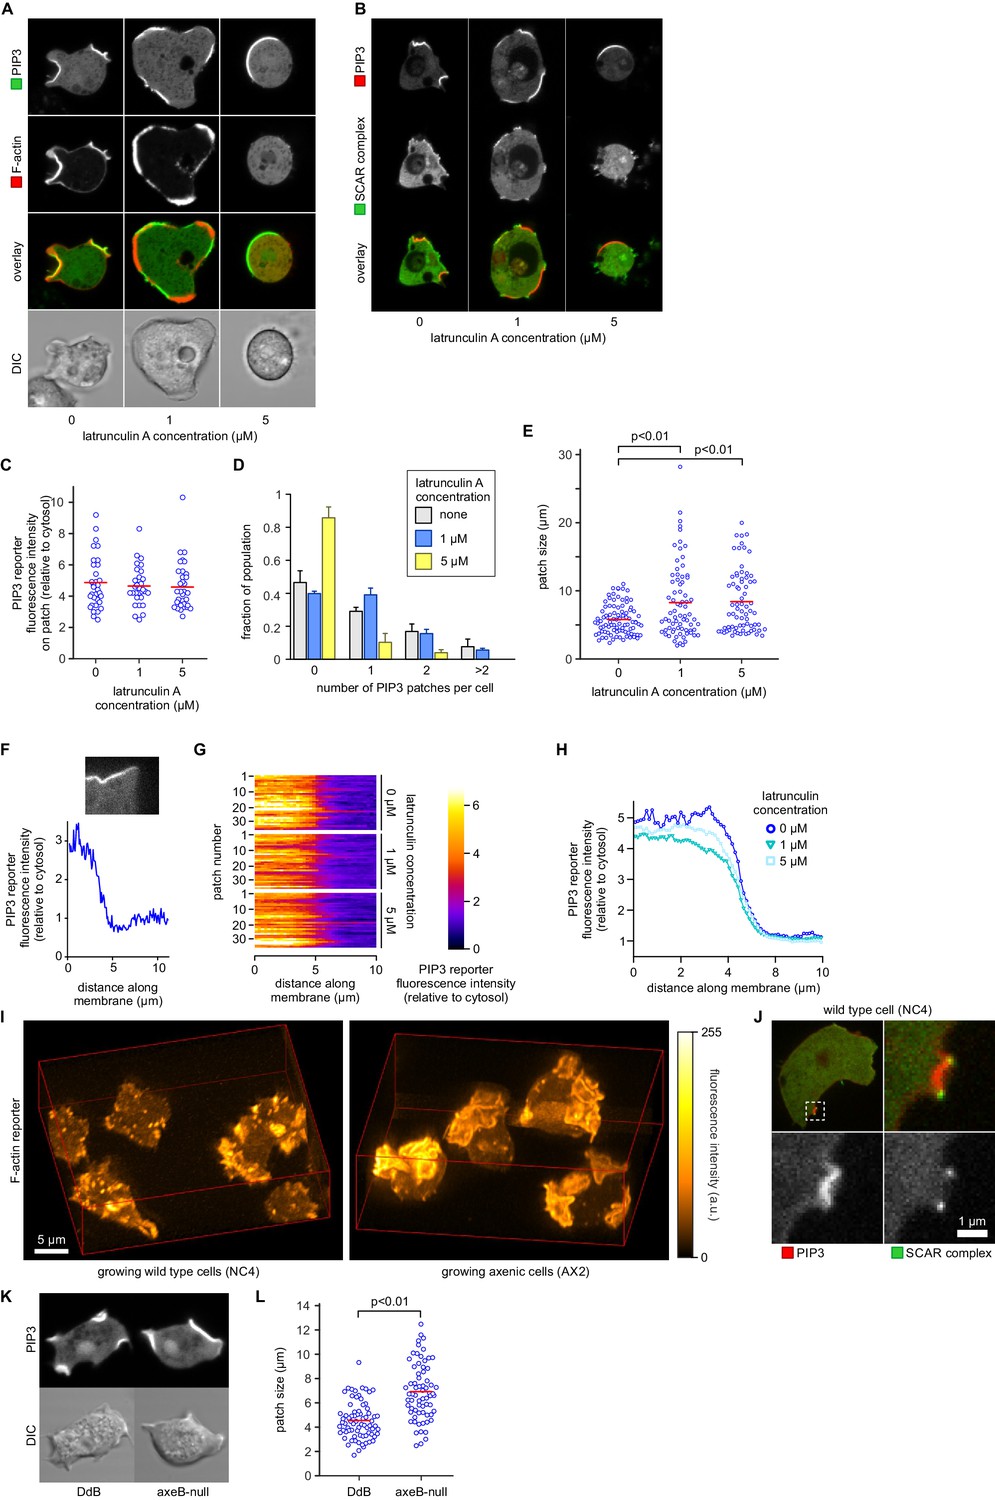
PIP3 patch formation does not require an encircling actin ruffle, but patch size is regulated by Ras activity.
(A) The actin cytoskeleton is depolymerized by treatment with latrunculin-A and ruffles suppressed. Vegetative cells expressing an F-actin marker (Lifeact) and a PIP3 marker (PH-CRAC) were treated for 15 min with the indicated amounts of latrunculin-A. The F-actin marker is undetectable in the cortex when treated with 5 μM latrunculin-A. (B) PIP3 patches remain after ruffles are suppressed by depolymerisation of the actin cytoskeleton. SCAR remains associated with the patch edge under 1 μM latrunculin-A, but is lost when treated with 5 μM latrunculin-A. (C–E) Ruffles are not essential for PIP3 patch formation. Treatment with latrunculin-A does not significantly change PIP3 patch intensity, but leads to an increase in size and a decrease in number. (F–H) Patch boundaries are sharply defined and this does not depend on an enclosing ruffle. (F) Membrane fluorescence intensity across the edge of PIP3 patches was measured (G) Measured intensity profiles along the edge of 36 patches of both treated and untreated cells, with each line representing a single patch. (H) Mean fluorescence intensity of the PIP3 reporter along the patch edges of treated and untreated cells, obtained by averaging the profiles in the previous panel. (I) Macropinocytic cups in vegetative cells of wild-type cells are smaller than those of axenic strains. Shown is a maximum intensity projection of the F-actin reporter LimEΔcoil of a field of vegetative cells, recorded using lattice light sheet microscopy. (J) SCAR is still recruited to the edges of the PIP3 patch of the small macropinocytic cups of wild-type cells. (K–L) Increased Ras activity leads to larger PIP3 patches and macropinocytic cups. Ras activity was increased by knock-out of the RasGAP, NF1 (axeB is the gene encoding NF1). Parental DdB and knock-out cells were cultivated for 48 hr in axenic medium to maximally up-regulate macropinocytosis. (K) Confocal image of macropinocytic patches in wild-type DdB and axeB null cells; (L) Quantification of the patch size in both cell types. Loss of NF1 leads to a significant increase in macropinocytic patch size.
Figure 7—figure supplement 1
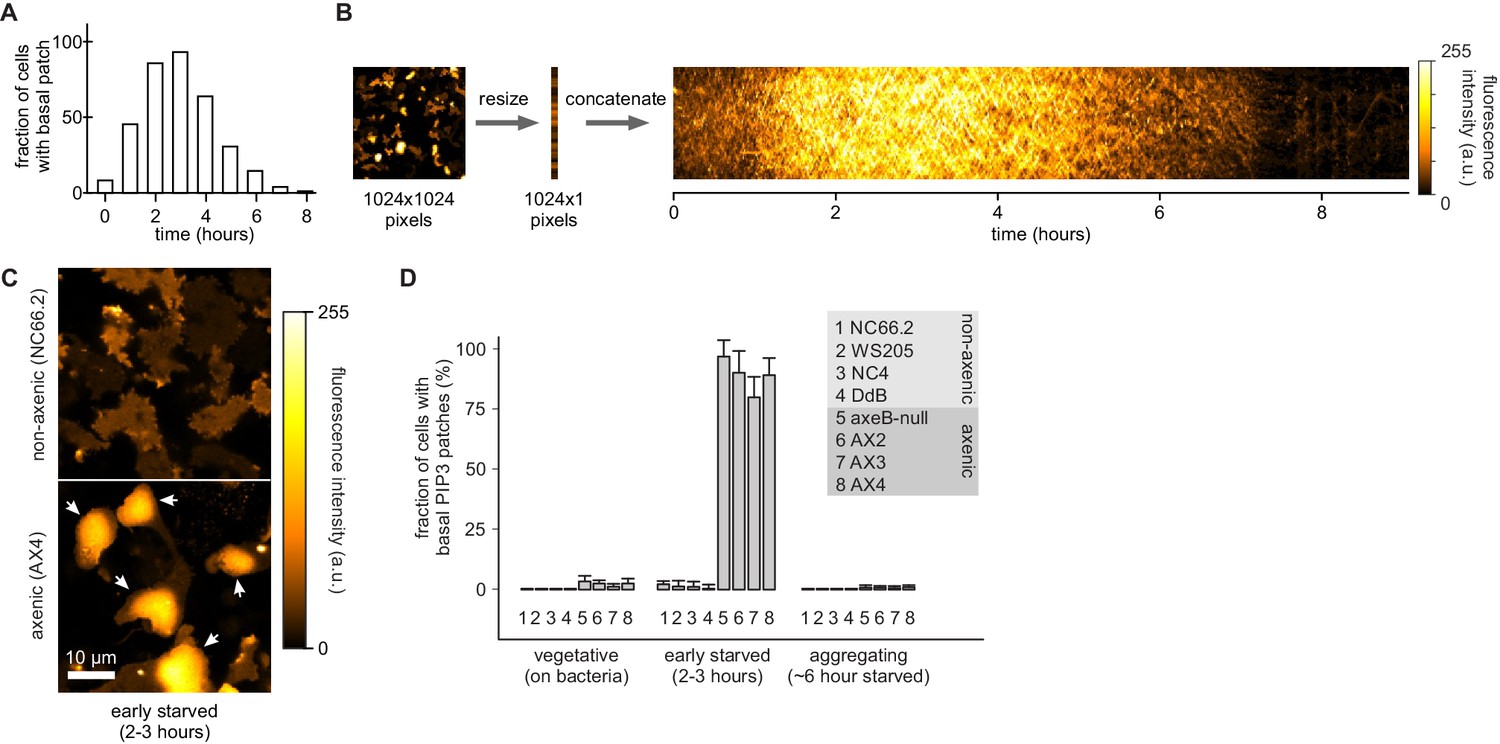
Basal PIP3 patches (actin waves) are absent from wild-type cells.
(A–B) Basal PIP3 patches become prevalent during early development of Ax2 cells. (A) Ax2 cells expressing a PIP3 marker were washed free of growth medium and allowed to develop autonomously in KK2. Their basal surface was imaged using confocal microscopy and the fraction of cells with basal patches was determined at specified intervals. (B) Visualisation of basal patch abundance during development. A time-lapse image of the basal surface of developing Ax2 cells expressing a PIP3 marker was resized to a width of one pixel and all frames were concatenated to yield a pseudo-kymograph. PIP3 fluorescence intensity at the basal membrane is maximal around 3 hr after starvation. (C–D) Basal PIP3 patches are caused by the specific loss of the RasGAP NF1. (C) Confocal image of the basal surface of a group of early starved wild-type NC66.2 cells and axenic Ax4 cells expressing a PIP3 marker. Arrows point to PIP3 patches. (D) Quantification of the number of basal PIP3 patches of indicated strains during vegetative growth, early starvation and aggregation. Error bars indicate the standard deviation.
Videos
Video 1
Macropinosomes are generated by splitting.
A vegetative Ax2 cell expressing an F-actin marker imaged using lattice light sheet microscopy and viewed from three perpendicular angles.
Video 2
Macropinocytic cups are generated by splitting.
Detail of a vegetative Ax2 cell expressing markers for active Rac and F-actin, imaged using lattice light sheet microscopy and viewed from three perpendicular angles.
Video 3
Macropinocytic ruffles often initiate on the substratum.
A vegetative Ax2 cell expressing an F-actin marker imaged using lattice light sheet microscopy and viewed from three perpendicular angles.
Video 4
A small fraction of de novo macropinocytic cups are initiated off- substratum.
Detail of a vegetative Ax2 cell expressing markers for active Ras and F-actin, imaged using lattice light sheet microscopy and viewed from three perpendicular angles.
Video 5
Closure of a macropinocytic cup.
A vegetative Ax2 cell expressing an F-actin marker imaged using lattice light sheet microscopy and viewed from two perpendicular angles.
Video 6
Pseudopods are distinct from macropinocytic ruffles.
A vegetative Ax2 cell expressing an F-actin marker imaged using lattice light sheet microscopy and viewed from three perpendicular angles. A pseudopod is initiated on the right hand side of the cell at t = 1 min.
Video 7
Basal F-actin wave that originates by splitting from a nascent macropinosome.
A vegetative Ax2 cell expressing an F-actin marker imaged using lattice light sheet microscopy and viewed from three perpendicular angles. Image jitter in this movie was due to technical issues with the microscope's Z-drive).
Video 8
The rim of macropinocytic cups is traced by a thin line of SCAR.
Shown is a vegetative Ax2 cell expressing the SCAR marker HSPC300. A Z-stack was collected using a spinning disk microscope and deconvolved using a calculated point spread function. Left panel shows a surface render of the cell outline and the right panel shows a 3D reconstruction of the fluorescence signal using maximum intensity projection.
Video 9
Macropinocytic cups are defined by a patch of PIP3 that is circumscribed by a thin line of SCAR.
Shown is a vegetative Ax2 cell expressing the SCAR marker HSPC300-GFP and the PIP3 marker PH-CRAC-RFP. A Z-stack was collected using a spinning disk microscope and deconvolved using a calculated point spread function. Image shown is a 3D reconstruction of the fluorescence signal using maximum intensity projection.
Video 10
SCAR remains dynamically associated to the edge of PIP3 patches throughout macropinocytosis.
Vegetative Ax2 cell expressing the SCAR marker HSPC300-GFP and the PIP3 marker PH-CRAC-RFP. Images were taken on a spinning disk microscope.
Video 11
Chemoattractant-stimulated PIP3 patches recruit SCAR to their edges, not to their centres.
A developed Ax2 cell expressing the PIP3 marker PH-CRAC-RFP and the SCAR marker HSPC300-GFP was stimulated at t = 0 with 1 μm cyclic AMP. Images were collected using a spinning disk microscope.
Video 12
Large circular ruffles are absent in vegetative wild-type NC4 cells.
Shown is a maximum intensity projection of the fluorescence intensity of the F-actin marker LimEΔcoil. Images were taken on a lattice light sheet microscope.
Video 13
The morphology of vegetative cells from axenic strains is dominated by large circular ruffles.
Shown is a maximum intensity projection of the fluorescence intensity of the F-actin marker LimEΔcoil (Jitter in this movie was due to technical issues with the microscope's Z-drive). Images were taken on a lattice light sheet microscope.
Video 14
SCAR follows PIP3 patches in macropinocytic cups of wild-type NC4 cells.
Detail of a vegetative cell from the wild strain NC4 expressing a marker for PIP3 and a marker for the SCAR complex. Macropinocytosis is rapid and small but the cups still show SCAR puncta on their edges. Images were taken on a spinning disk microscope. It should be noted that due to the small size of the macropinocytic cups, the top and bottom of the cup are frequently in the focal plane, resulting in an overlap in both signals.
Video 15
Basal patches are dominant in axenic cells during early starvation.
Cells from the axenic strain Ax2 were washed free of nutrients and left to develop autonomously under non-nutrient buffer. Time-lapse images were taken using a confocal microscope. Z-plane was set so that the basal membrane of the cell was in focus. Shown is an overlay of the fluorescence signal of a PIP3 marker with the trans-illuminated image.
Video 16
Basal patches are absent from non-axenic wild type cells.
Cells of the wild-type strain NC4 were washed free of nutrients and left to develop autonomously under non-nutrient buffer. Time-lapse images were taken using a confocal microscope. Z-plane was set so that the basal membrane of the cell was in focus. Shown is an overlay of the fluorescence signal of a PIP3 marker with the trans-illuminated image.
Tables
Table 1
Growth and fluid uptake by mutants.
Strain | Mutated protein | Genotype | MGT±SEM (hr) | Fluid uptake ± SEM (nl/10^six cells/h) |
|---|---|---|---|---|
Ax2 | parental | 9.26 ± 0.26 (26) | 114.7 ± 10.8 (9) | |
HM1505 | RasC | rasC- | 9.27 ± 0.26 (7) | 84.3 ± 6.3 (3) |
HM1497 | RasG | rasG- | 27.6 ± 2.9 (7) | 55.3 ± 8.4 (3) |
HM1514 | RasG | rasG- | 19.1 ± 0.24 (3) | 67.6 ± 1.9 (3) |
HM1200 | PI3K1-5 | pikA-, pikB-, pikC-, pikF-, pikG- | 103 ± 1.1 (3)* | 9.0 ± 0.6 (3) |
HM1289 | PTEN | ptenA- | 19.0 ± 1.4 (9) | 12.4 ± 0.6 (3) |
HM1809 | SCAR | scrA- | 27.8 ± 2.4 (6) | 56.8 ± 9.7 (3) |
HM1818 | SCAR | scrA- | 38.4 ± 4.6 (10) | 19.7 ± 5.0 (3) |
-
* taken from Hoeller et al. (2013).
Additional files
-
Supplementary file 1
Manual for the track_membrane MATLAB script.
- https://doi.org/10.7554/eLife.20085.029
-
Source code 1
Track membrane MATLAB script.
- https://doi.org/10.7554/eLife.20085.030
Download links
A two-part list of links to download the article, or parts of the article, in various formats.
Downloads (link to download the article as PDF)
Open citations (links to open the citations from this article in various online reference manager services)
Cite this article (links to download the citations from this article in formats compatible with various reference manager tools)
A plasma membrane template for macropinocytic cups
eLife 5:e20085.
https://doi.org/10.7554/eLife.20085


